Systematic Review

Impact of Agrivoltaic System Design on Productivity and Sustainability: A Systematic Review and Bibliometric Analysis


by
Carlos Fernando Luna-Carlosama
1,2,* and
Francy Nelly Jiménez-García
3,4
1
Grupo de Investigación en Ingeniería Mecánica y Mecatrónica, Facultad de Ingeniería Mecánica, Universidad Santo Tomás, Villavicencio 500003, Colombia
2
Grupo de Investigación en Recursos Naturales Amazónicos, Institución Universitaria del Putumayo, Colón 861020, Colombia
3
Grupo de Investigación Aplicaciones y Enseñanza de las Ciencias Exactas y Naturales, Facultad de Ciencias Exactas y Naturales, Universidad Nacional de Colombia, Manizales 17003, Colombia
4
Grupo de Investigación Física y Matemáticas con Énfasis en la Formación de Ingenieros, Universidad Autónoma de Manizales, Manizales 17003, Colombia
*
Author to whom correspondence should be addressed.
World 2026, 7(5), 71; https://doi.org/10.3390/world7050071
Submission received: 11 February 2026 / Revised: 4 April 2026 / Accepted: 8 April 2026 / Published: 30 April 2026
(This article belongs to the Section Climate Transitions and Ecological Solutions)

Abstract

The increasing competition for land between agriculture and electricity generation has driven the implementation agrivoltaic systems (AVSs) as a strategy aligned with Sustainable Development Goals 7 and 13. This study systematically analyzes how AVS design influences agricultural yield (AY), energy yield (EY), and overall sustainability. A systematic review was conducted following the PRISMA protocol, complemented by bibliometric analysis and an exploratory correlation analysis of design variables, productivity indicators, and environmental and economic metrics. From an initial set of 243 records, 79 studies published between 2018 and 2025 were included. The results identify general trends across heterogeneous studies, although these patterns should not be interpreted as universally applicable. Intermediate ground cover ratios (GCRs) (≈30–40%) are commonly associated with favorable trade-offs between AY and EY, often resulting in land equivalent ratios above 1.5 under specific conditions. Reported outcomes indicate that AVS can achieve increases in EY, improvements in water-use efficiency, reductions in CO2 emissions, and competitive economic performance, although these results vary depending on crop type, climate, system configuration, and PV technology. Overall, the analysis highlights GCR as a key design parameter and underscores that AVS performance depends on multivariable and context-specific design rather than universally applicable thresholds, reinforcing its potential as a sustainable agri-energy solution.

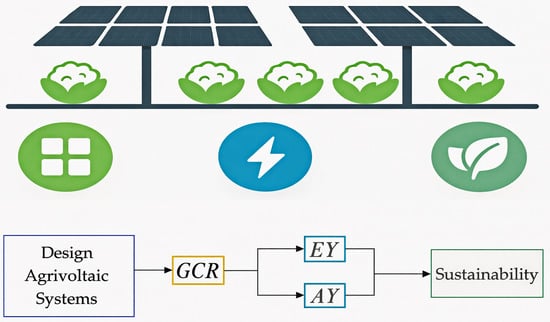
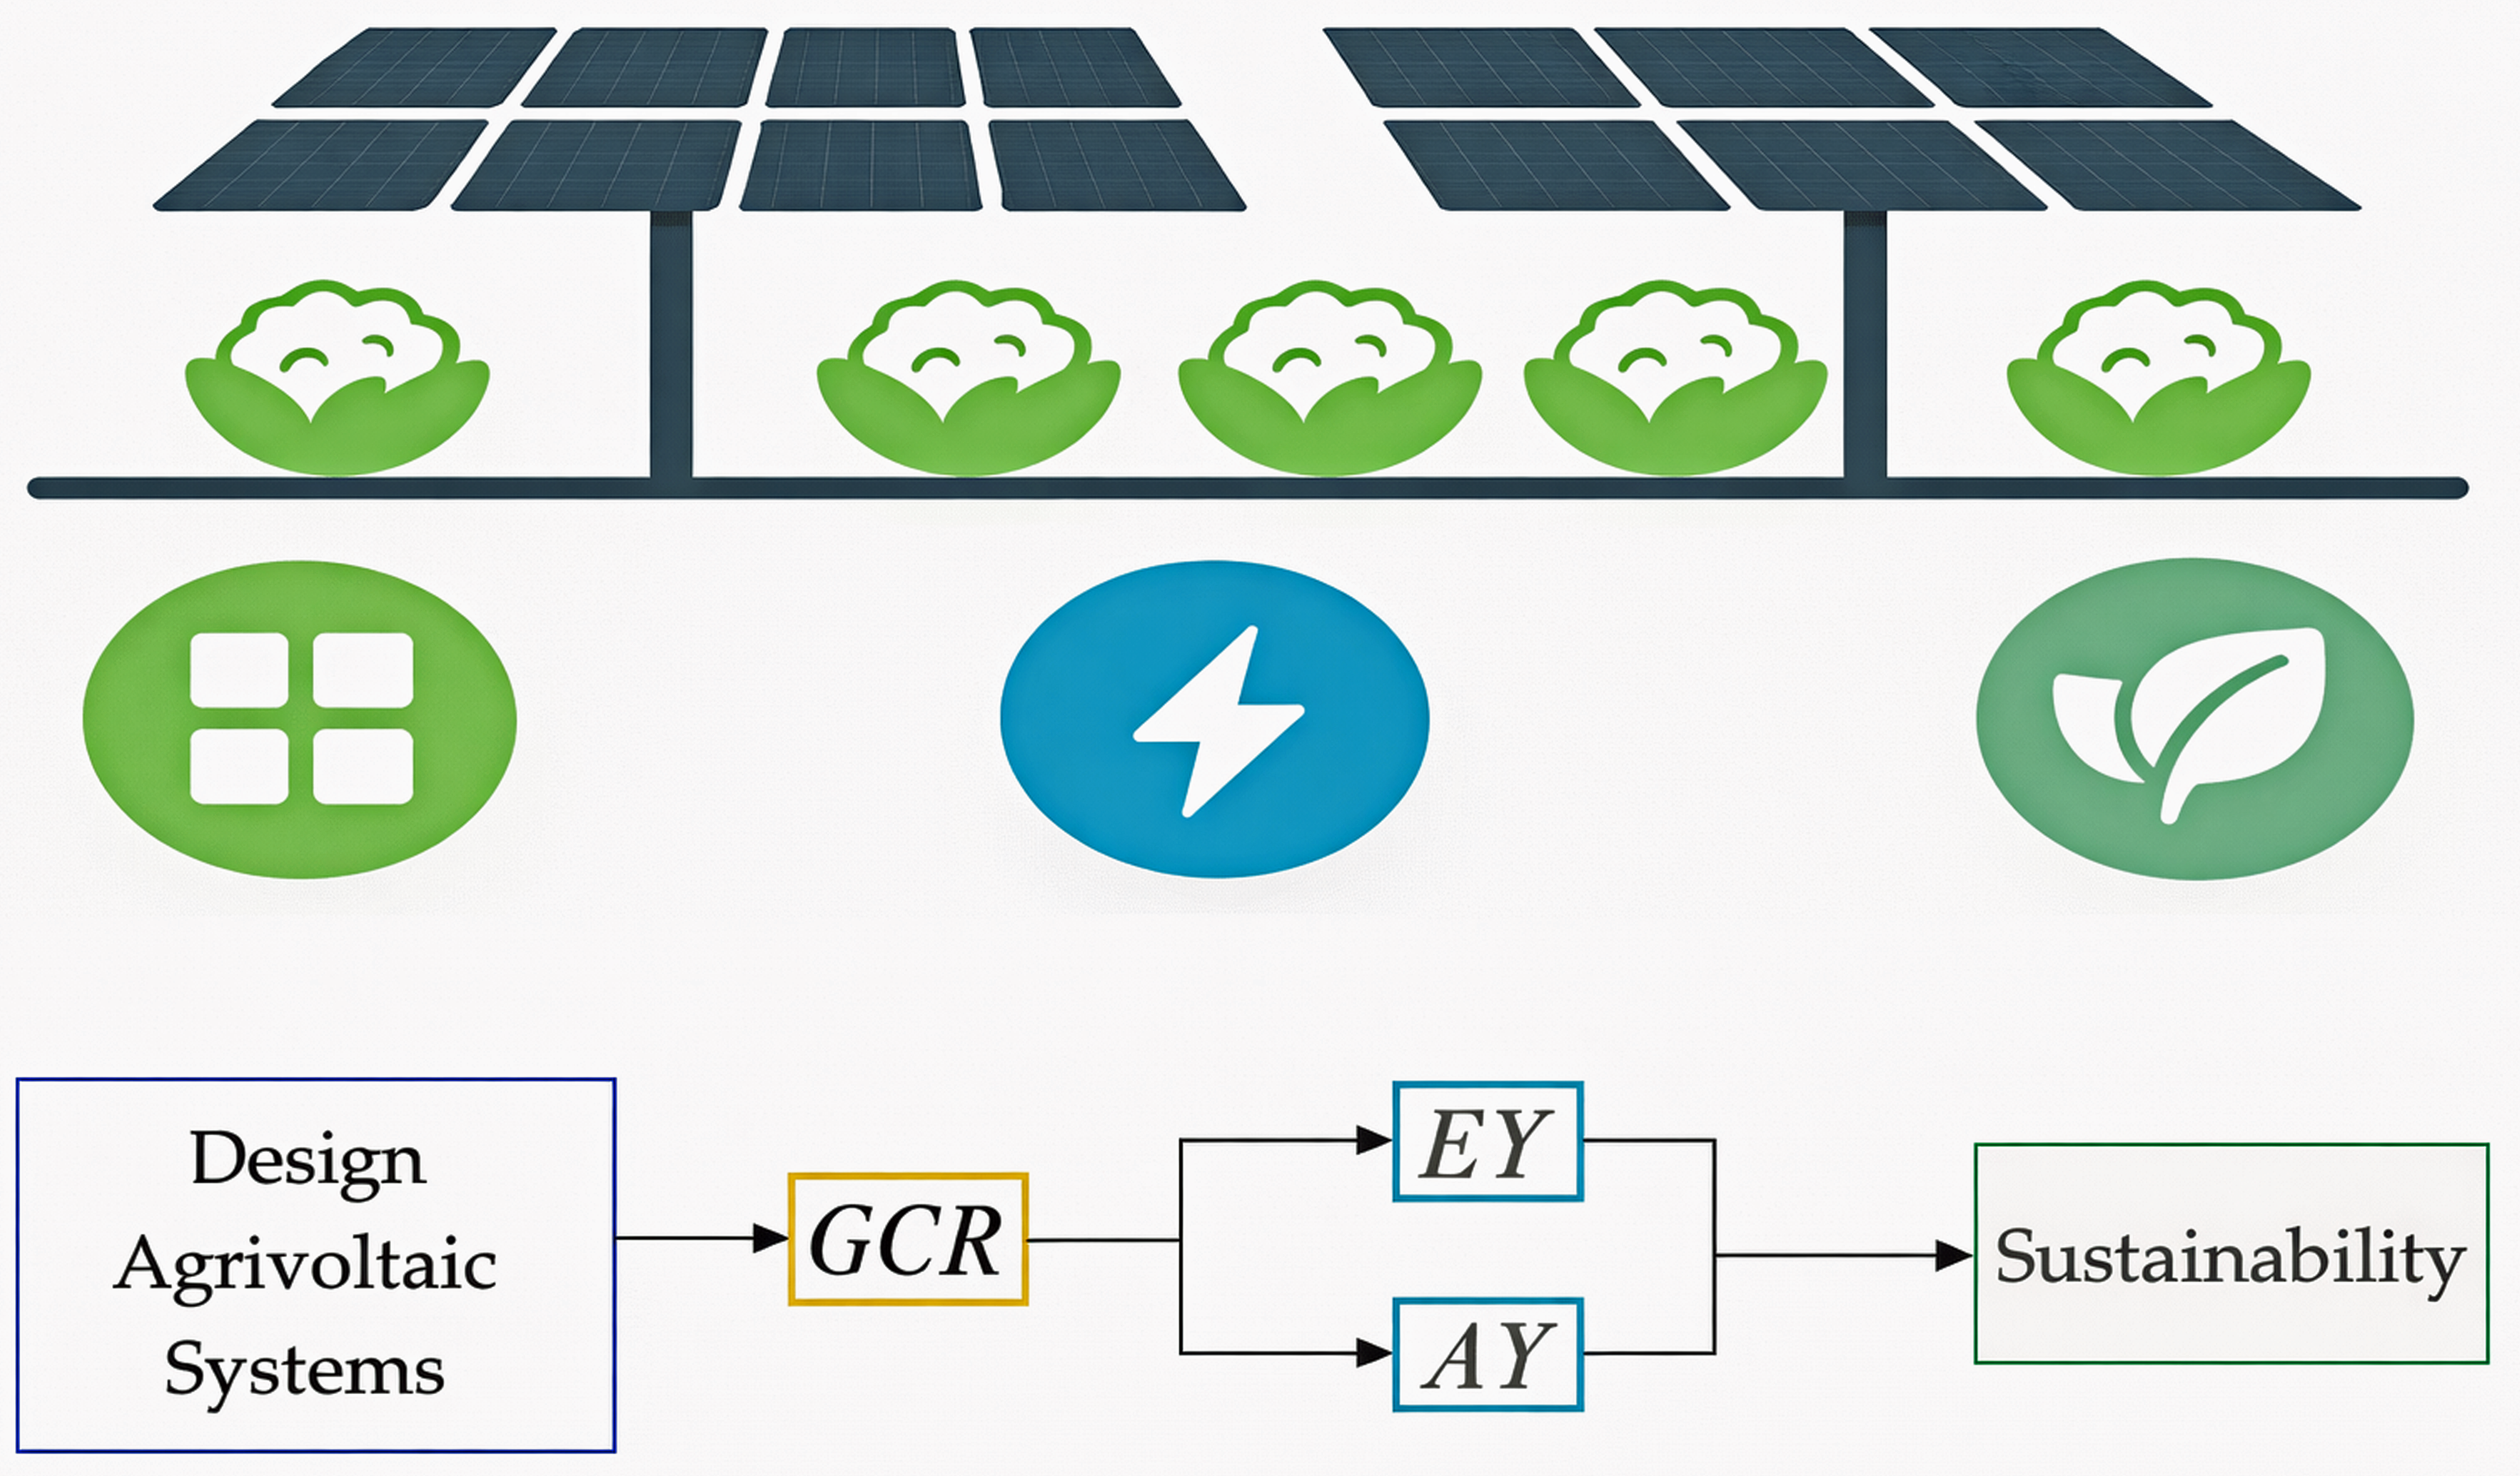
Graphical Abstract

1. Introduction

Agrivoltaic systems (AVSs) have emerged as a recent strategy to simultaneously address the growing demand for food, energy security, and environmental sustainability. In the context of limited available agricultural land, these systems enable dual land use by combining crop production with photovoltaic (PV) electricity generation on the same surface. This integration contributes to reducing emissions associated with climate change and supports the achievement of the Sustainable Development Goals (2, 7, and 13) [1,2,3].
Since the first conceptual proposals in the 1980s [4] and their scientific consolidation beginning in 2011 [5], research on AVSs has accelerated in several countries, including Germany [6,7,8,9], France [5,10,11] and Japan [12,13]. However, significant limitations persist: studies often address design aspects [14,15,16], agronomic effects [17,18,19], or sustainability dimensions in isolation [1,20,21,22] without integrating them into a comprehensive framework capable of identifying causal relationships and common patterns. Moreover, methodological diversity across studies hampers systematic comparison of results and limits their applicability under different agroclimatic conditions.
From a technical standpoint, there is high variability in design parameters such as PV module height, inter-row spacing, orientation or azimuth angle, tilt angle, PV technology, and solar tracking, which hinders standardization and replicability. From an agronomic perspective, controlled shading has been reported to provide benefits but also adversely affect crops sensitive to photosynthetically active radiation (PAR). Therefore, system design must be tailored to the crop and local climate [5,11,23,24]. The lack of consensus on design methodologies and the scarcity of models integrating energy yield (EY), agricultural yield (AY), and sustainability criteria constrain the global adoption of AVSs.
In view of the dispersion and heterogeneity present in the literature, there is a clear need for a systematic review that consolidates and compares design methodologies, agricultural and energy indicators, and sustainability criteria applied in AVSs. The primary objective of this study is to analyze how design decisions influence agricultural yield (AY), energy yield (EY), and overall sustainability. This study followed the PRISMA (Preferred Reporting Items for Systematic Reviews and Meta-Analyses) protocol [25], supported by a bibliometric analysis to systematically examine the relationships among ground cover ratio (GCR), land equivalent ratio (LER), EY, AY, water savings, CO2 mitigation, levelized cost of energy (LCOE), internal rate of return (IRR), and social acceptance. It is important to note that, consistent with the systematic review approach, the analysis is based exclusively on secondary data reported in the selected studies. Therefore, the evaluated indicators reflect the metrics available in the literature, which are inherently heterogeneous and context-dependent, limiting the inclusion of additional sustainability or economic metrics not originally reported.
This study advances the existing literature by providing a design-oriented and multi-dimensional synthesis of AVS. Specifically, it integrates (i) a structured analysis of key design parameters; (ii) a joint evaluation of agricultural; energy; and sustainability indicators; (iii) a bibliometric assessment of research trends; and (iv) an exploratory correlation analysis to identify relationships among variables. This integrative approach enables the identification of consistent patterns across heterogeneous studies and supports more informed, context-specific AVS design.
The following sections present the methodology followed by the bibliometric analysis, evidence synthesis, and correlation results and discuss their implications for AVS design and sustainability.

2. Materials and Methods

A systematic review was conducted following the PRISMA 2020 guidelines [25], complemented by a bibliometric analysis using VOSviewer 1.6.2 and an exploratory analysis aimed at identifying correlations among key variables.

2.1. Research Questions

The review process was structured around three central research questions:
  • Which factors determine the magnitude of the impact of AVSs on AY and EY?
  • How can the design methodologies implemented in AVSs be adapted to maximize both EY and AY?
  • How has the sustainability of AVSs been evaluated in terms of economic viability, environmental benefits, and social acceptance?

2.2. Eligibility Criteria

Document selection was carried out using eligibility criteria defined a priori and applied consistently across the title, abstract, and full-text screening stages. Only documents published in English were included, provided that their title and/or abstract explicitly mentioned AVSs and contributed to the objective of the review.
Studies were required to demonstrate clear thematic relevance to at least one of the following dimensions: AVS design parameters, agricultural yield, energy yield or sustainability indicators. Documents published in other languages, lacking full-text availability, or presenting only marginal or indirect relevance to these dimensions were excluded.

2.3. Information Sources and Search Strategy

The literature review was conducted on 2 March 2025, using the Scopus, Dimensions, and Web of Science databases. A consistent search strategy was applied across all databases, using the same search equation and filters in titles, abstracts, and keywords, and restricting results to research articles and review papers.
The search equation combined the core term agrivoltaics with key thematic axes related to productivity, system design, and sustainability. The final search string was: (“agrivoltaic systems” OR “agrivoltaic*” OR “agrovoltaic*”) AND (“Energy Yield” OR “Agricultural Yield” OR “Agricultural Productivity” OR “Design Methodologies” OR “System Design” OR “Sustainability”).
The database-specific query formats are provided in a repository (https://doi.org/10.17632/7v3n8j4t3r.1, accessed on 11 February 2026).

2.4. Study Selection Process

Retrieved records were integrated and processed to identify and remove duplicates using the AteneaSires platform (Scientific Data Integration Platform), followed by additional verification using duplicate detection tools in Excel. The screening process was conducted independently by two reviewers and consisted of sequential filtering based on language, title and abstract screening relevance, full-text availability, and final eligibility assessment according to the criteria defined in Section 2.2. Discrepancies were resolved by consensus.
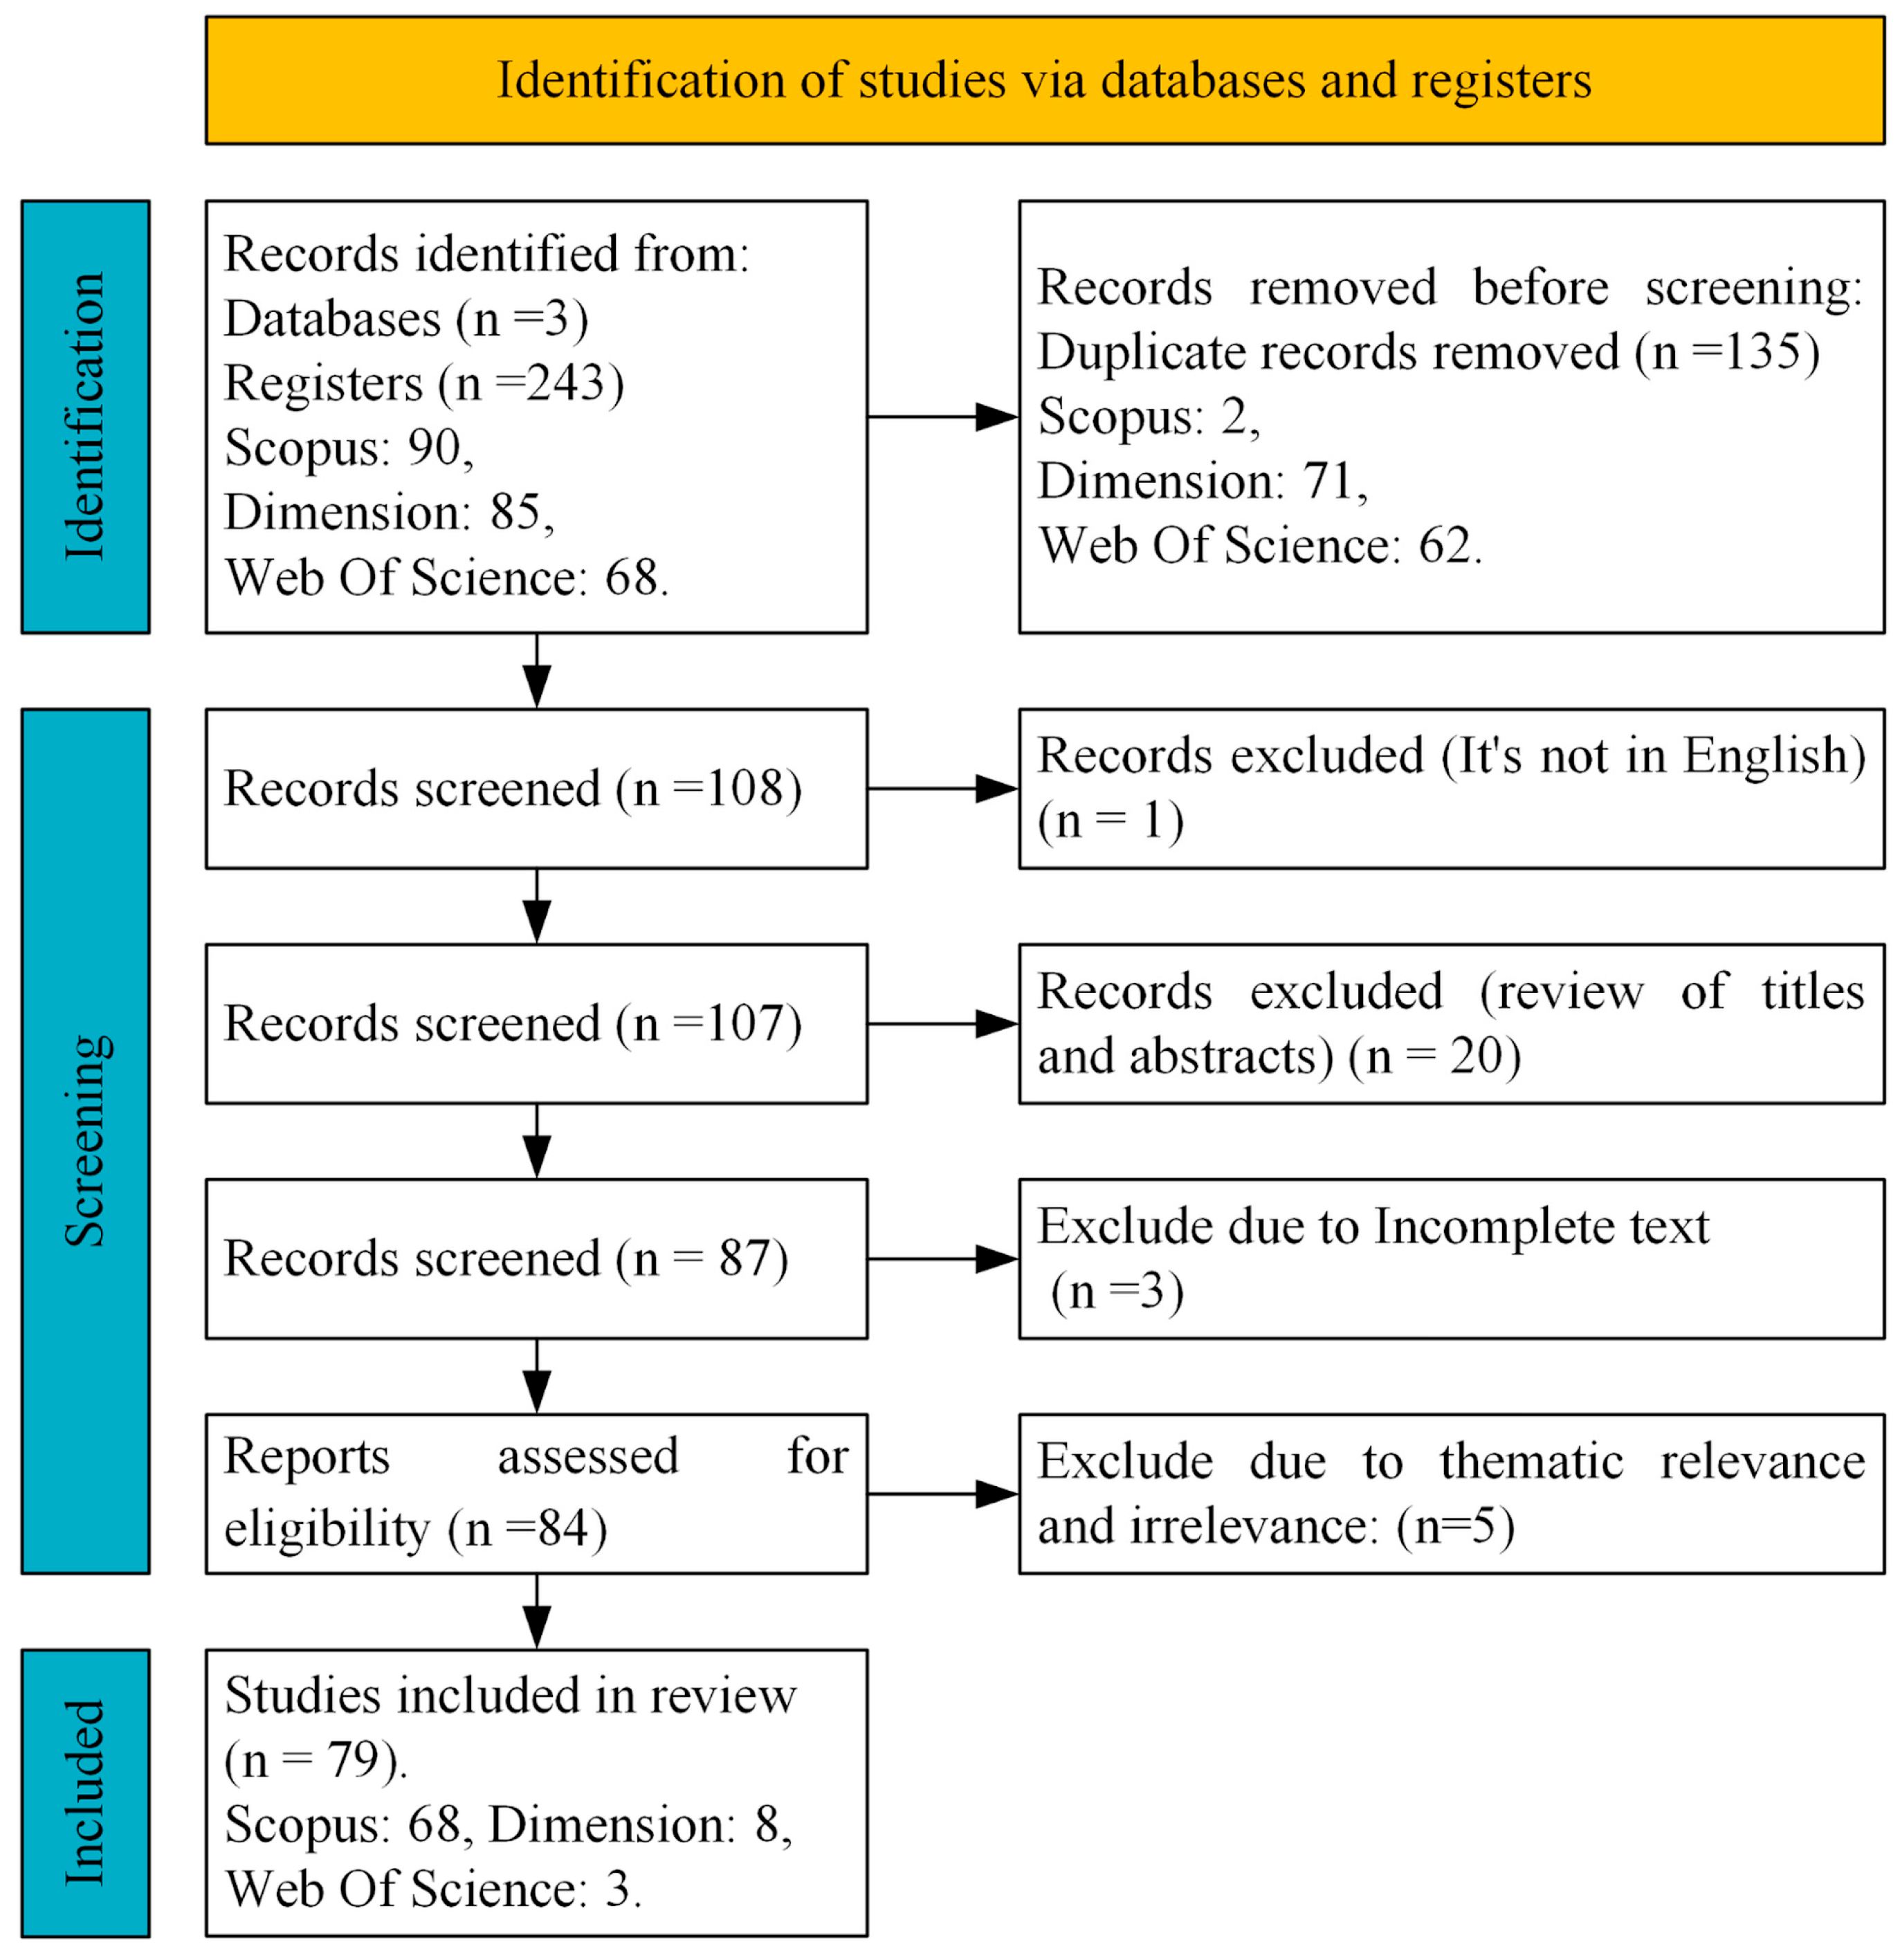
The complete study selection process is summarized in the PRISMA flow diagram (Figure 1). A total of 79 studies were included for subsequent analysis.

2.5. Data Collection Process

The data collection process consisted of extracting relevant variables from each included study using a standardized data extraction form, focusing specifically on the design, productivity, and sustainability dimensions of AVSs. Only existing data reported in the selected articles were collected; no additional data estimation or inference was performed. While other performance metrics may exist in the literature, the analysis was limited to those variables consistently reported in the reviewed studies. Any discrepancies between the authors were resolved by consensus.
Within the AVS design domain, the design methodologies applied were recorded, along with variables such as support structure type, inter-row spacing, module height, azimuth angle, tilt angle, the PV technology employed, and the GCR. Regarding productivity impacts, the evaluated crop, AY, EY, and LER were documented. For sustainability assessment, data were collected on water savings (WS), CO2 mitigation, LCOE, IRR, and social impact.
In addition, the methodological attributes of each study, such as study type (experimental, modeling, or simulation) and level of data completeness, were recorded to support a structured quality appraisal and to inform subsequent analyses. Prior to quantitative analysis, variables reported in different units or formats were harmonized and standardized to ensure comparability across studies.

2.6. Synthesis Methods

A bibliometric analysis was conducted using VOSviewer 1.6.2 to map co-authorship networks, source citation relationships, and keyword co-occurrence, thereby identifying research trends and thematic clusters. The evidence was integrated through a narrative synthesis structured around design-related variables and agroclimatic contexts, considering the methodological characteristics and data completeness of the included studies.
Additionally, an exploratory correlation analysis among quantitative variables was performed by estimating the Pearson correlation coefficient (r) and the associated p-value (α = 0.05), after verifying basic assumptions (linearity, normality, and homoscedasticity). The strength of the associations was interpreted using standard thresholds (very strong ≥ 0.70; moderate 0.50–0.69; weak 0.30–0.49; very weak < 0.30).
To reduce bias associated with heterogeneous reporting, only studies providing complete and consistent quantitative data and clearly defined methodologies were included in the correlation analysis. Missing data were handled through case-wise exclusion, meaning that only complete observations were considered for each variable pair. Consequently, the sample size varies across correlations depending on data availability. A formal meta-analysis was not conducted due to the heterogeneity of study designs and reported metrics; instead, results were visualized using heat maps and bivariate scatter plots.

2.7. Additional Review Considerations

The review protocol was defined a priori but was not registered on a public platform. Given the heterogeneity of the included studies, no standardized risk-of-bias assessment tool was applied. Instead, a structured quality appraisal was conducted based on study type, experimental setting, and completeness of reported variables.
This appraisal informed the interpretation of results by assigning greater analytical weight to studies with more comprehensive and consistent datasets, particularly in the exploratory correlation analysis. The limitations associated with heterogeneous methodologies and reporting practices were also considered in the discussion of results. To ensure transparency and reproducibility, the bibliographic data, complete search strategies, and data extraction matrices, including the dataset used for correlation analysis, are publicly available through the repository indicated above.

3. Results

3.1. Bibliometric Analysis and Characteristics of the Included Studies

3.1.1. Temporal Trends

Between 2018 and March 2025, a total of 79 studies were published, exhibiting sustained annual growth. Citations are largely concentrated in earlier publications, reflecting an age-related citation bias, whereby older studies have had more time to accumulate citations (see Table 1). Accordingly, citation metrics should be interpreted as indicators of visibility within the analyzed corpus rather than definitive measures of scientific impact. In particular, recent publications (especially those from 2024 and 2025) show low or zero citation counts due to their limited exposure time and should not be interpreted as less relevant within the field.

3.1.2. Co-Authorship Network Analysis by Country

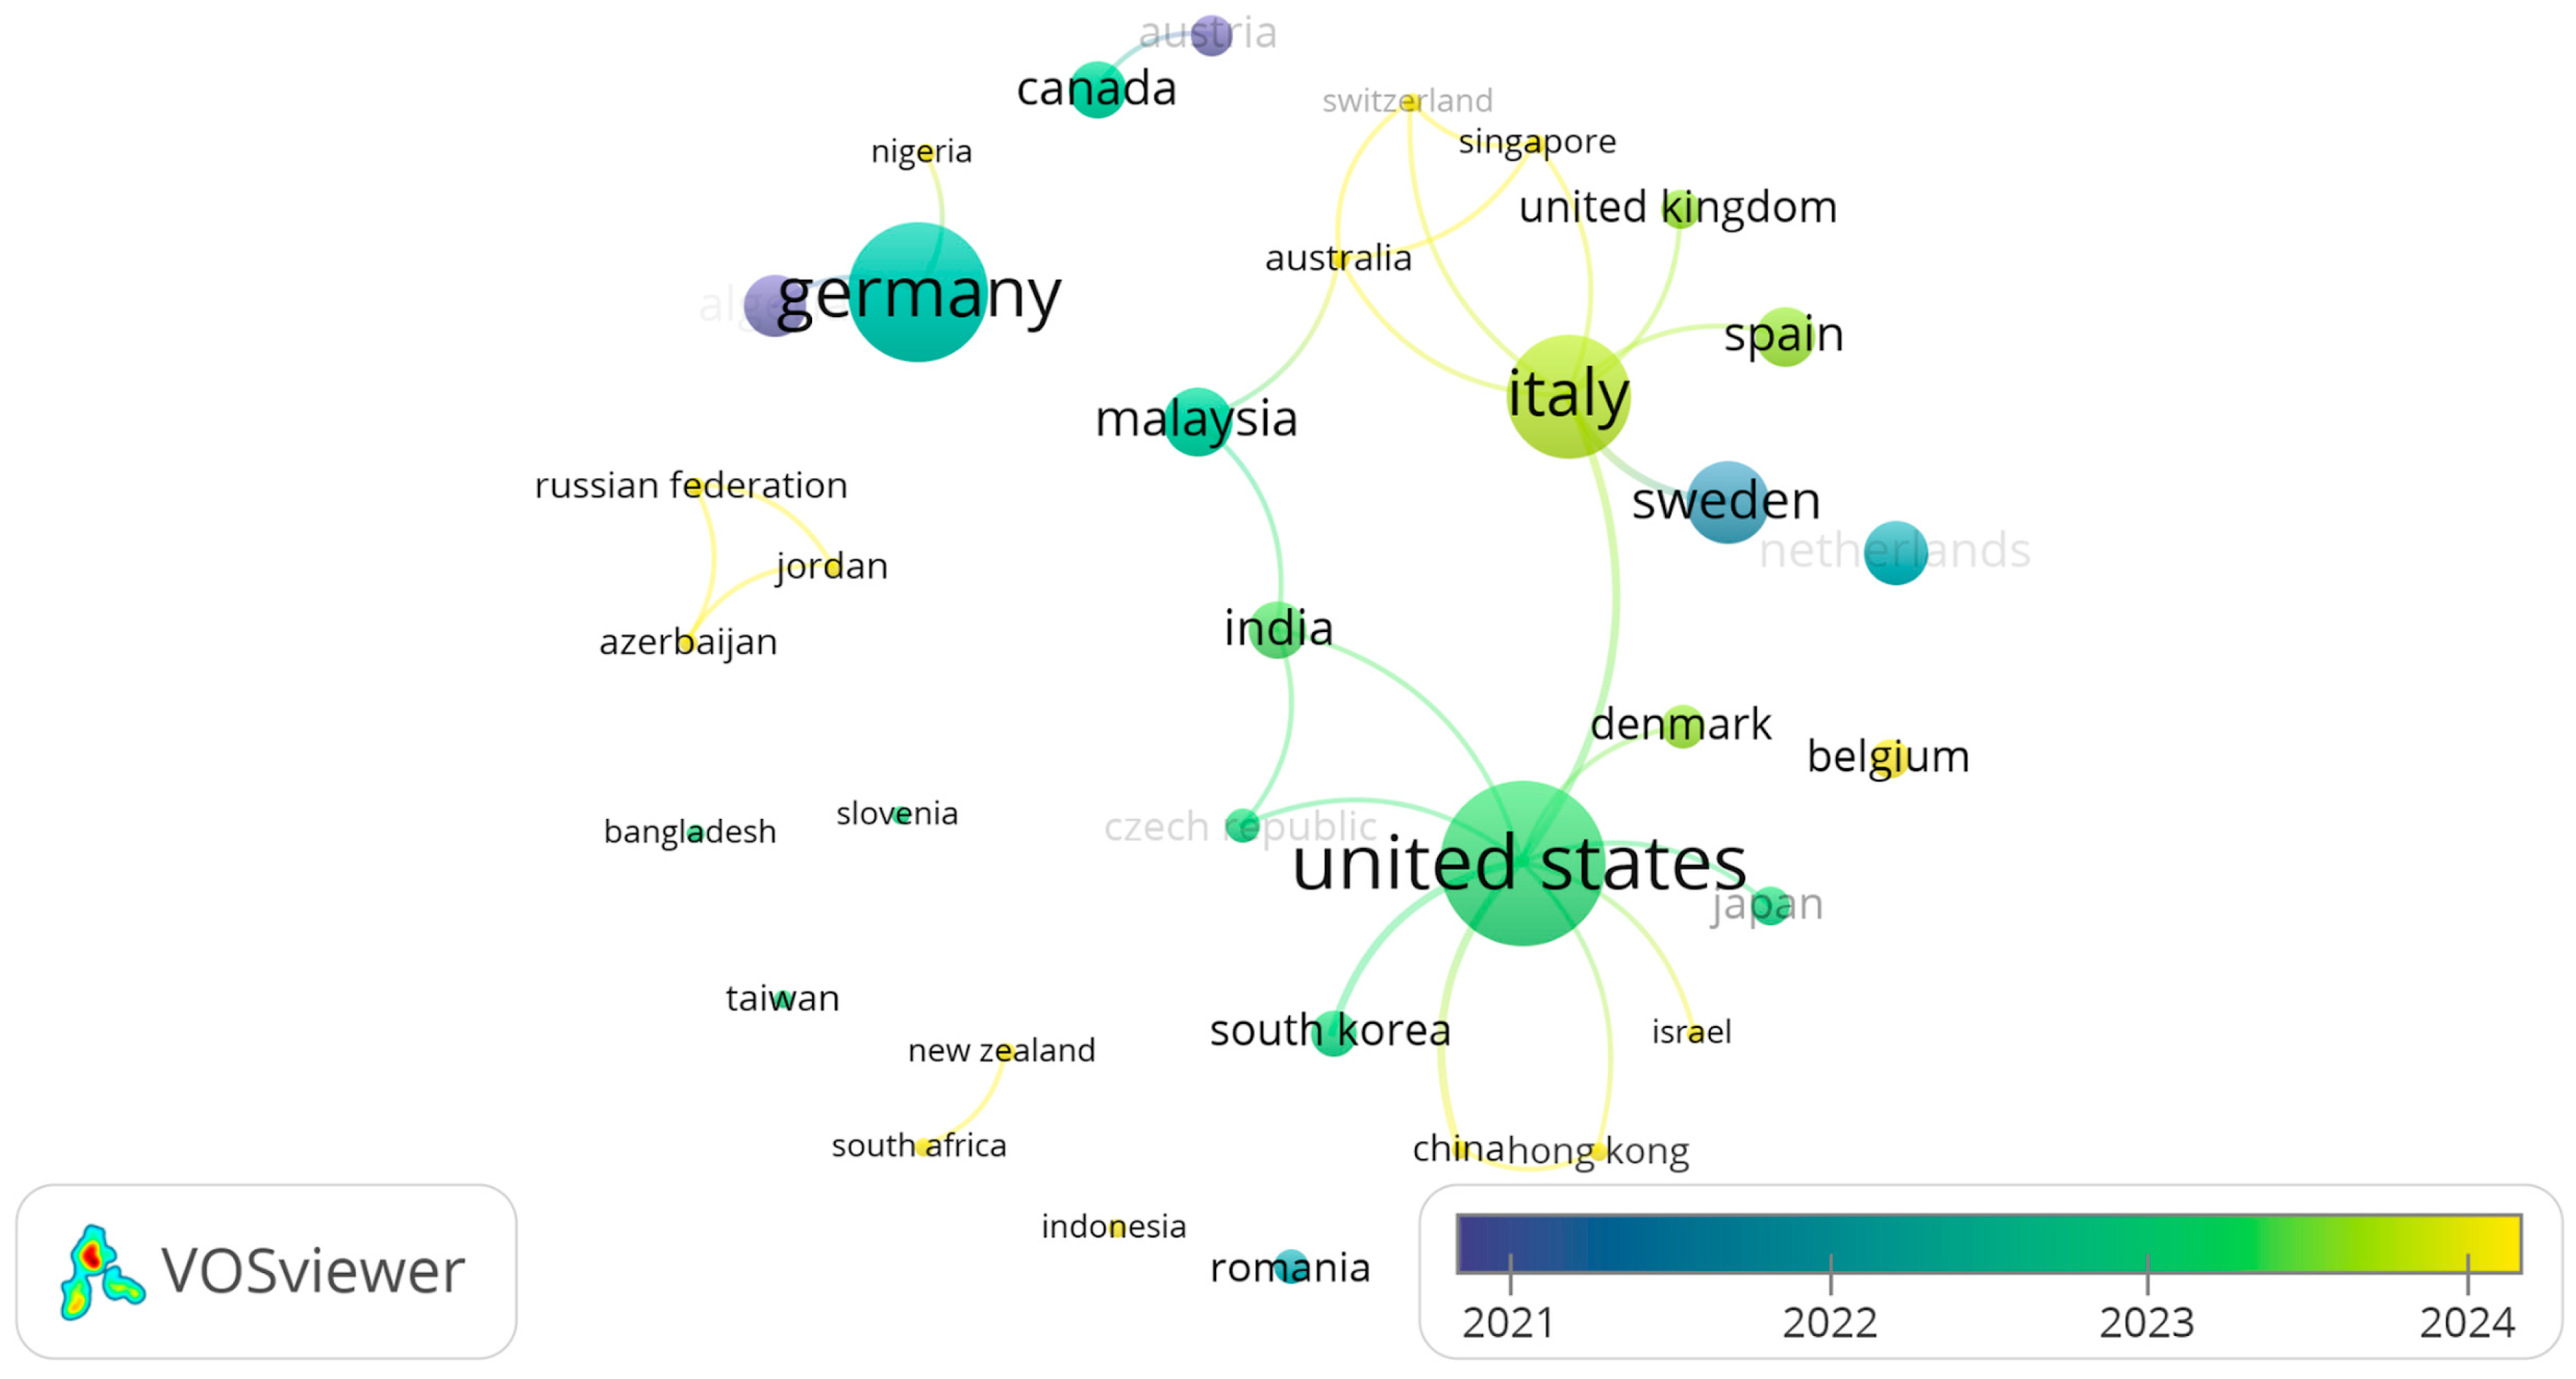
The co-authorship analysis of the 79 articles using VOSviewer identified 12 clusters (C) forming a network characterized by an active central core and expanding peripheral groups (Figure 2). Each node represents a country (node size is proportional to citation count), links denote co-authorship relationships, and node color indicates the average year of publication.
Cluster C1, the largest, comprises 17 countries (including the United States, Italy, China, the United Kingdom, and Spain), accounting for the majority of documents and citations, and reflects established hubs of research on AVSs. Cluster C2 (Germany, Algeria, and Nigeria) evidences Europe–Africa collaborative linkages, while Cluster C3 and (Azerbaijan, Jordan, and Russia) Cluster C4 (Austria and Canada) represent more recent and emerging contributions.
The remaining clusters suggest increasing geographical diversification and the progressive inclusion of new regions in AVS research. These collaboration patterns are consistent with the thematic expansion identified in this review, particularly the growing interest in context-specific design approaches and adaptation to diverse agroclimatic conditions.

3.1.3. Co-Authorship Network Analysis by Author

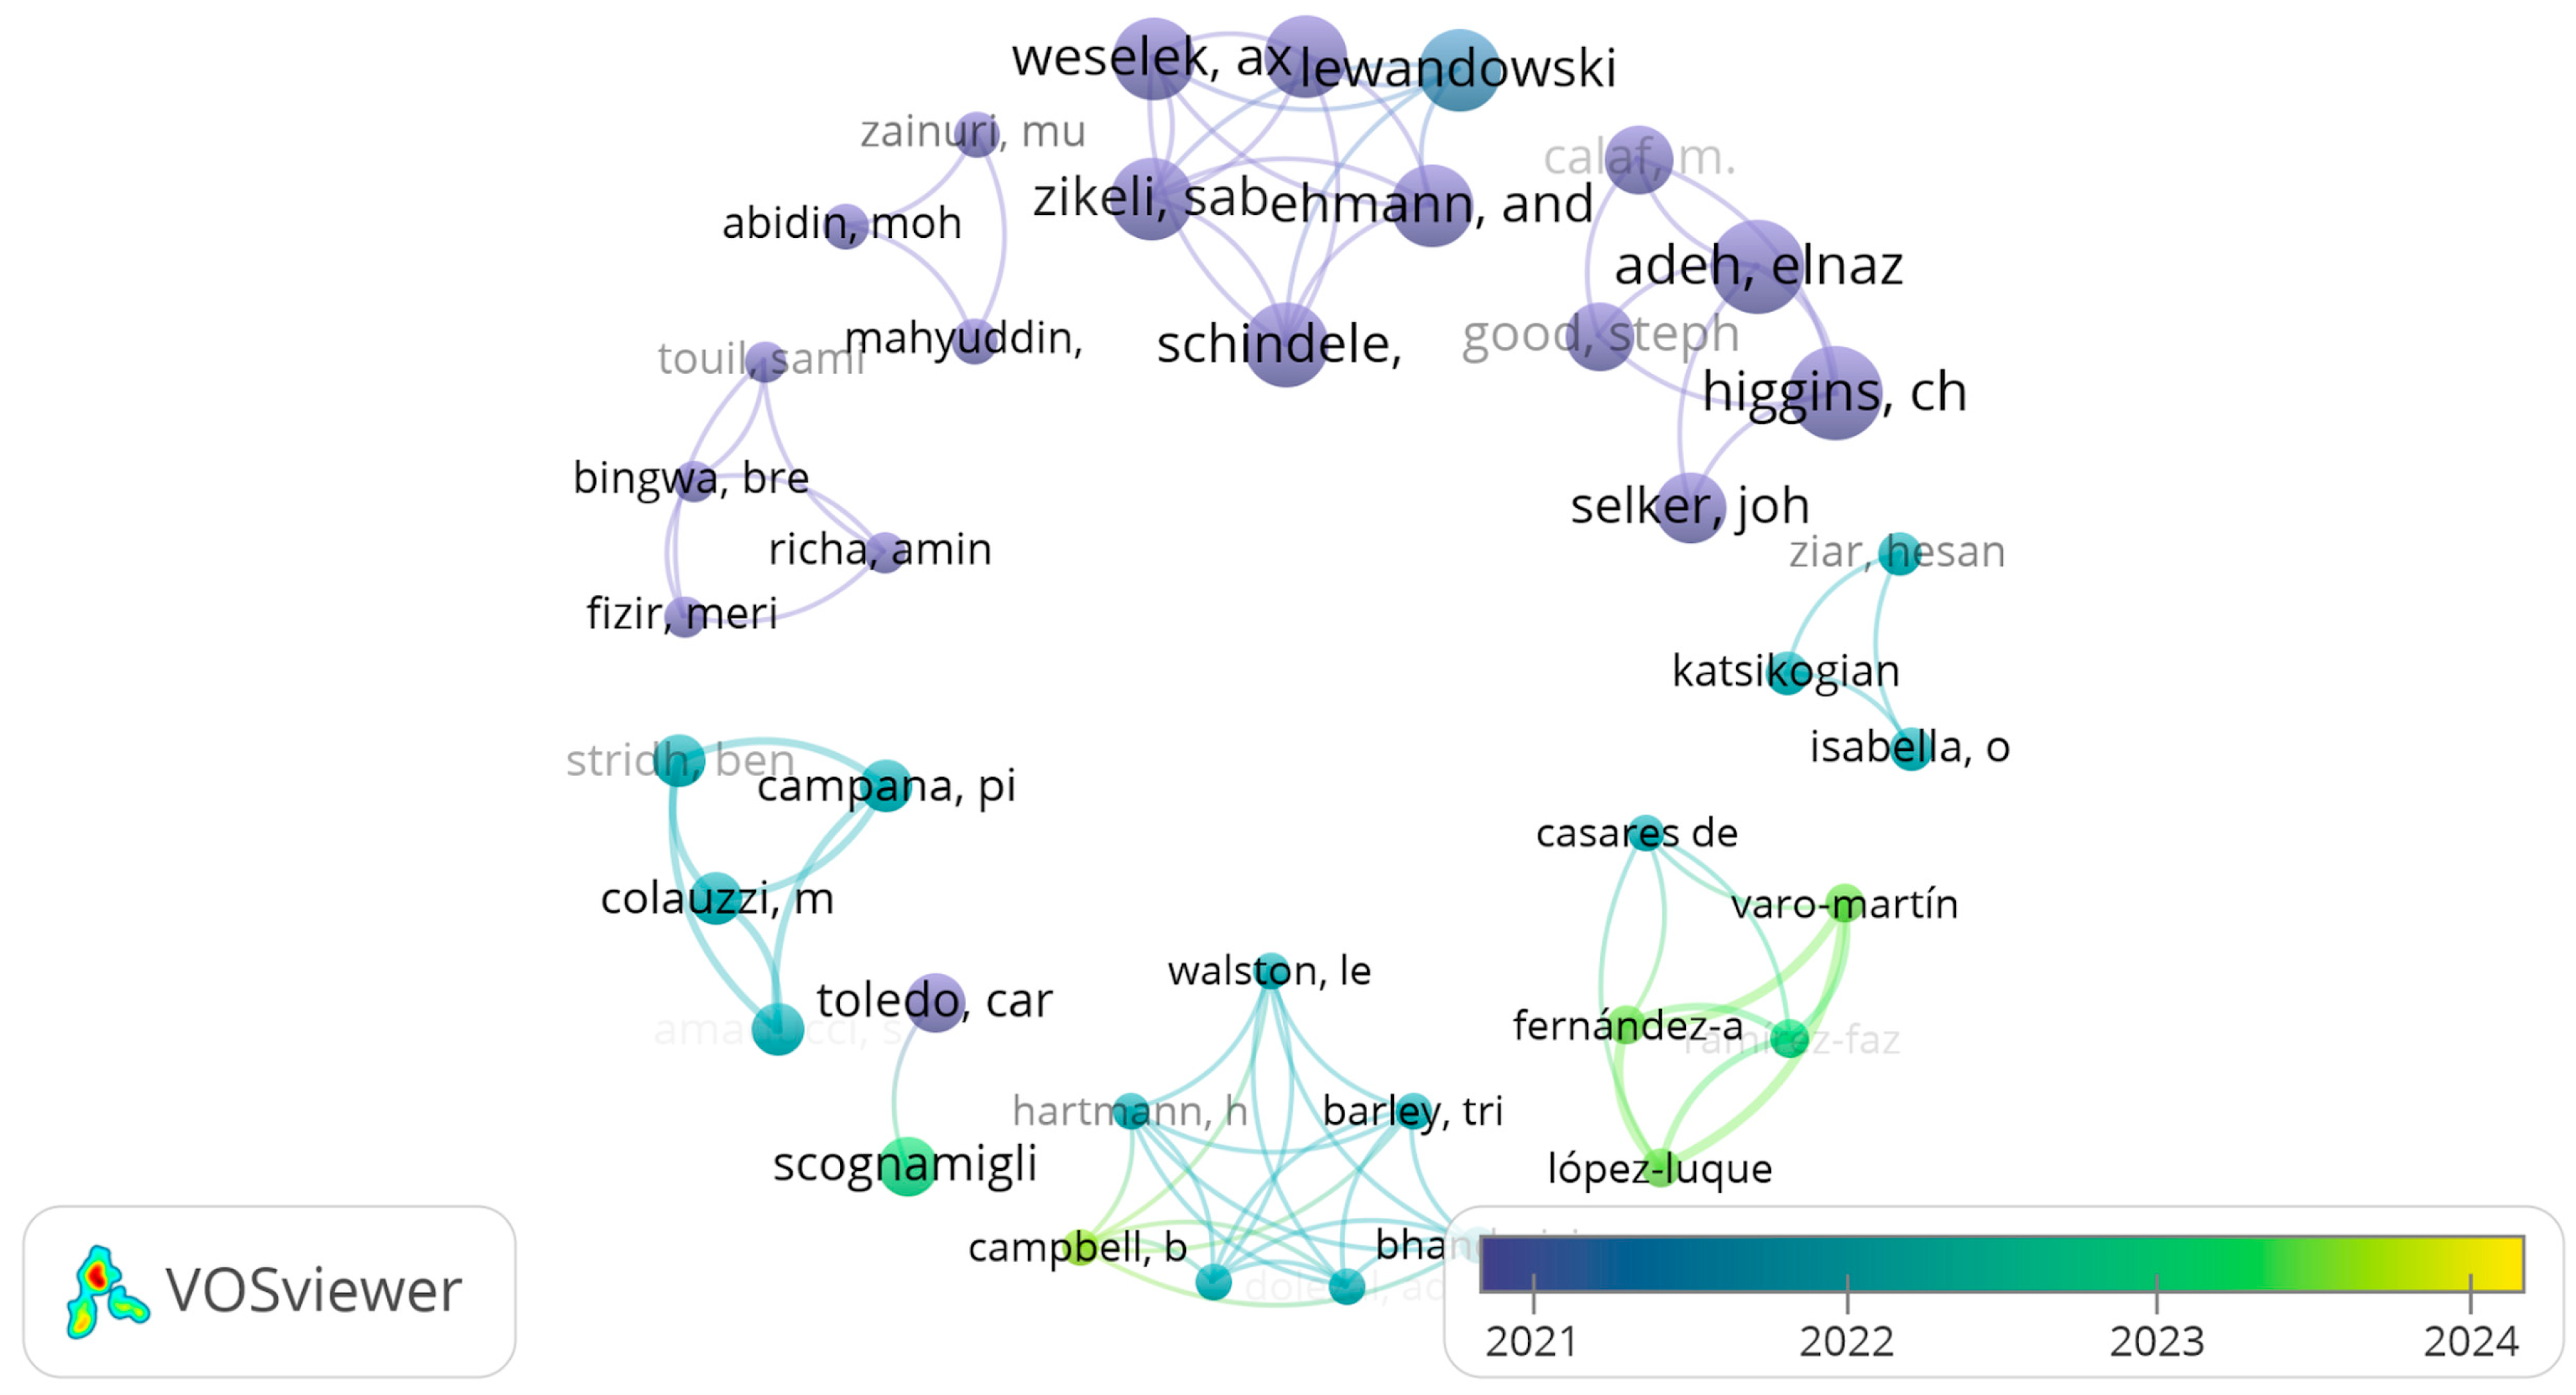
The author co-authorship analysis reveals a global network that combines well-established cores with emerging research fronts (Figure 3). Consolidated clusters are led by C1 (Weselek, Schindele, Lewandowski, Högy) and C2 (Higgins, Adeh), together with clusters in consolidation such as C3 (Campbell, Walston, McCall) and C4 (Fernández-Ahumada, López-Luque, Ramírez-Faz, Varo-Martínez). In addition, recently formed regional networks are observed, including C5 (Italy–Sweden), C6 (Africa and emerging countries), C7 (Malaysia), and C8 (the Netherlands). Overall, the network structure suggests increasing collaboration and diversification of research themes, supporting the transition from conceptual studies toward more applied and context-dependent investigations.

3.1.4. Citation Network Analysis Across Publication Sources

The citation analysis by publication source identified 50 journals relevant to AVS, with a predominance of Q1 journals (82.3%), followed by Q2 (6.3%), Q3 (3.8%), and 7.6% without classification. This distribution suggests high overall editorial quality of the analyzed corpus. However, citation-based indicators are interpreted cautiously due to their dependence on publication age, disciplinary citation practices, and database coverage.
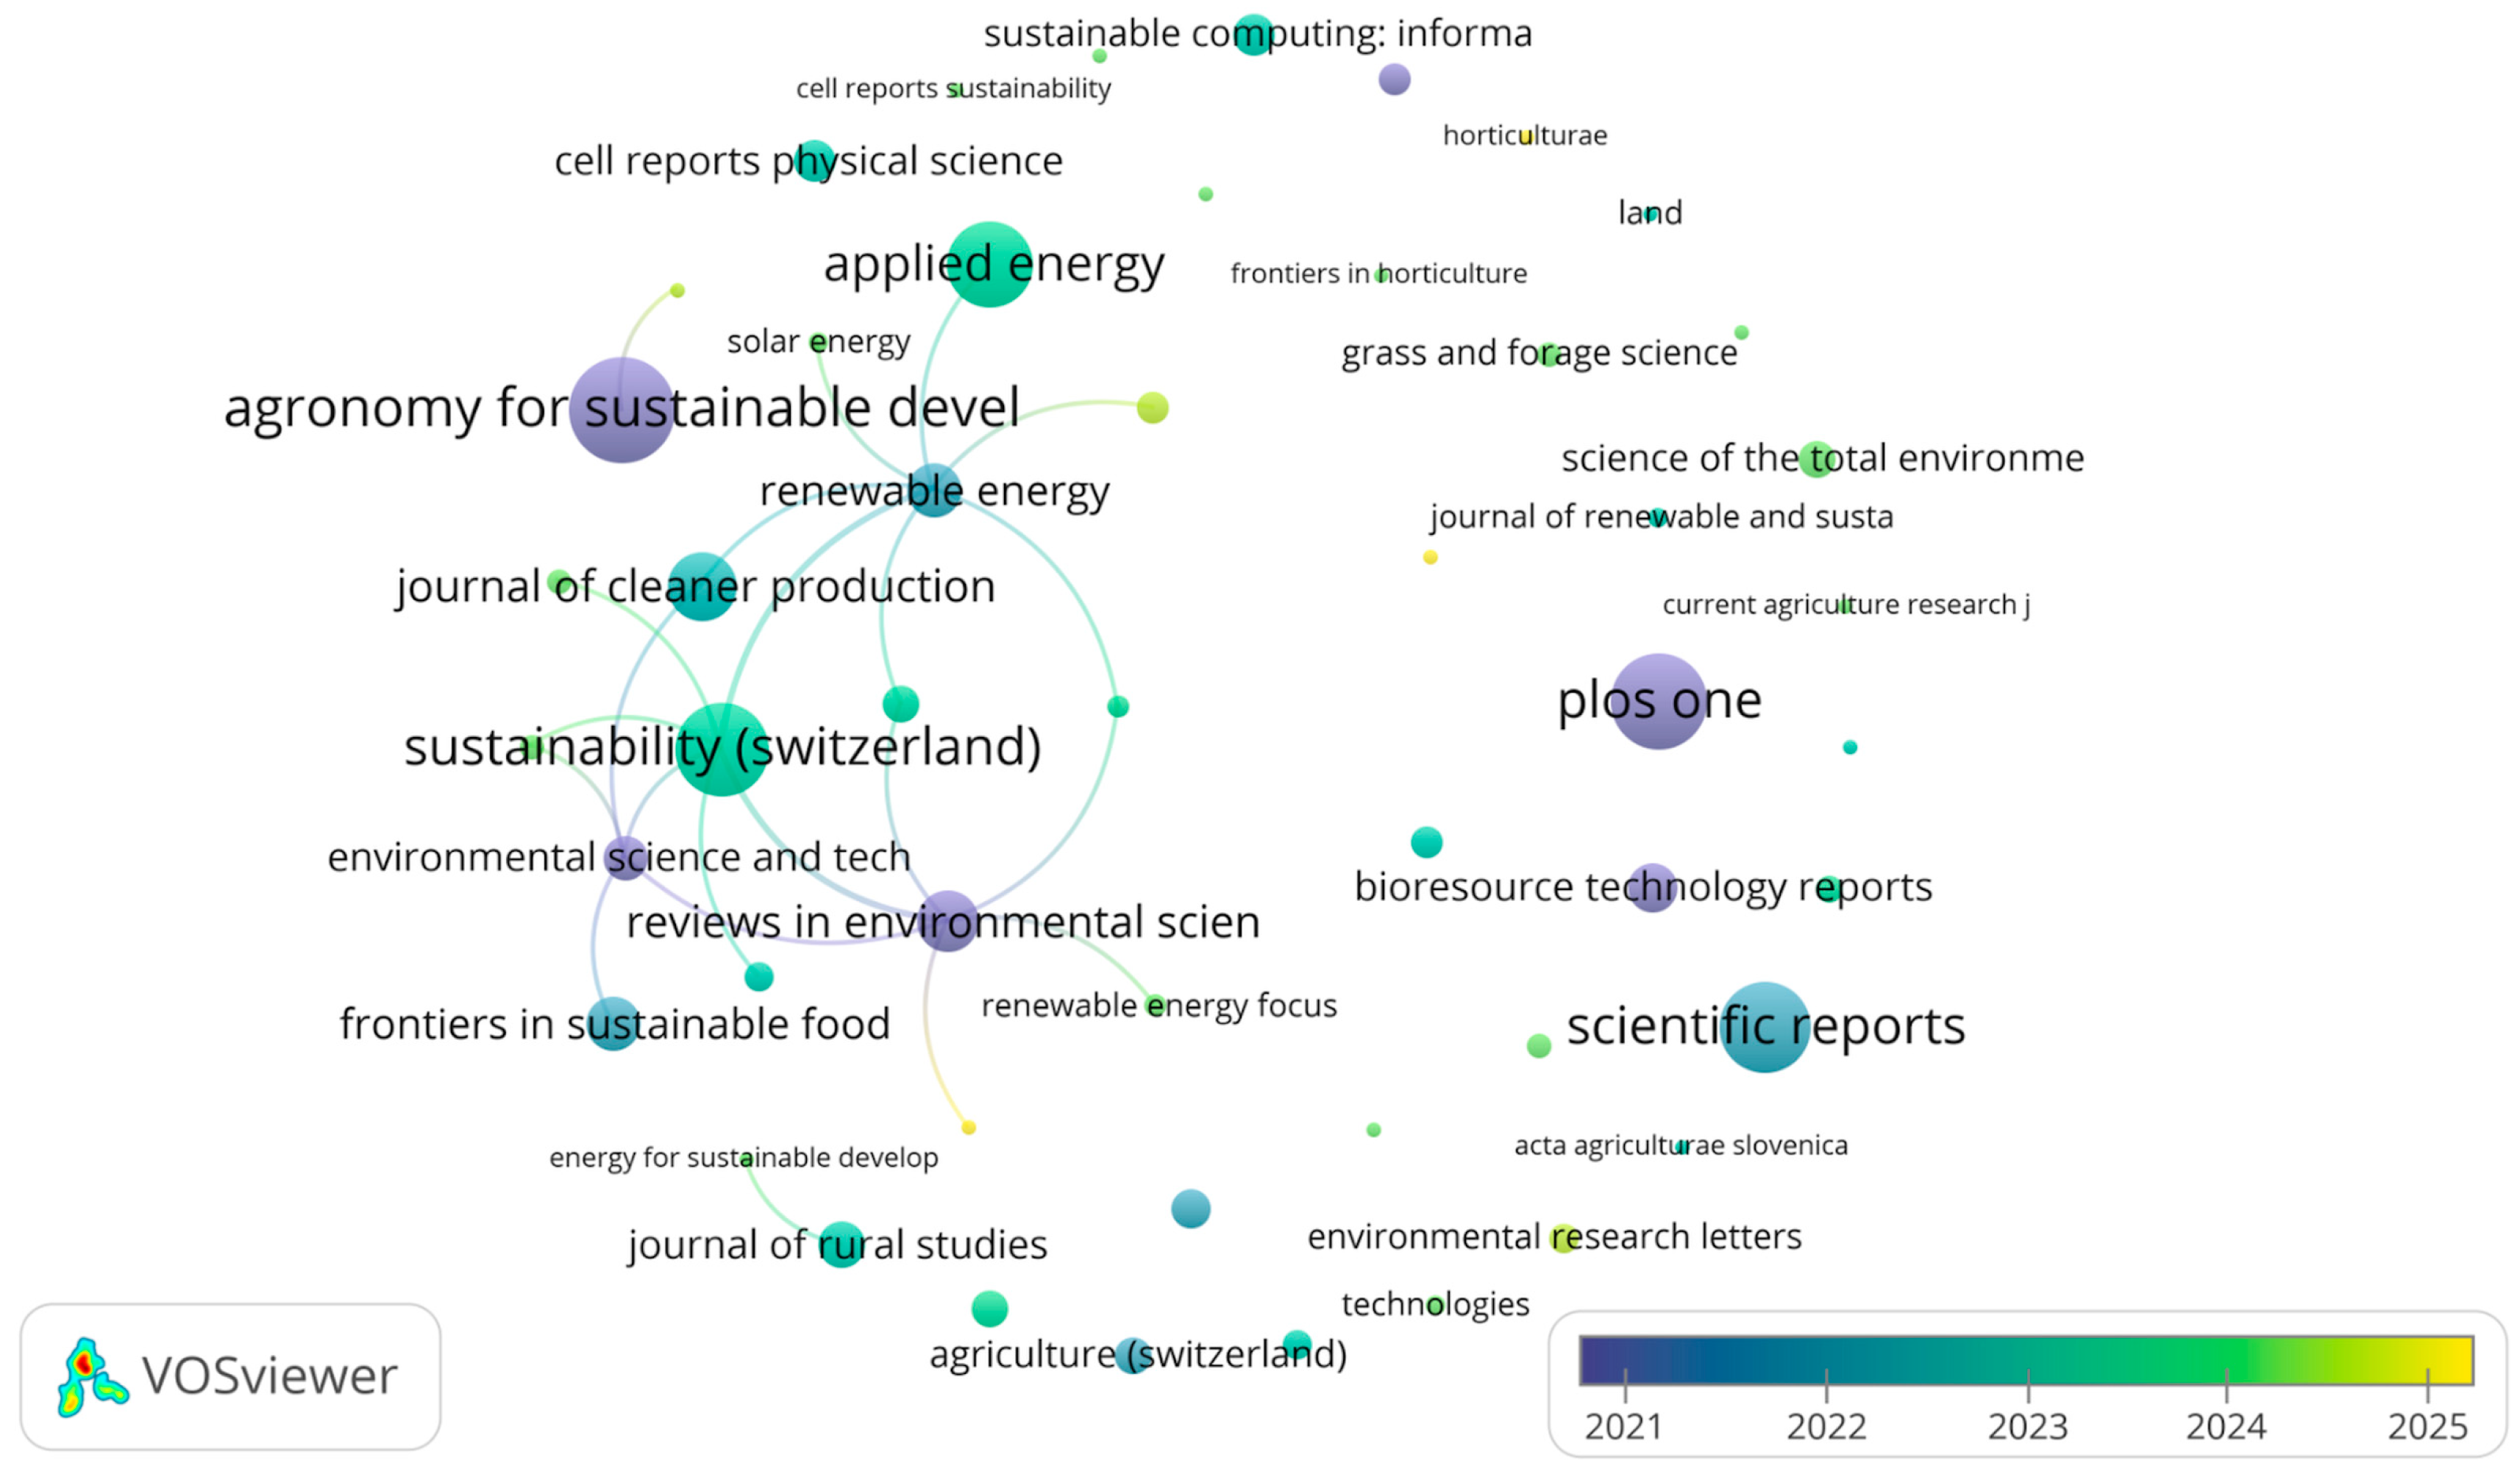
The most influential journals in terms of cumulative citations were Agronomy for Sustainable Development (331 citations, 1 article), PLOS ONE (236 citations, 1 article), Sustainability (Switzerland) (223 citations, 7 articles), Scientific Reports (209 citations, 2 articles), and Applied Energy (176 citations, 10 articles), standing out for their impact and, in some cases, for balancing publication volume and scholarly recognition (see Figure 4)
Rather than representing absolute measures of influence, these citation patterns reflect the visibility and thematic centrality of journals within the analyzed corpus. In particular, journals with lower citation counts may include more recent publications or emerging research topics and should not be interpreted as less significant. The citation network further reveals connections between energy-focused and agriculture-focused journals, reinforcing the interdisciplinary nature of AVS research and its integration across technological and environmental domains.

3.1.5. Keyword Co-Occurrence Network Analysis

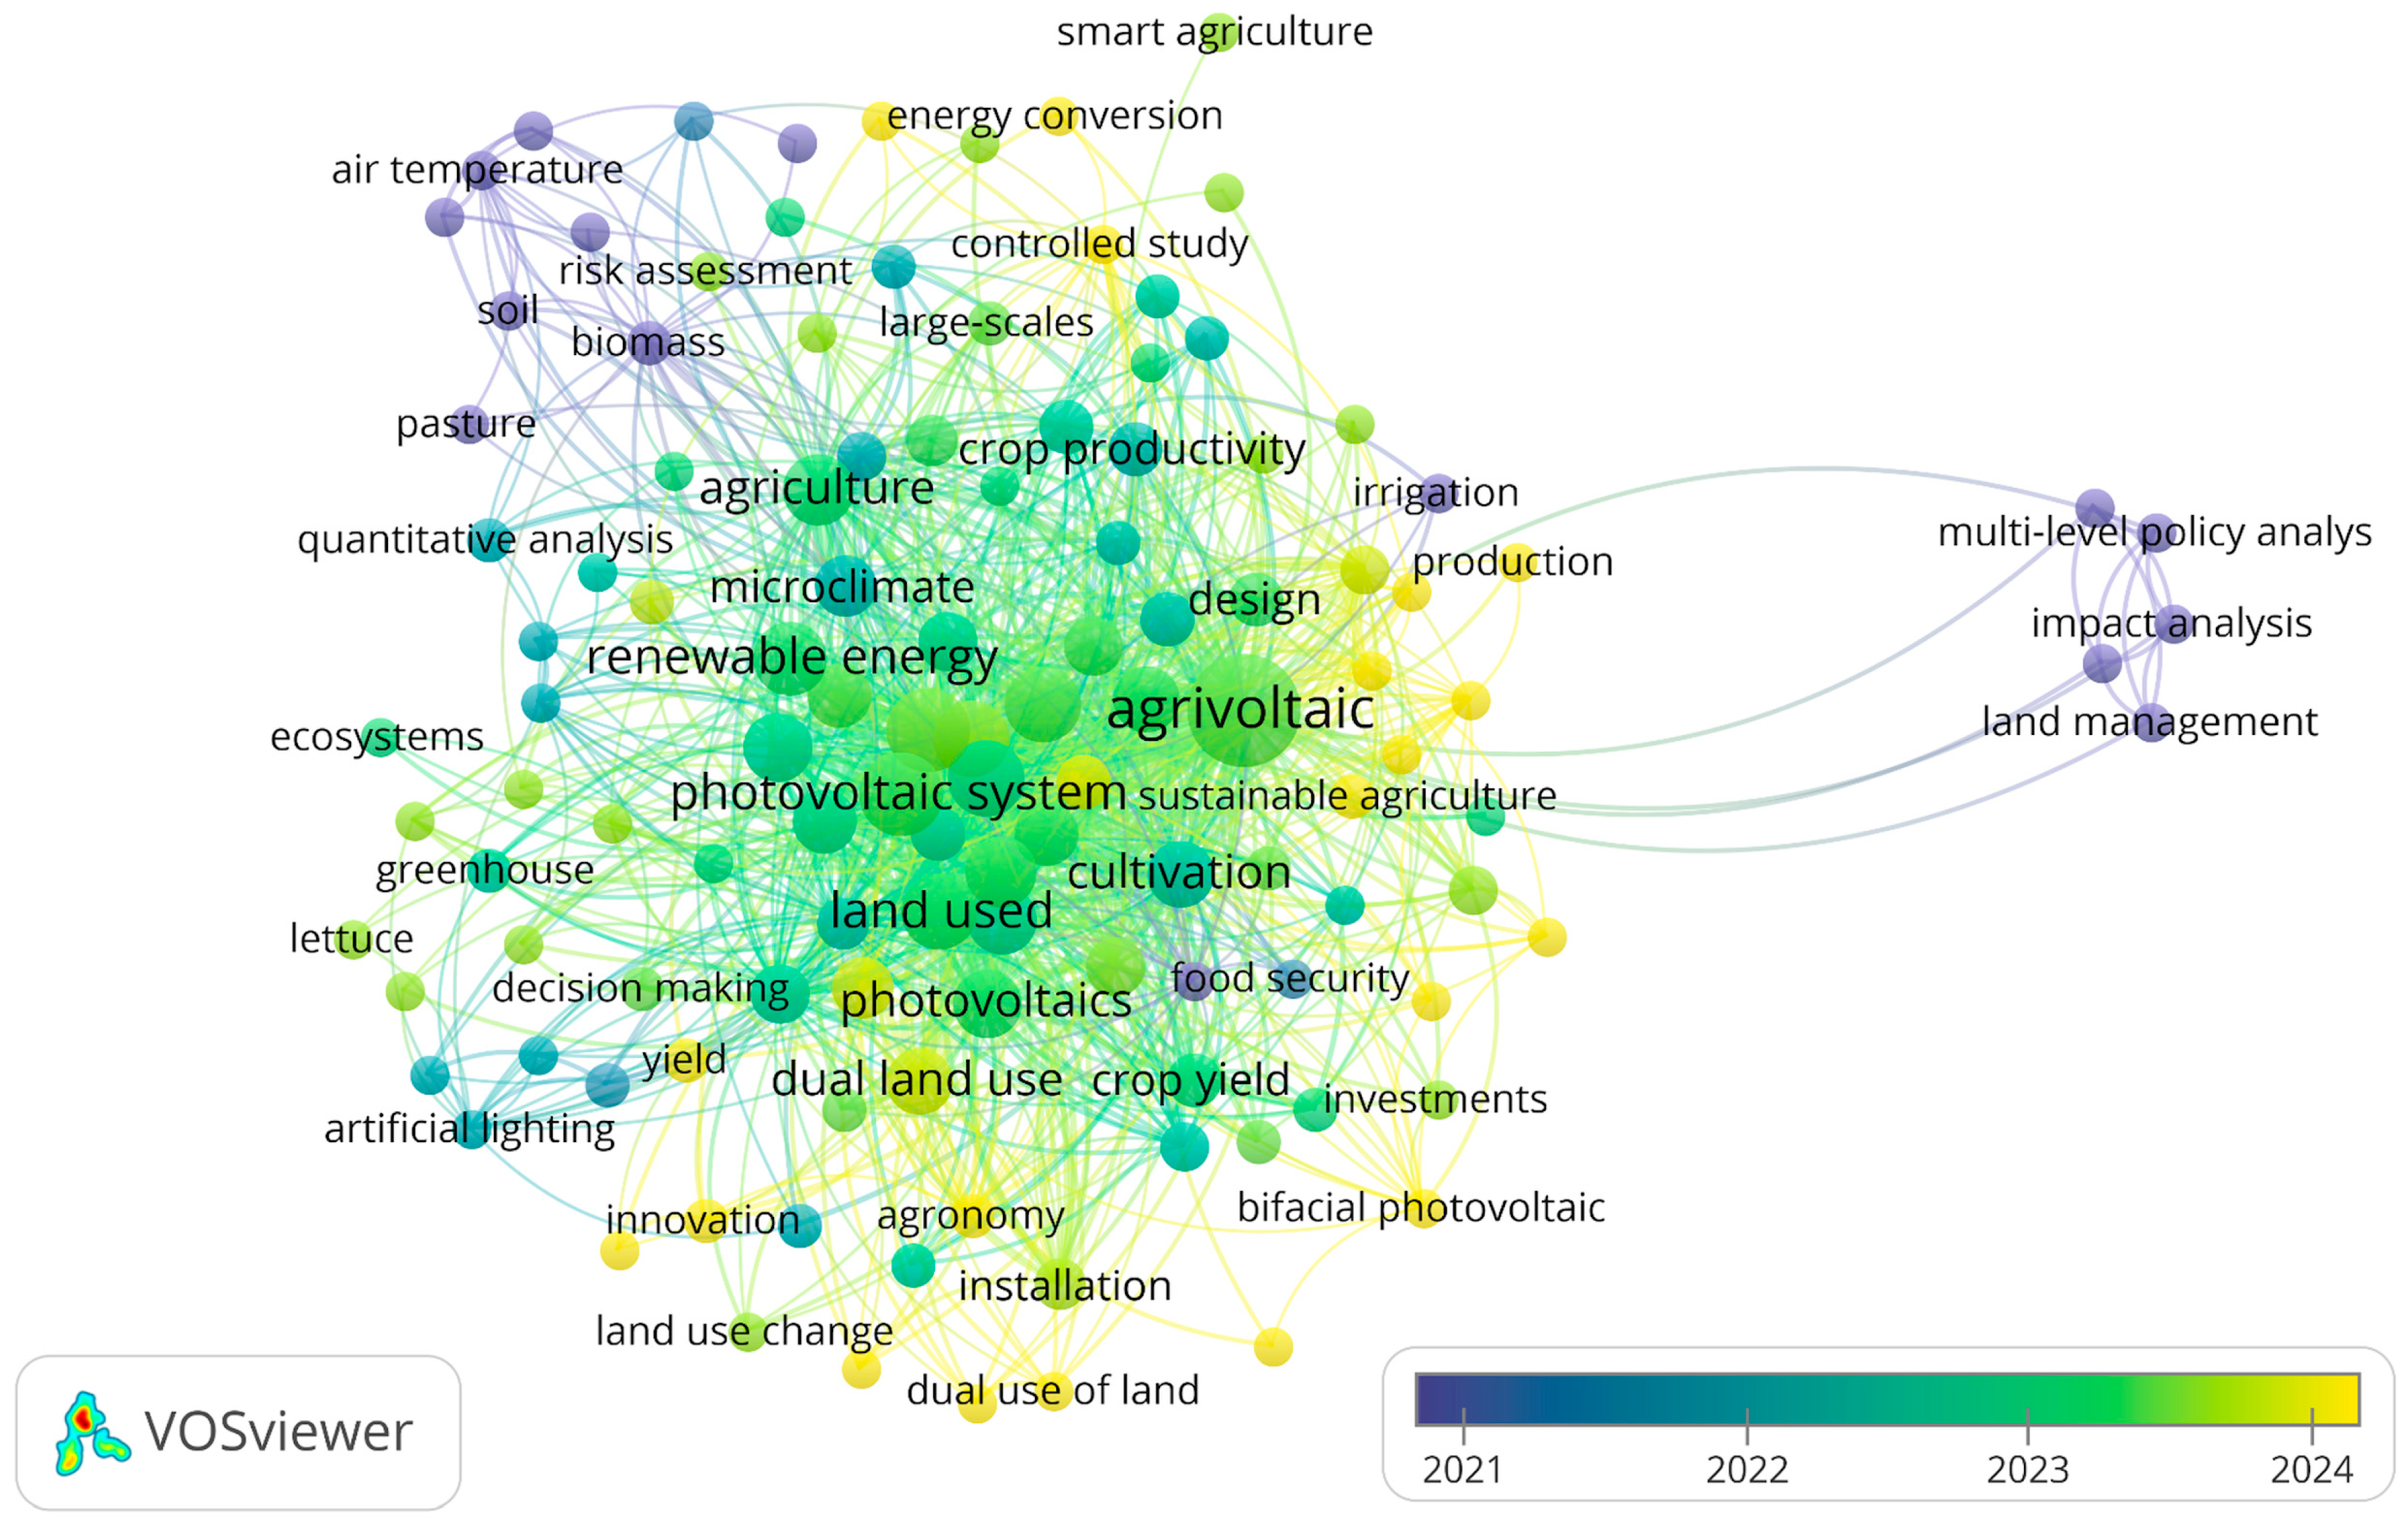
The keyword co-occurrence analysis (Figure 5) reveals seven thematic clusters reflecting the multidisciplinary nature of the field. These clusters encompass design and performance, microclimatic interactions, economic and social assessment, sustainable planning, land-use configurations, governance and public policy, and modeling approaches and emerging technologies. The temporal evolution of keywords indicates a transition from an initial focus on agronomic and environmental aspects (around 2021) toward increasing attention to productivity and sustainability (2022–2023), followed by a growing emphasis on system design, optimization, and innovation, and, more recently, policy integration (2023–2024). This evolution is consistent with the findings of this review, highlighting a shift toward integrated and context-specific AVS design approaches in which technical, agronomic, and sustainability dimensions are jointly considered.

3.2. Results of the Narrative Synthesis

3.2.1. Agrivoltaic System Design Methodologies

AVSs exhibit high design diversity in terms of (i) PV technology, (ii) solar tracking strategies, and (iii) array geometry. These design decisions directly influence shading patterns, light interception, and agricultural operability and are commonly synthesized through the GCR.
Fixed-tilt structures (β, γ) predominate due to their simplicity, lower capital expenditure (CAPEX), operating expenditure (OPEX), and stable energy generation (see Table 2). An increasing adoption of single-axis tracking (SAT) systems is observed, as they enhance EY while generally producing moderate agricultural effects when module height and inter-row spacing are appropriately designed. Emerging alternatives include passive or mobile systems, retractable configurations, and vertical east–west bifacial modules, aimed at maximizing diffuse radiation capture and reducing ground footprint. Dual-axis solar trackers offer higher energy potential; however, their elevated CAPEX and OPEX constrain widespread implementation. Overall, the selection of structural and angular configurations must be optimized according to crop type and agroclimatic context in order to balance AY and EY.
The literature identifies three main ranges of installation module height in AVS (see Table 3). Intermediate module height (2–4 m) are the most widely used in commercial agricultural production, as they facilitate machinery traffic, improve radiation distribution across the crop canopy, and enhance module ventilation. Elevated module heights (4–6 m) are adopted when mechanization is a priority, although they involve higher structural costs. Low module heights (1–2 m) are mainly applied in experimental studies or low-growing crops, but they constrain agricultural operations. Overall, the optimal installation module height depends on the crop type, management system, climatic conditions, and its interaction with other geometric parameters in order to simultaneously optimize EY and AY.
Inter-row spacing in AVSs is defined based on technical and agronomic criteria aimed at balancing EY and AY. This parameter depends on the type of support structure, crop characteristics, and operational requirements, and it determines the degree of inter-row shading, the availability of diffuse radiation, and the resulting GCR. Consequently, inter-row spacing directly influences the overall system efficiency and the agronomic viability of the crop. Table 4 summarizes the observed trends.
Crystalline silicon technologies dominate AVSs, with a growing adoption of bifacial modules and translucent options to enhance compatibility between AY and EY. Semitransparent and thin-film technologies (including organic PV) are emerging in specific applications, such as greenhouses and high-value crops; however, their efficiency and long-term durability still limit large-scale deployment. Table 5 summarizes the main observed trends.
The GCR is a relevant structural parameter in the design of AVSs, as it quantifies the fraction of land area occupied by PV modules and, together with other variables, influences both energy capture and the crop microclimate. However, AVS performance is not determined by a single parameter but by the interaction among factors such as module height, inter-row spacing, azimuth angle, tilt angle, and the use of solar tracking systems, which collectively define the spatiotemporal distribution of solar radiation. In this context, design strategies that enable greater light availability during periods of lower irradiance (morning and afternoon) and increased shading during peak radiation hours are essential to simultaneously optimize AY and EY.
The GCR is defined as the percentage of photovoltaic module ground coverage and is expressed by Equation (1).
G C R = A P V A l a n d
where A P V is the surface area of the PV modules and A l a n d is the total site area. The literature reports a preference for GCR values in the range of approximately 31–40%, where an effective balance between AY and EY is achieved (see Table 6). Lower GCR values tend to favor crops sensitive to solar radiation, whereas higher values require design adjustments to prevent productivity losses. Consequently, GCR should be defined in an integrated manner, considering crop type, local climate, and system geometric parameters, in order to optimize dual performance and overall sustainability.

3.2.2. Impact of Agrivoltaic Systems on Productivity

Agricultural productivity in AVSs is strongly conditioned by the system type and its design. In open-field configurations, the microclimate is largely influenced by external variability, whereas in greenhouse-based systems, it is possible to regulate radiation, temperature, and humidity, thereby expanding productive options. In both cases, the GCR acts as the primary microclimatic regulator and determines crop response. Crop selection and system architecture must therefore be aligned with project objectives, whether prioritizing AY, maximizing EY, or balancing both, which is reflected in LER values greater than unity when dual land use proves more efficient than separate land utilization.
For comparison across different studies in this research, agricultural yield (AY) is normalized as the ratio between production under AVS ( A Y A V S ) and that obtained under open-field reference conditions ( A Y R e f ), as expressed in Equation (2):
A Y = A Y A V S A Y R e f
Values greater than 100% indicate an improvement in yield relative to the control. The available evidence shows high variability in AY (see Table 7), primarily driven by the GCR, system geometry, and crop tolerance to shading and the induced microclimate. Consequently, tailoring system design to crop type and climatic context is critical to achieving efficient and sustainable agri-energy co-production.
For comparison across different studies in this research, energy yield (EY) is normalized as the ratio between the energy produced by an AVS ( E Y A V S ) and that of a conventional PV system ( E Y R e f ) operating under equivalent conditions, as expressed in Equation (3):
E Y = E Y A V S E Y R e f
This parameter is fundamental for techno-economic viability and reflects the interaction between design decisions and the agricultural component. The available evidence indicates that the GCR and the PV technology employed are decisive factors in maximizing EY without compromising AY (see Table 8). Configurations with intermediate GCR values, sufficient installation module height, and adequate inter-row spacing are generally more favorable, whereas high GCR values require specific mitigation strategies to preserve dual system performance.
The LER is the integrated efficiency indicator in AVSs, as it combines AY and EY relative to their separate production, as expressed in Equation (4):
L E R = A Y + E Y
LER values greater than 1 indicate a clear advantage of dual land use (see Table 9). The literature shows that LER depends on crop type, climatic conditions, and PV system configuration, with higher values achieved when system design is jointly optimized by adjusting GCR, geometry, installation module height, inter-row spacing, and technologies such as bifacial modules or solar tracking. Under these conditions, AVSs outperform conventional single-use systems, and LER is consolidated as a key metric for guiding strategic implementation decisions.

3.2.3. Sustainability

The literature shows that AVSs provide simultaneous environmental, economic, and social benefits. From an environmental perspective, they contribute to CO2 mitigation and improved water-use efficiency through shading control and reduced evapotranspiration. Economically, AVSs can achieve competitive LCOE and IRR when system design optimizes geometry, GCR, and technology while also accounting for co-benefits associated with dual land use and water savings. From a social standpoint, acceptance increases by maintaining agricultural activity and diversifying farmers’ income streams. Overall, the evidence supports the integrated viability of AVS, provided that system design is adapted to the productive context and supported by favorable policy frameworks.
Economic viability is a determining factor for the large-scale adoption of AVSs, particularly in the context of the energy transition and competing land uses. Although various economic indicators exist, in this review the most frequently reported key indicators are the LCOE, as expressed in Equation (5), and the IRR, as expressed in Equation (6), which facilitate the assessment of competitiveness relative to other renewable technologies and the attractiveness of projects to investors:
L C O E = t = 1 n C A P E X P V , t + O P E X P V , t 1 + r P V t t = 1 n E A V S , t 1 + r P V t
where CAPEX is the initial investment, OPEX represents operation and maintenance costs, E A V S , t is the annual energy generated, r P V is the discount rate, t denotes the year, and n is the system lifetime. The IRR is defined as the discount rate that makes the net present value of the project cash flows equal to zero, as expressed in Equation (6). This equation is not solved analytically; instead, the IRR is obtained through iterative numerical methods:
t = 0 n C F t 1 + I R R t = 0
where C F t corresponds to the net cash flows (revenues from electricity generation and agricultural products minus OPEX and CAPEX). In AVSs, the IRR integrates both electrical and agricultural revenues, thereby reflecting the profitability of the combined system. Table 10 shows a wide variability in these indicators depending on system design, location, and crop type, with IRR values ranging from moderate to high levels and LCOE values that are competitive with other renewable energy technologies. In general, configurations with intermediate GCR values, bifacial or tracking technologies, and geometries compatible with agricultural mechanization tend to improve profitability. Therefore, site-specific techno-financial assessments are recommended for AVS implementation.
The available evidence indicates that the shading provided by PV modules reduces crop ET and canopy temperature, thereby lowering water demand and mitigating heat stress. AVSs consistently show higher soil moisture levels and improvements in water-use efficiency compared with open-field cultivation. In addition, complementary strategies are reported, such as the reuse of water from module cleaning, applications in hydroponic systems, and indirect water savings in grazing and pasture-based systems. Overall, AVSs are an effective alternative for water conservation, particularly in arid and semi-arid regions, with positive effects on both AY and EY. Table 11 summarizes the reported water savings values and the main mechanisms identified in the reviewed studies.
The reduction in CO2 emissions associated with AVS exhibits high variability, depending on system scale, assessment methodology, Life Cycle Assessment, and the regional energy context (see Table 12). Studies report outcomes ranging from modest reductions in small-scale applications to very high values in large-scale installations, particularly in arid regions with high solar irradiance and carbon-intensive energy mixes. Beyond the direct substitution of fossil-based electricity, AVSs deliver indirect benefits linked to microclimatic regulation, improved water-use efficiency, and the optimization of agricultural inputs. Overall, the evidence positions AVSs as a robust strategy for the integrated decarbonization of agricultural and energy systems.
AVSs exert a positive social impact when farmers perceive direct benefits, such as income stability, preservation of land use, and maintenance of AY, which in turn increases social acceptance, particularly when agro-energy objectives are explicitly integrated and communities are engaged early in the planning process [1,6,7,29]. In countries such as Germany and Japan, AVS are often valued more positively than conventional PV parks because they preserve agricultural activity [6,74].
Nonetheless, several barriers to acceptance remain. These include concerns over potential reductions in AY, visual and landscape impacts, structural inflexibility, the risk of symbolic or marginal agricultural use, and the limited availability of empirical evidence on social perception [6,7,9,86]. Low acceptance has been reported in China, Sub-Saharan Africa, and Italy, particularly in cases where projects lack adequate stakeholder consultation or involve inequitable contractual arrangements [61,63,86]. Conversely, social acceptance improves when demonstrable agronomic benefits are provided [7,22,81]. Notably, in contexts such as China, regulatory and permitting processes also influence social acceptance, highlighting the interplay between legal frameworks and community perception.
The adoption of AVS is largely contingent upon the existence of specific regulatory frameworks and incentive schemes. Leading countries, including Germany, Italy, Japan, South Korea, and the USA, have implemented technical standards, feed-in tariffs, and subsidies to facilitate deployment [7,52,56,59,74,86]. Other countries, such as Chile and Canada, rely on net billing mechanisms, tax deductions, and carbon credits [43,74], while in Asia, Japan, South Korea, and India combine tariffs with concessional loans and subsidies [40,74]. Despite these measures, regulatory gaps and barriers for small-scale producers remain prevalent in many regions [27,81,87]. The literature emphasizes the importance of strengthening cooperative models, enhancing social communication, and pursuing regulatory harmonization that aligns agricultural, energy, and environmental objectives, supported by differentiated incentive schemes and equitable benefit-sharing [9,74,80,87,91].

3.3. Exploratory Correlation Analysis

A correlation analysis was conducted to examine the relationships among design variables (γ, β, module height, Inter-row spacing, GCR), productivity indicators (AY, EY, LER), and sustainability metrics in AVS (water savings, LCOE, IRR, CO2), while also considering contextual factors such as PV technology, structural configuration, crop type, and location.
To ensure robustness, the analysis was based on a subset of 12 studies that provided complete methodological descriptions and consistent quantitative data. From these studies, a structured dataset comprising 20 variables and up to 111 observations was constructed, enabling cross-study comparison beyond publication-level aggregation. For this analysis, CO2 was normalized as the ratio between the CO2 emissions of the AVS and those of a reference conventional PV system. Given differences in data availability across studies, the number of observations varies for each variable pair, and only complete cases were included in each correlation. The dataset used, including variable definitions and sample sizes, is available in the public repository.
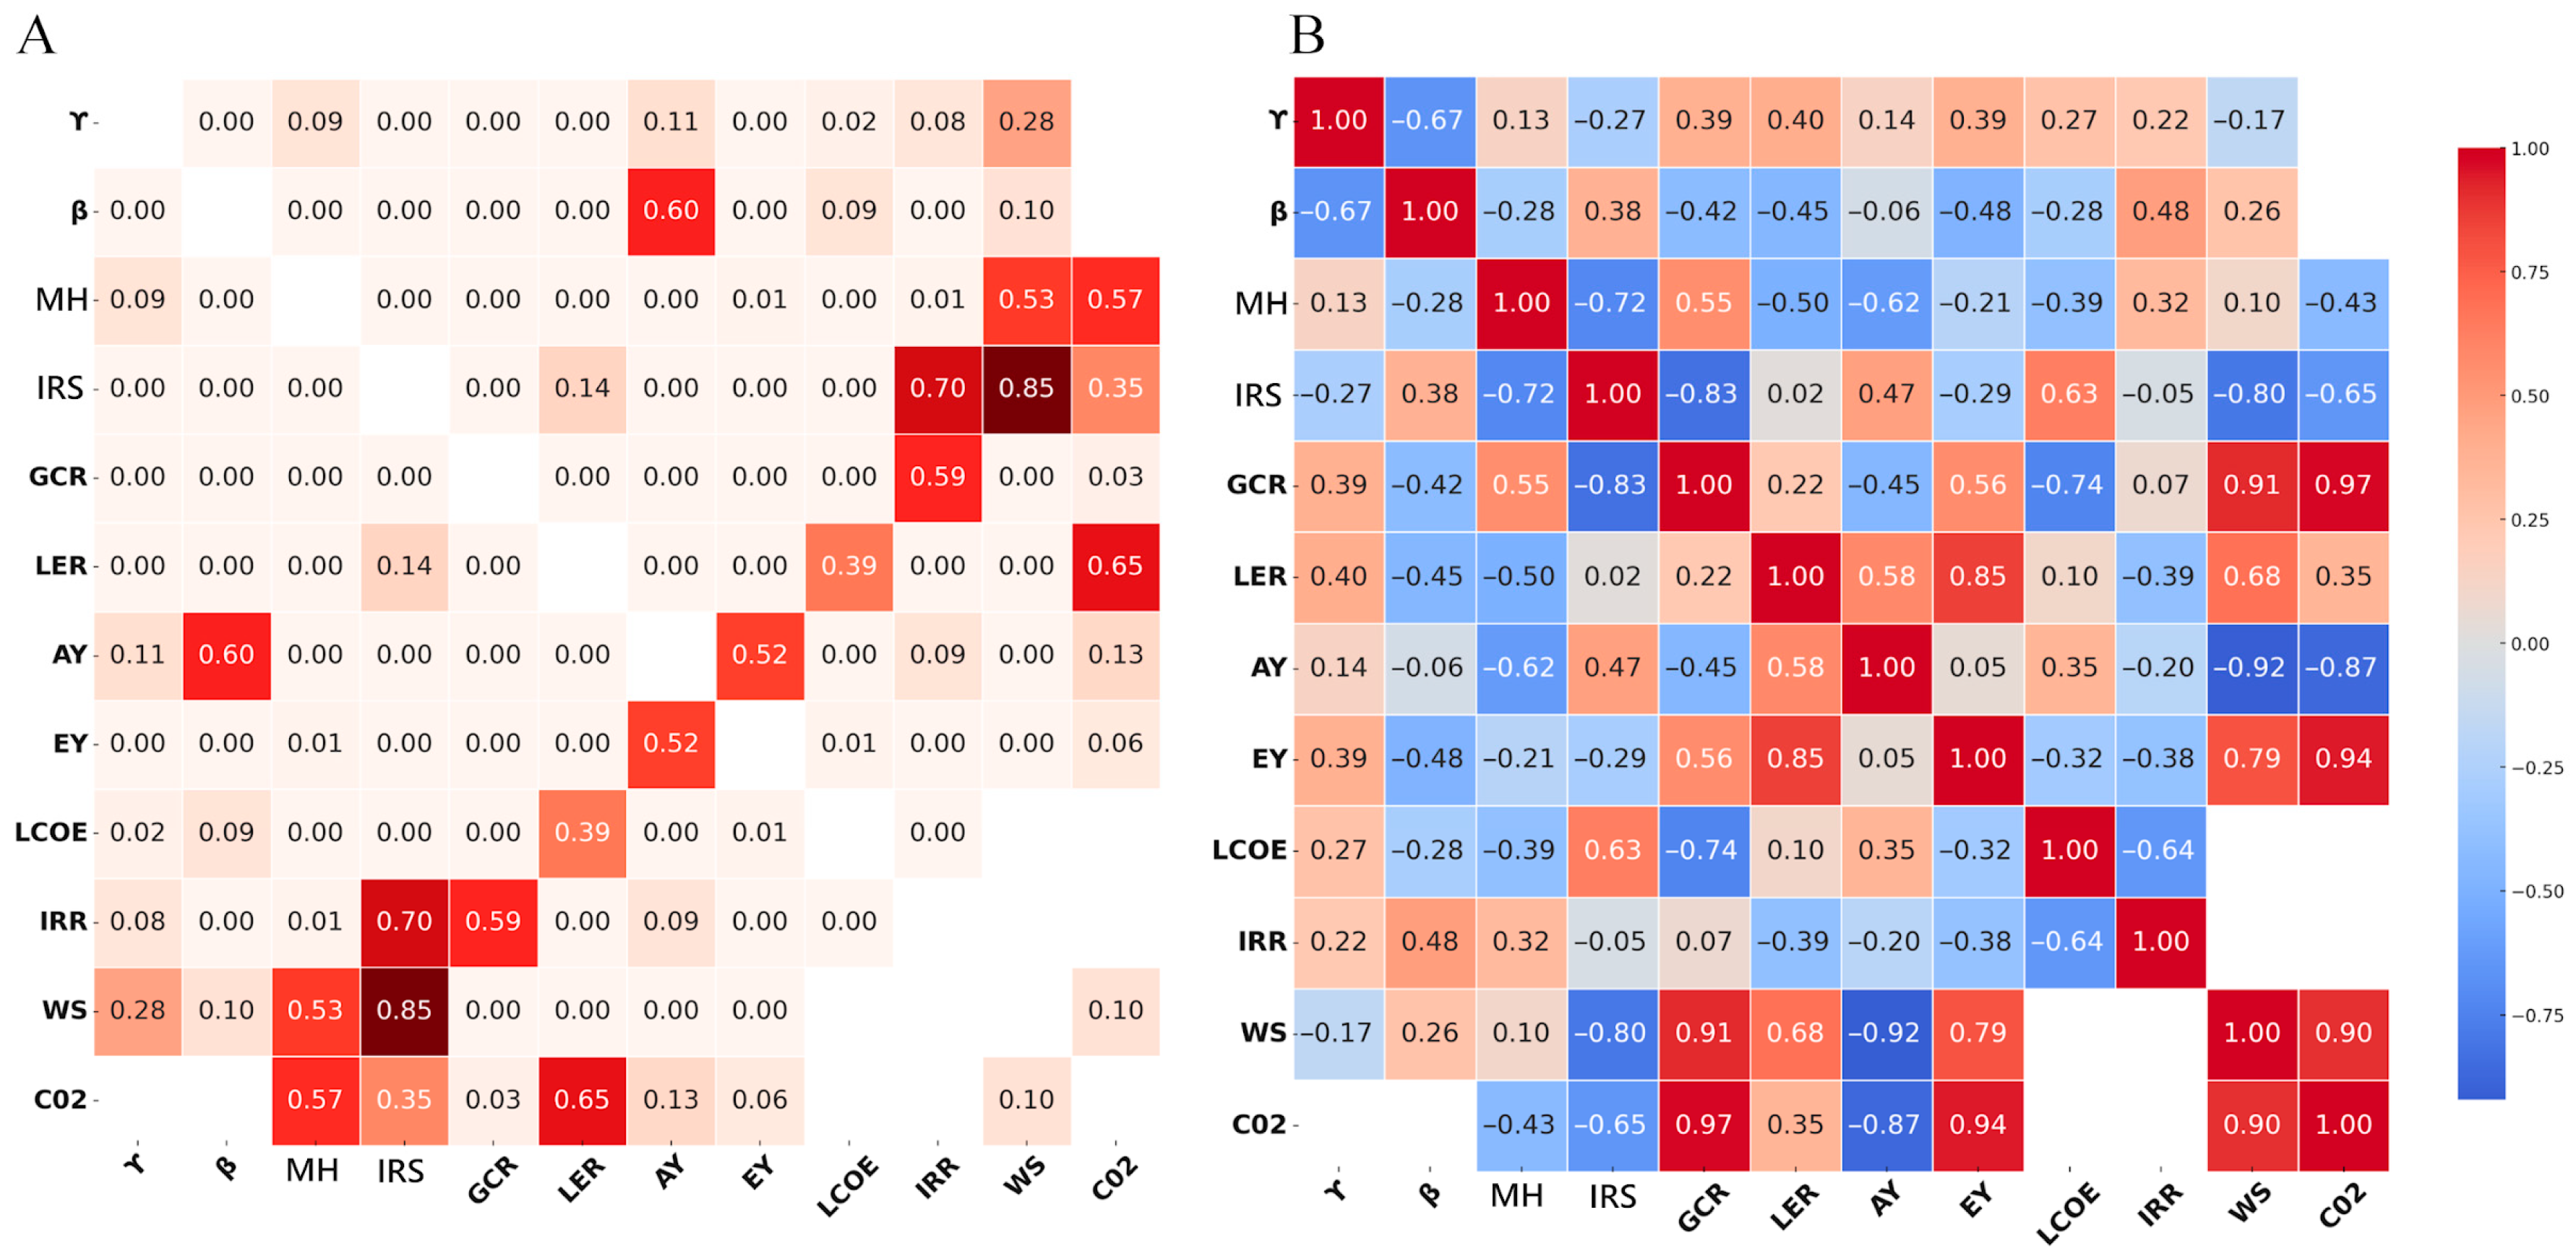
The results, summarized in a heat map (see Figure 6), reveal moderate to high associations (|r| ≥ 0.50) that are statistically significant (p ≤ 0.05) between system design and agro-energy and environmental performance. The color scales differ between subfigures due to the nature of the analysis. In Figure 6A, colors represent statistical significance (p-values), where warmer colors indicate lower significance (higher p-values). In Figure 6B, colors represent the strength of the correlation coefficient (r), where warmer colors indicate stronger positive correlations. This distinction should be considered when interpreting the results.
GCR emerges as a consistently influential structural parameter across the analyzed subset of studies, as it exhibits significant correlations with most of the variables analyzed, confirming its central role in the simultaneous regulation of PV energy capture, crop microclimate, and the economic and environmental outcomes of AVS. These findings should be interpreted as exploratory patterns derived from a harmonized subset of studies, rather than universally generalizable relationships, given the heterogeneity of the broader literature.
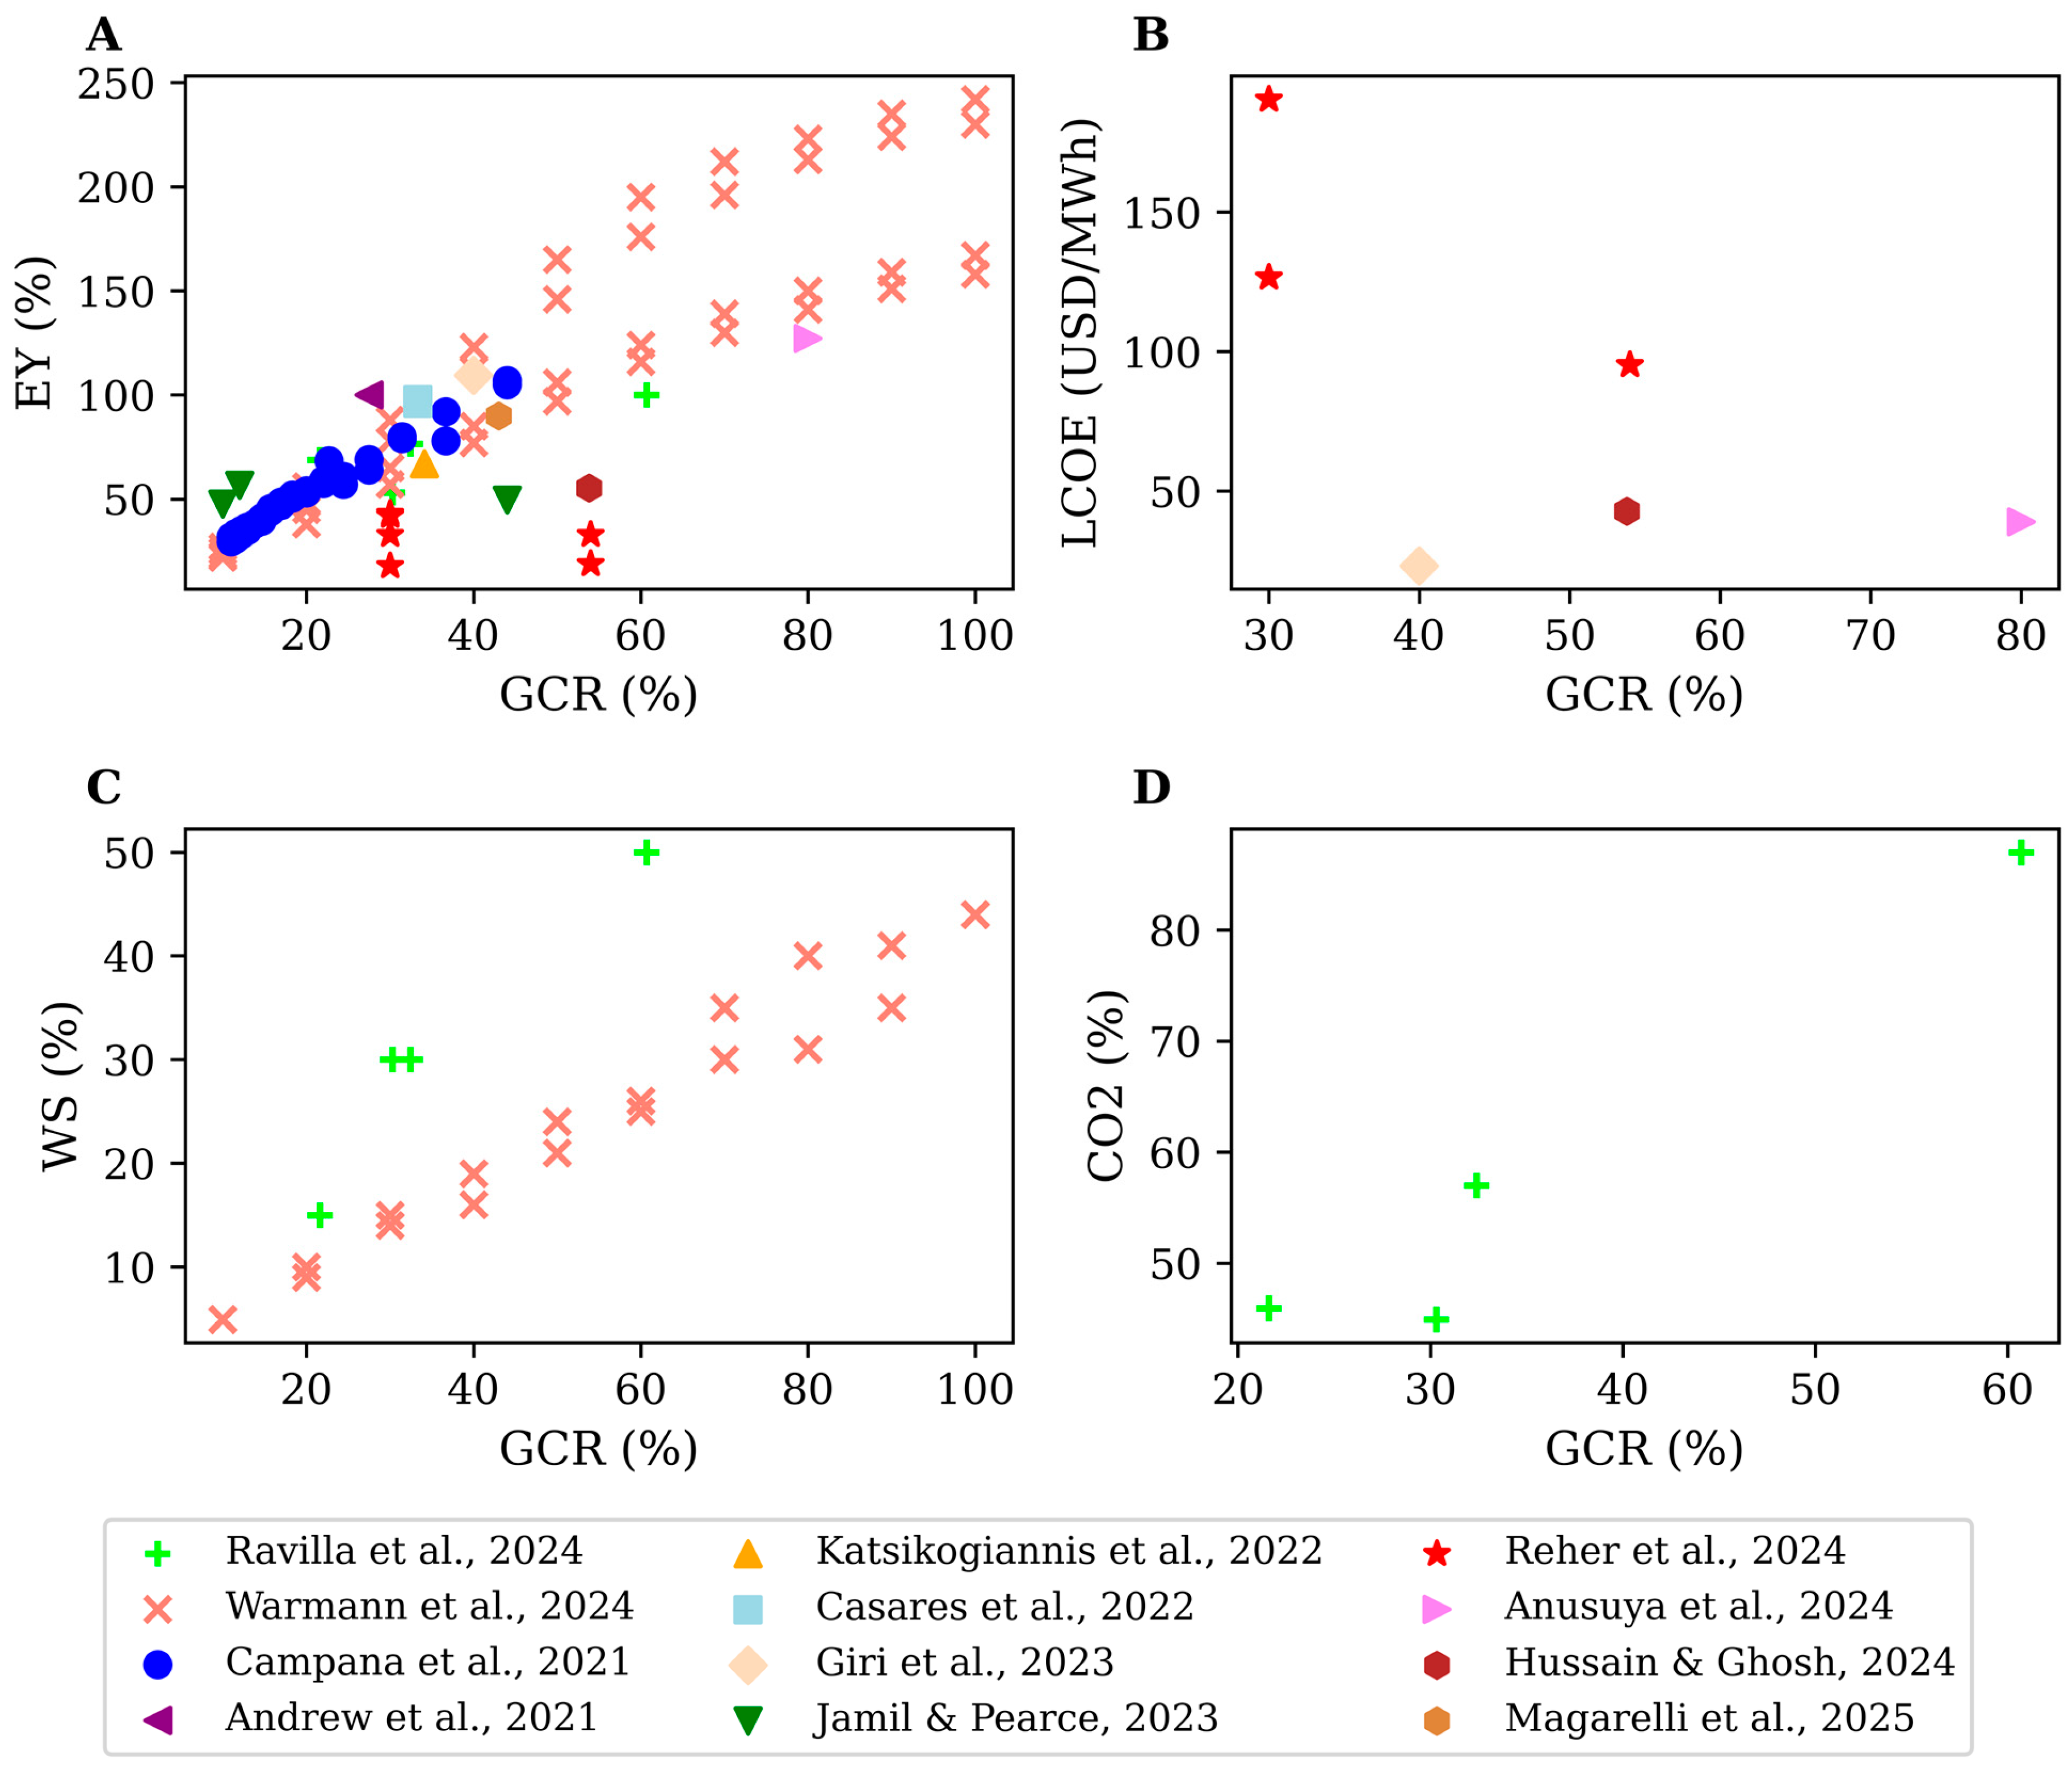
The GCR exhibits a strong negative correlation with inter-row spacing (r = −0.83), confirming that reduced spacing increases PV ground coverage. In terms of productivity, GCR is positively associated with EY (r = 0.56), suggesting a generally increasing, though non-linear, relationship under the conditions represented in the dataset (see Figure 7A). The largest gains in EY are concentrated at low GCR ranges, with diminishing marginal returns at higher coverage levels [20,23,28,34,35,36,41,46,58,65,69,92]. From a sustainability perspective, GCR shows statistically significant correlations with key indicators. A strong negative relationship with the LCOE (r = −0.74) is observed (Figure 7B), suggesting that denser designs are often associated with improved economic competitiveness, although this relationship depends on system configuration and context [45,58,65,69]. Likewise, a very high positive correlation with water savings (r = 0.91) is identified (Figure 7C), attributable to increased shading and soil protection effects [20,23]. In contrast, GCR also presents a high positive correlation with normalized CO2 emissions (r = 0.97) (Figure 7D), reflecting the increased carbon footprint associated with higher infrastructure requirements in high-coverage designs [20].
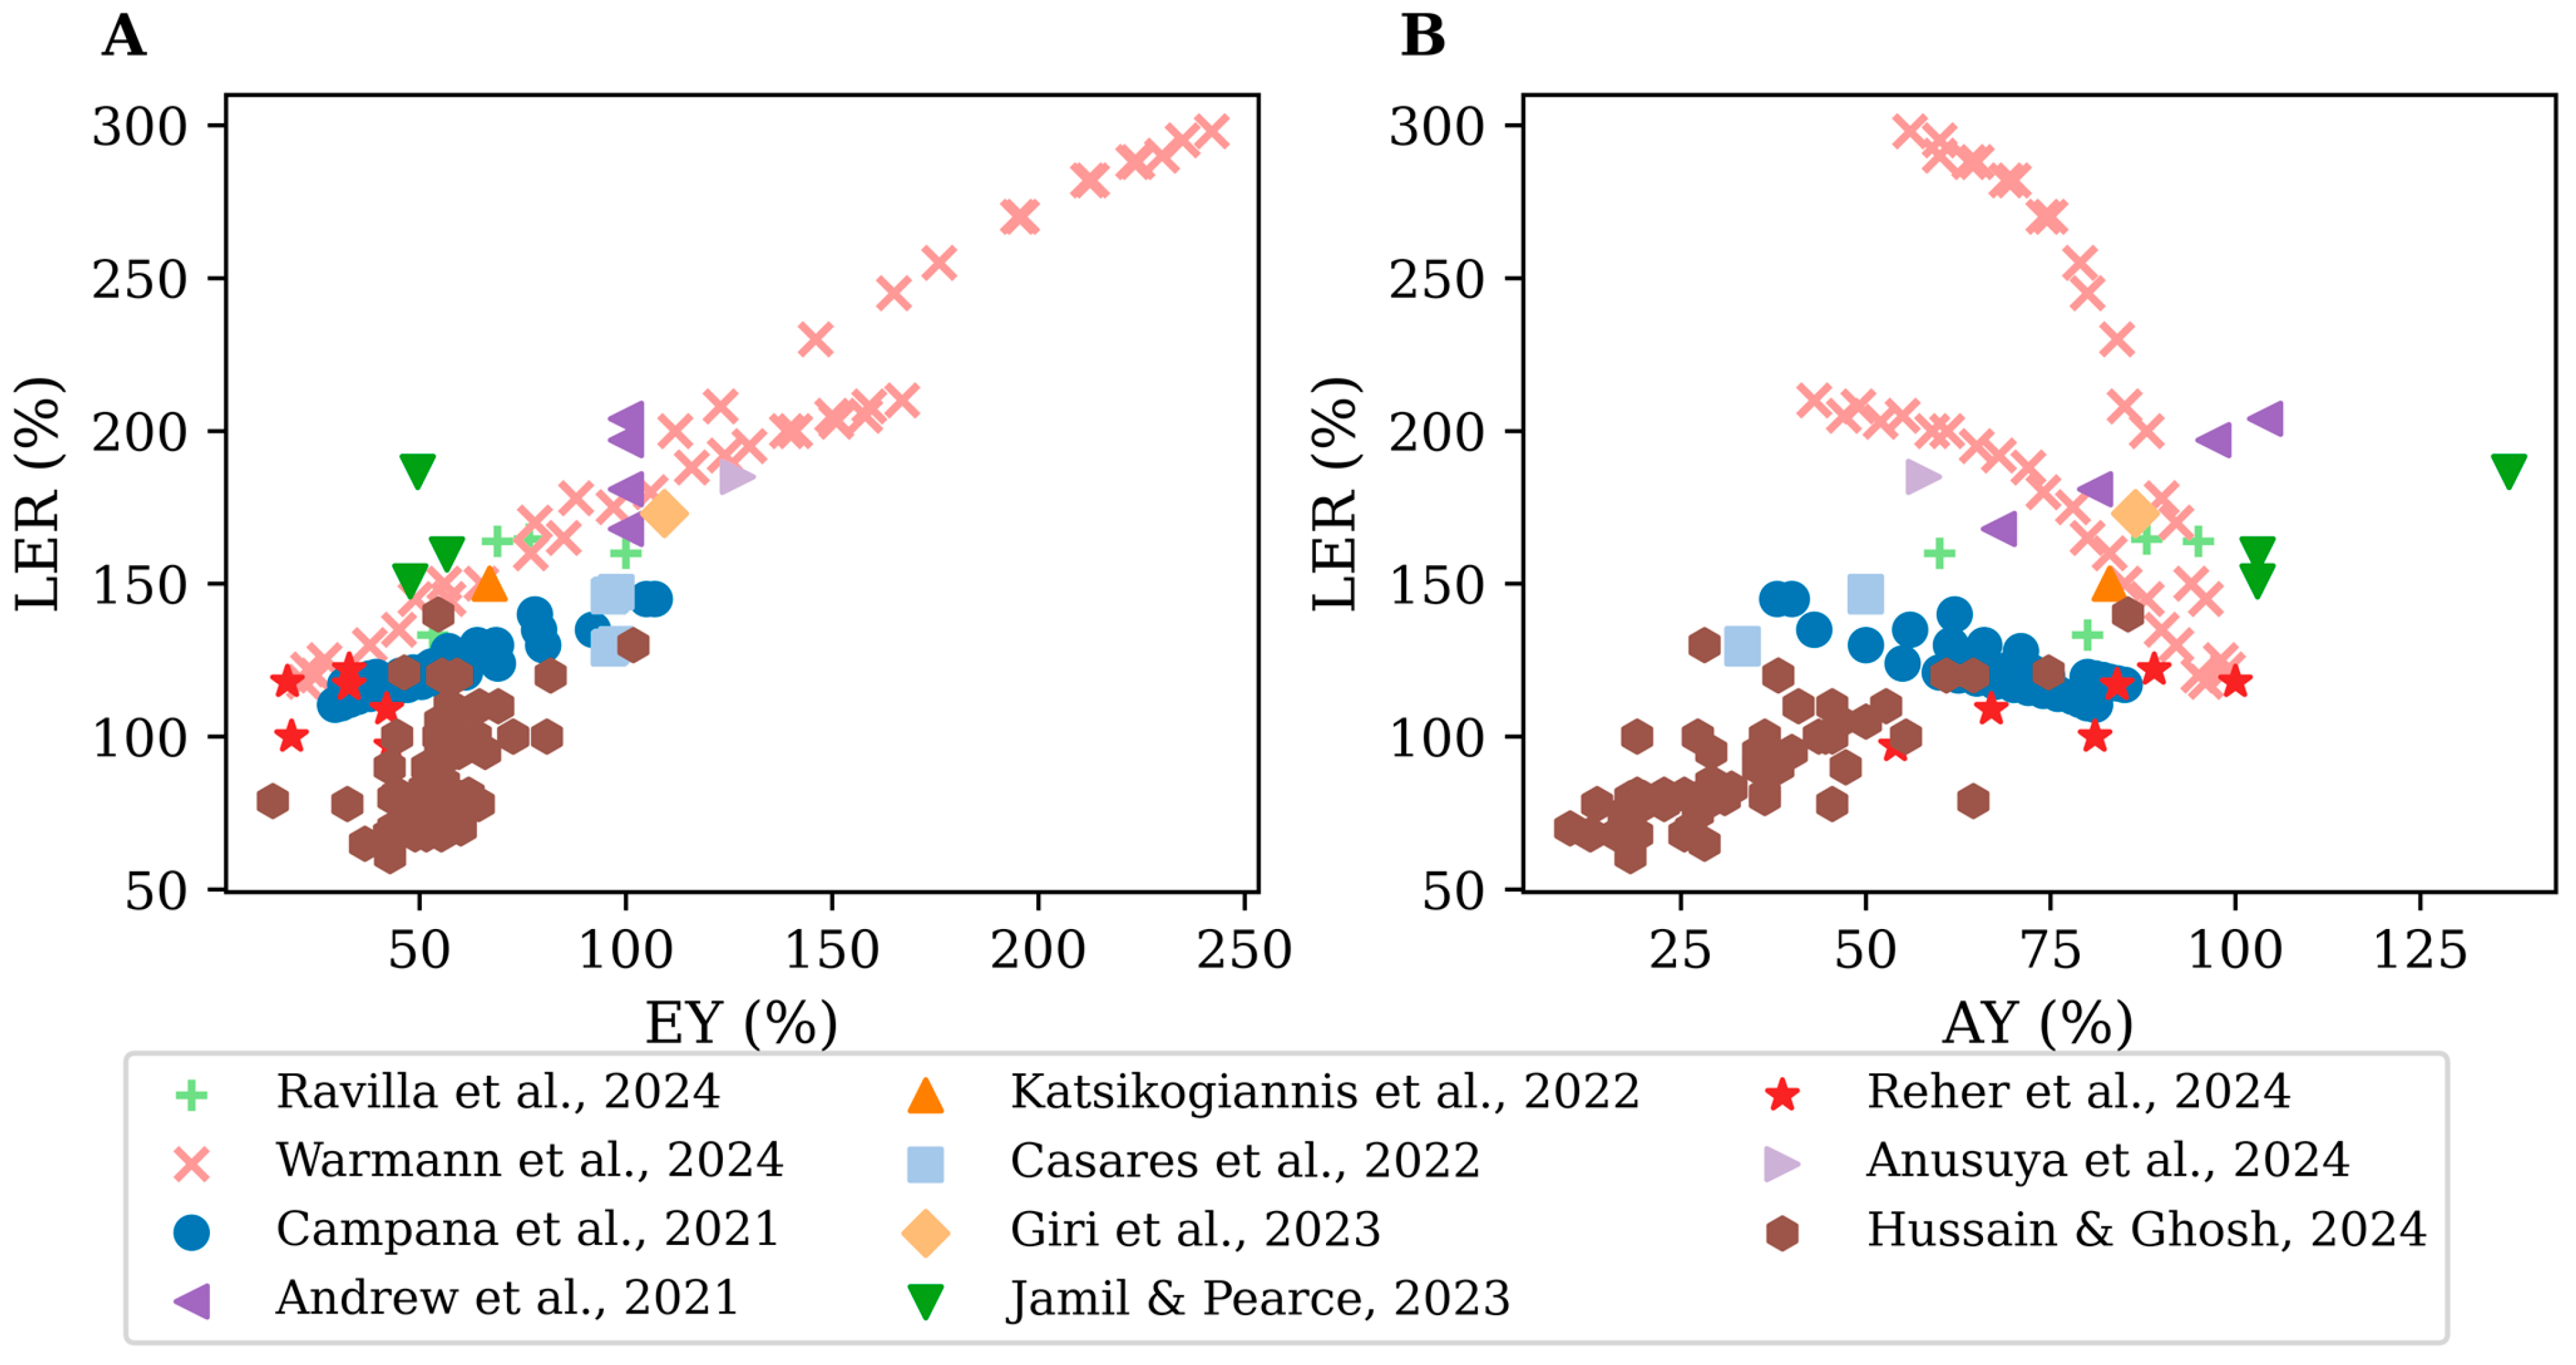
Similar to the GCR, the LER is consistently identified as a key indicator of dual efficiency, as it shows strong correlations with both design variables and performance metrics. From a design perspective, greater installation module height is associated with a reduction in LER (r = −0.50). In terms of productivity, LER exhibits a strong positive correlation with EY (r = 0.85), see Figure 8A, and a moderate association with AY (r = 0.58); see Figure 8B. This relationship increases initially under low GCR conditions and then tends to level off as gains in AY diminish with increasing coverage (see Figure 8B). Overall, these relationships confirm the role of LER as a synthetic metric for assessing the efficiency of dual land use in AVS [20,23,28,34,35,36,41,46,58,65,69].
In terms of environmental sustainability, water savings increase with GCR, EY, and LER, and decrease with AY. The LER shows a positive correlation with WS (r = 0.68), indicating that efficient dual land use can simultaneously enhance agro-energy production and water conservation. Likewise, EY is positively associated with WS (r = 0.79), whereas AY exhibits a strong negative correlation (r = −0.92), reflecting potential trade-offs in crops that are sensitive to shading.
From an economic standpoint, the LCOE decreases as inter-row spacing and GCR are optimized and is inversely related to the IRR, indicating that technical optimization enhances profitability. In terms of productivity, AY is sensitive to system design, decreasing with greater installation module height (r = −0.62) when inter-row spacing is not properly adjusted.
Contextual factors play a decisive role: in tropical climates, studies often report that high EY and LER values are observed together with low LCOE, albeit with potential risks to AY; in temperate climates, favorable balances between agricultural and energy performance are achieved; at high latitudes, AY is generally preserved at the expense of lower EY; and in Mediterranean or semi-arid regions, controlled shading enhances AY and LER while maintaining competitive EY
Regarding system configuration, fixed-tilt systems are frequently reported as providing a favorable overall balance, single-axis tracking maximize EY with potential economic and agricultural penalties, and vertical bifacial systems represent an attractive compromise. In terms of PV technology, bifacial modules, particularly semitransparent or vertically mounted configurations, achieve the most favorable dual-performance trade-offs. Finally, crops that tolerate partial shading maximize LER and AY, whereas species sensitive to reductions in PAR exhibit greater limitations.
Overall, the results suggest that optimal AVS performance depends on a multivariable design approach that integrates climate, geometry, PV technology, and crop selection. This integration enables the maximization of LER, EY, and AY, the reduction in LCOE, and the enhancement of IRR, thereby reinforcing the strategic role of AVS in a sustainable energy and food transition. These results should be interpreted as indicative patterns derived from heterogeneous studies, rather than universally generalizable relationships.

4. Discussion

The reviewed literature indicates that the impact of AVSs on agricultural productivity and sustainability arises from a complex interaction among structural, agronomic, climatic, and technological variables. Within this context, the GCR emerges as a consistently influential design parameter, although its effects vary depending on crop type, climate, and system configuration. Low GCR values (≤20%) are often associated with improved performance in shade-sensitive crops [20,23,27,28,35,42,46,55,56,57,60,68], whereas high values (>50%) may require optimized configurations to avoid yield reductions [20,23,35,39,58,63,65,69]. In combination with GCR, installation height, module tilt, and orientation regulate shading patterns and radiation capture, and therefore must be adapted to site-specific conditions and system objectives.
From an agronomic and economic perspective, crop selection and geographic location play a decisive and context-dependent role. Species that tolerate partial shading tend to show better adaptation, often achieving higher LER values and more favorable economic outcomes [6,41,66,78,89,92], whereas shade-sensitive crops may experience reductions in AY if sufficient radiation is not maintained during critical growth stages [53,58,82]. Climatic conditions further modulate these responses: in Mediterranean and semi-arid regions, controlled shading is frequently associated with improvements in AY and water-use efficiency [36,73,86,92], while in tropical climates, studies often report increases in EY accompanied by greater agronomic variability and potential risks [20,31,36,42,46,58,60,68,69,75,79].
These findings are consistent with the bibliometric analysis, which shows a transition from predominantly agronomic assessments toward integrated design and sustainability-oriented approaches, with increasing contributions from diverse agroclimatic regions. The expansion of international collaboration networks reinforces the need for context-specific AVS configurations adapted to local environmental and productive conditions.
These findings highlight the presence of inherent trade-offs between AY, EY, and sustainability metrics, which must be balanced through system design. For example, increasing GCR may enhance EY and water savings but can negatively affect AY, depending on crop sensitivity. Similarly, technological configurations such as tracking systems or high-density layouts may improve energy generation while introducing economic or agronomic constraints.
Overall, the evidence highlights inherent trade-offs between AY, EY, and sustainability metrics, which must be balanced through system design. For instance, increasing GCR may enhance EY and water savings but negatively affect AY depending on crop sensitivity, while advanced configurations such as tracking systems or high-density layouts can improve energy generation at the expense of higher costs or agronomic constraints. Consequently, the simultaneous optimization of EY and AY depends on a multivariable design approach integrating system geometry, GCR, PV technology (e.g., semitransparent or vertically mounted bifacial modules), and adaptive shading strategies [28,31,35,44,46,48,56,57,69]. This integration is reflected in higher LER values as a synthetic indicator of dual land-use efficiency, although its magnitude remains strongly site-dependent [23,58,82].
From a sustainability perspective, AVSs are frequently associated with competitive economic indicators, such as LCOE and IRR, as well as environmental benefits including CO2 emission reductions and water savings. Social acceptance also tends to increase when tangible benefits for farmers are evident and stakeholder engagement is incorporated early in project development. However, these outcomes are not uniform and depend significantly on technological choices, geographic conditions, and policy and regulatory frameworks [6,8,24,41,61,63,74,86].
Despite these contributions, several limitations must be considered. The heterogeneity of methodologies, system configurations, and performance indicators limits direct comparability and precludes a formal meta-analysis. In addition, reliance on secondary data introduces uncertainties associated with inconsistent reporting and incomplete datasets, particularly for integrated agronomic and economic variables. The absence of a standardized risk-of-bias assessment and the limited availability of complete datasets for correlation analysis further constrain the robustness of the findings. Moreover, the predominance of short-term and region-specific studies restricts extrapolation to other agroclimatic contexts, underscoring the need for long-term and geographically diverse research.
Overall, the evidence indicates that AVSs can deliver substantial agro-energy and environmental benefits; however, their performance is inherently context-dependent. Effective implementation therefore requires integrated and site-specific design optimization, considering crop selection, climatic conditions, and technological configuration, to ensure economic viability, maximize dual productivity (AY–EY), and enhance land-use efficiency.

5. Conclusions

The reviewed evidence suggests that AVSs can enable the joint optimization of agricultural yield (AY) and energy yield (EY) when system design is adapted to crop type and agroclimatic conditions. From a design perspective, the ground cover ratio (GCR) emerges as a consistently influential parameter, with intermediate values (≈31–40%) frequently reported as providing a favorable balance between AY and EY by enhancing the land equivalent ratio (LER) under specific conditions.
Technological configurations such as optimized fixed systems, adaptive tracking strategies, and the use of bifacial or semitransparent PV modules are commonly associated with improved dual performance. These configurations are also linked to environmental benefits, including water savings and reductions in CO2 emissions, as well as competitive economic indicators such as LCOE and IRR. However, these outcomes vary depending on system design, local conditions, and underlying assumptions.
Despite these promising trends, important limitations remain, including methodological heterogeneity across studies, the lack of standardized regulatory frameworks, and the limited number of studies addressing social acceptance.
Future research should prioritize long-term field experiments, the development of multivariable optimization models, and the harmonization of evaluation frameworks to improve comparability and scalability. Overall, AVSs represent a promising strategy for advancing sustainable energy transitions and enhancing food–energy synergies, provided that their design and implementation are context-specific and supported by appropriate policy frameworks.

Author Contributions

Conceptualization, C.F.L.-C. and F.N.J.-G.; Methodology, C.F.L.-C.; Formal analysis, C.F.L.-C. and F.N.J.-G.; Investigation, C.F.L.-C. and F.N.J.-G.; Writing—Original Draft, C.F.L.-C. and F.N.J.-G.; Visualization, C.F.L.-C.; Review and Editing, C.F.L.-C. and F.N.J.-G.; Data Curation, C.F.L.-C. and F.N.J.-G. All authors have read and agreed to the published version of the manuscript.

Funding

This research received no external funding.

Institutional Review Board Statement

Not applicable.

Data Availability Statement

The data that support the findings of this study are available in the repository (https://doi.org/10.17632/7v3n8j4t3r.1, accessed on 11 February 2026).

Acknowledgments

The authors acknowledge the support of the Ministry of Science, Technology and Innovation of Colombia (MinCiencias) and Universidad Santo Tomás, Seccional Villavicencio. The authors also thank the research groups that contributed to the development of this work.

Conflicts of Interest

The authors declare no conflicts of interest.

Abbreviations

The following abbreviations are used in this manuscript:
AVSAgrivoltaic Systems
AYAgricultural Yield
CAPEXCapital Expenditure
EYEnergy Yield
GCRGround Cover Ratio
IRRInternal Rate of Return
LERLand Equivalent Ratio
LCOELevelized Cost of Energy
OPEXOperational Expenditure
PARPhotosynthetically Active Radiation
PVPhotovoltaic
SATSingle-Axis Tracking

References

  1. Walston, L.J.; Barley, T.; Bhandari, I.; Campbell, B.; McCall, J.; Hartmann, H.M.; Dolezal, A.G. Opportunities for agrivoltaic systems to achieve synergistic food-energy-environmental needs and address sustainability goals. Front. Sustain. Food Syst. 2022, 6, 932018. [Google Scholar] [CrossRef] [Scilit]
  2. Pandey, G.; Lyden, S.; Franklin, E.; Harrison, M.T. Agrivoltaics as an SDG enabler: Trade-offs and co-benefits for food security, energy generation and emissions mitigation. Resour. Environ. Sustain. 2025, 19, 100186. [Google Scholar] [CrossRef] [Scilit]
  3. Cuppari, R.I.; Branscomb, A.; Graham, M.; Negash, F.; Smith, A.K.; Proctor, K.; Rupp, D.; Ayalew, A.T.; Tilaye, G.G.; Higgins, C.W.; et al. Agrivoltaics: Synergies and trade-offs in achieving the sustainable development goals at the global and local scale. Appl. Energy 2024, 362, 122970. [Google Scholar] [CrossRef] [Scilit]
  4. Goetzberger, A.; Zastrow, A. On the Coexistence of Solar-Energy Conversion and Plant Cultivation. Int. J. Sustain. Energy 1982, 1, 55–69. [Google Scholar] [CrossRef] [Scilit]
  5. Dupraz, C.; Marrou, H.; Talbot, G.; Dufour, L.; Nogier, A.; Ferard, Y. Combining solar photovoltaic panels and food crops for optimising land use: Towards new agrivoltaic schemes. Renew. Energy 2011, 36, 2725–2732. [Google Scholar] [CrossRef] [Scilit]
  6. Weselek, A.; Ehmann, A.; Zikeli, S.; Lewandowski, I.; Schindele, S.; Högy, P. Agrophotovoltaic systems: Applications, challenges, and opportunities. A review. Agron. Sustain. Dev. 2019, 39, 35. [Google Scholar] [CrossRef] [Scilit]
  7. Schindele, S. Crops and power from agricultural land: Definition of agrivoltaics and its use|Feldfrüchte und Strom von Agrarflächen: Was ist Agri-Photovoltaik und was kann sie leisten? GAIA-Ecol. Perspect. Sci. Soc. 2021, 30, 87–95. [Google Scholar] [CrossRef] [Scilit]
  8. Busch, C.; Wydra, K. Life Cycle Assessment of an Exemplary Agrivoltaic System in Thuringia (Germany). In AgriVoltaics Conference Proceedings; TIB Open Publishing: Hannover, Germany, 2024; Volume 1. [Google Scholar] [CrossRef] [Scilit]
  9. Torma, G.; Aschemann-Witzel, J. Social acceptance of dual land use approaches: Stakeholders’ perceptions of the drivers and barriers confronting agrivoltaics diffusion. J. Rural. Stud. 2023, 97, 610–625. [Google Scholar] [CrossRef] [Scilit]
  10. Marrou, H.; Guilioni, L.; Dufour, L.; Dupraz, C.; Wery, J. Microclimate under agrivoltaic systems: Is crop growth rate affected in the partial shade of solar panels? Agric. For. Meteorol. 2013, 177, 117–132. [Google Scholar] [CrossRef] [Scilit]
  11. Ramos-Fuentes, I.A.; Elamri, Y.; Cheviron, B.; Dejean, C.; Belaud, G.; Fumey, D. Effects of shade and deficit irrigation on maize growth and development in fixed and dynamic AgriVoltaic systems. Agric. Water Manag. 2023, 280, 108187. [Google Scholar] [CrossRef] [Scilit]
  12. Nakata, H.; Ogata, S. Integrating Agrivoltaic Systems into Local Industries: A Case Study and Economic Analysis of Rural Japan. Agronomy 2023, 13, 513. [Google Scholar] [CrossRef] [Scilit]
  13. Irie, N.; Kawahara, N.; Esteves, A.M. Sector-wide social impact scoping of agrivoltaic systems: A case study in Japan. Renew. Energy 2019, 139, 1463–1476. [Google Scholar] [CrossRef] [Scilit]
  14. Trommsdorff, M.; Kang, J.; Reise, C.; Schindele, S.; Bopp, G.; Ehmann, A.; Weselek, A.; Högy, P.; Obergfell, T. Combining food and energy production: Design of an agrivoltaic system applied in arable and vegetable farming in Germany. Renew. Sustain. Energy Rev. 2021, 140, 110694. [Google Scholar] [CrossRef] [Scilit]
  15. Toledo, C.; Scognamiglio, A. Agrivoltaic systems design and assessment: A critical review, and a descriptive model towards a sustainable landscape vision (three-dimensional agrivoltaic patterns). Sustainability 2021, 13, 6871. [Google Scholar] [CrossRef] [Scilit]
  16. Lee, S.; Lee, J.-H.; Jeong, Y.; Kim, D.; Seo, B.-H.; Seo, Y.-J.; Kim, T.; Choi, W. Agrivoltaic system designing for sustainability and smart farming: Agronomic aspects and design criteria with safety assessment. Appl. Energy 2023, 341, 121130. [Google Scholar] [CrossRef] [Scilit]
  17. Weselek, A.; Bauerle, A.; Hartung, J.; Zikeli, S.; Lewandowski, I.; Högy, P. Agrivoltaic system impacts on microclimate and yield of different crops within an organic crop rotation in a temperate climate. Agron. Sustain. Dev. 2021, 41, 59. [Google Scholar] [CrossRef] [Scilit]
  18. Valle, B.; Simonneau, T.; Sourd, F.; Pechier, P.; Hamard, P.; Frisson, T.; Ryckewaert, M.; Christophe, A. Increasing the total productivity of a land by combining mobile photovoltaic panels and food crops. Appl. Energy 2017, 206, 1495–1507. [Google Scholar] [CrossRef] [Scilit]
  19. Elamri, Y.; Cheviron, B.; Lopez, J.-M.; Dejean, C.; Belaud, G. Water budget and crop modelling for agrivoltaic systems: Application to irrigated lettuces. Agric. Water Manag. 2018, 208, 440–453. [Google Scholar] [CrossRef] [Scilit]
  20. Ravilla, A.; Shirkey, G.; Chen, J.; Jarchow, M.; Stary, O.; Celik, I. Techno-economic and life cycle assessment of agrivoltaic system (AVS) designs. Sci. Total Environ. 2024, 912, 169274. [Google Scholar] [CrossRef] [Scilit] [PubMed]
  21. Busch, C.; Wydra, K. Life cycle assessment of an agrivoltaic system with conventional potato production. J. Renew. Sustain. Energy 2023, 15, 043501. [Google Scholar] [CrossRef] [Scilit]
  22. Zahrawi, A.A.; Aly, A.M. A Review of Agrivoltaic Systems: Addressing Challenges and Enhancing Sustainability. Sustainability 2024, 16, 8271. [Google Scholar] [CrossRef] [Scilit]
  23. Warmann, E.; Jenerette, G.D.; A Barron-Gafford, G. Agrivoltaic system design tools for managing trade-offs between energy production, crop productivity and water consumption. Environ. Res. Lett. 2024, 19, 034046. [Google Scholar] [CrossRef] [Scilit]
  24. Adeh, E.H.; Selker, J.S.; Higgins, C.W. Remarkable agrivoltaic influence on soil moisture, micrometeorology and water-use efficiency. PLoS ONE 2018, 13, e0203256. [Google Scholar] [CrossRef] [Scilit]
  25. Page, M.J.; McKenzie, J.E.; Bossuyt, P.M.; Boutron, I.; Hoffmann, T.C.; Mulrow, C.D.; Shamseer, L.; Tetzlaff, J.M.; Akl, E.A.; Brennan, S.E.; et al. The PRISMA 2020 statement: An updated guideline for reporting systematic reviews. BMJ 2021, 372, 71. [Google Scholar] [CrossRef] [Scilit] [PubMed]
  26. Adeh, E.H.; Good, S.P.; Calaf, M.; Higgins, C.W. Solar PV Power Potential is Greatest Over Croplands. Sci. Rep. 2019, 9, 11442. [Google Scholar] [CrossRef] [Scilit]
  27. Parkinson, S.; Hunt, J. Economic Potential for Rainfed Agrivoltaics in Groundwater-Stressed Regions. Environ. Sci. Technol. Lett. 2020, 7, 525–531. [Google Scholar] [CrossRef] [Scilit]
  28. Campana, P.E.; Stridh, B.; Amaducci, S.; Colauzzi, M. Optimisation of vertically mounted agrivoltaic systems. J. Clean. Prod. 2021, 325, 129091. [Google Scholar] [CrossRef] [Scilit]
  29. Abidin, M.A.Z.; Mahyuddin, M.N.; Zainuri, M.A.A.M. Solar photovoltaic architecture and agronomic management in agrivoltaic system: A review. Sustainability 2021, 13, 7846. [Google Scholar] [CrossRef] [Scilit]
  30. Touil, S.; Richa, A.; Fizir, M.; Bingwa, B. Shading effect of photovoltaic panels on horticulture crops production: A mini review. Rev. Environ. Sci. Bio/Technol. 2021, 20, 281–296. [Google Scholar] [CrossRef] [Scilit]
  31. Jain, P.; Raina, G.; Sinha, S.; Malik, P.; Mathur, S. Agrovoltaics: Step towards sustainable energy-food combination. Bioresour. Technol. Rep. 2021, 15, 100766. [Google Scholar] [CrossRef] [Scilit]
  32. Velasco, M.H. Enabling year-round cultivation in the nordics-agrivoltaics and adaptive LED lighting control of daily light integral. Agriculture 2021, 11, 1255. [Google Scholar] [CrossRef] [Scilit]
  33. Schindele, S. Nachhaltige Landnutzung mit Agri-Photovoltaik: Photovoltaikausbau im Einklang mit der Lebensmittelproduktion: Szenarioanalyse zur Inanspruchnahme landwirtschaftlicher Nutzflächen durch Photovoltaik in Deutschland bis 2050. GAIA-Ecol. Perspect. Sci. Soc. 2021, 30, 96–105. [Google Scholar] [CrossRef] [Scilit]
  34. Andrew, A.C.; Higgins, C.W.; Smallman, M.A.; Graham, M.; Ates, S. Herbage Yield, Lamb Growth and Foraging Behavior in Agrivoltaic Production System. Front. Sustain. Food Syst. 2021, 5, 659175. [Google Scholar] [CrossRef] [Scilit]
  35. Katsikogiannis, O.A.; Ziar, H.; Isabella, O. Integration of bifacial photovoltaics in agrivoltaic systems: A synergistic design approach. Appl. Energy 2022, 309, 118475. [Google Scholar] [CrossRef] [Scilit]
  36. De la Torre, F.C.; Varo, M.; López-Luque, R.; Ramírez-Faz, J.; Fernández-Ahumada, L. Design and analysis of a tracking/backtracking strategy for PV plants with horizontal trackers after their conversion to agrivoltaic plants. Renew. Energy 2022, 187, 537–550. [Google Scholar] [CrossRef] [Scilit]
  37. Ursu, D.; Vajda, M.; Miclau, M. Highly efficient dye-sensitized solar cells for wavelength-selective greenhouse: A promising agrivoltaic system. Int. J. Energy Res. 2022, 46, 18550–18561. [Google Scholar] [CrossRef] [Scilit]
  38. Camporese, M.; Najm, M.A. Not All Light Spectra Were Created Equal: Can We Harvest Light for Optimum Food-Energy Co-Generation? Earth’s Futur. 2022, 10, e2022EF002900. [Google Scholar] [CrossRef] [Scilit]
  39. Cossu, M.; Tiloca, M.T.; Cossu, A.; Deligios, P.A.; Pala, T.; Ledda, L. Increasing the agricultural sustainability of closed agrivoltaic systems with the integration of vertical farming: A case study on baby-leaf lettuce. Appl. Energy 2023, 344, 121278. [Google Scholar] [CrossRef] [Scilit]
  40. Gomez-Casanovas, N.; Mwebaze, P.; Khanna, M.; Branham, B.; Time, A.; DeLucia, E.H.; Bernacchi, C.J.; Knapp, A.K.; Hoque, M.J.; Du, X.; et al. Knowns, uncertainties, and challenges in agrivoltaics to sustainably intensify energy and food production. Cell Rep. Phys. Sci. 2023, 4, 101518. [Google Scholar] [CrossRef] [Scilit]
  41. Giri, N.C.; Mohanty, R.C.; Pradhan, R.C.; Abdullah, S.; Ghosh, U.; Mukherjee, A. Agrivoltaic system for energy-food production: A symbiotic approach on strategy, modelling, and optimization. Sustain. Comput. Inform. Syst. 2023, 40, 100915. [Google Scholar] [CrossRef] [Scilit]
  42. Zainali, S.; Lu, S.M.; Stridh, B.; Avelin, A.; Amaducci, S.; Colauzzi, M.; Campana, P.E. Direct and diffuse shading factors modelling for the most representative agrivoltaic system layouts. Appl. Energy 2023, 339, 120981. [Google Scholar] [CrossRef] [Scilit]
  43. Jamil, U.; Pearce, J.M. Energy Policy for Agrivoltaics in Alberta Canada. Energies 2023, 16, 53. [Google Scholar] [CrossRef] [Scilit]
  44. Mengi, E.; Samara, O.A.; Zohdi, T.I. Crop-driven optimization of agrivoltaics using a digital-replica framework. Smart Agric. Technol. 2023, 4, 100168. [Google Scholar] [CrossRef] [Scilit]
  45. Charles, M.; Edwards, B.; Ravishankar, E.; Calero, J.; Henry, R.; Rech, J.; Saravitz, C.; You, W.; Ade, H.; O’cOnnor, B.; et al. Emergent molecular traits of lettuce and tomato grown under wavelength-selective solar cells. Front. Plant Sci. 2023, 14, 1087707. [Google Scholar] [CrossRef] [Scilit] [PubMed]
  46. Jamil, U.; Pearce, J.M. Maximizing Biomass with Agrivoltaics: Potential and Policy in Saskatchewan Canada. Biomass 2023, 3, 188–216. [Google Scholar] [CrossRef] [Scilit]
  47. Kim, S.; Kim, S. Design of an Agrivoltaic System with Building Integrated Photovoltaics. Agronomy 2023, 13, 2140. [Google Scholar] [CrossRef] [Scilit]
  48. Ko, D.-Y.; Chae, S.-H.; Moon, H.-W.; Kim, H.J.; Seong, J.; Lee, M.-S.; Ku, K.-M. Agrivoltaic Farming Insights: A Case Study on the Cultivation and Quality of Kimchi Cabbage and Garlic. Agronomy 2023, 13, 2625. [Google Scholar] [CrossRef] [Scilit]
  49. Ya’Acob, M.; Lu, L.; Zulkifli, S.; Roslan, N.; Ahmad, W.W. Agrivoltaic approach in improving soil resistivity in large scale solar farms for energy sustainability. Appl. Energy 2023, 352, 121943. [Google Scholar] [CrossRef] [Scilit]
  50. Kuo, C.-F.J.; Su, T.-L.; Huang, C.-Y.; Liu, H.-C.; Barman, J.; Kar, I. Design and Development of a Symbiotic Agrivoltaic System for the Coexistence of Sustainable Solar Electricity Generation and Agriculture. Sustainability 2023, 15, 6011. [Google Scholar] [CrossRef] [Scilit]
  51. Othman, N.F.; Ya’acob, M.E.; Lu, L.; Jamaluddin, A.H.; Su, A.S.M.; Hizam, H.; Shamsudin, R.; Jaafar, J.N. Advancement in Agriculture Approaches with Agrivoltaics Natural Cooling in Large Scale Solar PV Farms. Agriculture 2023, 13, 854. [Google Scholar] [CrossRef] [Scilit]
  52. Mo, T.; Lee, H.; Oh, S.; Lee, H.; Kim, B.H.S. Economic Efficiency of Climate Smart Agriculture Technology: Case of Agrophotovoltaics. Land 2023, 12, 90. [Google Scholar] [CrossRef] [Scilit]
  53. Rahmaniah, F.; Tay, S.E.R. Environmental benefits of co-located photovoltaic and greenery systems: A review on the operational performance and assessment framework across climate zones. Sustain. Energy Technol. Assess. 2023, 58, 103301. [Google Scholar] [CrossRef] [Scilit]
  54. Shams, S.M.N.; Mojumder, T.H.; Khan, F.H.; Shuvo, K.H. Assessing the Efficiency of a Proposed Agrivoltaic System in Bangladesh to Ensure Multiple Uses of Land and Water. Dhaka Univ. J. Earth Environ. Sci. 2023, 11, 33–41. [Google Scholar] [CrossRef] [Scilit]
  55. Podgoršek, J. Razvoj kmetijske rabe na območju fotovoltaične elektrarne D3 ob pretočni akumulaciji HE Brežice. Acta Agric. Slov. 2023, 119, 1–10. [Google Scholar] [CrossRef] [Scilit]
  56. Elkadeem, M.R.; Zainali, S.; Lu, S.M.; Younes, A.; Abido, M.A.; Amaducci, S.; Croci, M.; Zhang, J.; Landelius, T.; Stridh, B.; et al. Agrivoltaic systems potentials in Sweden: A geospatial-assisted multi-criteria analysis. Appl. Energy 2024, 356, 122108. [Google Scholar] [CrossRef] [Scilit]
  57. Mouhib, E.; Fernández-Solas, Á.; Pérez-Higueras, P.J.; Fernández-Ocaña, A.M.; Micheli, L.; Almonacid, F.; Fernández, E.F. Enhancing land use: Integrating bifacial PV and olive trees in agrivoltaic systems. Appl. Energy 2024, 359, 122660. [Google Scholar] [CrossRef] [Scilit]
  58. Reher, T.; Lavaert, C.; Willockx, B.; Huyghe, Y.; Bisschop, J.; Martens, J.A.; Diels, J.; Cappelle, J.; Van de Poel, B. Potential of sugar beet (Beta vulgaris) and wheat (Triticum aestivum) production in vertical bifacial, tracked, or elevated agrivoltaic systems in Belgium. Appl. Energy 2024, 359, 122679. [Google Scholar] [CrossRef] [Scilit]
  59. Asa’a, S.; Reher, T.; Rongé, J.; Diels, J.; Poortmans, J.; Radhakrishnan, H.; van der Heide, A.; Van de Poel, B.; Daenen, M. A multidisciplinary view on agrivoltaics: Future of energy and agriculture. Renew. Sustain. Energy Rev. 2024, 200, 114515. [Google Scholar] [CrossRef] [Scilit]
  60. Temiz, M.; Dincer, I. Development of concentrated solar and agrivoltaic based system to generate water, food and energy with hydrogen for sustainable agriculture. Appl. Energy 2024, 358, 122539. [Google Scholar] [CrossRef] [Scilit]
  61. Adelhardt, N.; Berneiser, J. Risk analysis for agrivoltaic projects in rural farming communities in SSA. Appl. Energy 2024, 362, 122933. [Google Scholar] [CrossRef] [Scilit]
  62. Time, A.; Gomez-Casanovas, N.; Mwebaze, P.; Apollon, W.; Khanna, M.; DeLucia, E.H.; Bernacchi, C.J. Conservation agrivoltaics for sustainable food-energy production. Plants People Planet 2024, 6, 558–569. [Google Scholar] [CrossRef] [Scilit]
  63. Xia, Z.; Li, Y.; Guo, S.; Jia, N.; Pan, X.; Mu, H.; Chen, R.; Guo, M.; Du, P. Balancing photovoltaic development and cropland protection: Assessing agrivoltaic potential in China. Sustain. Prod. Consum. 2024, 50, 205–215. [Google Scholar] [CrossRef] [Scilit]
  64. Zotti, M.; Mazzoleni, S.; Mercaldo, L.V.; Della Noce, M.; Ferrara, M.; Veneri, P.D.; Diano, M.; Esposito, S.; Cartenì, F. Testing the effect of semi-transparent spectrally selective thin film photovoltaics for agrivoltaic application: A multi-experimental and multi-specific approach. Heliyon 2024, 10, e26323. [Google Scholar] [CrossRef] [Scilit]
  65. Anusuya, K.; Vijayakumar, K.; Martin, M.L.J.; Manikandan, S. Agrophotovoltaics: Enhancing solar land use efficiency for energy food water nexus. Renew. Energy Focus 2024, 50, 100600. [Google Scholar] [CrossRef] [Scilit]
  66. Magarelli, A.; Mazzeo, A.; Ferrara, G. Fruit Crop Species with Agrivoltaic Systems: A Critical Review. Agronomy 2024, 14, 722. [Google Scholar] [CrossRef] [Scilit]
  67. Agyekum, E.B. A comprehensive review of two decades of research on agrivoltaics, a promising new method for electricity and food production. Sustain. Energy Technol. Assess. 2024, 72, 104055. [Google Scholar] [CrossRef] [Scilit]
  68. Hasan, Y.; Lubitz, W.D. A Sustainable Agri-Photovoltaic Greenhouse for Lettuce Production in Qatar. Energies 2024, 17, 4937. [Google Scholar] [CrossRef] [Scilit]
  69. Hussain, S.N.; Ghosh, A. Evaluating tracking bifacial solar PV based agrivoltaics system across the UK. Sol. Energy 2024, 284, 113102. [Google Scholar] [CrossRef] [Scilit]
  70. Varo-Martínez, M.; Fernández-Ahumada, L.; Ramírez-Faz, J.; Ruiz-Jiménez, R.; López-Luque, R. Methodology for the estimation of cultivable space in photovoltaic installations with dual-axis trackers for their reconversion to agrivoltaic plants. Appl. Energy 2024, 361, 122952. [Google Scholar] [CrossRef] [Scilit]
  71. Zito, F.; Giannoccaro, N.I.; Serio, R.; Strazzella, S. Analysis and Development of an IoT System for an Agrivoltaics Plant. Technologies 2024, 12, 106. [Google Scholar] [CrossRef] [Scilit]
  72. Lewandowski, I.; von Cossel, M.; Winkler, B.; Bauerle, A.; Gaudet, N.; Kiesel, A.; Lewin, E.; Magenau, E.; Vidaurre, N.A.M.; Müller, B.; et al. An Adapted Indicator Framework for Evaluating the Potential Contribution of Bioeconomy Approaches to Agricultural Systems Resilience. Adv. Sustain. Syst. 2024, 8, 2300518. [Google Scholar] [CrossRef] [Scilit]
  73. Maity, R.; Sudhakar, K.; Razak, A.A. Agri-solar water pumping design, energy, and environmental analysis: A comprehensive study in tropical humid climate. Heliyon 2024, 10, e39604. [Google Scholar] [CrossRef] [Scilit]
  74. Bosman, L.; Kádár, J.; Yonnie, B.; LeGrande, A. How Market Transformation Policies Can Support Agrivoltaic Adoption. Sustainability 2024, 16, 11172. [Google Scholar] [CrossRef] [Scilit]
  75. Gupta, V.; Gruss, S.M.; Cammarano, D.; Brouder, S.M.; Bermel, P.A.; Tuinstra, M.R.; Gitau, M.W.; Agrawal, R. Optimizing corn agrivoltaic farming through farm-scale experimentation and modeling. Cell Rep. Sustain. 2024, 1, 100148. [Google Scholar] [CrossRef] [Scilit]
  76. Hu, Z. Doomed in the agrivoltaic campaign? The case of Chinese smallholder agriculture in the deployment of agrivoltaic projects. Energy Sustain. Dev. 2024, 83, 101562. [Google Scholar] [CrossRef] [Scilit]
  77. Oktarina, Y.; Nawawi, Z.; Suprapto, B.Y.; Dewi, T. Towards ecological sustainability: Harvest prediction in agrivoltaic chili farming with CNN transfer learning. Iraqi J. Agric. Sci. 2024, 55, 1910–1926. [Google Scholar] [CrossRef] [Scilit]
  78. Strub, L.; Wittke, M.; Trommsdorff, M.; Stoll, M.; Kammann, C.; Loose, S. Assessing the economic performance of agrivoltaic systems in vineyards–framework development, simulated scenarios and directions for future research. Front. Hortic. 2024, 3, 1473072. [Google Scholar] [CrossRef] [Scilit]
  79. Varo-Martínez, M.; López-Bernal, A.; de Ahumada, L.F.; López-Luque, R.; Villalobos, F. Simulation model for electrical and agricultural productivity of an olive hedgerow Agrivoltaic system. J. Clean. Prod. 2024, 477, 143888. [Google Scholar] [CrossRef] [Scilit]
  80. Vaughan, A.; Brent, A. Agrivoltaics for small ruminants: A review. Small Rumin. Res. 2024, 241, 107393. [Google Scholar] [CrossRef] [Scilit]
  81. Imtihan, K.; Harjadi, B.; Ilahude, Z.; Bandrang, T.N.; Azmi, Y.; Nurhayati; Andiyan, A. Green Energy Growth: Enhancing Agricultural Sustainability through Agrivoltaic Solutions in the Modern Era. Evol. Stud. Imaginative Cult. 2024, 8, 671–680. [Google Scholar] [CrossRef] [Scilit]
  82. Mohammad, G.; Ghosh, H.; Mitra, K.; Saha, N. Sun, Soil, and Sustainability: Opportunities and Challenges of Agri-Voltaic Systems in India. Curr. Agric. Res. J. 2024, 12, 49–62. [Google Scholar] [CrossRef] [Scilit]
  83. Jain, S. Agrivoltaics: The Synergy between Solar Panels and Agricultural Production. Darpan Int. Res. Anal. 2024, 12, 137–148. [Google Scholar] [CrossRef] [Scilit]
  84. Chen, S.; Wang, Y.; Lu, X.; He, K.; Hao, J. Global disparity in synergy of solar power and vegetation growth. Environ. Res. Lett. 2025, 20, 014066. [Google Scholar] [CrossRef] [Scilit]
  85. Dardenne, B.; Latteur, P. Structural optimisation of free-swinging agrivoltaic fences. Renew. Sustain. Energy Rev. 2025, 210, 115160. [Google Scholar] [CrossRef] [Scilit]
  86. De Falco, M.; Sarrica, M.; Scognamiglio, A.; Fasanelli, R. What does Agrivoltaics mean? A study on social representations shared by experts and the press in Italy. Energy Res. Soc. Sci. 2025, 119, 103918. [Google Scholar] [CrossRef] [Scilit]
  87. De Francesco, C.; Centorame, L.; Toscano, G.; Duca, D. Opportunities, Technological Challenges and Monitoring Approaches in Agrivoltaic Systems for Sustainable Management. Sustainability 2025, 17, 634. [Google Scholar] [CrossRef] [Scilit]
  88. Stewart, W.; Scasta, J.; Maierle, C.; Ates, S.; Burke, J.; Campbell, B. Vegetation management utilizing sheep grazing within utility-scale solar: Agro-ecological insights and existing knowledge gaps in the United States. Small Rumin. Res. 2025, 243, 107439. [Google Scholar] [CrossRef] [Scilit]
  89. Curioni, M.; Galli, N.; Manzolini, G.; Rulli, M.C. Global Land-Water Competition and Synergy Between Solar Energy and Agriculture. Earth’s Futur. 2025, 13, e2024EF005291. [Google Scholar] [CrossRef] [Scilit]
  90. Omer, A.A.A.; Zhang, F.; Li, M.; Zhang, X.; Zhao, F.; Ma, W.; Liu, W. Understanding Trends, Influences, Intellectual Structures, and Future Directions in Agrivoltaic Systems Research: A Bibliometric and Thematic Analysis. World 2025, 6, 2. [Google Scholar] [CrossRef] [Scilit]
  91. Zhang, Y.; Chen, T.; Gasparri, E.; Lucchi, E. A Modular Agrivoltaics Building Envelope Integrating Thin-Film Photovoltaics and Hydroponic Urban Farming Systems: A Circular Design Approach with the Multi-Objective Optimization of Energy, Light, Water and Structure. Sustainability 2025, 17, 666. [Google Scholar] [CrossRef] [Scilit]
  92. Magarelli, A.; Mazzeo, A.; Ferrara, G. Exploring the Grape Agrivoltaic System: Climate Modulation and Vine Benefits in the Puglia Region, Southeastern Italy. Horticulturae 2025, 11, 160. [Google Scholar] [CrossRef] [Scilit]
  93. Ukwu, U.N.; Muller, O.; Meier-Grüll, M.; Uguru, M.I. Agrivoltaics shading enhanced the microclimate, photosynthesis, growth and yields of vigna radiata genotypes in tropical Nigeria. Sci. Rep. 2025, 15, 1190. [Google Scholar] [CrossRef] [Scilit]
Figure 1. PRISMA flow diagram for the study selection process.
World 07 00071 g001
Figure 2. Co-authorship network analysis by country: node size represents citation count, and node color indicates the average year of publication.
World 07 00071 g002
Figure 3. Co-authorship network analysis by author: node size represents citation count, and node color indicates the average year of publication.
World 07 00071 g003
Figure 4. Citation network among publication sources: each node corresponds to a source (node size is proportional to citations), links represent inter-journal citation relationships, and node color indicates the average year of publication.
World 07 00071 g004
Figure 5. Keyword co-occurrence map, 2021–2024 evolution: node size represents term frequency, and node color indicates the average year of publication.
World 07 00071 g005
Figure 6. Heat map of (A) p-values indicating statistical significance and (B) correlation coefficients (r).
World 07 00071 g006
Figure 7. GCR relationship with (A) energy yield, (B) LCOE, (C) water saving, (D) CO2 emissions. Note: WS means water savings. Adapted from [20,23,28,34,35,36,41,46,58,65,69,92].
World 07 00071 g007
Figure 8. LER relationship with (A) EY and (B) AY. Adapted from [20,23,28,34,35,36,41,46,58,65,69].
World 07 00071 g008
Table 1. Chronological summary of scientific output and citations per article.
Year of PublicationNumber of PublicationsCitations Per YearCitations Per Study
20181236Study [24] with 236 citations
20192540Study [6] with 331 citations; study [26] with 209 citations
2020126Study [27] with 26 citations
20219433Study [15] with 143 citations; [28] with 92; [29] with 74; [30] with 64; [31] with 34; [32] with 12; [7,33,34] with fewer than 10 citations
20225183Study [35] with 70 citations; [36] with 47; [1] with 42; [37] with 18; [38] with 6 citations
202319192Study [9] with 30 citations; [39,40] with 22; [41,42] with 19; [43] with 11, [44] with 10; [16,45,46,47,48,49,50,51,52,53] with fewer than 10 citations; [54,55] without citations
202432119Study [56] with 15 citations; [20,57] with 13; [58] with 12; [59] with 10; [23,60] with 7; [61] with 6; [62] with 5; [63,64] with 4; [22,65,66] with 3; [8,67,68,69,70,71] with 2; [72,73] with 1; [61,74,75,76,77,78,79,80,81,82,83] without citations.
2025100Studies [84,85,86,87,88,89,90,91,92,93] without citations due to recent publication
Table 2. Types of support structures for PV modules (E-W means east–west and N–S north–south).
TypeDescriptionReferences
Fixed tiltTilt angles optimized according to latitude, simple design, low cost, and stable EY. Moderate daily and seasonal shading.[8,9,16,20,23,24,26,32,34,35,39,41,44,45,46,47,50,51,55,57,58,60,63,64,65,68,69,73,78,83,92,93]
Fixed verticalβ ≈ 90° and E-W orientation. Capture of direct, reflected, and diffuse radiation; low shading and reduced horizontal land occupation; suitable for pasture crops.[20,28,31,42,46,56,57,58,60,91]
Free-swinging structureOptimized azimuth; β ≈ 90°. Suspended modules that oscillate with wind, reducing structural loads and foundation costs.[85]
SATN–S axis with E-W rotation. High efficiency and strong performance during critical hours. Increases EY by approximately 10–35%. Higher initial investment than fixed systems; lower GCR due to increased spacing.[20,31,36,42,46,58,60,68,69,75,79]
Dual-Axis Solar TrackingVariable angles (β, γ) according to solar position. Maximum energy capture, but higher CAPEX/OPEX and greater system complexity.[20,42,70]
Retractable structuresVariable angles with manual or automatic adjustment depending on climate and crop. Enable low-cost optimization of shading; require intervention and/or automation.[58,82]
Integration of PV panels in greenhousesModules installed on greenhouse roofs; control microclimate and enable agri-solar cogeneration.[32,37,39,45,64,68,77]
Building-integrated structuresPV panels integrated into roofs or facades; leverage existing infrastructure and improve land-use efficiency.[47,91]
Table 3. Observed trends in PV module installation height (MH means module height).
TrendDescriptionReferences
Low MH (1–2 m)Applied mainly in experimental AVS or for low-growing crops; often limits the use of agricultural machinery.[15,24,26,28,29,34,36,41,42,46,51,54,55,58,60,89]
Intermediate MH (2–4 m)Enhances module ventilation and allows limited mechanized operations; preferred option in productive, commercial applications.[7,15,16,23,29,31,33,35,39,42,48,49,57,63,65,70,79,81,85,91,93]
High MH (4–6 m)Common when full agricultural machinery access and high operability are required; entails higher CAPEX due to structural reinforcement.[1,6,20,29,31,35,50,60,68,69,75,82]
Table 4. Trends in inter-row spacing of PV modules.
Observed TrendDescriptionReferences
5–10 m (most common)Balanced configuration between radiation capture by PV modules and diffuse light availability for crops; facilitates machinery access.[20,23,24,26,28,35,42,55,57,58,63,75,79]
<5 mAssociated with high-density fixed systems and low-growing crops; increases GCR but may restrict mechanized access and reduce irradiance reaching the crop.[16,20,23,41,47,58,60,63,65,69,82,89,92]
>10 mTypical of vertical modules or tracking systems, where larger spacing is required to avoid shading during module movement.[23,28,31,36,63,70,79]
Table 5. Technological trends of PV modules in agrivoltaic systems.
Observed TrendsCharacteristicsReferences
Dominance of crystalline siliconMonocrystalline: high efficiency (~18–22%) and strong performance in space-constrained layouts. Polycrystalline: lower cost with moderate efficiency (~15–17%).[20,41,46,49,50,51,68,69]
Growing use of bifacial modulesEnergy capture on both faces; generation gains of ~5–15% compared to monofacial modules. Vertical E-W configurations improve light distribution and reduce shading on crops.[28,31,35,44,46,48,56,57,69]
Translucent technologiesAllow transmission of PAR, making them suitable for shade-sensitive crops or greenhouse applications[31,35,37,38,45,47,64,78,82,91]
Thin-film technologiesLower weight, improved esthetics, and flexibility; currently limited by lower efficiency and durability.[64,91,92]
Recent innovationsSpectrum-filtering modules and organic PV with adjustable transparency for high-value crops.[37,38,45,64]
Table 6. Ground cover ratio.
GCR (%)CharacteristicsReferences
≤20%Low density. High light availability to crops; minimal microclimatic impact. Suitable for crops highly sensitive to shading or for systems with tall support structures.[20,23,27,28,35,42,46,55,56,57,60,68]
21–30%Low to moderate density. Initial balance between AY and EY; commonly applied in high-irradiance climates and in crops with partial shade tolerance.[16,20,23,24,27,28,31,33,34,35,48,58]
31–40%Moderate density (one of the most common configurations). Provides a favorable balance between beneficial shading and PV performance; widely adopted in dual-purpose AVSs.[16,20,23,27,28,31,33,35,36,37,48,52,60,75]
41–50%High density. Significantly increases EY; may reduce AY unless shade-tolerant crops are used or mobile/tracking designs are implemented to mitigate excessive shading.[20,23,28,35,46,47,52,63,92]
>50%Very high density. Maximizes energy utilization, applicable only in specialized designs or with highly adapted crops. There is a risk of reducing the LER if the microclimate is not adequately controlled.[20,23,35,39,58,63,65,69]
Table 7. Agricultural yield by reported ranges and crop types.
AY (%)CharacteristicsReferences
0–25%Strong yield penalty: highly shade-sensitive crops or high GCR values combined with poor light distribution; non-optimized cases (e.g., potato cultivation with GCR ≈ 60%).[69]
26–50%Significant yield losses; partial compatibility with GCR values of approximately 40–60% or with poorly adapted system designs. Representative examples include oats, rapeseed, spinach, Napier grass, maize, peanut, olive, potato, soybean, wheat, and grape.[23,28,36,47,54,63,69,78,82]
51–75%Moderate yield reduction; systems with GCR values of 30–40%, appropriate orientation, and in some cases bifacial modules or elevated structures. Representative crops include rice, oats, eggplant, calendula, sugarcane, fruits, hibiscus, lettuce, okra, potato, pastures, tomato, wheat, and grape.[20,23,27,28,34,44,58,60,63,65,69,78,82]
76–100%Equivalent to the control (upper end of the range) or showing a slight reduction; shade-tolerant crops combined with well-optimized system designs. Representative examples include blueberries, rice, oats, broccoli, turmeric, spinach, forages, raspberry, bean, legumes, lettuce, maize, mustard, olive, potato, pastures, beet, cabbage, tomato, wheat, and grape.[16,20,23,26,27,28,34,35,41,45,48,52,55,57,60,64,68,69,75,78,79,82,92,93]
101–200%Substantial improvement driven by a favorable microclimate and/or complementary agronomic practices. Representative examples include cotton, asparagus, bean, lettuce, potato, pastures, tomato, wheat, and vegetables.[8,24,27,31,34,46,55,64,93]
>200%High yield gains in systems with low shading and highly adapted crops or under extreme climatic conditions where shading protects crop performance. Representative examples include grasses in pasture systems and grapevine.[24,92]
Table 8. Energy yield.
EY (%)CharacteristicsReferences
<50%Low PV coverage or experimental/modeled designs with very low GCR (~1–20%). Useful for preserving AY but with limited energy production compared to reference PV systems.[23,28,46,58,69]
50–100%Agri-energy compromise: intermediate GCR values (~30–40%) and adequate geometry; EY comparable to reference PV systems without markedly penalizing AY.[16,20,23,28,34,35,36,46,50,57,69,92,93]
>100%Enhanced EY: high GCR and/or bifacial or tracking configurations; possible contribution from evaporative cooling of the canopy and crop albedo. Risk of reducing AY if design is not properly adjusted.[23,28,31,41,65,69,79,93]
Table 9. Land equivalent ratio.
LER (%)DescriptionReferences
<100%Typical of non-optimized designs, suboptimal GCR values under cold or winter-dominated climates or crops highly sensitive to shading.[58,69]
100–<150%Moderate efficiency: AVSs outperform single land-use systems with reasonable trade-offs between AY and EY (balanced designs, intermediate GCR).[16,20,23,28,36,39,50,58,69]
150–<200%High efficiency: intensive and well-balanced land use; usually includes GCR values of 31–40%, adequate installation module height and inter-row spacing; commonly associated with bifacial technology or SAT.[16,20,23,34,35,39,41,46,50,57,62,65,79,93]
≥200%Very high efficiency: optimized cases under favorable climates and shade-adapted crops, or theoretical reference models.[23,31,34,92]
Table 10. Economic indicators of AVSs.
AVS DescriptionIRR (%)LCOE (USD/MWh)Ref.
Modeled 1 MWp, half-spacing, rainfed crops; regions with subsurface water stress.-50–100[27]
Static monofacial polycrystalline, GCR 40%, module height = 1 m; turmeric (India). β = 40°, γ = S–E; 0.675 kWp. Payback 7–9 years.1523[41]
Optimized static, GCR 40%, h = 6 m (Tainan, Taiwan). β = 15°, γ = S; 25.53 kWp.10.88-[50]
Belgium, bifacial modules: AVS1 vertical (beet, Grembergen); AVS2 SAT (beet, Grembergen); AVS3 static β = 12° (wheat, winter, Lovenjoel). 1 USD ≈ 0.926 EUR-95 (AVS1), 127 (AVS2), 190 (AVS3) [58]
Static (Chennai, India), GCR 80%, h = 4 m, β = 13°, γ = S.839[65]
Closed greenhouse (lettuce), GCR 14%, h = 4.88 m, β = 30°, γ = S; mono-Si; 58 kWp. 1 USD ≈ 1.37 CAD.-69[68]
United Kingdom, potato: AVS1 static bifacial GCR 60%; AVS2 static monofacial GCR 56–60%; AVS3 bifacial SAT; AVS4 monofacial SAT. 1 USD ≈ 0.8 GBP.25 (AVS1), 33 (AVS2), 29 (AVS3), 30 (AVS4)60 (AVS1), 51 (AVS2), 54 (AVS3), 53(AVS4)[69]
Table 11. Water savings and main mechanisms (WS: water savings; WUE: water-use efficiency; ET: evapotranspiration; RH: relative humidity).
Context and CropReported Water SavingsMain MechanismRef.
Oregon, USA (pastures)WUE: +328%; soil moisture: 2 × higher under panelsReduction in ET due to shading[24]
GlobalUnsustainable extraction: −90% (150 km3 in groundwater)Elimination of groundwater irrigation[27]
India (various crops)Soil moisture: +9.4% under panels; rainwater harvestingET reduction and rainfall capture[31]
California (tomato)ET: −12%; WS: 102 mm per seasonET reduction and optimized WUE[44]
USA, China, FranceSoil moisture: +5% to +15%; evaporation: −30% to −40%; water stress: −63%Reduced radiation and enhanced cooling[51]
BangladeshReuse of cleaning water: +74% to +90%Water reuse in closed systems[54]
MalaysiaFertigation efficiency: 80% to 90%; minimal lossesEfficient drip irrigation under shade[49]
USA (lettuce)Irrigation savings: 15% to 50%, proportional to GCRDirect radiation reduction.[20]
Arizona (tomato)Savings of 15% to 45% depending on season and GCRLinear ET reduction with PV coverage[23]
Oregon (sheep)WS in sheep: −0.72 L per head per dayLower thermal stress[34]
MalaysiaWater management: 3256 m3/year via solar pumpingWater autonomy[73]
Nigeria (mung bean)RH: +3% to +8%; ET: −47%; leaf temperature: −9%Favorable microclimate[93]
SingaporeWS: 95%Solar-powered hydroponics[91]
GlobalWater stress: −22% to −35%Improved water balance[89]
Italy (vineyard)Soil moisture: +16% under panels; +5.5% vs open field; air temperature: −1 °C; RH increaseIncreased soil moisture and reduced ET[92]
Table 12. Reduction in CO2 emissions associated with agrivoltaic systems. (LCA: Life Cycle Assessment).
AVS DetailsMethodologyPV Generation/CapacityCO2 ReductionKey CommentsRef.
Rainfed crops (global study)Fossil fuel substitution11.2–37.6 PWh/year75–200 USD/tCO2 avoidedHigh variability depending on the fossil-based grid and costs.[27]
Potato crop (Germany)Comparative LCA with three scenarios500 kWp70% lower CO2 than the German gridEmissions from module and structural manufacturing considered.[8]
Closed system with vertical cropsPartial LCA + electricity consumption1116 kWh/kWp·year625 kg CO2/m2·yearPV supplies 10–12% of total consumption[39]
Multi-density system (modeled, Arizona)Full LCA normalized by revenue-12–46% vs PV-onlyBest results with Direct Single-Axis Tracking[20]
Solar pumping for irrigation (Malaysia)Energy substitution + partial LCA11,913.6 kWh/year8.82 tCO2e/year mitigatedAgricultural pumping with an autonomous solar system.[73]
AI–IoT greenhouse (Indonesia)Partial LCA1.7447 MWh/year~40% reduction in the carbon footprintSavings driven by automation and WUE[77]
Vineyard (Qatar)Direct fossil substitution2220 MWh/year2138 tCO2e/yearGreenhouse with high productivity[68]
Vineyard (Italy)Direct fossil substitution286.2 MWh/year255 tCO2e/yearEmission factor of 0.891 tCO2e/MWh[92]
Disclaimer/Publisher’s Note: The statements, opinions and data contained in all publications are solely those of the individual author(s) and contributor(s) and not of MDPI and/or the editor(s). MDPI and/or the editor(s) disclaim responsibility for any injury to people or property resulting from any ideas, methods, instructions or products referred to in the content.