
Resilience for Just Transitions of Agroecosystems Under Climate Change: Northern Midlands and Mountains, Vietnam

 , , , , and
Abstract
1. Introduction
2. Research Context
2.1. Just Transitions and Resource-Dependent Livelihoods
2.2. Climate Change, Livelihoods, and Resilience in Rural Vietnam
2.3. Study Aims and Outline
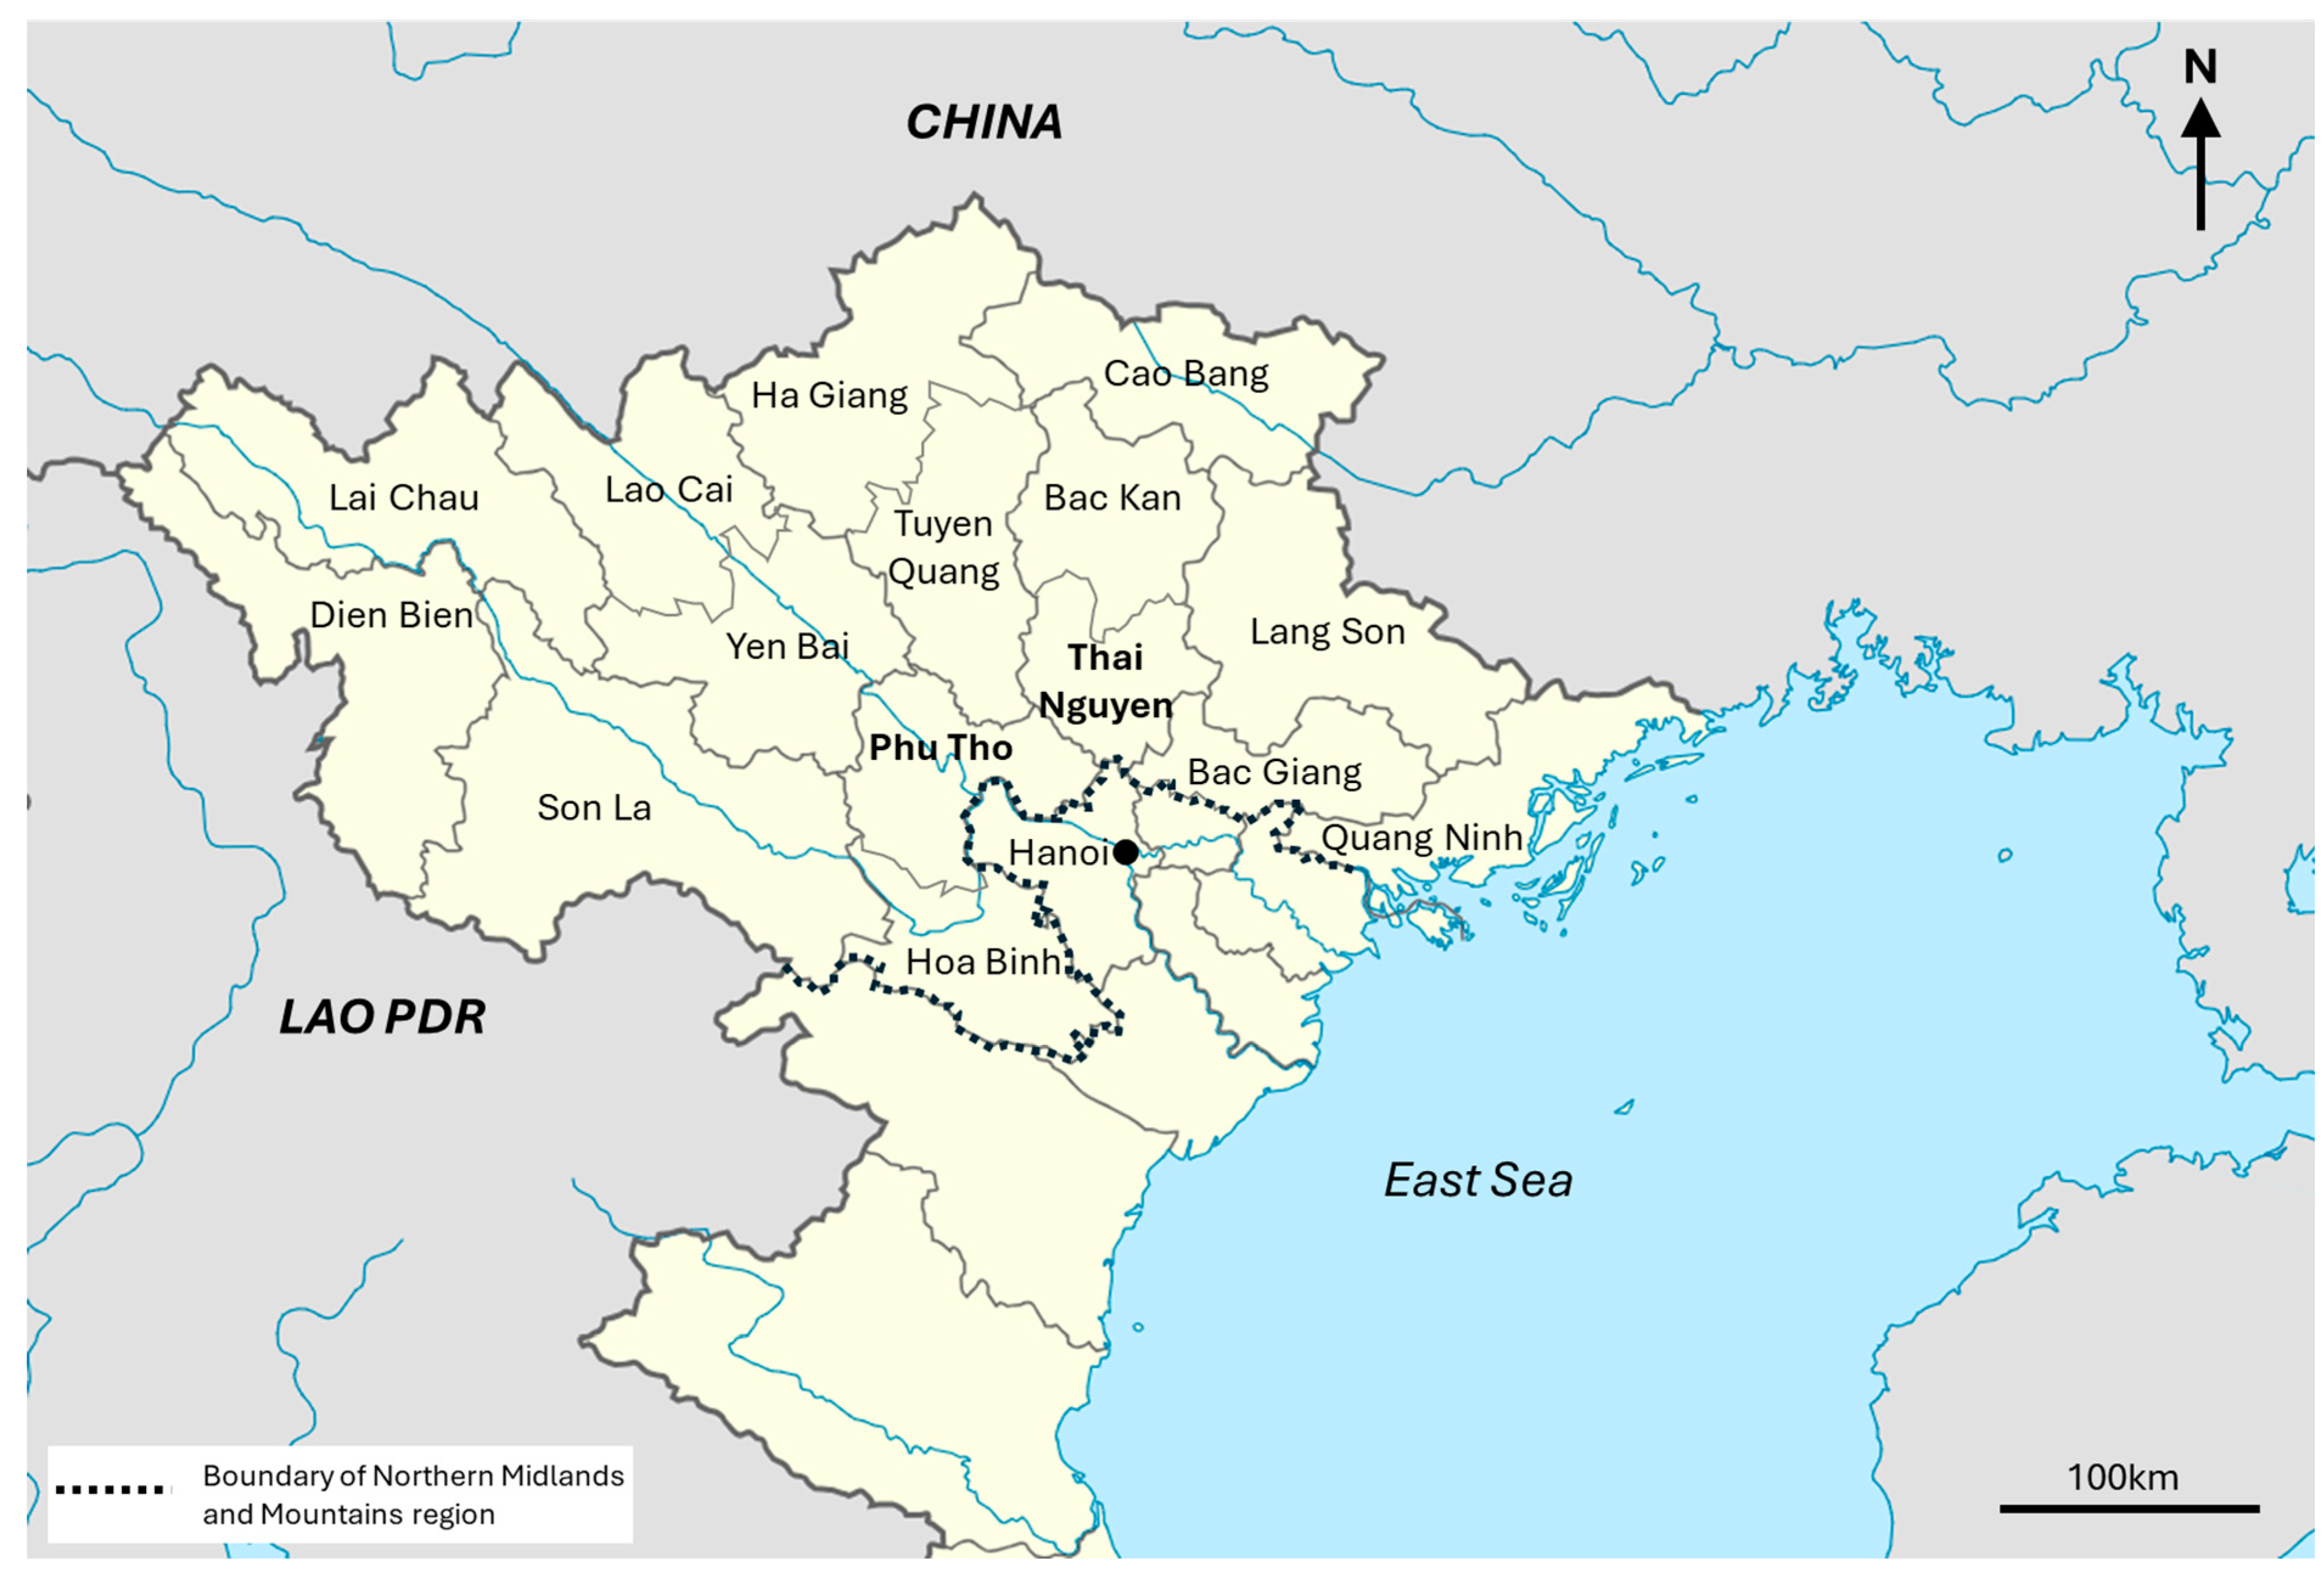
3. Vietnam’s Northern Midlands and Mountains: Thai Nguyen and Phu Tho Provinces
3.1. Northern Midlands and Mountains
3.2. Thai Nguyen and Phu Tho Provinces
4. Methodology
5. Results
5.1. Ecological Indicators
5.2. Economic Indicators
5.3. Social Indicators
5.4. Institutional Indicators
5.5. Relationships Between Variables
5.6. Synthesis
6. Discussion
6.1. Supporting Evidence-Based Policy Processes
6.2. Examining Policy Impacts
6.3. Alternative Forms of Participation
6.4. Limitations
7. Conclusions
Author Contributions
Funding
Institutional Review Board Statement
Informed Consent Statement
Data Availability Statement
Conflicts of Interest
References
- ILO-UNEP-IUCN. Decent Work in Nature-Based Solutions; ILO-UNEP: Geneva, Switzerland, 2022. [Google Scholar]
- Majumdar, A.; Ghosal, S.; Ruj, C.; Sen, A. Why efforts to address India’s ‘just transition’ should support nature-based solutions. Energy Res. Soc. Sci. 2023, 98, 103021. [Google Scholar] [CrossRef]
- Girma, G.; Shimeles, A.; Abate, T.; Seyoum, G.; Alemu, M. The urge for just transition: Evidence from understanding of wood fuel producers’ livelihoods and vulnerability in the drylands of Ethiopia. Front. Sustain. Food Syst. 2022, 6, 966137. [Google Scholar] [CrossRef]
- Mabon, L.; Layard, A.; De Vito, L.; Few, R.; Hatzisavvidou, S.; Selomane, O.; Marshall, A.; Marciniak, G.; Moersberger, H. What does a just transition mean for urban biodiversity? Insights from three cities globally. Geoforum 2024, 154, 104069. [Google Scholar] [CrossRef]
- Lo, K. Authoritarian environmentalism, just transition, and the tension between environmental protection and social justice in China’s forestry reform. For. Policy Econ. 2021, 131, 102574. [Google Scholar] [CrossRef]
- Birkmann, J.; Liwenga, E.; Pandey, R.; Boyd, E.; Djalante, R.; Gemenne, F.; Filho, W.L.; Pinho, P.F.; Stringer, L.; Wrathall, D.; et al. Poverty, Livelihoods and Sustainable Development. In Climate Change 2022: Impacts, Adaptation and Vulnerability; Contribution of Working Group II to the Sixth Assessment Report of the Intergovernmental Panel on Climate Change; Pörtner, H.-O., Roberts, D.C., Tignor, M., Poloczanska, E.S., Mintenbeck, K., Alegría, A., Craig, M., Langsdorf, S., Löschke, S., Möller, V., et al., Eds.; Cambridge University Press: Cambridge, UK; New York, NY, USA, 2022; pp. 1171–1274. [Google Scholar] [CrossRef]
- Cannon, T. Rural livelihood diversification and adaptation to climate change. In Community Based Adaptation to Climate Change: Emerging Lessons; Ensor, J., Berger, R., Huq, S., Eds.; Practical Action Publishing: Rugby, UK, 2013; pp. 55–75. [Google Scholar] [CrossRef]
- Natarajan, N.; Newsham, A.; Rigg, J.; Suhardiman, D. A sustainable livelihoods framework for the 21st century. World Dev. 2022, 155, 105898. [Google Scholar] [CrossRef]
- Singh, R.; Dell’Angelo, J.; Oguge, N.; Odote, C. The role of livelihoods in agrifood sustainability transitions. Environ. Innov. Soc. Transit. 2024, 50, 100799. [Google Scholar] [CrossRef]
- Lima, M.G.B. Just transition towards a bioeconomy: Four dimensions in Brazil, India and Indonesia. For. Policy Econ. 2022, 136, 102684. [Google Scholar] [CrossRef]
- Bennett, N.J.; Blythe, J.; Cisneros-Montemayor, A.M.; Singh, G.G.; Sumaila, U.R. Just transformations to sustainability. Sustainability 2019, 11, 3881. [Google Scholar] [CrossRef]
- Pickering, J.; Coolsaet, B.; Dawson, N.; Suiseeya, K.M.; Inoue, C.Y.A.; Lim, M. Rethinking and Upholding Justice and Equity in Transformative Biodiversity Governance. In Transforming Biodiversity Governance; Visseren-Hamakers, I.J., Kok, M.T.J., Eds.; Cambridge University Press: Cambridge, MA, USA, 2022; pp. 155–178. [Google Scholar] [CrossRef]
- Kuhmonen, I.; Siltaoja, M. Farming on the margins: Just transition and the resilience of peripheral farms. Environ. Innov. Soc. Transit. 2022, 43, 343–357. [Google Scholar] [CrossRef]
- Arouri, M.; Nguyen, C.; Youssef, A. Ben. Natural Disasters, Household Welfare, and Resilience: Evidence from Rural Vietnam. World Dev. 2015, 70, 59–77. [Google Scholar] [CrossRef]
- Kien, N.D.; Ancev, T.; Randall, A. Farmers’ choices of climate-resilient strategies: Evidence from Vietnam. J. Clean. Prod. 2021, 317, 128399. [Google Scholar] [CrossRef]
- Huynh, N.C.; Loc, T.T.; Tuyen, T.L.T.; Ngoc, B.H. Livelihood transitions in rural Vietnam under climate change effects in the period of 2008–2018. Discov. Sustain. 2024, 5, 5. [Google Scholar] [CrossRef]
- Halbherr, L.; Maat, H.; Talsma, T.; Hutjes, R. Mainstreaming climate change adaptation into rural development plans in vietnam—How to build resilience at the interface of policy and practice. Agronomy 2021, 11, 1926. [Google Scholar] [CrossRef]
- Tuan, N.A.; Nong, D.; Leu, S.; To-The, N. Changes in the environment from perspectives of small-scale farmers in remote Vietnam. Reg. Environ. Change 2021, 21, 98. [Google Scholar] [CrossRef]
- Ho, N.S.; Kingsbury, A.; Hoa, H.T. Indigenous knowledge and the enhancement of community resilience to climate change in the Northern Mountainous Region of Vietnam. Agroecol. Sustain. Food Syst. 2021, 45, 499–522. [Google Scholar] [CrossRef]
- IPCC. Climate Change 2021: The Physical Science Basis; IPCC: Geneva, Switzerland, 2021. [Google Scholar]
- Ministry of Natural Resources and Environment. Report: National Adaptation Plan for the Period 2021–2030, with a Vision to 2050; MONRE: Hanoi, Vietnam, 2024. [Google Scholar]
- General Statistics Office of Vietnam. Completed Results of the Viet Nam 2019 Population and Housing Census; Statistical Publishing House: Hanoi, Vietnam, 2019. [Google Scholar]
- Ministry of Agriculture and Rural Development. Agriculture in the Central Highlands and Central Highlands Has Transformed Towards Commodity Production After 15 Years of Implementing Resolution 37-NQ/TW of the Politburo, Ministry of Agriculture and Rural Development Electronic Information Portal. 2019. Available online: https://www.mard.gov.vn/Pages/nong-nghiep-vung-trung-du-va-mien-nui-bac-bo-chuyen-doi-theo-huong-san-xuathang-hoa-sau--.aspx (accessed on 15 September 2024).
- General Statistics Office of Vietnam. Report on Labour Force Survey; Statistical Publishing House: Hanoi, Vietnam, 2022. [Google Scholar]
- Dan Viet. How Have Climate Change and Natural DISASTERS impacted Multidimensional Poverty Reduction in Vietnam? (in Vietnamese: Biến đổi khí hậu và thiên tai đã tác động thế nào tới giảm nghèo đa chiều ở Việt Nam?). 20 April 2025. Available online: https://danviet.vn/bien-doi-khi-hau-va-thien-tai-da-tac-dong-the-nao-toi-giam-ngheo-da-chieu-o-viet-nam-d1325943.html (accessed on 15 June 2025).
- Cuesta, J.; Cai, L.; Madrigal, L.; Pecorari, N. Exposure to Climatic Risks and Social Sustainability in Vietnam. Sustainability 2023, 15, 3260. [Google Scholar] [CrossRef]
- Vo, T.A.N.; Tran, T.K. Climate change and rural vulnerability in Vietnam: An analysis of livelihood vulnerability index. Hum. Ecol. Risk Assess. 2022, 28, 326–353. [Google Scholar] [CrossRef]
- National Statistics Office of Vietnam. Available online: https://www.nso.gov.vn/en/homepage/ (accessed on 20 July 2025).
- Rao, C.S.; Kareemulla, K.; Krishnan, P.; Murthy, G.R.K.; Ramesh, P.; Ananthan, P.S.; Joshi, P.K. Agro-ecosystem based sustainability indicators for climate resilient agriculture in India: A conceptual framework. Ecol. Indic. 2019, 105, 621–633. [Google Scholar] [CrossRef]
- Phu Tho Provincial People’s Committee. Action Plan to Respond to Climate Change for Phu Tho Province for the Period 2021–2030, Vision to 2050; Phu Tho Provincial People’s Committee: Phu Tho City, Vietnam, 2020.
- Thai Nguyen Provincial People’s Committee. Developing and Updating an Action Plan to Respond to Climate Change for the Period 2021–2030, Vision 2050 for Thai Nguyen Province; Thai Nguyen Provincial People’s Committee: Thai Nguyen City, Vietnam, 2020.
- Ha, T.M.; Kühling, I.; Trautz, D. A systems approach toward climate resilient livelihoods: A case study in Thai Nguyen province, Vietnam. Heliyon 2020, 6, e05541. [Google Scholar] [CrossRef] [PubMed]

| Thai Nguyen | Phu Tho | Northern Midlands and Mountains Average | Vietnam Average | |
|---|---|---|---|---|
| Life expectancy at birth | 74.5 | 74.4 | 72.6 | 74.5 |
| Literacy rate (15+) | 98.8 | 98.6 | 91.9 | 96.6 |
| Percentage trained labour force | 36.6 | 34.1 | 26.8 | 27.2 |
| Labour productivity (2022) (Mill. dongs/employed) | 243.9 | 128.0 | 136.4 | 188.7 |
| Informal employment rate | 54.8 | 63.7 | 71.5 | 65.1 |
| Land use: total area (thousand hectare) | 352.2 | 353.5 | 9518.4 | 33,134.5 |
| Land use: agricultural land (thousand hectare) | 110.4 | 117.7 | 2281.2 | 11,673.4 |
| %age agricultural land (2022) | 31.3 | 33.3 | 24.0 | 35.2 |
| Planted area of rice (thousand hectare) | 67.5 | 58.4 | 653.1 | 7119.3 |
| Yield of rice (Quintal/ha) | 55.7 | 59.2 | 52.3 | 61.1 |
| Production of paddy (thousand tonnes) | 376.3 | 346.1 | 3414.4 | 43,497.7 |
| Production of tea (thousand tonnes) | 264.4 | 178.1 | N/A | 1125.1 |
| Number of acting enterprises per 1000 inhabitants | 4.3 | 4.3 | 3.2 | 9.2 |
| Monthly average income per capita at current prices (thousand dong) | 4908 | 4330 | 3438 | 4962 |
| Monthly average income per capita at current prices for lowest quintile (thousand dong) | 1437 | 1361 | 869 | 1451 |
| Average income per capita at current prices for agriculture, forestry and fishery (thousand dong) | 607 | 282 | 575 | 502 |
| Human Development Index (2022) | 0.770 | 0.724 | N/A | 0.737 |
| Cost of living index (where Hanoi = 100) | 92.37 | 88.74 | N/A | N/A |
| Poverty rate (%) | 1.7 | 3.7 | 10.7 | 3.4 |
| Agroecosystems | Thai Nguyen | Phu Tho | Total |
|---|---|---|---|
| Rice | 33 | 42 | 75 |
| Tea | 39 | 42 | 81 |
| Fruit trees | 8 | 10 | 18 |
| Aspect | Original Indicators Selected for Inclusion | How Adapted for Survey | How Measured in Survey |
|---|---|---|---|
| Ecological | Crop biodiversity | Surrounding biodiversity | Likert self-assessment of surrounding biodiversity |
| Livestock biodiversity | |||
| Flood frequency | Floods | Likert self-assessment of impact on rice and tea crops | |
| Flash floods | Likert self-assessment of impact on rice and tea crops | ||
| Landslides | Likert self-assessment of impact on rice and tea crops | ||
| Water productivity | Water quality | Likert self-assessment of water quality | |
| Drought frequency | Drought | Likert self-assessment of impact on rice and tea crops | |
| Frost frequency | Cold | Likert self-assessment of impact on rice and tea crops | |
| Fertilizer usage | Use of organic fertilizers | Kg/ha for rice and tea | |
| Use of NPK synthetic chemical fertilizers | Kg/ha for rice and tea | ||
| Nitrogen fertilizers | Kg/ha for rice and tea | ||
| Phosphate fertilizers | Kg/ha for rice and tea | ||
| Potassium fertilizers | Kg/ha for rice and tea | ||
| Forest cover | Forest cover ratio | %age forest cover | |
| Pesticide use | Use of pesticides | Kg/ha for rice and tea | |
| Biological pesticides | Kg/ha for rice and tea | ||
| Growth stimulants | Kg/ha for rice and tea | ||
| Herbicides | Kg/ha for rice and tea | ||
| Soil organic carbon | Soil quality | Likert self-assessment of soil quality | |
| Soil drainage | |||
| Soil depth | |||
| Economic | Per capita food supply | Crops per household | Number of different crops grown |
| Tea tree yield stability | Likert self-assessment of stability | ||
| Rice yield stability | Likert self-assessment of stability | ||
| GVA from crops GVA from livestock | Income generated from agricultural production | Self-reported percentage generated from agricultural production | |
| Level of access to tea market | Likert-self assessment of accessibility to tea market | ||
| Level of access to rice market | Likert-self assessment of accessibility to rice market | ||
| Non-farm income Poverty rate | Access to credit | Likert-self assessment of access to credit | |
| Credit loans | Likert-self assessment of access to loans | ||
| Marketable surplus | Number of commercial crops | Number of different crops grown | |
| Agricultural employment | Acreage of agricultural land/household | Average farm size per household (ha) | |
| Acreage of agricultural land/labour | Average farm size per household (ha) divided by number of labourers | ||
| Social | Adoption of improved practices | Applying traditional knowledge and experience to production | Likert self-assessment of how often action is performed |
| Regularly improve the soil | Likert self-assessment of how often action is performed | ||
| Practice/measures to mitigate and adapt to climate change | Likert self-assessment of how often action is performed | ||
| Develop annual production plans | Likert self-assessment of how often action is performed | ||
| Adjust crop calendars in a timely manner | Likert self-assessment of how often action is performed | ||
| Manage pests and diseases | Likert self-assessment of how often action is performed | ||
| Access weather information | Likert self-assessment of how often action is performed | ||
| Irrigate water sparingly | Likert self-assessment of how often action is performed | ||
| Switch to drought-resistant crop varieties | Likert self-assessment of how often action is performed | ||
| Cover cultivated areas to retain soil moisture | Likert self-assessment of how often action is performed | ||
| Use ecological measures to control pests and diseases | Likert self-assessment of how often action is performed | ||
| Institutional | Access to extension services | Access to extension services | Likert self-assessment of how often action is performed |
| Participating in training | Likert self-assessment of how often action is performed | ||
| Disaster preparedness | Preparing for disasters Support during disasters | Likert self-assessment of how often action is performed | |
| Agriculture insurance |
| Provinces | Demographic Characteristics | Number of Information Providers (People) | Percent of Information Providers (%) | |
|---|---|---|---|---|
| Gender | Thai Nguyen | Male | 28 | 62.2 |
| Female | 17 | 37.8 | ||
| Total | 45 | 100 | ||
| Phu Tho | Male | 36 | 60 | |
| Female | 24 | 40 | ||
| Total | 60 | 100 | ||
| Education level | Thai Nguyen | Elementary school | 7 | 15.6 |
| Middle school | 13 | 28.9 | ||
| High school | 14 | 31.1 | ||
| Intermediate school | 7 | 15.6 | ||
| College or higher | 4 | 8.9 | ||
| Total | 45 | 100.0 | ||
| Phu Tho | Elementary school | 6 | 10.0 | |
| Middle school | 20 | 33.3 | ||
| High school | 28 | 46.7 | ||
| Intermediate school | 3 | 5.0 | ||
| College or higher | 3 | 5.0 | ||
| Total | 60 | 100.0 | ||
| Age | Thai Nguyen | Below 30 | 1 | 2.2 |
| 30–39 | 6 | 13.3 | ||
| 40–49 | 11 | 24.4 | ||
| 50–59 | 18 | 40 | ||
| Over 60 | 9 | 20 | ||
| Total | 45 | 100.0 | ||
| Phu Tho | 30–39 | 5 | 8.3 | |
| 40–49 | 19 | 31.7 | ||
| 50–59 | 21 | 45 | ||
| Over 60 | 15 | 25 | ||
| Total | 60 | 100.0 | ||
| Household size (people) | Thai Nguyen | 2–3 | 12 | 26.7 |
| 4–5 | 27 | 60.0 | ||
| Over 6 | 6 | 13.3 | ||
| Total | 45 | 100.0 | ||
| Phu Tho | 1 | 1 | 1.7 | |
| 2–3 | 15 | 25 | ||
| 4–5 | 34 | 56.7 | ||
| Over 6 | 10 | 16.8 | ||
| Total | 60 | 100.0 | ||
| Agricultural workers/household | Thai Nguyen | 1 | 7 | 15.6 |
| 2–3 | 36 | 80.0 | ||
| Over 4 | 2 | 4.4 | ||
| Total | 45 | 100.0 | ||
| Phu Tho | 1 | 12 | 20.0 | |
| 2–3 | 45 | 75.0 | ||
| Over 4 | 3 | 5.0 | ||
| Total | 60 | 100.0 |
| Type of Extreme Event | Number of Households Self-Reporting as Affected | Number Participating in Interview (People) | Percent of Participating in Interview (%) |
|---|---|---|---|
| Drought | Yes | 78 | 74.3 |
| No | 27 | 25.7 | |
| Landslides | Yes | 13 | 12.4 |
| No | 92 | 87.6 | |
| Severe cold, harmful cold | Yes | 46 | 43.8 |
| No | 59 | 56.2 | |
| Pipe floods, flash floods | Yes | 21 | 20 |
| No | 84 | 80 |
| Type of Disaster | Thai Nguyen Mean | Phu Tho Mean | Mean | Sig |
|---|---|---|---|---|
| Drought (Overall) | 0.62 | 0.83 | 0.74 | 0.014 * |
| Rice | 1.32 | 1.83 | 1.62 | 0.179 |
| Tea tree | 1.91 | 2.27 | 2.11 | 0.352 |
| Cold, severe cold (Overall) | 0.67 | 0.27 | 0.44 | 0.000 * |
| Rice | 1.13 | 0.67 | 0.87 | 0.107 |
| Tea tree | 1.53 | 0.37 | 0.87 | 0.000 * |
| Flash floods (Overall) | 0.24 | 0.17 | 0.20 | 0.329 |
| Rice | 0.62 | 0.57 | 0.59 | 0.844 |
| Tea tree | 0.29 | 0.75 | 0.55 | 0.108 |
| Floods (Overall) | 0.36 | 0.13 | 0.23 | 0.007 * |
| Rice | 0.47 | 0.27 | 0.35 | 0.261 |
| Tea tree | 0.51 | 0.10 | 0.28 | 0.013 * |
| Landslides (Overall) | 0.07 | 0.17 | 0.12 | 0.126 |
| Rice | 0.16 | 0.57 | 0.39 | 0.110 |
| Tea tree | 0.11 | 0.67 | 0.43 | 0.030 * |
| Sub-Themes | Thai Nguyen | Phu Tho | Rice | Tea Tree | ||||
|---|---|---|---|---|---|---|---|---|
| Rice | Tea Tree | Rice | Tea Tree | Mean | Sig | Mean | Sig | |
| Use of organic fertilizers | 4.67 | 63.0 | 0.83 | 0.83 | 2.48 | 0.1 | 27.48 | 0.01 * |
| Use of NPK synthetic chemical fertilizers | 12.73 | 71.33 | 18.78 | 70.07 | 16.19 | 0.2 | 70.63 | 0.9 |
| Nitrogen fertilizers | 1.78 | 11.02 | 1.42 | 9.72 | 1.57 | 0.6 | 10.28 | 0.8 |
| Phosphate fertilizers | 7.16 | 33.82 | 1.22 | 1.33 | 3.76 | 0.00 * | 15.26 | 0.02 * |
| Potassium fertilizers | 1.76 | 6.45 | 1.05 | 10.92 | 1.35 | 0.4 | 9.03 | 0.6 |
| Manure | 14.67 | 169.33 | 55.67 | 669.15 | 38.10 | 0.3 | 452.88 | 0.1 |
| Use of pesticides | 1.42 | 2.6 | 1.42 | 2.18 | 2.35 | 0.9 | 2.35 | 0.26 |
| Biological pesticides | 0.13 | 0.33 | 0.37 | 0.37 | 0.27 | 0.1 | 0.35 | 0.8 |
| Growth stimulants | 0.9 | 0.49 | 0.2 | 0.75 | 0.5 | 0.08 | 0.64 | 0.3 |
| Herbicides | 0.33 | 0.16 | 0.5 | 0.31 | 0.43 | 0.2 | 0.24 | 0.2 |
| Soil quality | 3.4 | 3.4 | 3 | 3 | 3.2 | 0.00 * | 3.2 | 0.00 * |
| Water quality | 3 | 3 | 3 | 3 | 3 | 0.00 * | 3 | 0.00 * |
| Forest cover ratio | 52.88 | 50.25 | 50.25 | 51.38 | 0.002 * | |||
| Surrounding biodiversity | 3 | 2.53 | 2.53 | 0.00 | 0.00 * | |||
| Themes | Sub-Themes | Thai Nguyen Mean | Phu Tho Mean | Mean | Sig |
|---|---|---|---|---|---|
| Economic | Tea tree yield stability | 2 | 2 | 2 | 0.91 |
| Rice yield stability | 1.02 | 0.5 | 0.723 | 0.00 * | |
| Income generated from agricultural production | 87.29 | 78.90 | 82.49 | 0.15 | |
| Access to credit | 0.33 | 1.83 | 1.19 | 0.00 * | |
| Credit loans | 1.71 | 1.77 | 1.74 | 0.52 | |
| Level of access to tea market | 3.91 | 3.07 | 3.43 | 0.05 * | |
| Level of access to rice market | 0.78 | 1.22 | 1.03 | 0.09 | |
| Acreage of agricultural land/household | 5847.11 | 13,686.1 | 10,326.53 | 0.00 * | |
| Acreage of agricultural land/labour | 3010.74 | 7238.08 | 5426.36 | 0.00 * | |
| Number of crops/household | 5.91 | 5.68 | 5.78 | 0.41 | |
| Number of commercial crops | 1.688 | 1.583 | 1.6286 | 0.55 |
| Themes | Sub-Themes | Mean | Mean | Sig | |
|---|---|---|---|---|---|
| Thai Nguyen | Phu Tho | ||||
| Social | Applying traditional knowledge and experience to production | 2.71 | 3.87 | 3.37 | 0.00 * |
| Regularly improve the soil | 2.13 | 2.97 | 2.61 | 0.010 * | |
| Practice/measures to mitigate and adapt to climate change | 1.04 | 1.80 | 1.48 | 0.051 | |
| Develop annual production plans | 0.76 | 0.48 | 0.60 | 0.351 | |
| Adjust crop calendars in a timely manner | 0.84 | 0.37 | 0.57 | 0.097 | |
| Manage pests and diseases | 1.02 | 0.63 | 0.8 | 0.227 | |
| Access weather information | 1.13 | 0.67 | 0.87 | 0.166 | |
| Irrigate water sparingly | 1.31 | 0.84 | 1.05 | 0.138 | |
| Switch to drought-resistant crop varieties | 2.09 | 1.42 | 1.71 | 0.088 | |
| Cover cultivated areas to retain soil moisture | 1.11 | 1.02 | 1.06 | 0.771 | |
| Use ecological measures to control pests and diseases | 1.50 | 0.47 | 0.91 | 0.00 * | |
| Themes | Sub-Themes | Thai Nguyen Mean | Phu Tho Mean | Mean | Sig |
|---|---|---|---|---|---|
| Institutional | Access to extension services | 0.53 | 0.30 | 0.40 | 0.01 * |
| Preparing for disasters | 0.40 | 0.43 | 0.42 | 0.74 | |
| Supporting disasters | 0.80 | 0.93 | 0.88 | 0.04 * | |
| Participating in training | 0.64 | 0.70 | 0.68 | 0.55 |
Disclaimer/Publisher’s Note: The statements, opinions and data contained in all publications are solely those of the individual author(s) and contributor(s) and not of MDPI and/or the editor(s). MDPI and/or the editor(s) disclaim responsibility for any injury to people or property resulting from any ideas, methods, instructions or products referred to in the content. |
© 2025 by the authors. Licensee MDPI, Basel, Switzerland. This article is an open access article distributed under the terms and conditions of the Creative Commons Attribution (CC BY) license (https://creativecommons.org/licenses/by/4.0/).
Share and Cite
Nguyen, T.S.; Mabon, L.; Doan, H.T.T.; Le, H.V.; Nguyen, T.H.T.; Vu, D.V.; Nguyen, D.D. Resilience for Just Transitions of Agroecosystems Under Climate Change: Northern Midlands and Mountains, Vietnam. World 2025, 6, 102. https://doi.org/10.3390/world6030102
Nguyen TS, Mabon L, Doan HTT, Le HV, Nguyen THT, Vu DV, Nguyen DD. Resilience for Just Transitions of Agroecosystems Under Climate Change: Northern Midlands and Mountains, Vietnam. World. 2025; 6(3):102. https://doi.org/10.3390/world6030102
Chicago/Turabian StyleNguyen, Tung Song, Leslie Mabon, Huong Thu Thi Doan, Ha Van Le, Thu Huyen Thi Nguyen, Duan Van Vu, and Dap Dinh Nguyen. 2025. "Resilience for Just Transitions of Agroecosystems Under Climate Change: Northern Midlands and Mountains, Vietnam" World 6, no. 3: 102. https://doi.org/10.3390/world6030102
APA StyleNguyen, T. S., Mabon, L., Doan, H. T. T., Le, H. V., Nguyen, T. H. T., Vu, D. V., & Nguyen, D. D. (2025). Resilience for Just Transitions of Agroecosystems Under Climate Change: Northern Midlands and Mountains, Vietnam. World, 6(3), 102. https://doi.org/10.3390/world6030102