Abstract
This study analyses the effects of public hospital mergers in Portugal, particularly the creation of hospital centers, on productivity levels. Grounded in the theoretical frameworks of New Public Management and Efficiency Theory, a Data Envelopment Analysis (DEA) approach, combined with the Malmquist Productivity Index, was used to evaluate performance. Results for the 2013–2015 period show no statistically significant difference in productivity levels between merged hospitals (hospital centers) and non-merged hospitals (hospital units). However, for hospitals merged in 2007, there is evidence of significant productivity gains in the post-merger period (2008–2014). These findings partially support the assumptions of New Public Management and Efficiency Theory concerning efficiency improvements through hospital mergers in the public sector.
1. Introduction
Health expenditure has been rising faster than national economic output across many European Union (EU) countries, including Portugal. In response, successive Portuguese governments have implemented a series of reforms to enhance the healthcare system’s efficiency, particularly within the hospital sector, which represents more than half of the total health expenditure. These reforms have been strongly influenced by the principles of New Public Management, which advocate for more business-like approaches in public services, such as decentralization, performance measurement, and structural reorganization. One of the most significant structural changes in the SNS (Serviço Nacional de Saúde, i.e., Portuguese National Health Service) was the creation of hospital centers—mergers of multiple hospital units under a single administration—intended to promote resource optimization and improve service integration. These mergers, supported by Efficiency Theory, were justified by the expectation of economies of scale, increased productivity, and better use of human and financial resources. Despite the widespread adoption of these reforms, there remains a lack of empirical evidence on the actual productivity outcomes of hospital mergers in Portugal. Notably, Nunes [1,2] investigated the impact of hospital mergers on productivity and found no consistent statistical evidence of performance improvement. These findings raise important questions about the effectiveness of hospital centers in achieving the intended outcomes of public sector reform. Notably, official evaluations and independent research on the impact of hospital centers on productivity have been scarce. In 2020, the Secretary of State for Health publicly acknowledged the need to assess the effectiveness of structural changes in public hospitals, highlighting the limited evidence of productivity gains from hospital mergers.
The international literature presents mixed findings. Some studies suggest that mergers improve efficiency and productivity, while others report neutral or negative outcomes. In the Portuguese context, the few existing studies—namely those by Nunes [1,2]—have yielded inconclusive results. While some productivity gains were observed, they were often not statistically significant. The scope of research assessing the impact of hospital mergers on productivity, both internationally and within Portugal, is limited, as previously noted [3,4]. Given this context, this study seeks to address two central questions:
Q1: Do merged public hospitals in Portugal demonstrate higher productivity than non-merged hospitals?
Q2: Do merged hospitals experience productivity gains in the years following the merger?
To answer these questions, we examine the productivity of hospital centers and hospital units in the Portuguese SNS using Data Envelopment Analysis (DEA) methodology and the Malmquist Productivity Index. We test the following hypotheses:
H1:
Merged public hospitals exhibit higher productivity than non-merged ones.
H2:
Merged public hospitals achieve productivity gains in the post-merger period.
This article contributes to the existing literature by applying robust quantitative methods to a comprehensive sample of Portuguese hospitals, spanning different periods and sizes, and incorporating labor and capital inputs into the productivity analysis.
2. Mergers of Portuguese Public Hospitals
New Public Management advocates for adopting private sector practices in public administration, emphasizing decentralization, accountability, and performance metrics. In healthcare, New Public Management has motivated structural reforms such as hospital mergers, which are expected to improve efficiency, resource management, and the productivity of public services, including healthcare [5]. Efficiency Theory suggests that organizational changes, such as mergers, can generate synergies and economies of scale, ultimately resulting in productivity gains. In the hospital sector, these gains are often associated with consolidating services, reducing duplication, better allocating specialized resources, and more centralized decision-making processes.
Empirical research on hospital mergers has produced mixed results. Some studies report improvements in technical efficiency and cost-effectiveness following mergers. For instance, studies conducted in the United Kingdom and Scandinavia observed modest gains in performance indicators after structural consolidations. Notably, studies conducted by Coyne [6] and Levitz and Brooke [7] revealed statistically significant differences, indicating that merged hospitals exhibited higher productivity levels than their non-merged counterparts. Conversely, other research has highlighted considerable integration costs, loss of focus, and organizational complexity as barriers that undermine the expected gains from mergers. Also, Ferrier and Valdmanis [8] found that non-merged hospitals outperformed merged hospitals in the Malmquist Productivity Index, including in the components of technical change and technical efficiency, with statistically significant differences favoring non-merged hospitals. The research by Ng et al. [9] revealed post-merger improvements in operational efficiency and care quality, with a simultaneous decrease in productivity.
Similarly, a study in Portugal by Nunes [2] concluded that hospitals not involved in the merger process performed better than hospital centers (i.e., merged hospitals). Additional research by Gaynor et al. [10], Nunes [1], and Ng et al. [9] aimed to evaluate the post-merger productivity performance of Portuguese merged hospitals. Gaynor et al. [10] concluded that post-merger productivity improvements lacked statistical significance. Nunes [2] found that the policy of merging SNS hospitals did not yield productivity gains in the medium term, with results being even lower than the pre-merger period. However, Nunes [1] observed an approximate 29.3% increase in productivity between 2005 and 2012, albeit still lower than before the merger.
In addition to productivity outcomes, the literature discusses the importance of time lags in assessing merger impacts. Several studies highlight that post-merger integration processes can take several years before the materialization of potential efficiency gains. This reinforces the need to distinguish between short-term disruptions and long-term outcomes in productivity analysis. Additionally, methodological approaches to measuring productivity are diverse. Among them, Data Envelopment Analysis (DEA) has been widely used due to its ability to handle multiple inputs and outputs without requiring price information. When combined with the Malmquist Productivity Index, DEA evaluates productivity change over time, decomposing it into efficiency and technological change. This methodology is particularly suited to assessing the impact of structural changes like mergers in the hospital sector.
Vertical integration aims to ensure integrated healthcare delivery by managing various care levels—such as primary care, hospital care, and long-term care—and by coordinating all integrated elements into a network [11,12,13]. In the SNS, this integration is achieved through the establishment of ULS (Unidade Local de Saúde, i.e., Local Health Units) and the amalgamation of hospitals with health centers [13,14], representing an innovative model for organizing primary and hospital healthcare services [13,15]. It involves resource pooling, provision, and the integrated management of healthcare, encompassing prevention, promotion, diagnosis, treatment, and the rehabilitation of health conditions [16]. Horizontal integration takes place when institutions providing similar services or close substitutes merge [11,12,16,17,18,19], resulting in a single entity responsible for managing the merged organizations [16].
International research offers important comparative insights into the effects of hospital mergers. In England, where hospital consolidations have been widely implemented within the National Health Service (NHS), recent studies show that mergers do not automatically translate into increased productivity. Using longitudinal data on English hospitals, Cirulli and Marini [20] found that while some mergers did increase output, the average effect was modest and varied widely depending on pre-merger characteristics and institutional capacity. This aligns with earlier concerns raised in the literature about the limits of scale economies in healthcare and the operational challenges of integration. In the Nordic context, which shares a publicly funded and universal health system with Portugal, merger effects have also been mixed. Ingelsrud [21], analyzing Norwegian hospital mergers, found that reorganizations often negatively affected staff well-being and increased turnover across hospital units. These findings highlight mergers’ social and organizational costs, especially when employee concerns and workplace stability are not adequately addressed. A recent systematic review by Mariani et al. [22], covering hospital mergers across Europe and beyond, concluded that the effects on quality and efficiency are highly context-dependent. The review emphasized that merger outcomes are more likely to be positive when accompanied by appropriate post-merger investments, careful planning, and alignment between management structures and service goals. These international perspectives reinforce the importance of considering institutional, organizational, and temporal conditions when assessing the potential impact of hospital mergers.
In Portugal, examples of such mergers include the establishment of hospital centers by integrating one or more hospitals [15] and the formation of ACES (Agrupamentos de Centros de Saúde, i.e., Groupings of Health Centers) by merging one or more health centers [14].
Article 64 of the Constitution of the Portuguese Republic (CRP) mandates the realization of the right to health protection within the National Health Service (SNS) following the principle of universality, necessitating the coordination of various levels of healthcare [12]. The integration of healthcare was identified as a means to accomplish this coordination. The significance of the fundamental principle of universality was further emphasized in the Basic Health Law (Law no. 48/90 on 24 August 1990) [23], particularly in Base XXIV, which stipulates that the SNS must ensure the full provision of healthcare services [12]. Consequently, political decisions in Portugal have resulted in the implementation of diverse healthcare integration models, primarily manifesting as two forms of integration: vertical and horizontal integration [13,14]. The integration of healthcare was formally incorporated into the Portuguese healthcare system with the enactment of Decree-Law no. 48357 on 27 April 1968 [24], which approved the Hospital Statute. This decree provided for the establishment of hospital centers through the merger of hospital institutions under a unified administration, which was aimed at enhancing operational efficiency and achieving improved outcomes.
Considering the theoretical underpinning of New Public Management and Efficiency Theory and the studies reviewed, we aim to test the following research hypotheses:
H1:
Merged public hospitals achieve productivity gains in the post-merger period.
H2:
Merged public hospitals exhibit higher productivity than non-merged ones.
Our research deviates from Nunes’s studies [1,2] in several aspects. Specifically, it compares the productivity of merged public hospitals with all non-merged public hospitals within the period under review. It expands the service portfolio assessed for productivity, incorporating sessions conducted in day hospitals and adjusting inpatient episodes to the MCI, reflecting the relative complexity of hospital caseloads. Additionally, it examines the productivity of merged and non-merged public hospitals, utilizing labor-representative productive factors, namely, the number of doctors and nurses in FTE, an aspect yet to be explored within the context of Portuguese SNS hospitals.
Through testing Hypotheses H.1 and H.2, our objective is to gauge changes in productivity and the breakdown of such changes within Portuguese public hospitals subjected to merger policies, comparing them with non-merged hospitals, i.e., hospital units. Furthermore, we seek to compare the productivity indices of merged public hospitals with pre-merger ones.
By evaluating Hypotheses H.1 and H.2, we aim to contribute toward answering the main research question, particularly addressing the specific research questions Q.1 and Q.2 outlined in the introduction.
3. Research Methodology
This study adopts a quantitative research approach, applying the Malmquist Productivity Index (MPI) through a panel data framework, using Data Envelopment Analysis (DEA). The chosen DEA model is the Charnes, Cooper, and Rhodes (CCR) input-oriented model, designed to evaluate the evolution of productivity in hospital centers and hospital units.
The MPI decomposes productivity change into two core components: technical change and technical efficiency. Technical change captures shifts in the production frontier over time (reflecting technological progress or regress that affects all hospitals). Efficiency change reflects whether a hospital moves closer to or further from the frontier (i.e., changes in its performance relative to best practice). The product of these two components yields the total factor productivity change. A value greater than 1 for technical change suggests industry-wide improvements (e.g., innovation or better practices). In contrast, an efficiency change above 1 indicates that a specific hospital improved its efficiency compared to its peers. This methodology enables a comprehensive understanding of the drivers behind productivity dynamics in Portuguese public hospitals [8,25,26,27].
Several software tools supported the implementation of this methodology: SPSS (version 25.0) (IBM Corp., Armonk, Nova Iorque, Estados Unidos) for descriptive statistics, and Microsoft Excel (2016)(Microsoft Corporation, Redmond, Washington, Estados Unidos), complemented by DEA Frontier, ActionStat, and Analysis ToolPak, for MPI calculations using panel DEA.
3.1. Models and Samples
This study focuses exclusively on public hospitals within the Portuguese National Health Service (SNS). The sample used in this study was not randomly selected, but constructed based on strict inclusion criteria to ensure hospital comparability—a prerequisite for Data Envelopment Analysis (DEA). Specifically, we excluded psychiatric hospitals, PPP hospitals, Local Health Units (ULS), and hospitals with fewer than 90 beds. The final sample includes all public hospitals with comparable size and service structure, grouped into two categories (90–650 beds and >650 beds), reflecting the complete census of eligible hospitals during the study period. Although the sample is not probabilistic, it is representative of the Portuguese hospital landscape within the defined groups and thus suitable for the applied methodology. As stated above, to ensure comparability among Decision-Making Units (DMUs), we adopted selection criteria based on Moreira [28], with adaptations. Hospitals were classified according to the following:
- Size, defined by the number of beds: medium-sized hospitals: 90 to 650 beds; large hospitals: more than 650 beds.
- Service portfolio—hospitals must include emergency care and at least one of the following services: day hospital or outpatient surgery, measured through Diagnosis-Related Groups (DRGs).
In cases of mergers, merged entities were treated as single units to avoid duplication. These criteria ensured a homogeneous and complete dataset suitable for DEA analysis.
Due to inconsistencies in hospital classifications during the study period, these criteria were chosen to ensure standardization and inclusion reliability. The data were obtained from official sources, including Reports from Adminisração Central do Sistema de Saúde, ACSS (Administração Central do Sistema de Saúde. i.e., Central Administration of Healthcare System) website statistics, and internal data from the CMI (Case Mix Index) for 2007–2009.
Hypothesis H.1 was tested using hospital data from 2013 to 2015. From a population of 103 hospitals, a final sample of 81 observations (79%) was analyzed. The sample was split into the following:
- Model A1: Medium-sized hospitals (n = 58 observations);
- Model A2: Large hospitals (n = 23 observations).
Due to data availability, H.1’s analysis period was 2013–2015. Table 1 and Table 2 below summarize the sample distribution.

Table 1.
Model A1—Medium hospitals with 90 to 650 beds. Sample for hypothesis H.1.
Table 2.
Model A2—Large hospitals with more than 650 beds. Sample for hypothesis H.1.
Hypothesis H.2 was tested on seven hospital centers created in 2007. Data were grouped into the following:
- Pre-merger period: 2005–2006 (aggregated 17 units);
- Merger year: 2007 (7 observations);
- Post-merger period: 2008–2014 (66 observations).
For H.2, the period was 2005–2014, to capture productivity before and after the creation of hospital centers.
Table 3 presents the sample structure below.
Table 3.
Model B—Hospital centers merged in 2007. Sample for Hypothesis H.2.
3.2. Variables
To analyze H.1, labor inputs were used: the number of full-time equivalent (FTE) doctors and nurses. Due to the unavailability of labor data, the number of inpatient beds was used for H.2. FTE values were adopted to mitigate distortions caused by part-time employment [29,30]. Labor inputs (FTE doctors and nurses) and capital inputs (number of beds) represent core hospital resources and are widely used in DEA studies.
Output variables reflect hospital service activity, aligning with prior empirical studies. These include adjusted admissions, emergency episodes, outpatient consultations, day hospital sessions, medical DRGs, and surgical DRGs.
Outputs such as inpatient discharges and outpatient visits reflect service volume. These variables were chosen based on the international literature and consistent data availability across hospitals during the study periods.
Due to data availability constraints, different input types were used across the two models: for the 2005–2014 analysis (Model B), inpatient beds served as a proxy for capital input, as consistent data on healthcare personnel were not available; for the 2013–2015 analysis (Model A), full-time equivalent (FTE) doctors and nurses were used to represent labor input. While this difference limits direct comparability between periods, it enables a broader analysis of productivity, capturing both human and physical resource dimensions in line with established approaches in the hospital efficiency literature.
Pearson correlation coefficients were calculated between each input and output to ensure the validity of the variables within the DEA–Malmquist models. All models (A1, A2, B) showed positive and significant correlations, satisfying the isotonicity assumption required in DEA [31,32,33].
Table 4.
Sources of data collection: inputs.
Table 5.
Sources of data collection: outputs.
This diagram (Figure 1) summarizes the study framework and analysis process, explaining how the data, variables, and methods are integrated and how each hypothesis is evaluated within the overall research design.
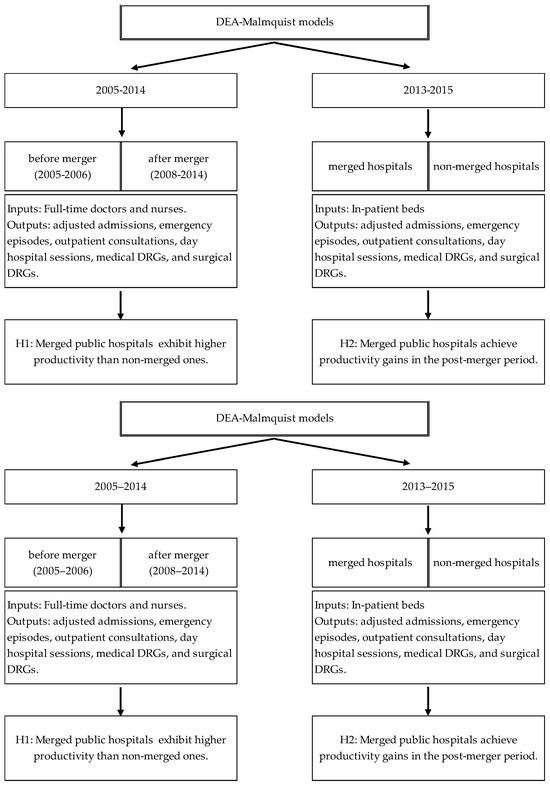
Figure 1.
Research design.
The research is structured around two distinct periods and hypotheses, both assessed through DEA–Malmquist models. On the left side, the 2005–2014 model (H2) adopts a longitudinal perspective, comparing productivity before (2005–2006) and after (2008–2014) the creation of hospital centers. This allows the evaluation of long-term productivity trends resulting from mergers. On the right side, the 2013–2015 model (H1) adopts a cross-sectional approach comparing merged and non-merged hospitals in the short term.
The models differ regarding input variables due to data availability and methodological rationale. For the 2005–2014 model, inpatient beds were used as a proxy for hospital capacity. The 2013–2015 model used full-time equivalent (FTE) doctors and nurses as labor inputs. In both models, the output variables were consistent: adjusted admissions, emergency episodes, outpatient consultations, day hospital sessions, and case-mix-adjusted DRGs (medical and surgical).
4. Results
4.1. DEA Panel Analysis Using the Malmquist Productivity Index
Below, we provide the Malmquist Productivity Index values for the examined hospitals and their detailed breakdown into components and sub-components. The data about medium-sized hospitals and large-sized hospitals, encompassed within Model A1 and Model A2, correspondingly, have been categorized according to the two types of hospitals under scrutiny: hospital units and hospital centers.
The Malmquist Productivity Index values for medium-sized hospitals, specifically medium-sized hospital centers (Table 6) and medium-sized hospital units (Table 7), are presented below:
Table 6.
Malmquist Productivity Index: Model A1—medium-sized hospital centers (2013–2015).
Table 7.
Malmquist Productivity Index: Model A1—medium-sized hospital units (period 2013–2015).
As shown in Table 6, most medium-sized hospital centers reported MPI values close to or slightly below 1.000. The average productivity index (0.979) suggests a modest overall decline in productivity. Technical change values show variability, with a few hospitals exceeding 1.10, indicating some technological progress. However, several hospitals underperformed in technical and scale efficiency, lowering the overall productivity index.
Table 7 shows a more stable productivity pattern for medium-sized hospital units. All hospitals reported an MPI above or equal to 1.000, with virtually no efficiency or technological change variation. This suggests that non-merged hospitals maintained productivity, likely due to organizational continuity.
For medium-sized hospital centers, the change in technical aspects is less pronounced than the variation in efficiency, signifying that the productivity improvement is primarily attributed to the technical efficiency indicator. Within this group of hospitals, the breakdown of technical efficiency reveals an average increase in pure technical efficiency alongside a decline in scale efficiency. Notably, the scale efficiency index contributes the least to the total productivity of medium-sized hospital centers, as outlined above. Conversely, medium-sized hospital units sustain their modernization capacity and technical efficiency on the efficiency frontier, with this indicator equaling the unit value. Like hospital centers, the Scale Efficiency Index is the least contributing factor to the total factor productivity of medium-sized hospital units.
Table 8 and Table 9 present results for the Malmquist Productivity Index regarding Model A2, respectively, for large hospital centers and large hospital units.
Table 8.
Malmquist Productivity Index: Model A2—large hospital centers (period 2013–2015).
Table 9.
Malmquist Productivity Index: Model A2—large hospital units (period 2013–2015).
Large hospital centers displayed more volatile productivity results (Table 8), with MPI values ranging from 0.626 to 1.001. Several institutions had MPI values below 1.000, driven by reduced technical efficiency. This indicates integration difficulties during 2013–2015 and highlights uneven adaptation post-merger.
Table 9 reveals that large hospital units sustained full productivity, with all MPI and component values equal to 1.000. This uniformity suggests operational stability and consistent resource utilization, contrasting with the more variable performance of hospital centers.
The average Malmquist Productivity Index value for the large hospital centers in Model A2 stands at 0.877, lower than the observed value for medium-sized hospital centers (0.979) and large hospital units (1.000). Unlike medium-sized hospital centers, large hospital centers witnessed a greater variation in technical change than in technical efficiency. This indicates that the progression in productivity is primarily attributed to technological advancements. The average Malmquist Productivity Index value for the large hospitals in Model A2 is 1, which is lower than that for the medium-sized hospitals in Model A1 (1.004) and higher than that for the large hospital centers (0.877). On average, during the 2013–2015 period, all large hospital units demonstrated modernization capacity and technical efficiency. However, in both scenarios, productivity remained constant at the unit level, showcasing stability in productivity levels.
Model B incorporates data from hospital centers established in 2007, encompassing those with a bed capacity ranging between 90 and 650 within the 2005–2014 timeframe. This model tests Hypothesis H.2. It scrutinizes the input of number of beds, and the outputs of inpatient admissions, average length of stay, urgent care, outpatient consultations, and HDI sessions. To compute the productivity of the hospital centers established in 2007 during the pre-merger phase (2005–2006), the inputs and outputs of the hospitals that later constituted the hospital centers under analysis were aggregated. This approach enabled the computation and presentation of the Malmquist Productivity Index concerning the hospital centers established in 2007 for the pre-merger duration spanning from 2005 to 2006.
According to Table 10, it is apparent that most hospital centers established in 2007 exhibited an upsurge in their productivity from 2009 onwards, marking the second year following the merger. Notably, the period between 2011 and 2012 evidenced the most substantial productivity spike, reaching 11.8 per cent. Conversely, the pre-merger duration spanning from 2005 to 2006 displayed the most significant decline in productivity, amounting to 3.3 per cent.
Table 10.
Malmquist Productivity Index of hospital centers created in 2007 (annual variation between two consecutive periods t and t + 1, from 2005 to 2014).
As shown in Table 11, compared with the pre-merger period, the hospital centers founded in 2007 exhibited an average productivity gain of 7.7 percent. Specifically, the post-merger period showcased the most notable surge in productivity, registering a growth of 4.5 percent.
Table 11.
Productivity of the hospital centers created in 2007: before the merger, the year of the merger, and after the merger.
In summary, it is evident that, on average, the hospital centers established in 2007 enhanced their productivity during the post-merger period. This increase was more pronounced in the post-merger phase (4.5%) compared to the pre-merger period (−3.1%).
4.2. Testing the Research Hypotheses and Interpreting the Results
4.2.1. Test of Hypothesis H.1
To test Hypothesis H.1 using Models A1 and A2, we compared the Malmquist Productivity Index (MPI) and its components—technical change, technical efficiency, pure technical efficiency, and scale efficiency—between merged and non-merged hospitals for the 2013–2015 period.
Before selecting the appropriate statistical tests, we verified the assumptions of normality and homogeneity of variance. The Shapiro–Wilk test was applied to assess data distribution, and Levene’s test was used to test variance homogeneity. Depending on the results, either the parametric Student’s t-test or the non-parametric Mann–Whitney U test was employed to assess differences between the two groups.
- Model A1: Medium-Sized Hospitals (90–650 beds)
Model A1 includes hospital centers and units, using inputs such as the number of full-time equivalent (FTE) doctors and nurses.
The Shapiro–Wilk test confirmed that the scale efficiency variable followed a normal distribution for both groups, allowing the use of the t-test.
For all other variables (MPI, technical change, technical efficiency, pure technical efficiency), the Mann–Whitney U test was applied due to non-normality.
Scale efficiency: The Shapiro–Wilk test indicates statistical significance for p values < 0.05. Other indicators (technical change, technical efficiency, and pure technical efficiency) were evaluated using the Mann–Whitney test. For these indicators, statistically significant differences were not observed for p < 0.05.
Regarding the additional indicators (technical change, technical efficiency, and pure technical efficiency) displayed in Table 12, it is evident that the values were comparatively higher in medium-sized merged public hospitals, i.e., hospital centers comprising 90 to 650 beds, in contrast to non-merged public hospitals (hospital units). However, the observed disparities did not achieve statistical significance, considering the results at the 5% significance level.
Table 12.
Student’s t-test and Mann–Whitney test: Model D1—Hypothesis H. 1.
- Model A2: Large-Sized Hospitals (>650 beds)
Model A2 mirrors Model A1, except for including data from hospital centers and large hospital units with more than 650 beds.
To assess Hypothesis H.1, we utilized the Malmquist Productivity Index and its components for hospital centers and units, as displayed in Table 10 and Table 11.
Given the limited sample size of hospital units, we employed the non-parametric Mann–Whitney test for Hypothesis H.1.
Upon examination of the Table 13, it is noticeable that the average Malmquist Productivity Index and its components for large hospitals show higher values in non-merged hospitals compared to merged public hospitals. However, these disparities were not statistically significant (p > 0.05), preventing the rejection of H1.
Table 13.
Mann–Whitney test: Model A2—Hypothesis H.1.
In summary, the research conducted between 2013 and 2015 on hospital centers and large SNS hospital units revealed that the average Malmquist Productivity Index of non-merged public hospitals (hospital units), along with the values computed for the indicators of technical change and technical efficiency, were higher than those obtained by merged public hospitals (hospital centers). However, as the p-value (0.500) exceeds the standard significance level of 0.05 (or 5%), we conclude that there is not enough statistical evidence to reject H1 when analyzing the group of large public hospitals, contrasting the findings observed for medium-sized public hospitals.
Regarding the other indicators, pure technical efficiency and scale efficiency, while the analysis demonstrates higher values in the large merged public hospitals (hospital centers), the p-value does not provide statistical evidence to suggest that these indicators for large merged public hospitals are superior to those of non-merged ones.
The outcomes of the H.1 test, considering models A1 and A2, reinforce the conclusions drawn from a previous study conducted by Nunes [2] involving Portuguese public hospitals. That study concluded that the Malmquist Productivity Index of non-merged public hospitals surpassed that of merged public hospitals, albeit without statistical significance.
4.2.2. Test of Hypothesis H.2
To assess H2, the Malmquist Productivity Index of the hospital centers established in 2007 was analyzed before (2005–2006) and after (2008–2014) the merger, integrated into Model B.
To select the appropriate statistical test for Hypothesis H.2, we evaluated the assumptions for parametric tests: normality and variance homogeneity. The Shapiro–Wilk test revealed that the variables analyzed lacked normal distribution (p < 0.05). Therefore, the Wilcoxon Mann–Whitney test was employed as an alternative to Student’s t-test for paired samples to test Hypothesis H.2.
Upon examination of Table 14, the comparison between the Malmquist Productivity Index in the pre- and post-merger periods demonstrates a significant increase in the post-merger period. This confirms H.2 with a significance level of 5%, indicating that “merged public hospitals achieve productivity gains after the merger compared to the pre-merger period”.
Table 14.
Shapiro–Wilk test: Malmquist Productivity Index (before and after merger). Model B—Hypothesis H.2.
The results show a statistically significant increase in productivity after the merger. This supports H.2, indicating that hospital mergers in 2007 were associated with long-term productivity gains. These findings are consistent with Nunes [1], who also observed improved productivity following hospital mergers, albeit without statistical confirmation.
5. Discussion of Results
The study found no statistically significant difference in the Malmquist Productivity Index between non-merged and merged public hospitals. For instance, as presented in Table 6, the average Malmquist Productivity Index (MPI) of medium-sized hospital centers was 0.979, indicating a slight productivity decline. In contrast, the corresponding index for medium-sized hospital units was 1.004, suggesting marginal improvement. Similarly, Table 7 reveals that large hospital centers exhibited an average MPI of 0.877, compared to 1.000 for large hospital units. Although these differences were not statistically significant (as seen in Table 12), the descriptive trends are consistent with the notion that newly merged hospitals may initially face integration difficulties that hinder short-term productivity gains.
A key reason for the lack of statistical significance in H.1 lies in the short time window considered (2013–2015), which directly followed the implementation of many mergers. Mergers are complex organizational processes, and in their early stages, they often involve disruptions to administrative systems, service alignment, and internal routines. Such integration challenges—harmonizing clinical protocols, reallocating human resources, and absorbing different institutional cultures—can temporarily suppress productivity and increase operational friction. As a result, differences between merged and non-merged hospitals may not immediately emerge statistically, especially given the limited sample size. This may have reduced the power of non-parametric tests such as the Mann–Whitney U test. Consequently, actual differences may remain undetected.
Beyond the immediate merger effects, the broader healthcare context also likely shaped hospital performance. Portugal’s National Health Service underwent several policy changes during the late 2000s and early 2010s, including shifts in hospital financing models, the centralization of procurement, and revisions in management accountability structures. These systemic transformations could have affected all hospitals simultaneously, potentially obscuring differences attributable solely to mergers. Additionally, demographic changes, particularly an ageing population, increased healthcare demand and case complexity during the study period, affecting resource utilization and productivity outcomes.
An important insight from the analysis lies in the decomposition of the Malmquist index, which separates productivity change into two components: efficiency change and technical change. Efficiency change reflects a hospital’s movement towards or away from the best-practice frontier (i.e., whether it is “catching up”), while technical change represents a shift in the frontier (i.e., technological progress or regress). As shown in Table 8, the productivity performance of medium-sized hospital centers was driven more by efficiency improvements than by technological change, suggesting enhanced internal resource use. In contrast, Table 9 indicates that productivity among large hospitals was more closely associated with technical change, implying that any gains were likely due to innovation or system-wide improvements. This difference is intuitive, as smaller hospitals may have more flexibility to improve processes and reduce inefficiencies, whereas large hospitals require significant technological investments to enhance productivity.
The findings for the hospitals that merged in 2007—analyzed over the 2005–2014 period—offer a longer-term perspective and help validate Hypothesis H.2. In the immediate years following the merger (2007–2008), productivity remained stable or declined slightly; however, from 2009 onwards, clear gains emerged, with the strongest improvements recorded around 2011–2012. This is consistent with the notion that productivity gains from mergers may take time to materialize, particularly as merged entities stabilize and integrate operations. Although the index slightly declined after 2012, possibly due to post-crisis austerity pressures and underinvestment, the overall trend confirms a positive net effect over time. Statistical significance was achieved in this case, strengthening the evidence that merger effects may only become evident when adopting a long-term horizon. The contrast between H.1 (short-term, no significant difference) and H.2 (long-term, significant improvement) underscores the importance of time lags in realizing merger-related gains.
The absence of statistically significant differences in the 2013–2015 analysis (H.1) likely reflects the short post-merger interval, when hospitals were still undergoing integration. By contrast, the longer timeframe of 2005–2014 (H.2) captures more mature effects, highlighting that merger-related productivity gains tend to emerge over time. The contrast between H.1 and H.2 results supports the importance of temporal context. While H.1 found no significant effects shortly after mergers, H.2 identified long-term gains, suggesting that productivity improvements require time to materialize.
In addition to transitional challenges and post-crisis austerity, a range of systemic factors may have influenced hospital productivity during the study period. Several health policy reforms—such as changes in hospital funding models, performance-based incentives, and cost-control measures—were implemented across the SNS, potentially affecting all hospitals regardless of merger status. Demographic shifts, including population ageing and the growing prevalence of chronic diseases, also increased care complexity and demand, influencing efficiency and output trends in merged and non-merged hospitals.
Beyond these structural and demographic factors, organizational culture, staff morale, and management practices must also be considered as critical determinants of merger outcomes. Mergers can disrupt established professional identities and institutional cultures, generating resistance or disengagement among clinical and administrative staff. Although not directly assessed in this quantitative study, these human and organizational dynamics may significantly influence productivity by shaping motivation, communication, and adopting new procedures. Effective leadership, clear communication, and inclusive change management strategies are essential to mitigating these challenges and enabling successful integration. The absence of direct measurement of these variables constitutes a limitation of the present analysis.
Overall, the results support a nuanced view of hospital mergers as a policy tool: their success depends on careful implementation, long-term support, and sensitivity to contextual variables. From a policy perspective, the current Recovery and Resilience Plan (RRP)—which includes substantial investments in the digital transformation and integration of public health services—presents an opportunity to enhance the conditions under which mergers can succeed. The RRP investments in hospital information systems, infrastructure, and workforce training can help accelerate integration and reduce the friction typically associated with merger processes. However, the evidence also suggests that policymakers should temper expectations regarding short-term gains and prioritize structural readiness and strategic alignment.
In light of these findings, we propose three key policy recommendations. First, mergers should be planned with a long-term horizon. Expectations of immediate gains are unrealistic, and evaluation frameworks should allow at least three to five years before judging the success of hospital consolidations. Second, enabling conditions such as leadership capacity, cultural alignment, and interoperable systems must be in place before implementing mergers. The availability of RRP funding should be strategically used to support these prerequisites. Third, mergers should be selectively applied. Rather than a blanket policy, decision-makers should target mergers where service complementarities, geographic proximity, and infrastructure integration make synergies more likely.
By aligning hospital merger strategies with these principles, the SNS can maximize the long-term benefits of consolidation while minimizing the organizational disruption and inefficiency that often accompany such reforms.
Nonetheless, it is important to acknowledge that the limited number of large hospitals included in our sample may constrain the generalizability of these findings to the broader population of large hospital units. Moreover, the limited sample size may have reduced the statistical power of our non-parametric tests, such as the Mann–Whitney U tests used to compare merged and non-merged hospitals, thereby increasing the likelihood that actual differences may not have been detected.
6. Conclusions
Despite the widespread adoption of hospital mergers across health systems as a strategy to improve performance, the empirical evidence on their impact on productivity and efficiency remains mixed. Mergers are frequently justified through New Public Management principles and Efficiency Theory, which argue that integration can lead to gains via synergies, the optimization of resources, and economies of scale. However, international and national studies have raised concerns about whether such restructuring efforts produce the expected performance improvements, especially in complex systems like public healthcare.
This study aimed to evaluate the impact of hospital mergers on productivity, using the case of public hospitals in the SNS as the empirical setting. Specifically, it examined whether merged hospitals (hospital centers) outperform non-merged ones (hospital units) in productivity and whether mergers generate productivity gains over time.
A two-pronged methodological approach was adopted to address these questions. First, data from 2013 to 2015 were used to compare the productivity of hospital centers and hospital units, using labor-related inputs such as the number of doctors and nurses in full-time equivalent contracts. Second, a longitudinal analysis of hospital centers created in 2007 was conducted, using data from 2005 to 2014 and focusing on capital inputs (number of inpatient beds).
The results showed that hospital units outperformed hospital centers in the 2013–2015 period, although the differences were not statistically significant. Therefore, there is insufficient evidence to reject the hypothesis that merged hospitals have higher productivity than non-merged ones. These findings, aligned with previous studies, suggest that mergers do not automatically lead to productivity gains in the short term.
However, the longitudinal analysis of hospital centers created in 2007 showed significant productivity gains in the post-merger period compared to the pre-merger phase. This supports the hypothesis that hospital mergers may improve productivity over time, provided the merged entities are given sufficient time and resources to consolidate and adapt.
Taken together, the findings suggest that the assumptions of New Public Management and Efficiency Theory are only partially validated in this context. While short-term gains were not observed, the longer-term effects indicate potential benefits from merger-driven restructuring, particularly when supported by appropriate investment and governance mechanisms.
These findings suggest that hospital mergers should be pursued with a long-term strategic horizon. Productivity improvements were only evident several years after integration, underscoring the importance of realistic timelines and sustained post-merger support. Moreover, the success of mergers appears to depend not only on structural consolidation, but also on enabling conditions such as strong leadership, cultural alignment, and investment in integration (e.g., interoperable IT systems and standardized procedures). Policymakers should therefore consider mergers selectively, prioritizing cases where hospitals present service complementarities, geographic compatibility, and sufficient organizational maturity to support integration. Future merger initiatives should be preceded by ex ante impact assessments and robust monitoring and change management mechanisms to ensure effective implementation and maximize long-term productivity gains.
Although the dataset used in this study ends in 2015, the findings remain highly relevant in light of the current policy landscape shaped by Portugal’s Recovery and Resilience Plan (RRP). As part of the European Union’s post-COVID-19 strategy, the RRP includes substantial investments in hospital infrastructure, digital systems, and workforce training. These investments aim to modernize the healthcare sector and increase its resilience and efficiency. In the context of future hospital mergers, the RRP could provide the financial and technical support needed to overcome integration challenges—particularly those related to information systems, human resources, and organizational alignment—which this study has identified as critical to realizing productivity gains.
7. Limitations and Future Research
This study has several limitations that should be acknowledged. First, the relatively small sample of large hospitals—reflecting the actual structure of the Portuguese hospital network—limits the generalizability of findings to all large-scale hospital settings. Second, the use of different input variables across models (labor vs. beds) due to data constraints complicates direct comparisons between time periods. Third, while our methodological approach captures quantitative productivity trends, it does not account for qualitative aspects such as organizational culture, staff morale, or managerial practices, which are known to affect merger outcomes.
In addition, the dataset ends in 2015, meaning that more recent merger experiences and institutional reforms (e.g., under the Recovery and Resilience Plan) were not captured. Further research should extend this analysis to more recent data and explore whether additional resources, digital transformation, and structural investments influence merger outcomes.
Future studies should also consider mixed-method approaches that integrate qualitative data from staff and administrators to assess the social and cultural dimensions of mergers. Moreover, comparative analyses between hospital mergers and other integration models—such as vertical integration through Local Health Units—may offer further insights into optimal strategies for health system restructuring.
Author Contributions
Conceptualization, N.M.P.M. and A.M.S.; methodology and formal analysis, N.M.P.M. and A.M.S.; writing—original draft preparation, N.M.P.M., A.M.S. and A.S.; writing—review and editing, N.M.P.M., A.M.S. and A.S. All authors have read and agreed to the published version of the manuscript.
Funding
This research received no external funding.
Institutional Review Board Statement
Not applicable.
Informed Consent Statement
Not applicable.
Data Availability Statement
The data sources were multiple and are properly explained in the article.
Conflicts of Interest
The authors declare no conflicts of interest.
References
- Nunes, A.M. Política de fusão de entidades hospitalares em Portugal: Avaliação da produtividade. Rev. Adm. Hosp. Inovação Saúde 2018, 15, 94–109. [Google Scholar] [CrossRef]
- Nunes, A.M.; Original, A. Análise da produtividade da política de fusão de unidades hospitalares em Portugal integradas no Serviço Nacional de Saúde. J. Bras. Econ. da Saúde 2017, 9, 93–99. [Google Scholar] [CrossRef]
- Azevedo, H.; Mateus, C. Economias de escala e de diversificação: Uma análise da bibliografia no contexto das fusões hospitalares. Rev. Port. Saúde Pública 2014, 32, 106–117. [Google Scholar] [CrossRef][Green Version]
- Presidência do Conselho de Ministros. XIX Governo Constitucional—2011–2015: Governos Constitucionais: Arquivo Histórico: República Portuguesa. Available online: https://www.historico.portugal.gov.pt/pt/o-governo/arquivo-historico/governos-constitucionais/gc19.aspx (accessed on 2 April 2025).
- Alonso, J.M.; Clifton, J.; Díaz-Fuentes, D. The impact of New Public Management on efficiency: An analysis of Madrid’s hospitals. Health Policy 2015, 119, 333–340. [Google Scholar] [CrossRef]
- Coyne, J.S. Hospital Performance in Multihospital Systems: A Comparative Study of System and Independent Hospitals. Health Serv. Res. 1982, 17, 303. Available online: https://pmc.ncbi.nlm.nih.gov/articles/PMC1068691/ (accessed on 1 April 2025).
- Levitz, G.S.; Brooke, P.P. Independent versus System-Affiliated Hospitals: A Comparative Analysis of Financial Performance, Cost, and Productivity. Health Serv. Res. 1981, 20, 315. Available online: https://pmc.ncbi.nlm.nih.gov/articles/PMC1068883/ (accessed on 1 April 2025).
- Ferrier, G.D.; Valdmanis, V.G. Do mergers improve hospital productivity? J. Oper. Res. Soc. 2004, 55, 1071–1080. [Google Scholar] [CrossRef]
- Ng, R.J.; Mohamed, N.N.E.; Anuar, I.L.K.; Lee, K.Y.; Musa, N.S.E.; Omar, M.I.; Abu Sapian, R.; Yunus, S.Z.S.A.; Shauki, N.I.A.; Bidin, N. Exploring patients’ experience on hospital merger: Have they benefited from cluster hospital initiative in Malaysia? Pertanika J. Soc. Sci. Humanit. 2020, 28, 2645–2665. [Google Scholar] [CrossRef]
- Gaynor, M.; Laudicella, M.; Propper, C. Can governments do it better? Merger mania and hospital outcomes in the English NHS. J. Health Econ. 2012, 31, 528–543. [Google Scholar] [CrossRef]
- Balto, D.A.; Kovacs, J. Consolidation in Health Care Markets: A Review of the Literature. Robert Wood Johnson Found. 2013. pp. 1–16. Available online: http://dcantitrustlaw.com/assets/content/documents/2013/balto-kovacs_healthcareconsolidation_jan13.pdf (accessed on 1 April 2025).
- ERS. Estudo de Avaliação dos Centros Hospitalares. 2012. Available online: https://www.ers.pt/uploads/document/file/3216/Relat_rio_de_actividades_2012.pdf (accessed on 1 April 2016).
- ERS. Estudo Sobre o Desempenho das Unidades Locais de Saúde. 2015. Available online: http://www.aenfermagemeasleis.pt/2015/02/13/estudo-sobre-o-desempenho-das-unidades-locais-de-saude-ers/ (accessed on 1 April 2016).
- Santana, R.; Costa, C. A Integração Vertical de Cuidados de Saúde: Aspectos Conceptuais e Organizacionais. Rev. Port. Saúde Pública 2008, 29–56. Available online: https://novaresearch.unl.pt/files/18916081/RPSP_2008_V._Tematico_n7a02_p.29_56.pdf (accessed on 1 April 2025).
- Saúde Em Análise: Uma Visão Para o Futuro; Deloitte: Lisboa, Portugal, 2011.
- Gröne, O.; Garcia-Barbero, M. Integrated care: A position paper of the WHO European Office for Integrated Health Care Services. Int. J. Integr. Care 2001, 1, e21. Available online: https://pmc.ncbi.nlm.nih.gov/articles/PMC1525335/ (accessed on 1 April 2025). [CrossRef]
- Brooks, G.R.; Jones, V.G. Hospital Mergers and Market Overlap. Health Serv. Res. 1997, 31, 701–722. Available online: https://pmc.ncbi.nlm.nih.gov/articles/PMC1070154/ (accessed on 1 April 2025). [PubMed]
- Lutz, S. Merger, acquisition activity hits record in 1st quarter, report says. Mod. Healthc. 1996, 26, 2–3. Available online: https://elibrary.ru/item.asp?id=2666476 (accessed on 1 April 2025).
- Sobczak, A. Opportunities for and constraints to integration of health services in Poland. Int. J. Integr. Care 2002, 2, e23. [Google Scholar] [CrossRef] [PubMed]
- Cirulli, V.; Marini, G. Do mergers really increase output? Evidence from English hospitals. Annals of Public and Cooperative Eco-nomics. Ann. Public Coop. Econ. 2023, 94, 159–189. [Google Scholar] [CrossRef]
- Ingelsrud, M.H. Hospital mergers in Norway: Employee health and turnover to three destinations. Nord. J. Work. Life Stud. 2017, 7, 29–45. [Google Scholar] [CrossRef]
- Mariani, M.; Sisti, L.G.; Isonne, C.; Nardi, A.; Mete, R.; Ricciardi, W.; Villari, P.; De Vito, C.; Damiani, G. Impact of hospital mergers: A systematic review focusing on healthcare quality measures. Eur. J. Public Health 2022, 32, 191–199. [Google Scholar] [CrossRef]
- Assembleia da República. Lei n.o 48/90, de 24 de Agosto—Lei de Bases da Saúde; Assembleia da República: Lisbon, Portugal, 1990; pp. 3452–3459. [Google Scholar]
- Ministério da Saúde e Assistência. Decreto-Lei n.o43357, de 27 de Abril de 1968—Estatuto Hospitalar; Ministério da Saúde e Assistência: Lisbo, Portugal, 1968; pp. 599–612. [Google Scholar]
- Liu, F.H.F.; Wang, P.H. DEA Malmquist productivity measure: Taiwanese semiconductor companies. Int. J. Prod. Econ. 2008, 112, 367–379. [Google Scholar] [CrossRef]
- Pouellette; Vierstraete, V. Technological change and efficiency in the presence of quasi-fixed inputs: A DEA application to the hospital sector. Eur. J. Oper. Res. 2004, 154, 755–763. [Google Scholar] [CrossRef]
- Solà, M.; Prior, D. Measuring Productivity and Quality Changes Using Data Envelopment Analysis: An Application to Catalan Hospitals. Financ. Account. Manag. 2001, 17, 219–245. [Google Scholar] [CrossRef]
- Moreira, S. Análise da Eficiência dos Hospitais-Empresa: Uma Aplicação da Data Envelopment Analysis. Bol. Económico do Banco Port. 2008, 127–150. Available online: https://www.bportugal.pt/paper/analise-da-eficiencia-dos-hospitais-empresa-uma-aplicacao-da-data-envelopment-analysis (accessed on 1 April 2025).
- Ramos, F.; Costa, C.; Roque, M. O Mercado Hospitalar Portugues. 1986. Available online: https://scholar.google.com/scholar?hl=pt-PT&as_sdt=0%2C5&q=Ramos%2CF.%3B+Costa%2CC.%3B+%26+Roque%2CM.+%281986%29+O+Mercado+Hospitalar+Português+Documento+de+Trabalho+No3%2F86+da+Associação+Portuguesa+de+Economia+da+Saúde&btnG= (accessed on 2 April 2025).
- Ozcan, Y.A.; Luke, R.D. A national study of the efficiency of hospitals in urban markets. Health Serv. Res. 1993, 27, 719–739. Available online: https://pmc.ncbi.nlm.nih.gov/articles/PMC1069910/ (accessed on 1 April 2025). [PubMed]
- Avkiran, N.K. Productivity Analysis in the Service Sector with Data Envelopment Analysis, 3rd ed.; Necmi K Avkiran: St. Lucia, Australia, 2006. [Google Scholar] [CrossRef]
- Dyson, R.G.; Allen, R.; Camanho, A.S.; Podinovski, V.V.; Sarrico, C.S.; Shale, E.A. Pitfalls and protocols in DEA. Eur. J. Oper. Res. 2001, 132, 245–259. [Google Scholar] [CrossRef]
- Hung, S.W.; Lu, W.M.; Wang, T.P. Benchmarking the operating efficiency of Asia container ports. Eur. J. Oper. Res. 2010, 203, 706–713. [Google Scholar] [CrossRef]

Disclaimer/Publisher’s Note: The statements, opinions and data contained in all publications are solely those of the individual author(s) and contributor(s) and not of MDPI and/or the editor(s). MDPI and/or the editor(s) disclaim responsibility for any injury to people or property resulting from any ideas, methods, instructions or products referred to in the content. |
© 2025 by the authors. Licensee MDPI, Basel, Switzerland. This article is an open access article distributed under the terms and conditions of the Creative Commons Attribution (CC BY) license (https://creativecommons.org/licenses/by/4.0/).