Abstract
The risk of socio-economic vulnerability depends not only on the risk of climate hazards occurring but also on society’s vulnerability to such hazards, coping capacity, and adaptive capacity. The World Risk Index methodology was used to assess the risk of socio-economic vulnerability of municipalities in the Tyumen region to climate-related hazards. Three groups of indicators were identified for calculating the socio-economic vulnerability risk: susceptibility, coping capacity, and adaptive capacity. Indicators in each group were selected based on official statistics. As a result, the risk of the realization of climate hazards and the risk of socio-economic vulnerability for the municipalities of the Tyumen region were ranked. Based on the results of ranking, the municipalities were divided into five groups. These groups had similar characteristics regarding socio-economic vulnerability indicators. The spatial analysis allowed for the identification of two clusters of municipalities with the highest level of socio-economic vulnerability due to a high risk of realization of climate-related hazards. Policy recommendations were proposed based on a spatial analysis of the risk of socio-economic vulnerability across municipalities and the analysis of socio-economic vulnerability indicators.
1. Introduction
Global climate change affects the development of the socio-economic systems of countries []. For example, according to the forecast model developed by experts from the Organization for Economic Cooperation and Development (OECD), the annual volume of GDP growth losses could be around 2% by 2060 for the range of expected temperature increases between 1.5 °C and 4.5 °C [,]. The main factors in this process are negative effects on public health (0.9%) and damage to agriculture (0.8%). At the same time, health damage will increase almost twofold and agriculture damage will triple between 2040 and 2060 []. According to the Federal Service for Hydrometeorology and Environmental Monitoring (Roshydromet), the territory of Russia is warming twice as fast as the world as a whole—by 0.51 °C per decade. Every decade from the one from 1981 as been warmer than the previous one, and nine of the ten warmest years were recorded in the 21st century []. The scale of observed and expected climate change in the 21st century allows us to consider it one of the most significant risks for the socio-economic development of various regions of Russia. This has been confirmed by available quantitative assessments and forecasts about how climate change will affect long-term GDP growth rates globally.
Climate change can have both positive and negative consequences for the Russian socio-economic system. Given that most of Russia’s territory lies in areas with severe climatic conditions, global warming could reduce winter energy costs, improve living standards in the northern regions, and partially improve agriculture. Natural and climatic factors continue to be significant factors in determining the types of farming systems and industrial specialization in countries and regions. Accordingly, in the long term, their changes can lead to negative effects in social and economic systems. In terms of assessment in Russia, most damage caused by climate-related hazards is likely to occur in industries such as agriculture—60%, energy—8.5%, transport—8.5, utility—8.9%, and construction—6.8% of the total damage in the country [].
Climate change also poses several social risks. Warming in various regions of Russia may lead to an increase in mortality among the population, the spread of pests and viruses, a decrease in the population’s standard of living, and other socio-economic problems, which will cause significant damage to households and regional communities. The risk of damage from climate-related hazards depends not only on the frequency and intensity of these events but also on society’s vulnerability and ability to cope and to adapt. Social vulnerability to climate-related hazards determines whether a hazardous event becomes a disaster or not and whether significant damage is caused or not []. A region is at high risk if it is highly disaster-prone and its society is highly vulnerable []. The need to identify the internal characteristics of Russian regions that indicate unresolved or emerging social problems that weaken their ability to function in emergency situations makes the study of the socio-economic vulnerability of Russian regions relevant. In this paper, we define socio-economic vulnerability as “a tendency or predisposition to adverse effects”, following the definition of the Intergovernmental Panel on Climate Change (IPCC). The risk of such vulnerability depends on the likelihood of climate-related hazards occurring.
The territory of the Russian Federation includes four climatic zones. This means that vulnerability to climate risks varies considerably in different regions of the country. Moreover, the regions differ significantly in size, meaning that different climates are represented within individual regions. This may lead to different social consequences from climate-related hazards for people in these regions. Differences in the vulnerability of regions to the climate risks associated are also related to the structures of regional economies and practices of environmental management in each territory.
The Tyumen region is the 24th largest in the country, covering 160.1 thousand square kilometers. It has several features that determine its natural and climatic conditions including the following:
- The presence of the Ural Mountains in the north, which intercepts a significant portion of moisture coming from the Atlantic Ocean.
- The predominance of plains that are open to both cold air from the Arctic and warm air.
- A continental climate characterized by long, cold winters; short, hot summers; brief springs with returning cold; and early frosts in autumn.
- Several natural and climactic zones such as the taiga-forest zone (southern taiga and Subtaiga) and the forest-steppe zone (northern forest-steppes and central forest-steppes): these zones generally determine the types of economic activity in the region’s municipalities.
The Tyumen region ranks 29th in the country in terms of population and 13th in terms of natural growth. It has a developed and diverse economy, and ranks 33rd in the Russian Federation in terms of material well-being. The assessment of existing climate risks shows that the region is exposed to various dangerous climate factors, which could lead to material damage if climate-related hazards occur. Three climate factors in particular—floods, forest fires (fire hazards), and strong winds (storms, hurricanes, and tornadoes)—caused material damage in the region over the period from 2000 to 2022 that amounted to RUB 2754.98 million. The predicted damage from climate risks in the period 2024–2050 is about RUB 1160 million per year. To ensure sustainable climate security in the region, it is necessary to take preventive measures to protect infrastructure and public health from fire hazards, droughts, floods, strong winds, and heat waves. Although economic damage caused by the occurrence of dangerous fires in the region has been well documented, socio-economic risks from climate change to the region’s population have not yet been assessed. Nor have issues of socio-economic vulnerability been systematically addressed.
The aim of the article is to assess the socio-economic vulnerability to climate change in the territories of the Tyumen region based on the World Risk Index methodology and objective data on dangerous natural and climatic phenomena in the region. Our study resulted in the ranking of the Tyumen region municipalities by risk level and the spatial visualization of the ranking results by socio-economic vulnerability risk level. The theoretical contribution of the study was the identification of clusters of municipalities with similar socio-economic indicators and the identification of management decisions necessary to reduce risks.
2. Theoretical Review
Any changes in the structure of the country’s economy due to climate change will have consequences for the social system and people’s quality of life, including food availability, health, suitability for housing and economic activity, human capital, etc. []. Y.M. Plyusnin distinguishes between both the social consequences of climate change for local and regional communities as well as the global consequences for society. For local communities, it strikes at the existing social structures, unity, and social solidarity []. Y.M. Plyusnin identifies four types of consequences of this kind: the influx of newcomers into a local community, the simplification of social structures, weakening due to people leaving, and finally, the disappearance of settlements in uninhabitable territories []. The author draws a connection between the effects of climate change on global society and the effects on urban areas, which are often catastrophic. The author points out that the quality of life in cities today depends largely on the efficient functioning of urban infrastructure. A minor malfunction in the operation of urban systems can have disastrous consequences. To illustrate this, we can look at the aftermath of Hurricane Katrina, which caused widespread damage to power grids, buildings, and other structures in US cities. Small towns and villages, as well as large cities, remain vulnerable to climate-related hazards.
At the same time, the problem of choosing a methodology for assessing the socio-economic vulnerability of the population to dangerous hydrometeorological phenomena is still open []. Pasovets Y.M. [] and Bessonova T.N. [] point out that today, there is currently no universal understanding of vulnerability. According to Bessonova, the concept of vulnerability is used in different sciences and can vary depending on the purpose of the study in question. Within the humanities, vulnerability is perceived as a characteristic of the conditions of households or communities that is determined by economic, social, and political factors []. It is the result of societal and economic developments, as well as of political decisions. Sociologists see vulnerability as a set of socio-economic factors that determine the ability of people to cope with stress or change. Climatologists define vulnerability as the likelihood of weather and climate impacts on human activities. International research has focused on how vulnerable areas and communities are to climate-related hazards such as floods [], droughts [], cyclones [], and climate change and environmental degradation leading to environmental stress [,].
Two main approaches are used to study the vulnerability of social systems to climate change []. These approaches distinguish between social and physical (territorial) vulnerability []. The first approach considers vulnerability in terms of the state of the system. This state is determined by its internal characteristics and is pre-existing in the system before it is exposed to climate-related hazards. This type of vulnerability is called social (social vulnerability) and is described by indicators reflecting social susceptibility to external influences such as poverty, inequality, and marginalization. T.N. Bessonova notes that the modern interpretation of social vulnerability corresponds to the concept of the sensitivity (susceptibility) of the system to external factors []. S.P. Zemtsov believes that vulnerability to climate change can be determined by the likelihood of deterioration in well-being or death, depending mainly on age, health, lifestyle, working conditions, and the level of public awareness [].
The second approach considers social vulnerability in relation to hazards, which is usually referred to in foreign studies as biophysical or physical vulnerability []. According to this approach, the assessment considers the nature of the possible physical hazard (frequency, probability of occurrence) and its impact on the social system, measured in terms of potential damage if a hazardous phenomenon occurs. Several indicators are used to measure biophysical vulnerability, including changes in the exposed population, mortality, production costs, and monetary costs/damage to ecosystems []. This approach considers the nature of the possible physical hazard (frequency, probability of occurrence of the event) and its impact on the social system, measured in terms of the amount of potential damage resulting from the occurrence of a hazardous phenomenon. A few indicators are used to measure biophysical vulnerability, such as changes in the number of people exposed, mortality rates, production costs, monetary costs/damage to ecosystems, etc.
The World Risk Index has been used for over 10 years by scientists around the world to understand disaster risk for the purposes of disaster risk reduction and spatial planning []. The focus of the World Risk Index is on understanding risk, which is defined as the interaction between physical hazards and vulnerability elements. The World Risk Index has been validated by means of statistical analysis. Its methodology is used to assess the vulnerability of different territories to climate risks in Russian studies.
According to the World Risk Index Methodology, vulnerability includes the following elements: susceptibility, which characterizes the consequences of the climate-related hazards for the economy and people; coping capacity, which demonstrates the ability of a territory to cope with the consequences of climate-related hazards; and adaptive capacity, which is related to the ability of the population to prepare for the possibility of the appearance of climate-related hazards in the future [,]. Vulnerability to climate risks is calculated based on three sets of indicators describing the social, economic, and environmental conditions of society.
The susceptibility of a territory largely depends on the age structure, living conditions of the population, and the contribution of the region’s economy. Three indicators have been chosen to analyze susceptibility: the proportion of the people living in dilapidated and emergency housing, the percentage of the non-working-age population, and the size of the GRP per capita. These indicators directly affect vulnerability. The non-working age population and those living in dilapidated or emergency conditions are more vulnerable. Likewise, the more intense the economic activity in the area is, and the higher the GRP per capita, the higher the possible material damage in the event of climate-related hazards will be.
Old and unsafe dwellings are more prone to collapse []. The deterioration of physical infrastructure increases the likelihood of injury or death from climate-related hazards []. The dependence of the economy and population on complex utilities such as water, electricity, and telecommunications that are affected by hazards can also increase the overall risk []. The proportion of the non-working-age population is related to older people’s increased health problems from hazards while young children do not have cognitive or motor skills to seek help and may have difficulty communicating their symptoms to others []. In addition, older people and young children are more vulnerable to injury due to mobility impairment. They have weaker immune systems, and are more likely to become anxious during hazardous events, which makes them more likely to get sick or suffer psychological trauma []. Overall, the non-working-age population is among the most vulnerable to climate-related hazards and needs greater social protection [,]. Research shows that people with financial constraints or low socio-economic statuses who do not have the means to prepare for natural disasters or deal with their aftermaths are particularly affected by hazard events and their consequences [,]. The next indicator—the gross domestic product per capita—is interpreted in the scientific literature as “economic potential”. In the long term, it indicates the ability to rebuild the economy after a hazardous event. However, researchers note that at the time of the occurrence of a hazardous event, the economic damage is proportional to the size of the economy. This is because climate-related hazards lead to a greater destruction of infrastructure and loss of profit. Therefore, in terms of the appearance of climate-related hazards, the higher this indicator is, the higher the damage will be.
Coping capacity is the ability to cope with a situation and includes measures and resources that can be immediately implemented and are available to reduce damage in the event of climate-related hazards. Coping capacity depends on the parameter of the effectiveness of state and local government policies. This is reflected in indicators such as the government effectiveness rating, number of doctors per 10,000 people, number of hospital beds per 10,000 people, and social support for the population. Indicators included in coping capacity have an inverse effect on vulnerability. The more indicators are related to healthcare for people, the less vulnerable they are to climate-related risks. The effectiveness of the government has an inverse correlation with vulnerability: the more effective it is, the less vulnerability there is. Similarly, the ability of the population to cope with the consequences of floods, hurricanes, droughts, and other climate-related hazards increases with the amount of spending on social support for the population.
Health-related indicators reflect a situation where the risks of negative consequences increase with the appearance of climate-related hazards and the success of response depends largely on the availability of healthcare structures and provision of qualified assistance []. Therefore, researchers focus on using indicators such as the number of doctors per number of inhabitants and the availability of health infrastructure to assess the ability of healthcare workers and emergency responders to receive and care for victims of climate-change-related hazards [,,]. In addition to medical care, hazard victims need food, clothing, and shelter to cope with the consequences of climate-related hazards. Public authorities can prevent social conflicts and crime by providing these things quickly and adequately to victims and by eliminating the catastrophic effects of climate-related hazards. Therefore, providing public relief services is a part of risk management and depends on the effectiveness of the government. The amount of social support for the population is another indicator reflecting the effectiveness of public administration after the appearance of climate-related hazards. Based on these indicators, it is possible to assess the effectiveness of measures taken to reduce the damage caused to the population by climate-related hazards.
The adaptive capacity of the territory to predicted climate change is reflected in the third set of indicators. Adaptive capacity is understood as a long-term strategic process that includes the profitability of organization, level of education, and investment. Adaptive capacity depends on the level of education, which, in this study, was represented by the proportion of people not completing their education. Long-term economic strength depends on indicators related to the population’s food supply (the profitability indicator of agricultural organizations) and the ability to attract financial flows, expressed by the volume of investments in large and medium-sized enterprises. These indicators have an inverse effect on vulnerability, which decreases as the number of educated people increases, profitability increases, and volume of investment increases.
To reduce the risks of climate-related hazards, education provides skills and experience []. Researchers consider education a key factor in reducing risks and recovering from climate-related hazards and a way of systematically investing in human capital [,]. Schooling is the basis for developing a person’s skills [], especially for those facing changing climate conditions. Another indicator of development prospects is investment. Investment is needed today to transform economic systems in the context of a changing climate, to use digital technologies and modeling tools to improve their efficiency, and to develop sustainable production chains with low carbon footprints. In addition, promising economic growth supported by investment will lead to a reduction in social inequalities and stimulate education and the development of healthcare [], which will reduce the risks of climate-related hazards. The adaptive, long-term development of agricultural production capable of adapting to the possible consequences of climate change can satisfy the basic needs of the population []. The ability of agricultural enterprises to adopt new technologies and transform themselves depends on their financial capacity [], what financial profitability reflects.
The list of indicators included in the calculation of the socio-economic vulnerability risk in this study was limited by municipal statistics. Values of the indicators for cities (Tyumen, Tobolsk, Ishim, and Yalutorovsk) were included in those of the corresponding municipal districts. To calculate the index, an algorithm was used that included (1) constructing a set of initial indicators, (2) standardizing, (3) introducing weights for the indicators, and (4) applying the final formula for calculating the vulnerability index [].
3. Materials and Methods
The World Risk Index methodology was used to calculate the risk of socio-economic vulnerability to climate-related hazards []. We used only official data, so we selected the indicators from the Federal State Statistics Service (https://rosstat.gov.ru/dbscripts/munst/munst71/DBInet.cgi#1) (accessed on 25 October 2024). The threshold aggregation method was used to determine the final rating. The indices calculated using the threshold aggregation method of indicators defined a typology of objects, highlighting problematic objects, i.e., objects with at least one “bad” indicator.
The calculation method was based on four indicators: the risk of realization of climate-related hazards, susceptibility, coping capacity, and adaptive capacity (Formula (1)).
Rm.i. = Rrcrh (0.33Iss + 0.33Iscs + 0.33Isac)
Rrcrh—risk of realization of the climate-related hazards;
Iss—indicator of the society’s susceptibility;
Iscs—indicator of the society’s coping capacity;
Isac—indicator of the society’s adaptive capacity.
This methodology had already been used to assess the vulnerability of some Russian regions to climate-related hazards [,].
On the basis of this methodology, the risk of socio-economic vulnerability to climate change was calculated for the municipalities in the Tyumen region.
The risk of the occurrence of climate-related hazards was calculated based on data from the Russian Ministry of Emergency Situations for the Tyumen region and meteorological observations for the period 1971–2023 [] (see p. 225). According to these data, floods, strong winds, and forest fires are the most dangerous climate-related hazards in the Tyumen region.
The risk of recurrence of climate-related hazards was rated from 0 to 1, where 0 meant that no climate-related hazards would occur and 1 meant that climate-related hazards would occur within one year. After the calculation of the probability of the occurrence of the hazardous phenomena, each risk was assigned a corresponding rank from 1 to 5. Rank 1 indicated a low probability of occurrence of hazardous phenomena. Rank 5 indicated a high probability of occurrence of climate-related hazards.
Socio-economic vulnerability reflects the susceptibility of society and the economy to climate hazards; the ability to quickly respond and, in the short term, neutralize the consequences of natural disasters; and the strategic adaptive potential of society and local government to restore functioning with minimal losses before the occurrence of climate hazards.
The distribution of specific indicators for the three components of society’s vulnerability is presented in Table 1.

Table 1.
Socio-economic indicators used in calculating the socio-economic vulnerability of municipalities.
The calculation of each of the risk components was based on the values of socio-economic indicators taken from the website of the Federal State Statistics Service for municipalities for the period 2021–2022, with subsequent mathematical aggregation into indices and transformation into ranks from 1 to 5. By applying weights, the indicator for each social risk component was aggregated. In line with the World Risk Index calculation methodology, the weights were equally distributed across all indicators []. However, for the purposes of this calculation, the weights were confirmed by expert assessment.
4. Results
The calculated values for each component of the socio-economic vulnerability were summed with the corresponding weights (Formula (1)) and multiplied by the risk of realization of the climate-related hazards. In this way, the risk of socio-economic vulnerability to climate change was calculated for each municipality. Each value was assigned a corresponding rank, as shown in Table 2.
Table 2.
Five groups of municipalities in terms of socio-economic vulnerability.
Geoinformation mapping tools were used to spatially represent the risk of the occurrence of a hazardous event and the risk of socio-economic vulnerability of the population (Figure 1 and Figure 2).
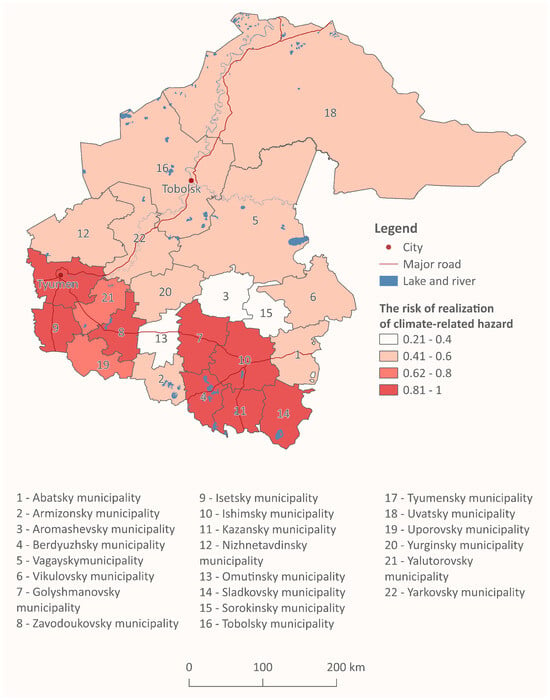
Figure 1.
The risk of realization of climate-related hazards.
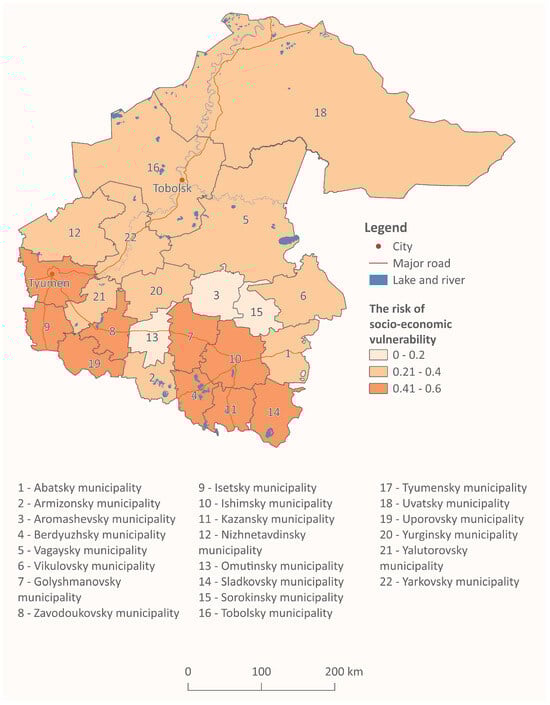
Figure 2.
The risk of socio-economic vulnerability to climate-related hazards for the Tyumen region population.
The spatial risk analysis of socio-economic vulnerability allowed us to identify two territorial clusters with the highest levels of socio-economic vulnerability: the Ishimsky, Golysh-manovsky, Berdyuzhsky, Kazansky, and Sladkovsky municipalities and the Tyumensky, Isetsky, Zavodoukovsky, and Uporovsky municipalities (Figure 2). This was due to a high proportion of elderly people and children in the population [,] and a high level of industrial development, which can increase material damage []. Some areas had a high proportion of dilapidated and temporary housing, increasing the risk of catastrophic consequences in an emergency.
The high risk of realization of climate-related hazards in these clusters, such as floods, forest fires, and strong winds (Figure 1), affected their socio-economic vulnerability.
A high risk of climate-related hazards occurring in the Tyumen region was observed in eight out of twenty-two municipalities []. In 11 municipalities, the risk of realization of climate-related hazards was above average, and in 11 municipalities, it was average. The risk of climate-related hazards was below average in only three municipalities. The risk of socio-economic vulnerability depends on the risk of realization of climate-related hazards and indicators of vulnerability, the coping capacity, and the adaptive capacity.
For a better understanding of the causes of vulnerability and possible ways of managing risks, five groups of municipalities with similar characteristics in terms of socio-economic vulnerability could be identified (Table 2).
A visualization of the five groups of municipalities in terms of their socio-economic vulnerability is presented in Figure 3.
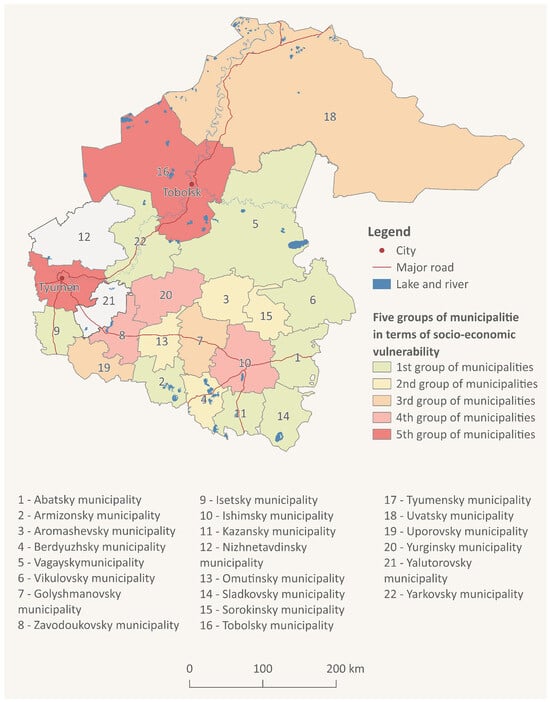
Figure 3.
Visualization of the five groups of municipalities in terms of their socio-economic vulnerability.
The results allow us to identify the groups of municipalities with similar socio-economic vulnerability indicators in order to develop the management decisions that are needed to reduce risk. Table 3 shows the recommended areas for the reduction of the risks of socio-economic vulnerability for five groups of municipalities.
Table 3.
Recommended directions for reducing the risks of socio-economic vulnerability.
5. Discussion
Municipalities in the first group had an above-average risk in terms of their coping capacity against climate-related hazards, average risk in terms of adaptive capacity, and below-average risk in terms of susceptibility. Risk management in these municipalities should focus on the effectiveness of governance, medicine, and social support because coping capacity indicators are insufficient. To reduce risks, programs must be developed to increase the availability of healthcare and social support in the event of climate-related hazards [], as must be measures for the improvement of the efficiency of local governments.
Municipalities in the second group were characterized by above-average risks in terms of their coping capacity against climate-related hazards and adaptive capacity but below-average risks in terms of susceptibility. To reduce the risks of social and economic vulnerability in these predominantly rural municipalities, which are often far from regional centers, mobile or remote healthcare systems [] and social support programs [] for the population are needed. Additional support and investment in agricultural business are required [].
Municipalities of the third group were characterized higher risks in terms of susceptibility compared to municipalities in the second group and equally high risks associated with both their coping capacity against climate-related hazards as well as their adaptive capacity. Therefore, to reduce these risks, it is necessary to implement a set of measures at the times when climate-related events occur and reduce the risk of long-term consequences []. These may include social support programs; investment programs, particularly in the agricultural sector; measures to develop the health system; and educational programs aimed at different population groups [].
Municipalities in the fourth group were characterized by an average value of all risks related to susceptibility, coping capacity, and adaptive capacity. To manage risks in municipalities of this group, supportive measures for three groups of indicators are needed to cope with the consequences of climate-related hazards and to prepare for the possibility of future climate-related hazards [].
Municipalities of the fifth group were characterized by below-average risks in terms of coping capacity and adaptive capacity and above-average susceptibility risks. Reducing risks in these municipalities requires developing insurance, improving people’s living conditions, and developing emergency services [].
Two municipalities with unique combinations of indicators were not included in the groups presented above. One of these municipalities had an average value for susceptibility and adaptive capacity and an above-average value for coping capacity; the other municipality had an average susceptibility, an above-average value for coping capacity, and a below-average value for adaptive capacity. These values indicated that these counties were less prepared to neutralize the consequences of climate-related hazards in the short term compared to the long term.
Furthermore, there is a need to monitor and develop responses to different threats associated with climate-related hazards. For example, rising temperatures can lead to an increase in the spread of bacteria and viruses, which can begin to actively multiply in a warm climate []. Global warming also increases the risk of the spread of several infectious diseases. This requires monitoring the epidemiological situation and developing an action plan to reduce the risk. The climate change in the future may cause another problem, such as the forced migration of populations []. It is assumed that due to climate disasters, millions of refugees will come from different regions of the world. In addition, an increase in internal migration and the migration of the population within regions is possible []. The Tyumen region may become attractive to migrants, so this should be considered in adaptation measures. Climate migration to the Tyumen region may cause additional socio-economic issues in the next 50–100 years. These issues need to be addressed now by regional and national decision-makers.
6. Conclusions
We used the World Risk Index methodology and data on the most dangerous climate-related hazards for the population of the Tyumen region to assess the risk of socio-economic vulnerability. Socio-economic vulnerability was analyzed as a set of three components. It included several indicators. The first element—susceptibility—characterized the consequences of climate-related hazards. The second element—coping capacity—was an indicator of the territory’s ability to cope with the consequences of climate-related hazards. The third element—adaptive capacity—reflected the ability of the population to prepare for the possibility of future dangerous climate-related hazards.
The analysis conducted allowed us to draw the following conclusions:
- (1)
- There are two territorial clusters with the highest socio-economic vulnerability values, including the largest cities in the Tyumen region. These same areas are characterized by a highest risk of realization of climate-related hazards. Risk reduction measures should be taken first for these territories;
- (2)
- Municipalities of the Tyumen region can be divided into five groups with similar characteristics in terms of susceptibility, coping capacity, and adaptive capacity for a better understanding of the causes of vulnerability and possible ways of managing risks;
- (3)
- An analysis of socio-economic vulnerability indicators in each of the five groups of municipalities allows us to suggest directions of risk reduction activities such as governance efficiency, medicine, investments, social support, insurance, housing construction, resettlement, etc. This reduces the costs of developing and implementing adaptation measures and makes them more focused.
The study will help authorities identify the main risks to communities from climate-related hazards and develop measures to reduce the risks of socio-economic vulnerability. Specific measures to adapt to climate change and reduce climate impacts can be proposed for each group of municipalities. Each proposed direction of risk reduction activities can be specified as a set of measures. For example, housing construction can be organized as measures to repair residential and industrial buildings and other facilities, stimulating the use of new materials and technologies in the reconstruction of climate-vulnerable facilities. Insurance can be organized as measures to subsidize insurance programs. Education can be organized as the preparation of the population in case of the realization of climate-related hazards. The Tyumen Region Government is currently in the process of developing a climate change adaptation plan. The results of our study can be used to identify key risks, territories at risk, and adaptation measures.
The limitations of the study are related to the limited amount of statistical data available for individual municipalities of the Tyumen region. It is impossible to use aggregated regional data when analyzing risks for individual municipalities. As the study proved, these municipalities have unique natural and socio-economic characteristics. Therefore, the development of municipal statistics will allow us to better understand the structure of the risks of socio-economic vulnerability to climate-related hazards and to develop detailed recommendations for risk reduction. Another limitation is that although the Federal State Statistics Service collects standard data for the entire country, it is not suitable for calculations in accordance with international methodologies. Therefore, a more detailed study of socio-economic vulnerability requires collecting additional data using other research methods such as social media analysis or remote sensing.
Author Contributions
O.Z., project administration, writing—original draft; E.K., literature research, writing; N.V., data collection and analysis, writing; V.G., conceptualization, methodology, writing; V.Y., literature screening, visualization. All authors have read and agreed to the published version of the manuscript.
Funding
This study was supported by the Ministry of Science and Higher Education of the Russian Federation within the framework of the Carbon Measurement Test Area in Tyumen Region (FEWZ-2024-0016).
Institutional Review Board Statement
Not applicable.
Informed Consent Statement
Not applicable.
Data Availability Statement
The original contributions presented in the study are included in the article, and further inquiries can be directed to the corresponding author.
Conflicts of Interest
The authors declare no conflicts of interest.
References
- Intergovernmental Panel on Climate Change (IPCC). Summary for Policymakers. In Climate Change 2022—Impacts, Adaptation and Vulnerability: Working Group II Contribution to the Sixth Assessment Report of the Intergovernmental Panel on Climate Change; Cambridge University Press: Cambridge, UK, 2023; pp. 3–34. [Google Scholar]
- Dellink, R.; Lanzi, E.; Chateau, J.; Bruin, K.; Bosello, F.; Parrado, R.; OECD. The Economic Consequences of Climate Change; OECD Publishing: Paris, France, 2015. [Google Scholar] [CrossRef]
- Intergovernmental Panel on Climate Change (IPCC). Climate Change 2022: Impacts, Adaptation and Vulnerability; Pörtner, H.-O., Roberts, D.C., Tignor, M., Poloczanska, E.S., Mintenbeck, K., Alegría, A., Craig, M., Langsdorf, S., Löschke, S., Möller, V., et al., Eds.; Contribution of Working Group II to the Sixth Assessment Report of the Intergovernmental Panel on Climate, Change; Cambridge University Press: Cambridge, NY, USA, 2022; pp. 3–33. [Google Scholar] [CrossRef]
- Terentyev, N.E. Climate change as a factor in the development of companies: Corporate strategies and guidelines for state industrial policy. Probl. Forecast. 2021, 5, 54–63. (In Russian) [Google Scholar] [CrossRef]
- Science-Intensive Technologies. The Third Assessment Report on Climate Change and Its Consequences in the Russian Federation; General Summary; Science-Intensive Technologies: St. Petersburg, Russia, 2022. (In Russian) [Google Scholar]
- Sokolova, I.A. Osobennosti strakhovaniya prirodno-klimaticheskikh riskov. Vestn. KraSGAU 2011, 2, 14–20. (In Russian) [Google Scholar]
- Kobysheva, N.V.; Akentyeva, E.M.; Galyuk, L.P. Climate Risks and Adaptation to Climate Change and Variability in the Technical Sphere; Kirillitsa Publishing House: St. Petersburg, Russia, 2015; Available online: http://mgmtmo.ru/edumat/climat/Kobysheva_climate_risks.pdf (accessed on 25 October 2024). (In Russian)
- Climate Safety Passport of the Altai Republic. 2022. Available online: https://минэко04.рф/upload/site/КЛИМАТИЧЕСКИЙ%20ПАСПОРТ%20РА.pdf (accessed on 25 October 2024).
- UN. What Is Climate Change? Available online: https://www.un.org/en/climatechange/what-is-climate-change (accessed on 25 October 2024).
- Plyusnin, Y.M. Climate Change and Its Impact on Human Life: Methodological Guidance on Organizing and Implementing “People’s Monitoring” of Climate Change and Its Impact on Environmental Management and Human Life in the North; Scientific World Publishing House: Moscow, Russia, 2013; 200p, Available online: https://publications.hse.ru/books/74479860 (accessed on 25 October 2024). (In Russian)
- Osipov, V.I.; Burova, V.N.; Zaikanov, V.G.; Minakova, T.B. Fundamentals of Assessing Territory Vulnerability to Hazardous Natural Processes Determining Emergencies (Principles and Approaches). Geoekologiya Inzheneraya Geol. Gidrogeol. Geokriol. 2015, 3, 195–203. (In Russian) [Google Scholar]
- Pasovets, Y.M. Socio-economic vulnerability of regional communities: Sociological interpretation and assessment. Econ. Soc. Chang. Facts Trends Forecast. 2023, 16, 236–253. (In Russian) [Google Scholar] [CrossRef]
- Bessonova, T.N. Assessment of the vulnerability of the northern regions to natural hazards caused by climate change. Bull. Res. Cent. Corp. Law Manag. Ventur. Investig. Syktyvkar State Univ. 2023, 3, 419–427. (In Russian) [Google Scholar] [CrossRef]
- Nguyen, C.V.; Horne, R.; Fien, J.; Cheong, F. Assessment of social vulnerability to climate change at the local scale: Development and application of a Social Vulnerability Index. Clim. Chang. 2017, 143, 355–370. [Google Scholar] [CrossRef]
- Tanir, T.; Sumi, S.J.; Lima, A.D.S.; Coelho, G.D.A.; Uzun, S.; Cassalho, F.; Ferreira, C.M. Multi-scale comparison of urban socio-economic vulnerability in the Washington, DC metropolitan region resulting from compound flooding. Int. J. Disaster Risk Reduct. 2021, 61, 102362. [Google Scholar] [CrossRef]
- Sun, Y.; Li, Y.; Ma, R.; Gao, C.; Wu, Y. Mapping urban socio-economic vulnerability related to heat risk: A grid-based assessment framework by combining the geospatial big Data. Urban Clim. 2022, 43, 101169. [Google Scholar] [CrossRef]
- Mandal, K.; Dey, P. Coastal vulnerability analysis and RIDIT scoring of socio-economic vulnerability indicators—A case of Jagatsinghpur, Odisha. Int. J. Disaster Risk Reduct. 2022, 79, 103143. [Google Scholar] [CrossRef]
- Dutta, S.; Chatterjee, S. Assessment of socio-economic vulnerability in a forested region: An indicator-based study in Bankura District of West Bengal, India. In Geospatial Technology for Environmental Hazards. Advances in Geographic Information Science; Springer: Cham, Switzerland, 2022. [Google Scholar] [CrossRef]
- Ravichandran, V.; Kantamaneni, K.; Periasamy, T.; Roy, P.D.; Killivalavan, J.; Sundar, S.; Chokkalingam, L.; Palanisamy, M. Monitoring of multi-aspect drought severity and socioeconomic status in the semi-arid regions of Eastern Tamil Nadu, India. Water 2022, 14, 2049. [Google Scholar] [CrossRef]
- Brooks, N.; Neil, A.W.; Kelly, M.P. The determinants of vulnerability and adaptive capacity at the national level and the implications for adaptation. Glob. Environ. Chang. 2005, 15, 151–163. [Google Scholar] [CrossRef]
- Johns, R.A.; Dixon, B.; Pontes, R. Tale of two neighbourhoods: Biophysical and socio-economic vulnerability to climate change in Pinellas County, Florida. Local Environ. 2020, 25, 697–724. [Google Scholar] [CrossRef]
- Zemtsov, S.P.; Shartova, N.V.; Konstantinov, P.I.; Varentsov, M.I.; Kidyaeva, V.M. Vulnerability of the Population of Moscow Districts to Hazardous Natural Phenomena. Bull. Mosc. University. Ser. 5 Geogr. 2020, 4, 3–13. (In Russian) [Google Scholar]
- Welle, T.; Birkmann, J. The World Risk Index—An Approach to Assess Risk and Vulnerability on a Global Scale. J. Extrem. Events 2015, 2, 1550003. [Google Scholar] [CrossRef]
- Livenets, A.S. Comprehensive Assessment of Flood Risks in the Jewish Autonomous Region. Reg. Geosystems 2023, 47, 296–305. (In Russian) [Google Scholar] [CrossRef]
- Prall, M.C.; Brandt, U.S.; Halvorsen, N.S.; Hansen, M.U.; Dahlberg, N.; Andersen, K.J. A comprehensive approach for assessing social flood vulnerability and social flood risk: The case of Denmark. Int. J. Disaster Risk Reduct. 2024, 111, 104686. [Google Scholar] [CrossRef]
- Dwyer, A.; Zoppou, C.; Nielsen, O.; Day, S.; Roberts, S. Quantifying Social Vulnerability: A Methodology for Identifying Those at Risk to Natural Hazards; Geoscience Australia Record 2004/14; Geoscience Australia: Canberra, Australia, 2004. [Google Scholar]
- Cutter, S.; Boruff, B.; Shirley, W. Social Vulnerability to Environmental Hazards. Soc. Sci. Q. 2003, 84, 242–261. [Google Scholar] [CrossRef]
- Koks, E.E.; Jongman, B.; Husby, T.G.; Botzen, W.J.W. Combining hazard, exposure and social vulnerability to provide lessons for flood risk management. Environ. Sci. Policy 2015, 47, 42–52. [Google Scholar] [CrossRef]
- Lipatov, V.A.; Solomakhin, A.A.; Berzin, D.V.; Tochilkina, T.E. Analysis of environmental vulnerability of the population of Krasnodar Krai based on a multifactor demographic model. Population 2024, 27, 96–110. (In Russian) [Google Scholar] [CrossRef]
- Bychkova, L.V.; Chernysheva, E.V. Key priorities of social support for elderly people within the framework of state policy. Politics Econ. Innov. 2023. Available online: https://pei-journal.ru/index.php/PEII/article/view/1147 (accessed on 25 October 2024). (In Russian).
- Breil, M.; Downing, C.; Kazmierczak, A.; Romanovska, L.; Terama, E.; Swart, R. Social Vulnerability to Climate Change in European Cities—State of Play in Policy and Practice; European Topic Centre on Climate Change Impacts, Vulnerability and Adaptation (ETC/CCA) Technical Paper 2018/1; European Environment Agency: Copenhagen, Denmark, 2018. [Google Scholar] [CrossRef]
- World Health Organization. Climate Change. Available online: https://www.who.int/health-topics/climate-change#tab=tab_1 (accessed on 25 October 2024).
- Howkins, J.; Schmidt, D.N.; Thomas, J.; Hayward, R.; Lo, Y.T.E.; Neal, J.; Lewis, J.; Carruthers, E.; Coleborn, S.; Murray, V.; et al. Mapping vulnerability to climate-related hazards to inform local authority action in adaptation: A feasibility study. Public Health Pract. 2024, 8, 00549. [Google Scholar] [CrossRef]
- Revich, B.A. Climate change in Russia—Problems of public health. Public Health 2021, 1, 5–14. (In Russian) [Google Scholar] [CrossRef]
- Offices of the Federal State Statistics Service for the Tyumen Region, Khanty-Mansi Autonomous Okrug-Yugra and Yamalo-Nenets Autonomous Okrug (Tyumenstat). (In Russian). Available online: https://72.rosstat.gov.ru/ofs_transp_ug (accessed on 25 October 2024). (In Russian)
- Scolobig, A.; Balsiger, J. Emerging trends in disaster risk reduction and climate change adaptation higher education. Int. J. Disaster Risk Reduct. 2024, 105, 104383. [Google Scholar] [CrossRef]
- Holloway, A.; Triyanti, A.; Rafliana, I.; Yasukawa, S.; de Kock, C. Leave no field behind: Future-ready skills for a risky world. Prog. Disaster Sci. 2019, 1, 100002. [Google Scholar] [CrossRef]
- Pham, H.; Saner, M.; Coe, I. Framework and proposed indicators for the comprehensive evaluation of inclusiveness: The case of climate change adaptation. FACETS 2024, 9, 1–15. [Google Scholar] [CrossRef]
- Baker, E.; Kerr, R.B.; Deryng, D.; Farrell, A.; Gurney-Smith, H.; Thornton, P. Mixed farming systems: Potentials and barriers for climate change adaptation in food systems. Curr. Opin. Environ. Sustain. 2023, 62, 101270. [Google Scholar] [CrossRef]
- Tang, K. Agricultural adaptation to the environmental and social consequences of climate change in mixed farming systems: Evidence from North Xinjiang, China. Agric. Syst. 2024, 217, 103913. [Google Scholar] [CrossRef]
- Livenets, A.S. Methodology for social vulnerability index to floods in Jewish Autonomous Region. Reg. Probl. 2022, 25, 139–141. (In Russian) [Google Scholar] [CrossRef]
- World Risk Report 2014. Available online: https://i.unu.edu/media/ehs.unu.edu/news/4070/11895.pdf (accessed on 25 October 2024).
- Khoroshavin, V.Y.; Zakharova, O.V.; Viktorova, V.V.; Karagulian, E.A.; Dobryakova, V.A.; Idrisov, I.I. Report on the Research Work “Development of a Climatic Safety Passport for the Territory of the Tyumen Region and Assessment and Forecasting of Climatic Risks for the Territory”; University of Tyumen: Tyumen, Russia, 2024; 285p. [Google Scholar]
- World Risk Report 2011. Available online: https://collections.unu.edu/eserv/UNU:2046/WorldRiskReport-2011_online_EN.pdf (accessed on 25 October 2024).
- Filippova, V.V.; Grigoriev, S.A. At the mercy of the elements: Rural communities of Yakutia in the conditions of devastating floods of the 20th century. (using the example of the village of Khotochchu of Zhemkonsky 1st nasleg of the Khangalassky ulus). Arct. Antarct. 2022, 4, 20–42. (In Russian) [Google Scholar]
- Lee, D.W.; Lee, D.S. Government disaster relief services and disaster conflict. Int. J. Disaster Risk Reduct. 2024, 106, 104461. [Google Scholar] [CrossRef]
- Mitchell, S.M.; Pizzi, E. Natural Disasters, Forced Migration, and Conflict: The Importance of Government Policy Responses. Int. Stud. Rev. 2021, 23, 580–604. [Google Scholar] [CrossRef]
- Kurichev, N.K.; Vinogradova, V.V.; Sheludkov, A.V.; Glezer, O.B. Vulnerability of the Russian population to climate risks. Sci. Dig. 2022, 10. Available online: https://www.hse.ru/data/2022/10/31/1720402415/Human_Capital_NCMU_Digest_15_Vulnerabili..opulation_to_Climate_Risks_2022.pdf (accessed on 25 October 2024). (In Russian).
- Rufat, S.; Tate, E.; Burton, C.G.; Maroof, A.S. Social vulnerability to floods: Review of case studies and implications for measurement. Int. J. Disaster Risk Reduct. 2015, 14, 470–486. [Google Scholar] [CrossRef]
- Ledeneva, V.Y. Climate Migration: Trends and Forecasts. Proc. Southwest State Univ. Ser. Econ. Sociol. Manag. 2021, 11, 233–242. (In Russian) [Google Scholar] [CrossRef]
Disclaimer/Publisher’s Note: The statements, opinions and data contained in all publications are solely those of the individual author(s) and contributor(s) and not of MDPI and/or the editor(s). MDPI and/or the editor(s) disclaim responsibility for any injury to people or property resulting from any ideas, methods, instructions or products referred to in the content. |
© 2025 by the authors. Licensee MDPI, Basel, Switzerland. This article is an open access article distributed under the terms and conditions of the Creative Commons Attribution (CC BY) license (https://creativecommons.org/licenses/by/4.0/).