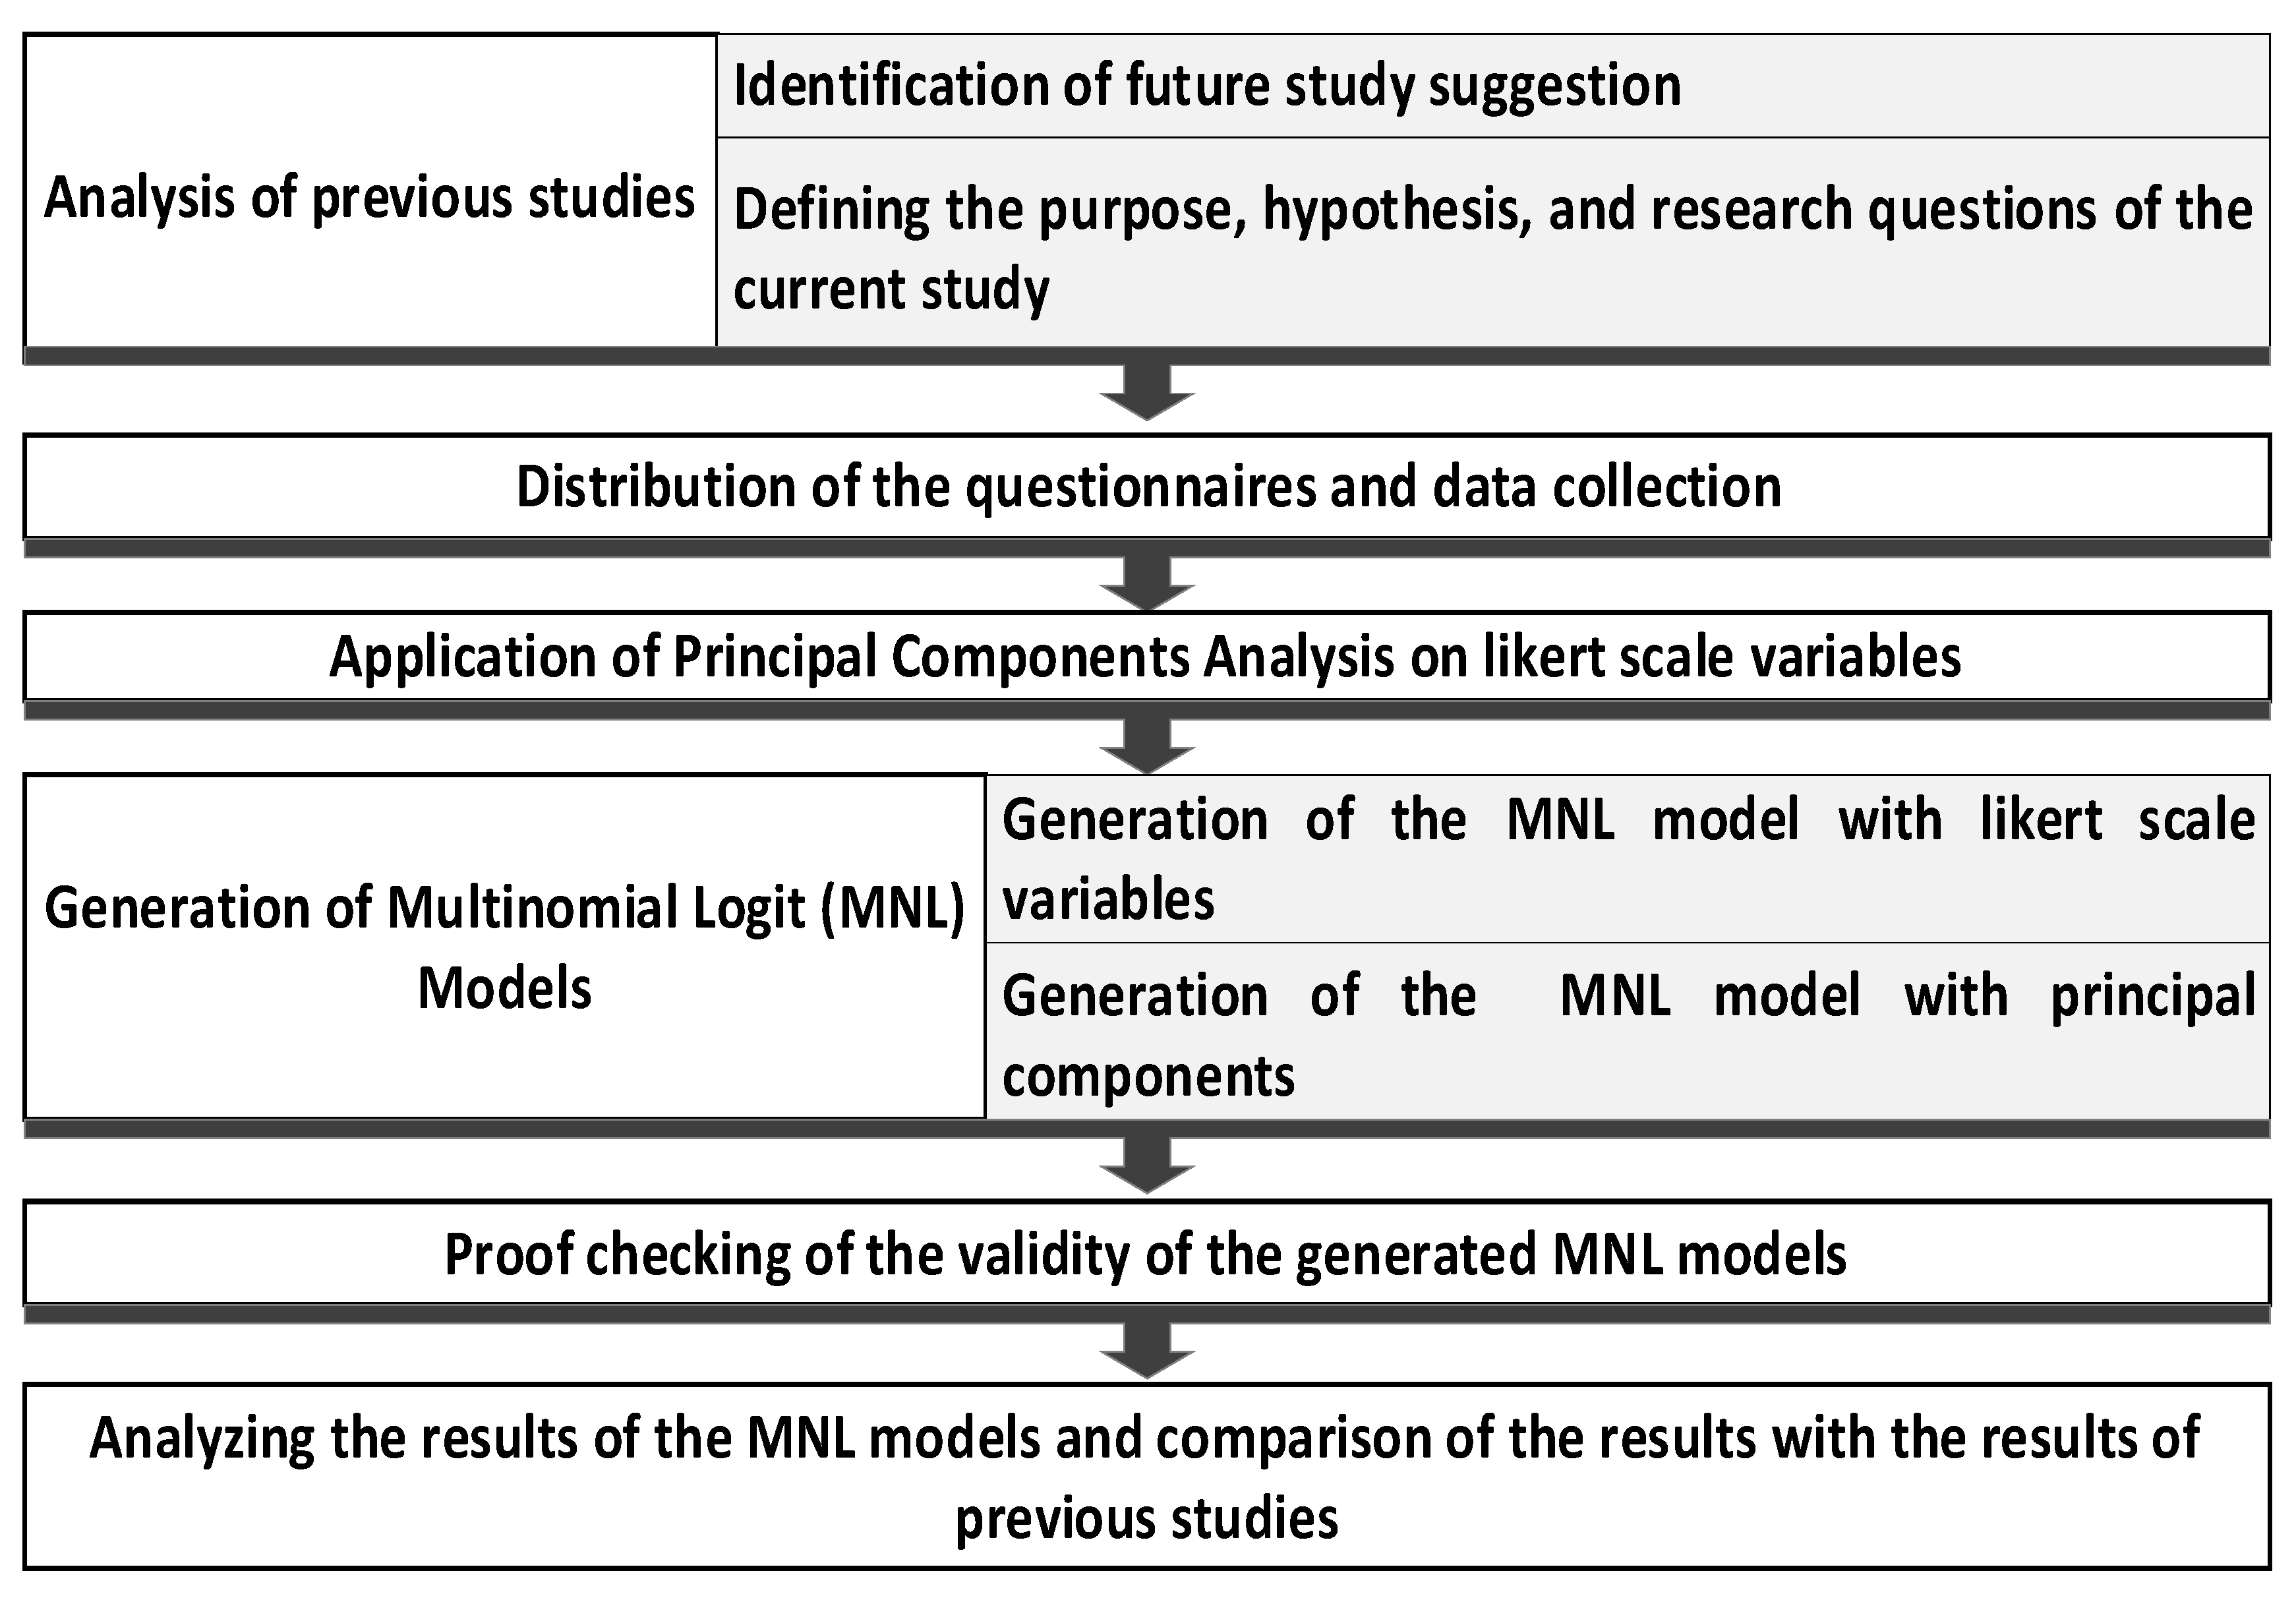
1. Introduction
The six most impactful greenhouse gases (GHG) are carbon dioxide (CO
2.), methane, nitrous oxide, hydrofluorocarbons, per-fluorocarbons, and sulfur hexafluoride [
1]. CO
2. stands out as the predominant GHG emitted [
2], with a record of 36,153 million tons in 2017 [
3]. The transport sector, surpassing the passenger sector [
1,
2], is the primary contributor to CO
2. emissions [
4]. Within freight transport, road freight transport plays a vital role in facilitating other freight transportation modes (such as sea, air, and rail) and carrying heavy-duty cargoes [
5]. Projections indicate that if energy consumption rises by 75%, CO
2. emissions from freight transport will double by 2050. To effectively reduce direct CO
2. emissions, a viable approach is to replace fossil fuels with alternative fuel truck (AFT) options, such as compressed natural gas (CNG), liquefied natural gas (LNG), battery electric (BE), hydrogen, and biogas [
6].
The European Parliament has set a target to increase the market shares of alternative fuels, specifically AFTs, by 14% by 2030. Additionally, Europe aims at reducing CO
2. emissions of the road fleet by up to 90% by 2050 [
7]. This has spurred various initiatives, including Norway’s plan to replace 50% of trucks with AFTs by 2030 [
6], Sweden’s ambition to achieve a 70% reduction in GHG emissions in domestic land transit by 2030 [
8], and Germany’s consideration of a 40% GHG emission reduction within the transport sector [
1]. Norway, for instance, has set a target to replace all light vans with zero-emission vehicles by 2025, with new vans and 50% of new heavy good vehicles running on electricity or hydrogen by 2030 [
5]. Leading truck manufacturers are also actively developing eco-friendly innovations, such as Tesla’s Battery Electric Trucks (BETs) with an average driving range of 800 km [
9]; the analysis of Fuel-Cell Electric Trucks by Toyota, Kenworth, and Nikola Motor [
10]; and ongoing research on hybrid trucks by Scania and Volvo [
11,
12]. However, despite these efforts, the market shares of AFTs have not witnessed significant growth [
6]. In Europe, the majority of the road fleet still consists of 361,135 registered new diesel trucks, with only 357 new BETs enlisted in 2019. Sweden’s road fleet comprises 95% Diesel Trucks, 5% biogas trucks, and a mere 2% BETs. Furthermore, alternatively fueled trucks account for only 0.05% of the total in Germany [
13].
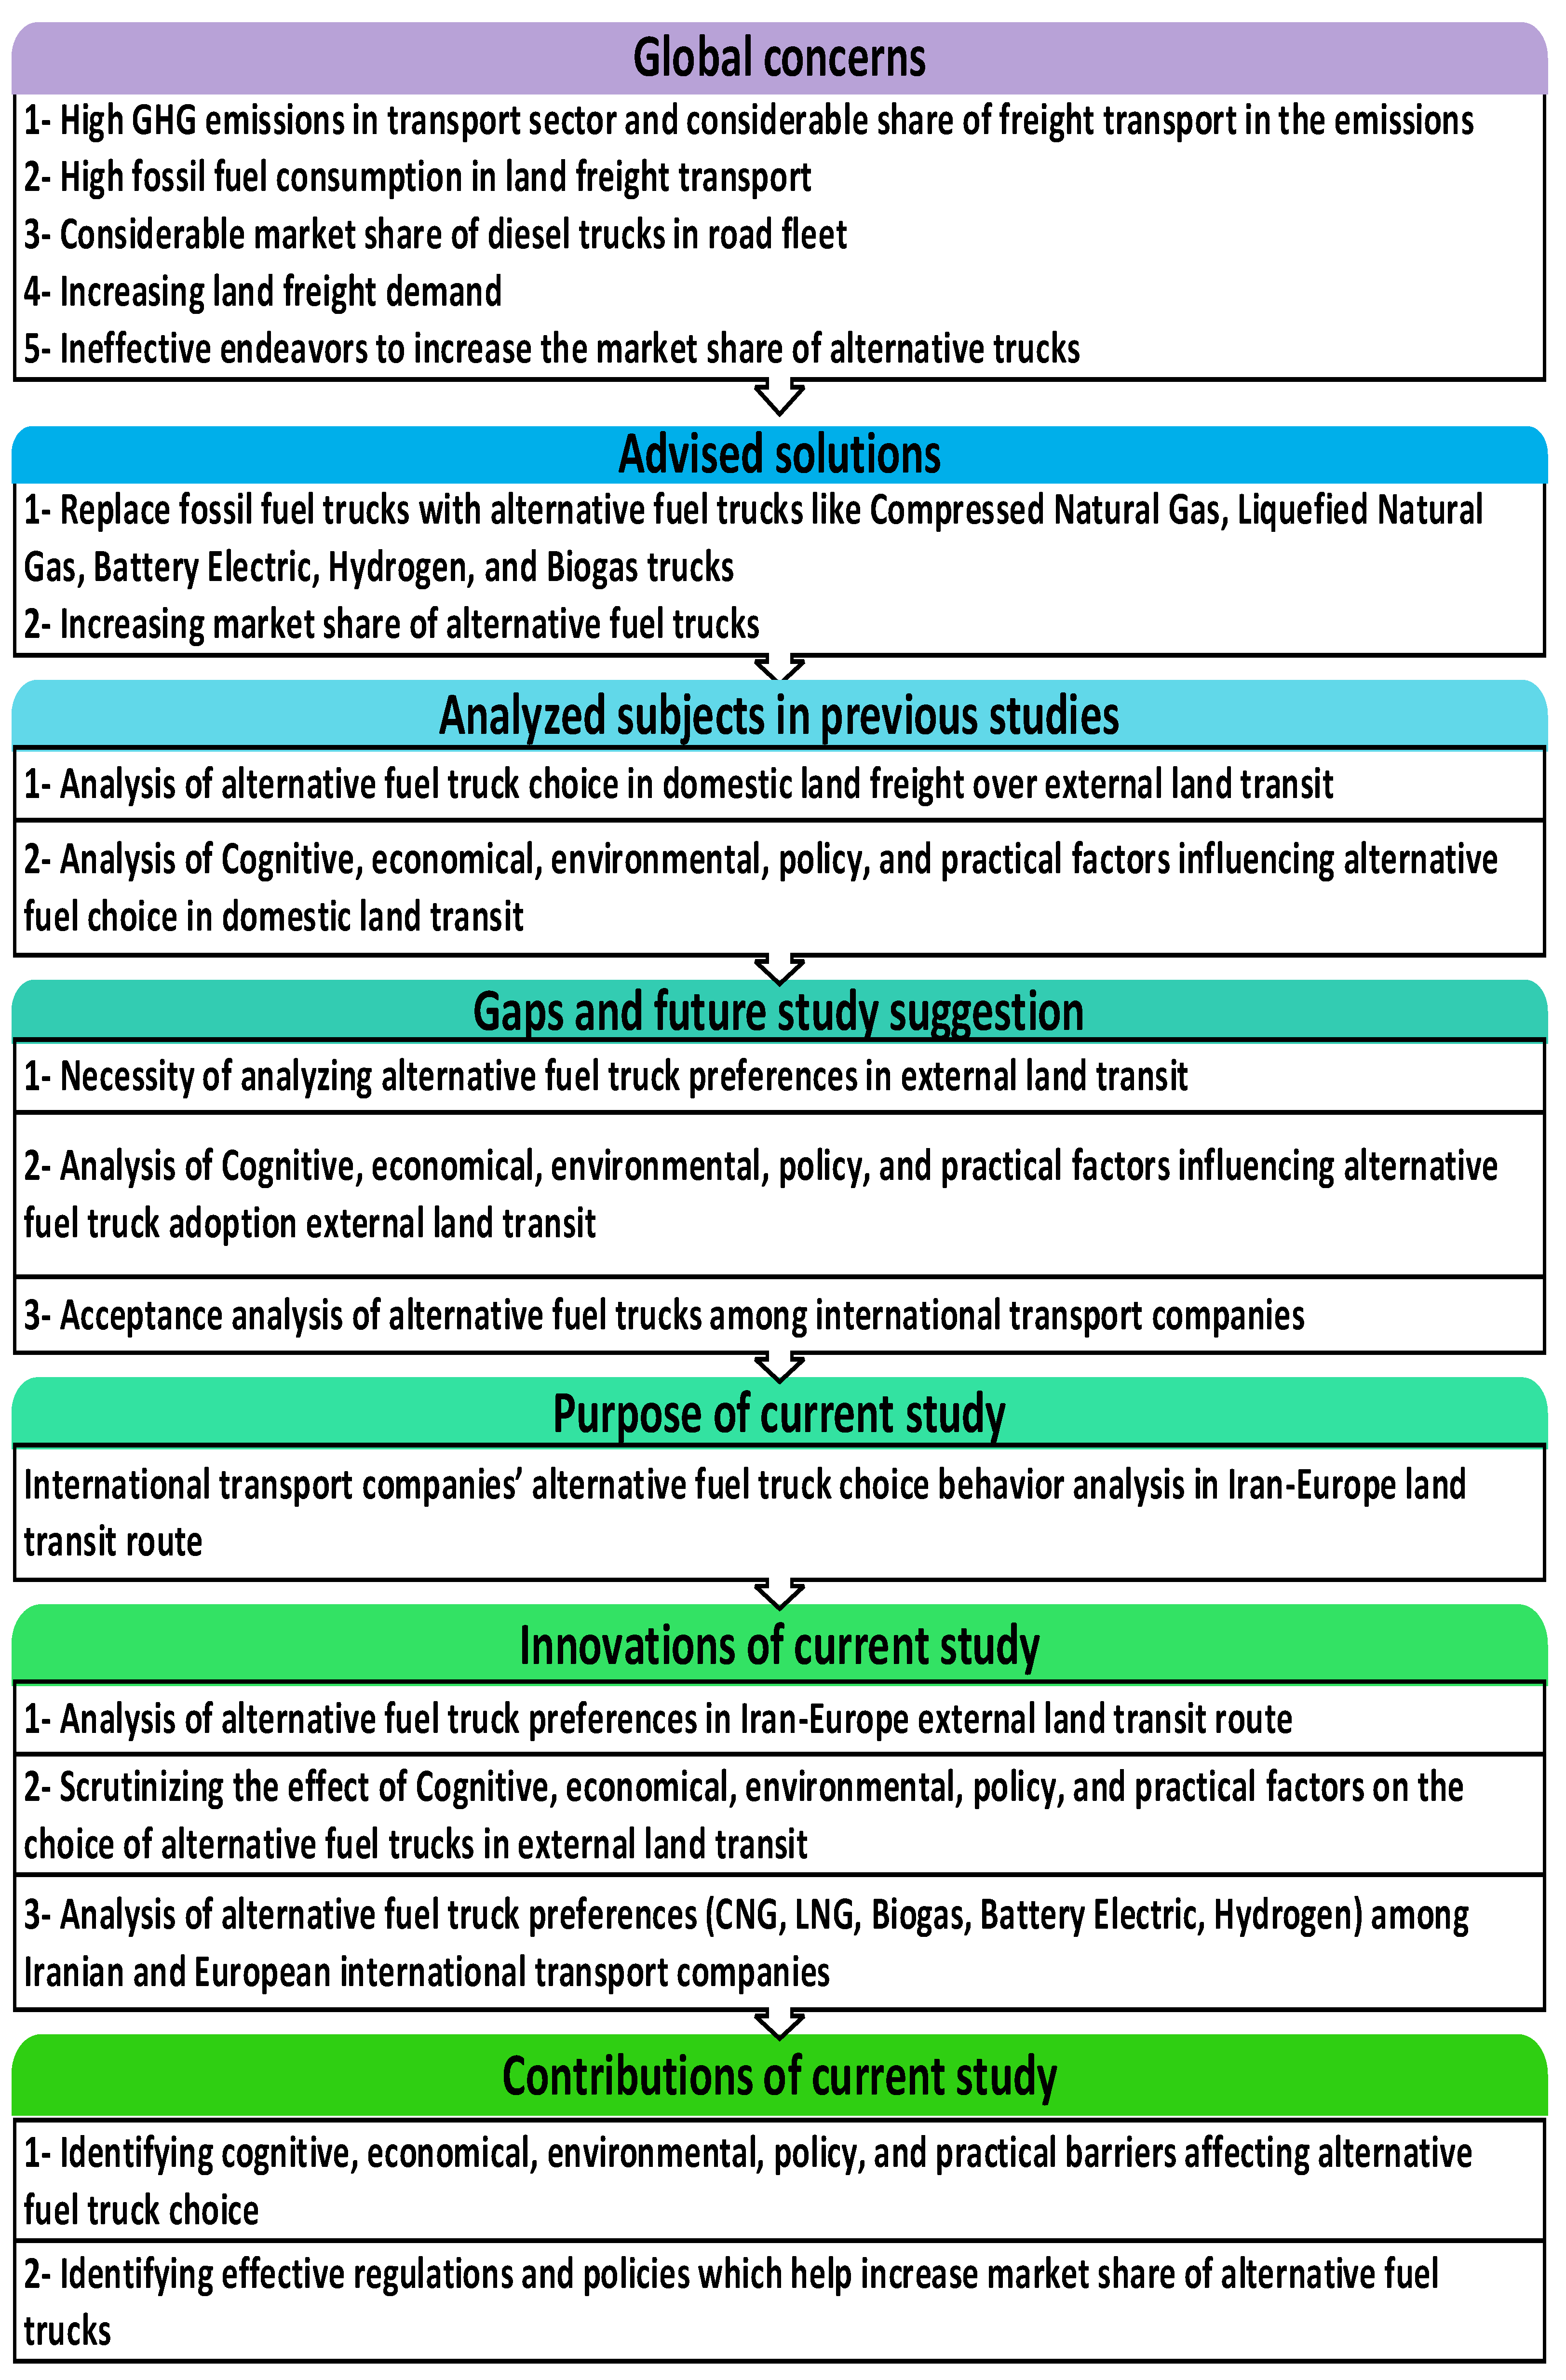
To foster broader acceptance of alternative fuel trucks (AFTs) and address the challenges faced by international transport companies (ITCs) in transitioning from conventional fuel trucks to AFTs, it is essential to implement necessary regulations and overcome existing barriers. A further analysis is required to examine the cognitive, economic, environmental, policy, and practical factors that influence the choice of AFTs among ITCs, as well as the considerations related to AFT adoption in land freight. Discussions covered in previous studies, future study suggestions, and the innovations of the current study are as follows:
Previous studies mainly have analyzed the AFT choice in domestic land transit over international land transit (more details are available in
Table A1,
Appendix A). Analyzing the AFT choice in international land transit is necessary since it includes different countries en route with varying financial conditions, policies, regulations, and incentive plans that may be barriers to AFT market shares in international land transit [
14]. In addition, an analysis of international transport routes is needed to plan for AFT use [
15,
16]. To cover the mentioned literature gaps, the Europe–Iran international transit route is chosen for this study.
An acceptance analysis of AFTs in ITCs is among the suggestions for future studies [
15]. European and Iranian ITCs are therefore chosen for this study.
Applying Stated Preference method for AFT adoption was also suggested for further research [
15]. This approach is therefore used in this study. A questionnaire was distributed online among international transport companies. It is assumed that governmental and incentive policies mentioned in the questionnaire are applied during the survey. Details of these governmental and incentive policies are available in
Table A2. The questionnaire was distributed to gather data on their background information; their alternative fuel choice; their level of agreement with cognitive, environmental, and policy factors; and the importance degree of practical, economic, and some other policy factors in adopting alternative fuel trucks.
Regarding alternative fuel truck preferences, not all alternative fuels have been analyzed in previous studies altogether. As far as we know, preferences of BETs, CNG trucks, LNG trucks, and hydrogen trucks (a hydrogen-fueled truck includes hydrogen space rockets and uses hydrogen as fuel; the chemical energy of hydrogen is converted to mechanical energy in these trucks [
17]) have been previously evaluated in Germany [
14]. Adding an analysis of biogas truck preferences in this study on top of preferences regarding CNG trucks, LNG trucks, BETs, hydrogen trucks, and biogas trucks are analyzed in the Europe–Iran international transport route.
Previous studies have applied cognitive, environmental, policy, practical, and economic variables via various methods (such as a factor analysis, logistic regression model, Delphi method, and mixed logit) to analyze alternative fuel cars and trucks (details are available in
Table A1 in
Appendix A) in urban commuting and domestic land transit. The effect of cognitive, environmental, policy, practical, and economic variables on AFT choices in international land transit is tackled in this study.
Drawing upon prior research, the present study aims at testing the hypothesis that cognitive, environmental, policy, practical, economic factors, and cargo type impact the decision-making process concerning alternative fuel trucks (AFTs) in international land transit. To examine the validity of this hypothesis, a principal component analysis and multinomial logit models are utilized as analytical tools.
In addition to analyzing European and Iranian ITCs’ AFT preferences, answers to the questions below are investigated:
Based on AFT specifications, which AFT will ITCs prefer?
Which cognitive, environmental, economic, policy, and practical factors motivate ITCs to choose AFTs?
The results of this study will help to identify cognitive, economic, environmental, policy, and practical barriers affecting AFT choice. Providing solutions to overcome such barriers will help the faster adoption of AFTs in international land transit. This study also helps to identify effective regulations and policies that help increase the market shares of AFTs.
In
Appendix B,
Table A2 provides references of analyzed factors collected from previous studies.
2. Literature Review
According to the transport analysis report in 2020, transportation contributes to 20% of global greenhouse gas (GHG) emissions. However, certain countries, such as Norway [
6] and Sweden [
18], experience even higher percentages, with 30% and 33.3% of emissions, respectively, attributed to the transport sector. It is evident that transportation is one of the leading sectors in terms of GHG emissions worldwide [
14]. Consequently, the widespread adoption of alternative fuel trucks (AFTs) is widely regarded as a primary approach to mitigate the environmental impact caused by transportation [
19].
The analysis of alternative fuel diffusion has been prompted by the increasing demand for international land transit [
20] along with the high greenhouse gas (GHG) emissions and environmental concerns associated with traditional transportation methods [
16]. However, international transport companies (ITCs) face multiple barriers that hinder their adoption of alternative fuel trucks (AFTs) [
6]. These barriers include economic, technical, bureaucratic, general perspective, legal, and physical factors as well as unwanted policy consequences [
6]. Additionally, two recently identified barriers include institutional factors related to market shares, required infrastructure, economic challenges, inadequate interaction, and supply issues, as well as functional factors involving acceptance and attitudinal issues [
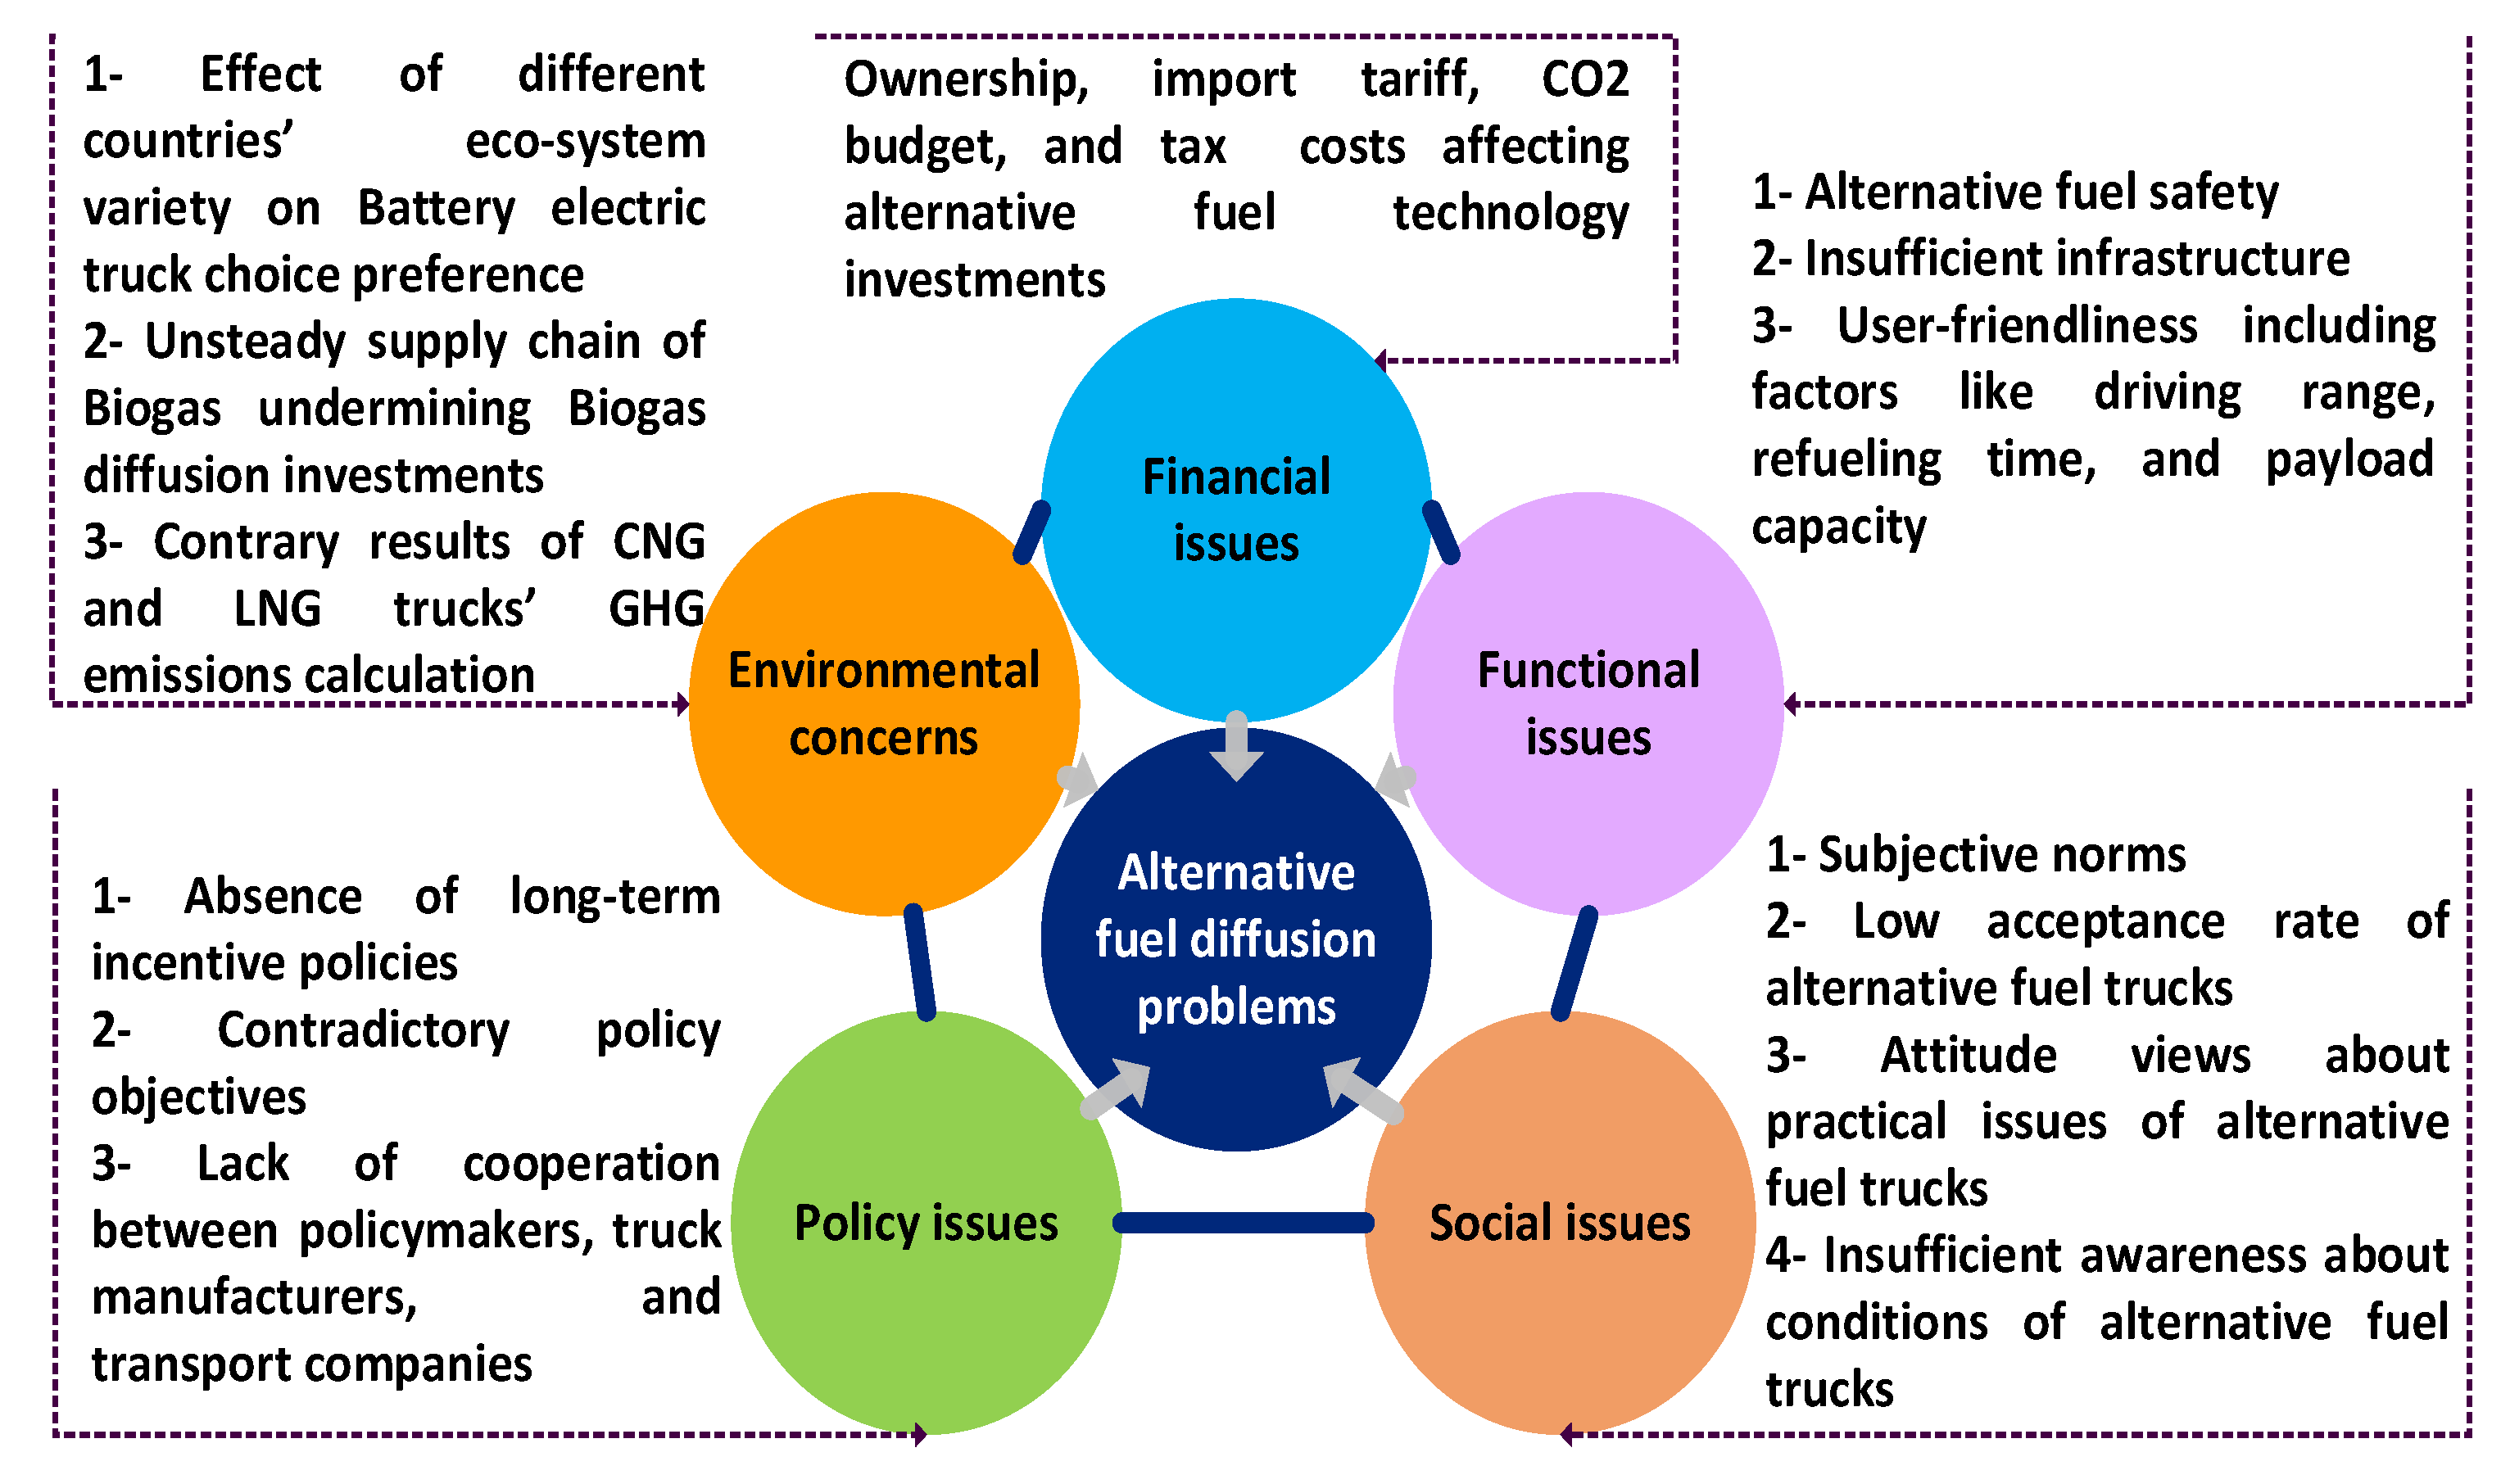
21]. Previous studies have summarized the challenges of alternative fuel diffusion into five categories: financial, environmental, political, functional, and social (
Figure 1).
Financial issues, such as ownership cost, significantly affect investments in alternative fuel technologies [
22]. The diverse cost components, including purchase price, fuel price, registration fee, maintenance costs, and insurance fees, coupled with complex import tariffs result in varying calculations of ownership costs [
23]. Contrary to [
1], Ref. [
8] demonstrate that the ownership cost of diesel trucks is lower than that of BETs and CNG trucks. Several suggested solutions to enhance investment in AFT technology include the improvement of AFT technology itself [
24], reduced import tariffs and tolls for AFT users, and the implementation of a CO
2. budget and tax mechanisms to facilitate the development of infrastructure and low-priced alternative fuels [
25].
The analysis of alternative fuel trucks (AFTs), including BETs, biogas trucks, and hybrid trucks, has been driven by environmental concerns to mitigate greenhouse gas (GHG) emissions [
26]. Various approaches, such as generating electric power from nuclear energy [
27] and utilizing BETs [
28], have been explored to address GHG emissions. A Monte Carlo Simulation conducted by [
13] reveals that a BET has 80% fewer GHG emissions compared to biogas trucks, contrary to the findings of [
29]. However, the usage of BETs has shown adverse effects on certain countries despite their technological efficiency and low GHG emissions [
19]. A macro-level analysis of practical variables has indicated that the ecosystem of the United Arab Emirates is unsuitable for electric vehicles [
29].
Conflicting results have been found regarding the classification of CNG, LNG, and bio-methane as biogas due to their similar supply chains [
26]. While Refs. [
29,
30] suggest that CNG-dependent technologies emit 33% more greenhouse gases and highlight the long-lasting drawbacks of this technology, Refs. [
1,
25] find that bio-methane and CNG have lower GHG emissions.
Policy issues also significantly impact the market shares of AFTs, with the absence of long-term policies [
31] and conflicting political benefits and objectives [
32] being key factors. Several suggestions have been proposed to increase the market shares of AFTs, including publicizing the economic and environmental benefits of CO
2 tax [
32], providing necessary infrastructure [
33,
34], implementing long-term incentive policies [
5], and fostering collaboration among policymakers, ITCs, and AFT manufacturers [
35].
Functionality issues are also crucial for companies when considering the adoption of AFTs. While improved safety encourages ITCs to choose AFTs, inadequate infrastructure poses a significant barrier [
36]. Market share considerations for BETs are influenced by factors such as performance on long-haul routes [
37], user-friendliness [
38], driving range on long-haul routes, required recharging duration [
39], acceleration, fleet size, and payload capacity [
39]. The limited market shares of hydrogen trucks can be attributed to the suitability of hydrogen fuel for heat and electricity production [
26].
Social issues also play a role in determining the market shares of AFTs, including subjective norms (the importance of people’s approval of specific behaviors), peer pressure to care for the environment [
40], low acceptance rates of AFTs [
41], and attitude problems regarding the practical issues of AFTs [
42]. Raising awareness about current environmental conditions and addressing practical issues related to AFTs are suggested to increase their acceptance rate [
43].
In summary, diesel trucks still dominate the market shares compared to AFTs, necessitating efforts to reduce GHG emissions [
13]. However, increasing the market shares of AFTs and modeling the truck choice behavior of ITCs is a complex task due to the diverse and sometimes conflicting factors, including environmental, financial, functional, social, and policy issues. Furthermore, there has been limited attention given to international land transit, which has distinct characteristics from domestic land transit [
14]. Therefore, it is recommended to conduct an AFT choice analysis in international land transit [
14,
15,
43] and examine the acceptance of AFTs among ITCs [
15]. For the purposes of the current study, the Europe–Iran transit route has been selected to model the AFT choice behavior of international transport companies (ITC).
3. Materials and Methods
3.1. Data Collection
The link of the online questionnaire was distributed among ITCs in Iran and Europe by email. The questionnaire was distributed among 684 international transport companies in 20 countries to gather data on their background information; their alternative fuel choice; their level of agreement with cognitive, environmental, and policy factors; and the importance degree of practical, economic, and some other policy factors in adopting alternative fuel trucks. The ITCs were chosen from the members of international freight forwarding websites (World Cargo Alliance (WCA) and JC Trans). Among the list of the members, the email addresses of the ITCs providing international land transit were collected. Two versions of the questionnaire were designed (Persian for Iranian ITCs and English for European ITCs). The content validity of the questionnaire was determined by reviewing previous related studies. The translation consistencies were checked by Persian and English expert editors. Furthermore, the questionnaire was fine-tuned by a pilot study. Sample size can be calculated by Cochran’s formula, which for this study, minimum of 384 ITCs were calculated. The fine-tuned online questionnaire was distributed among 30 countries (29 European countries and Iran), and 684 ITCs across 20 countries participated in the survey. ITCs from European countries taking part in the survey are as follows: Germany, France, Czech Republic, Spain, Belgium, Sweden, Italy, Netherlands, Poland, Denmark, Portugal, Swiss, Estonia, Greece, Lithuania, Finland, Austria, Norway, and Slovakia.
3.2. Mathematical Methods
The following mathematical methods were used in this study. The third and the fourth parts of the questionnaire included 16 Likert scale variables (listed in
Table A2 in the
Appendix B). The testing result showed these variables were highly correlated. Thus, to reduce dimensions of data and obtain non-correlated variables, principal component analysis (PCA) was applied. By applying PCA, these Likert scale variables were reduced to eleven independent principal components (PC), and unimportant variables not associated with AFT choice were screened out. These formed PCs, as new linear combination, included the Likert scale variables with maximum data variance. In addition, multinomial logit model (MNL) was appropriate for modeling transport mode choice. Since the collected data for mode choices was categorical, the MNL model was a reliable method [
44,
45]. Thus, two MNL models with a confidence level of 90% uncovered the variables explaining future AFT choice behavior. Company characteristics were independent variables in both models. In the first model, Likert scale variables and, in the second model, PCs were the independent variables. Fifteen variables in the first model and eleven variables in the second model became significant (
p < 0.10). Lastly, the results of both models were compared to each other. Steps of the current study are also described in
Figure 2 and
Figure A1 in
Appendix C.
3.2.1. Principal Component Analysis
PCA is a broadly used dimensional-reduction method for high dimensional and correlated data. By applying PCA, non-correlated linear combinations of original variables called PCs are formed. PCs are the new sets of orthogonal axes counting for the maximum data variance [
46]. Thus,
PC1 is the new linear combination of actual variables (
) [
46]:
The loading showed the correlation between actual variables and PCs. In addition, the significance degree of actual variables was indicated in the loading. The higher loading indicated the higher importance level of the original variable in the obtained PC. Another formula to calculate the loading was as follows:
In the above formula, the loading of jth variable in ith PC was indicated in . The jth variable’ weight was shown as , eigenvalue (data variance explained by PC) as , and standard deviation of jth variable as .
3.2.2. Multinomial Logit Model
Conventional discrete choice models, centered on random utility theory, have been proposed for mode choice probability estimation [
47]. Based on the random utility theory, company n selects the AFT from the choice set with the most prominent utility. Each utility
contains one or more choices. Thus, with
describing AFTs’ observed attributes, and
as error term marking unobserved attributes of AFT, the utility function of each company is as follows:
In addition, linear function’s most common utility form is as follows:
where (
) weighting parameters describe (
) independent variables’ marginal utility. Consequently, company n chooses AFT j with the probability of the following:
The multinomial logit model (MNL) is a derivative of the
distribution and is appropriate for mode choice behavior prediction. Yielding to Gumbel distribution
has independent and identical distribution in the MNL model [
48]. Thus, pursuing to forecast AFT choice probability via MNL model following function is advised:
In the above function, j illustrates the considered AFT for which choice probability is calculated. While an increase in systematic utility of each AFT causes an increase in choice probability of that AFT, an increase in systematic utility of other AFTs decreases the choice probability of considered AFT.
After generating the model, elasticity calculates choice probability changes in response to a one percent increase of an independent variable. The marginal effect also measures the choice probability changes with one unit increase of the independent variable [
48].
Furthermore, the aggregate proportion of correct prediction calculates the model’s overall correct prediction and affirms models’ validity subject to the equivalence between the estimated value and the chosen actual alternative. Dividing the correct prediction summation of the alternatives (offered in the contingency table) by the total selections made determines it [
48].
3.3. Questionnaire Description
The questionnaire included four parts. The background information (such as the country of registration, the number of the owned trucks, and the previous experience with AFT) was collected in the first section. Offering AFT details in the second section, ITCs’ views about the alternative fuel choice and main problems of AFTs were collected. ITCs announced their level of agreement with cognitive, environmental, and policy factors using a five-point Likert scale (from 1 = completely disagree to 5 = completely agree) in the third section. In the fourth section, ITCs specified the importance level of practical, economic, and other policy factors in choosing AFTs using a five-point Likert scale (from 1 = completely unimportant to 5 = completely important). Details of the questionnaire references are represented in
Table A2 in the
Appendix B.
3.4. Descriptive Statistics
An amount of 684 ITCs from 20 countries took part in the survey. All ITCs had carried dangerous cargo, general cargo, bulk cargo, liquefied bulk cargo, containerized cargo, passenger cargo, project cargo, refrigerated cargo, roll-on/roll-off, and perishable cargo.
From the 38,130 enlisted trucks, 68.7% ran on diesel, 29.0% on CNG, 1.8% on BE, and 0.5% on LNG. While the Iranian ITCs filling the questionnaire had diesel trucks, 146 European ITCs had previous experience with BETs. In addition, ITCs chose the average driving range as the main problem of CNG trucks and BETs, GHG emissions for LNG trucks, and tank capacity for biogas trucks and hydrogen trucks. Lastly, in answer to choosing alternative fuels, 16% of ITCs chose CNG, 23% BE, 14% biogas, 5% LNG, 4% hydrogen, and 3% chose none of the fuels mentioned.
5. Multinomial Logit Model Result Analysis and Discussion
The calibration of the first model with Likert scale variables is demonstrated in
Table 3 and the calibration of the second model with PCs in
Table 4. All the variables in both models are significant at a 90% level. Three alternatives are defined in each model. CNG and LNG trucks are the dependent variables in the first alternative, BETs in the second alternative, and hydrogen and biogas trucks in the third alternative. ITCs choosing none of the alternative fuels are not included in the models. The first and the third alternatives include two homogenized choices. Consequently, each alternative has a minimum share of 15%.
Based on
Table 5, the variables are non-zero in both models because
is greater than the critical value. In addition, in both models, [
is greater than the critical value emphasizing that the final models are better than the models with only constant variables. Further, the matching aggregate proportion of correct prediction value with the highest chosen alternative approves both models’ validity [
48].
In addition, the goodness of fit, the aggregate proportion of correct prediction, and R-square value signify the superior model. Comparing the
value of different models generated from the same data set with the same alternatives helps find the superior model. The higher value confirms the model’s superiority [
48]. Thus, the model with PCs emphasizes its superiority due to the higher correct prediction and
value.
5.1. MNL Model Results with Likert Scale Variables
The results of MNL model calibration with Likert scale variables, their marginal effect, and consistency with previous studies are discussed in this section. Fifteen variables, including seven Likert scale variables, are significant in the model. These Likert scale variables measure ITCs’ level of agreement with the below statements (ranging from 1 = completely disagree to 5 = completely agree):
Effect of tank-to-wheel GHG emissions on AFT choice;
Importance of low noise pollution on AFT choice;
Importance of AFT top speed on AFT choice;
Being part of socially responsible activities;
Effect of alternative fuels pricing policies on AFT choice;
Effectiveness of service quality of the manufacturer on AFT choice;
Effectiveness of maintenance costs on AFT choice.
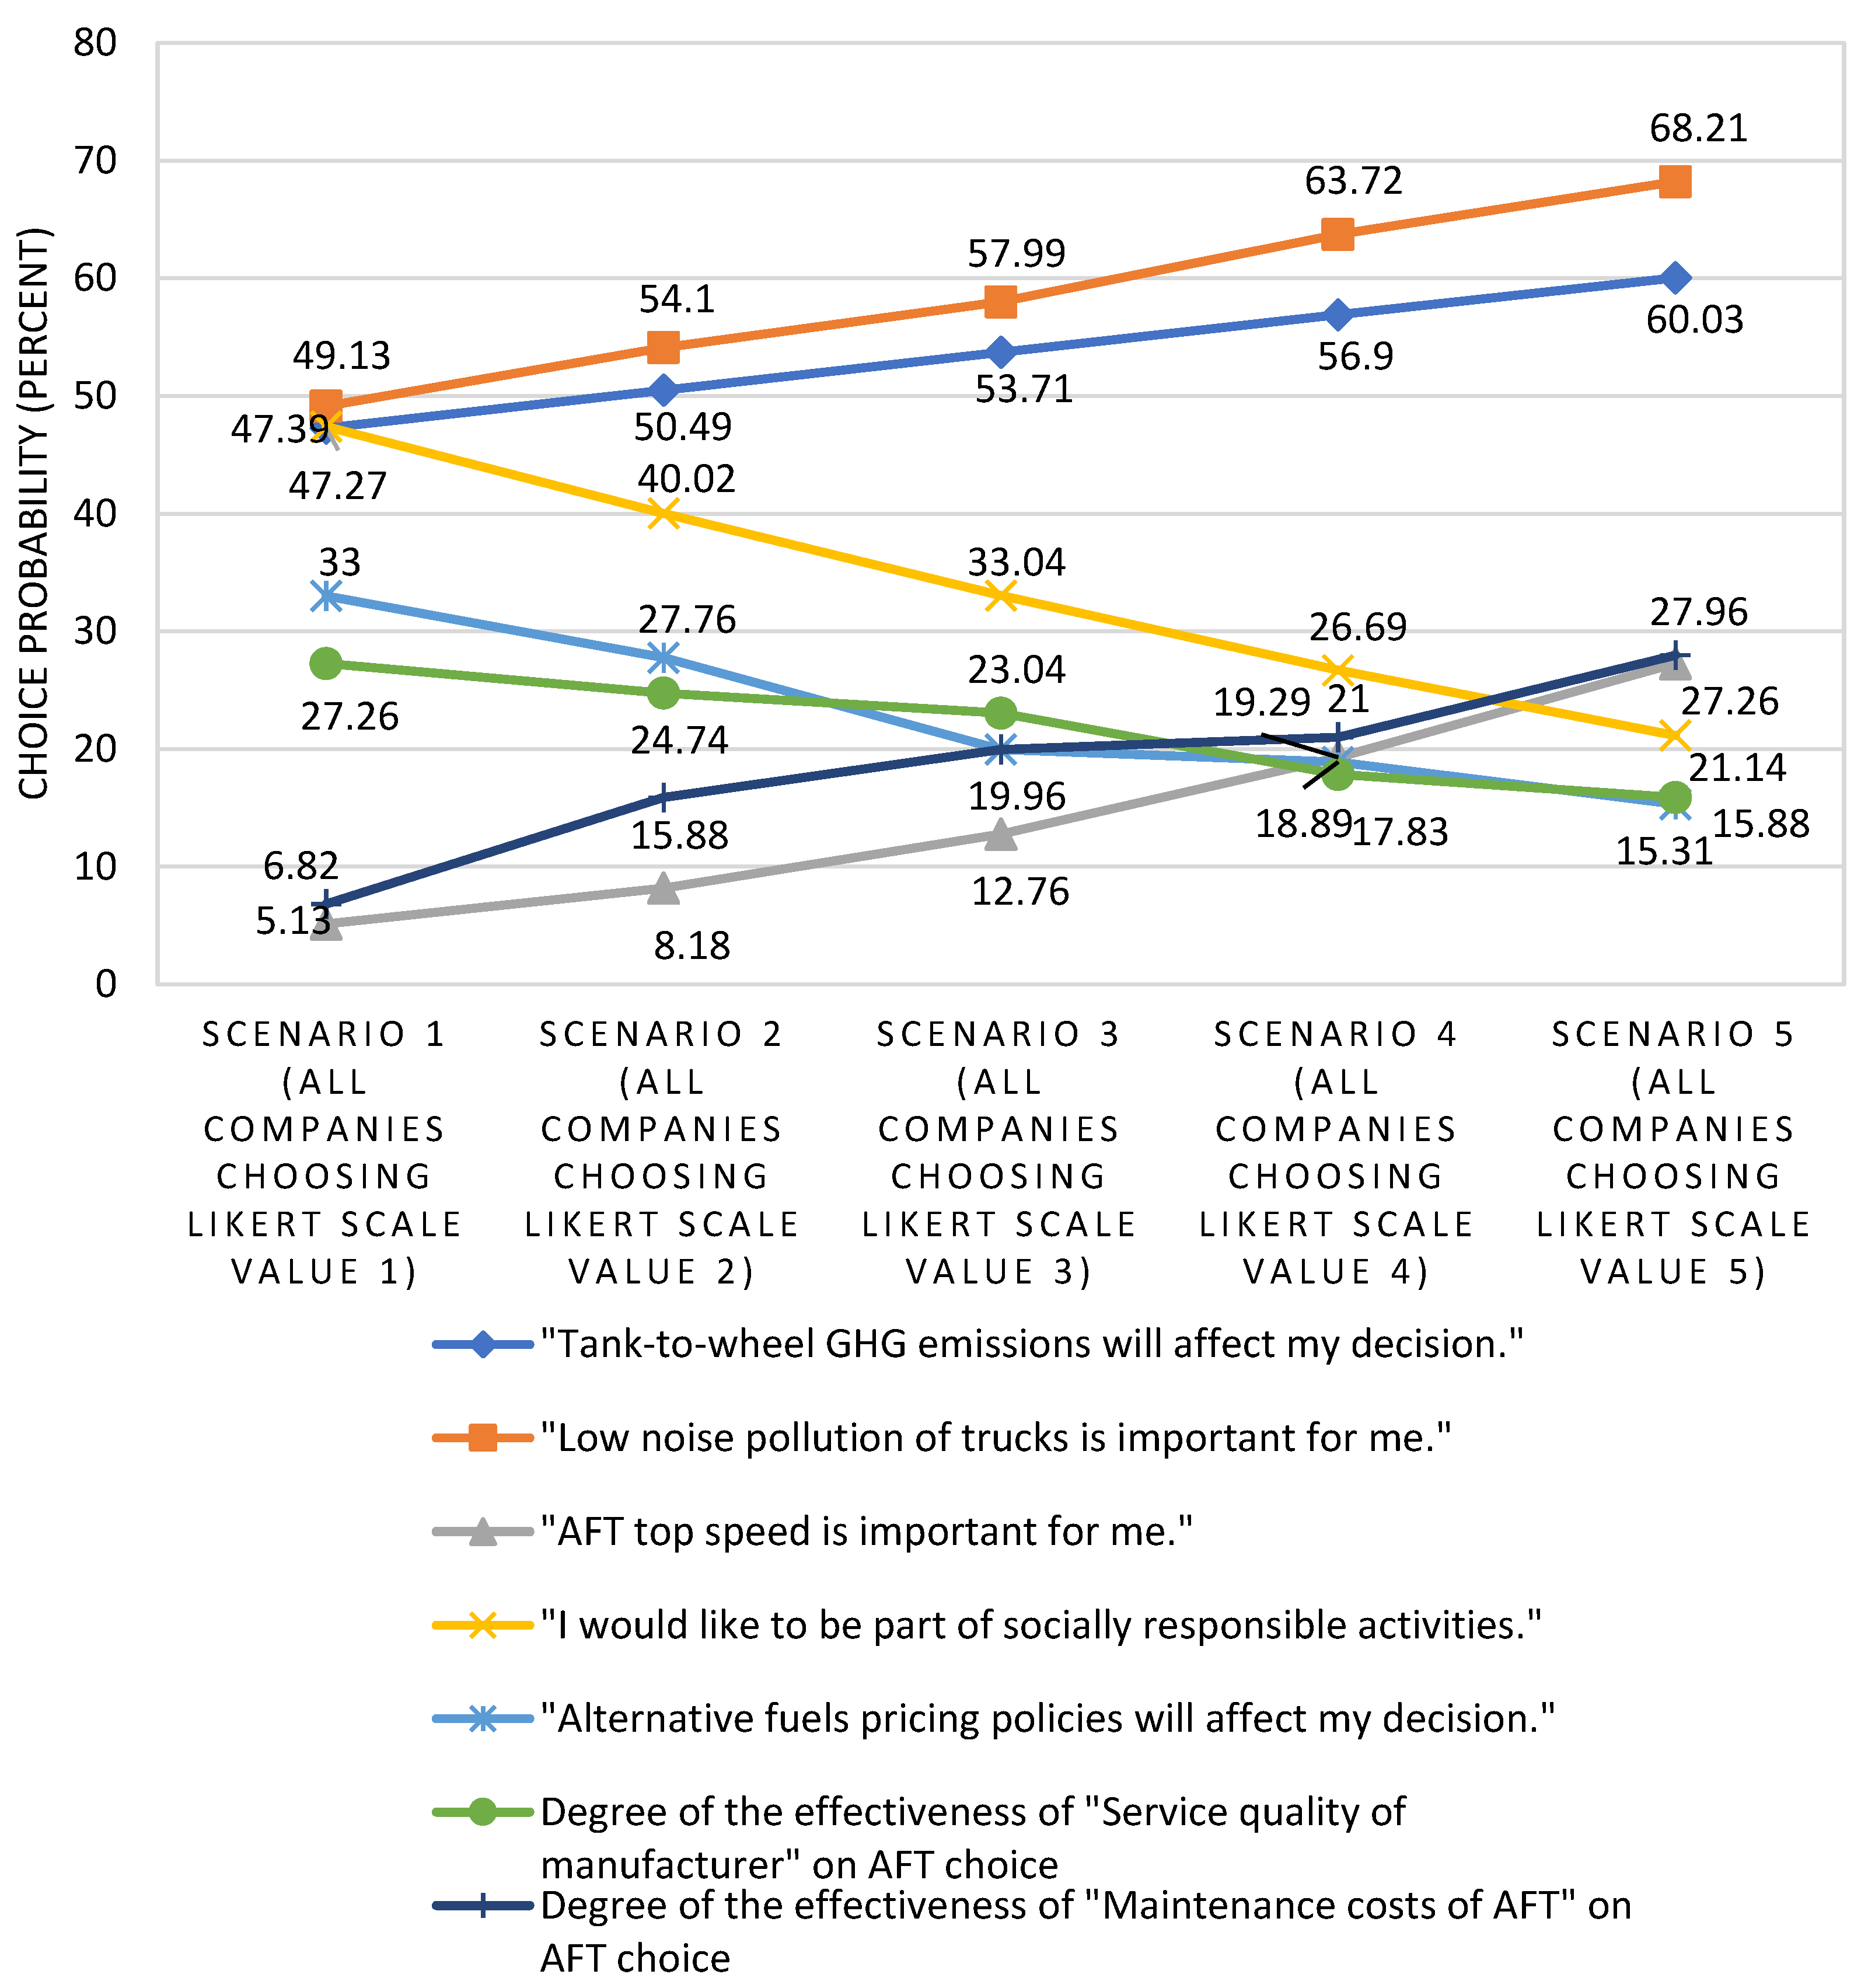
The direct marginal effect of choice alternatives is calculated by applying five scenarios to these Likert scale variables. In each defined
ith scenario, it is assumed all ITCs have chosen
ith Likert scale value (
i = 1, 2, 3, 4, 5). For example, in the first scenario, all ITCs are assumed to have chosen Likert scale value 1 (
Figure 3). In fact, it is supposed that all ITCs completely disagree with the effectiveness of tank-to-wheel GHG emissions on the AFT choice, and direct marginal effect-of-choice alternatives are calculated. Direct marginal effect is also calculated by assuming all ITCs completely disagree with the effectiveness and importance of low noise pollution, AFT top speed, being socially responsible, alternative fuel pricing, service quality of the manufacturer, and maintenance costs. Accordingly, the direct marginal effect is calculated in the second, third, fourth, and fifth scenario as well. Likert scale value 2 (disagree) in the second scenario, 3 (undecided) in the third scenario, 4 (agree) in the fourth scenario, and 5 (completely agree) in the fifth scenario are supposed to be chosen by all ITCs.
Regarding CNG and LNG trucks, the importance of
tank-to-wheel GHG emissions does not help increasing the choice probability of emission-free trucks; ITCs still prefer to choose CNG and LNG trucks. This finding is also consistent with previous studies, which find other variables (such as maintenance costs) are more important for ITCs. In fact, it is stated that GHG emission reduction is not their first priority [
24,
36,
49]. In addition, the particular analysis of tank-to-wheel GHG emissions is considered insufficient. In addition, ITCs consider other factors in choosing their preferred fuel. Well-to-wheel GHG emissions analysis is suggested instead [
50].
Furthermore, the
low noise pollution of the BETs, CNG and LNG trucks does not appear to be a criteria of choice according to the results. Based on previous studies,
low noise pollution is a characteristic of BETs; however, they are still less preferred due to insufficient driving range [
51,
52]. In addition, if implemented plans do not fully address the economic and political issues faced by ITCs, the current regulations and environmental concerns cannot elevate the market shares of BETs [
53,
54]. In addition, choice shares of CNG and LNG trucks increase by 19% even if all ITCs agree that
low noise pollution is completely important (
Figure 3).
Concerning BETs, the result of the MNL model in this study showed that the AFT
top speed is positively associated with BET choice. Analyzing previous studies, considerable ratio sensitivity to the
top speed of BETs is also obtained in the cost minimization models. Indeed electric vehicles preferred velocity is among the key parameters affecting logistics planning [
39].
However, ITCs do not prefer to choose BETs and
be a part of socially responsible activities. Liability issues and cost minimization are predominant concerns of ITCs. If ITCs’ underlying concerns (such as economic issues) are not addressed, ITCs are not encouraged to choose BETs out of feeling responsible to society and the environment [
36,
49]. Moreover, having experience with CNG trucks negatively affects BETs’ market share, which has also been discussed by other researchers [
25].
Direct association between BET choice and
battery capacity is found in this study via an MNL model indicating a drawback of BETs, which is in accordance with the literature [
36,
50]. Hence, if the battery technology and driving range improve, BET choice will increase [
14].
Analyzing choice share of hydrogen and biogas trucks,
alternative fuel pricing policy negatively affects ITCs’ choice preference. Impractical and short-term
pricing policies are found to have hindering effect on the market shares of hydrogen and biogas trucks in previous studies as well [
31,
39,
51]. In addition, choice share of hydrogen and biogas trucks decreases by 18%, even if all ITCs agree that alternative fuel pricing policies affect their AFT choice preference (
Figure 3).
The
service quality of the manufacturers is another barrier preventing ITCs from choosing hydrogen and biogas trucks. Moreover, the conducted scenarios resulted in a 9% decrease in the choice of this alternative (
Figure 3). Technology issues have been considered as main issues in previous studies as well. Currently, no AFT exists to replace diesel trucks with 500 horse power [
6,
31,
36]. Technology improvement and setting new standards for hydrogen and biogas trucks, therefore, are a necessity [
14].
Dissimilar to
alternative fuels pricing policy and
service quality of the manufacturers,
maintenance costs positively affect the choice probability of hydrogen and biogas trucks. If all ITCs agree
maintenance costs are completely important, the choice probability of the alternative increases by 21% (
Figure 3). Based on previous studies, BETs are found to have high
maintenance costs after four years of driving [
23,
31]. In addition, BETs and CNG trucks’ system inefficiency are among the problems [
6,
34]. Thus, high
maintenance costs are deterrent for ITCs to choose BET, CNG, and LNG trucks in previous studies as well.
Refueling time has a positive influence on the third alternative in this study as well. Compared to BET, biogas trucks have much lower
refueling time. It makes biogas trucks much more preferable [
52]. To check the marginal effect of this variable, a scenario was conducted. In this scenario, it was assumed all ITCs chose
refueling time as the main advantage of hydrogen and biogas trucks compared to the other mentioned characteristics (including maximum driving range, tank capacity, and fuel price). The results demonstrated a 6% increase in the choice probability of hydrogen and biogas trucks.
Finally, the carried cargo type affects AFT choice.
Dangerous cargo has a deterrent effect on CNG and LNG truck preferences.
Bulk cargo, liquefied bulk cargo, and containerized cargo help induce CNG and LNG truck preferences. Lastly, the model shows that ITCs prefer hydrogen and biogas trucks to carry
roll-on/roll-off cargo. The effect of cargo type, weight, and volume on the truck choice has also been discussed in previous studies [
39,
55].
5.2. MNL Model with the PCs
This section covers the model results generated with PCs and their elasticity (
Figure 4,
Figure 5 and
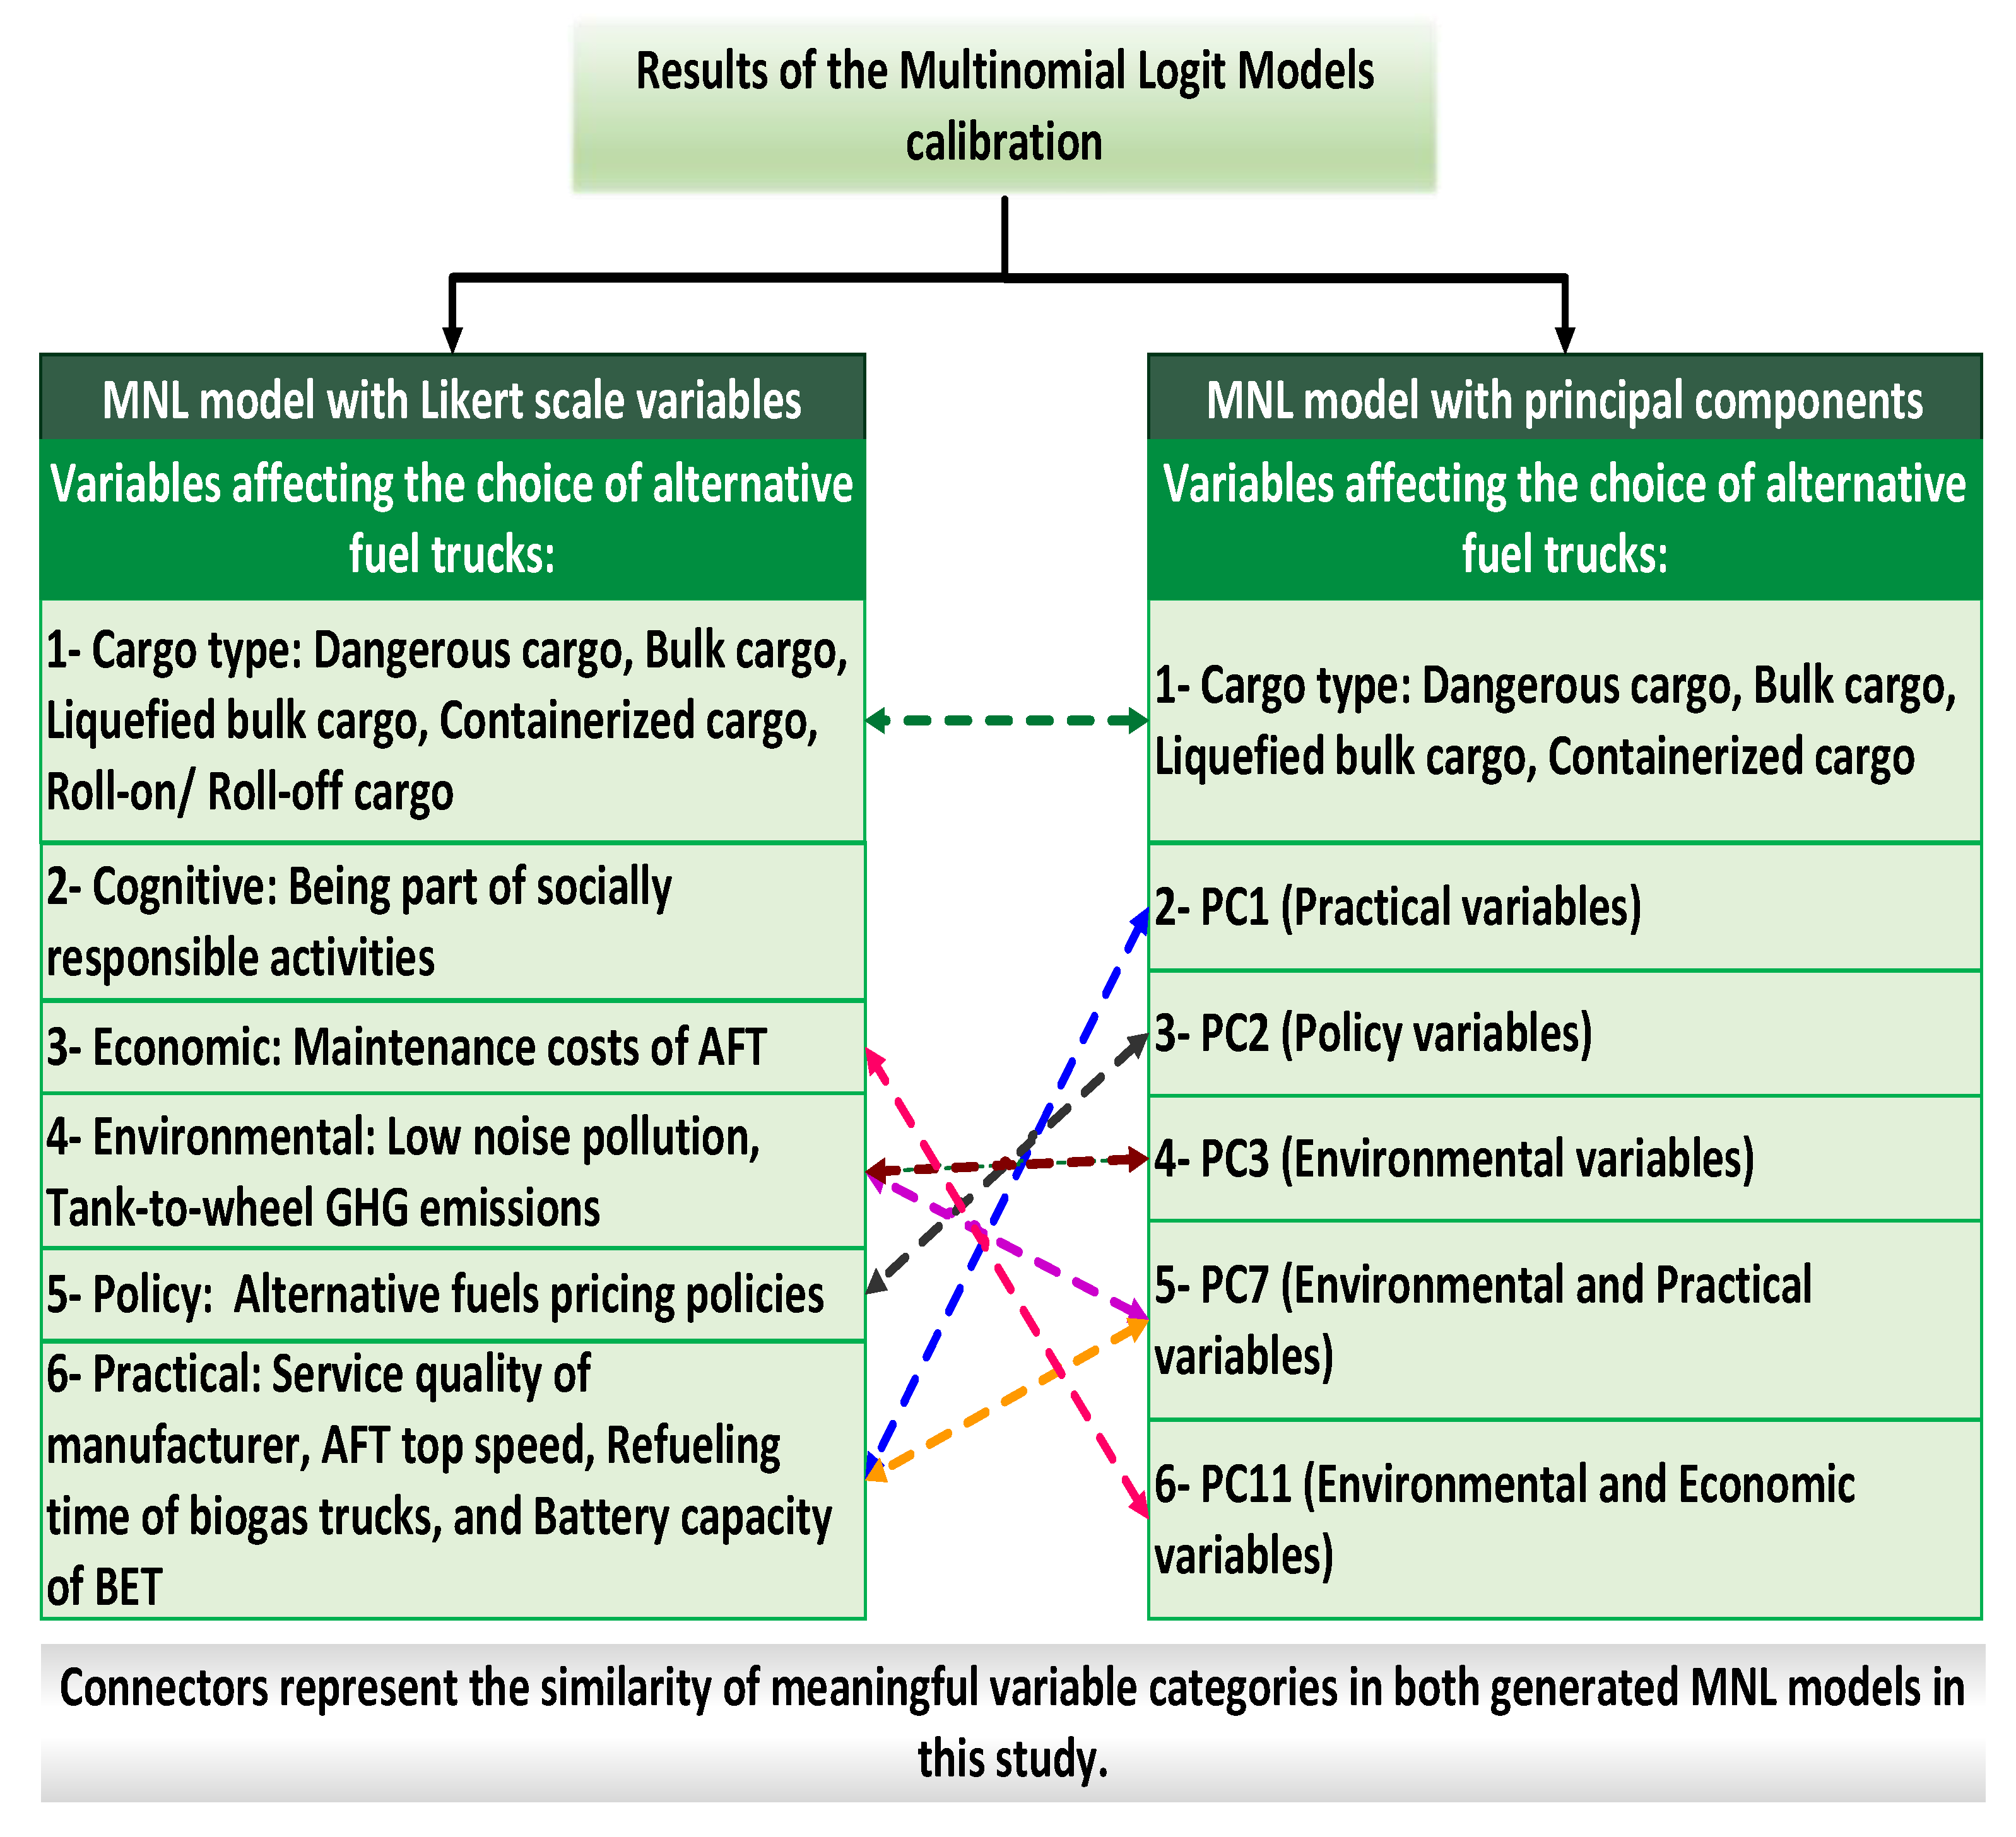
Figure A1). Five PCs in the second model help explain ITCs’ AFT choice behavior.
PC1 (AFT Practicability) and
PC2 (Policy Functionality) are positively associated with the choice of CNG and LNG trucks. Probably, ITCs believe CNG and LNG trucks are more functional than other trucks. In the questionnaire, 16% of ITCs chose these trucks as their preferred AFT too. In addition, the model results showed that the current policies much more positively affect the market shares of the CNG and LNG trucks. In addition, like the previous model, ITCs prefer to carry
bulk cargo and
containerized cargo with these trucks.
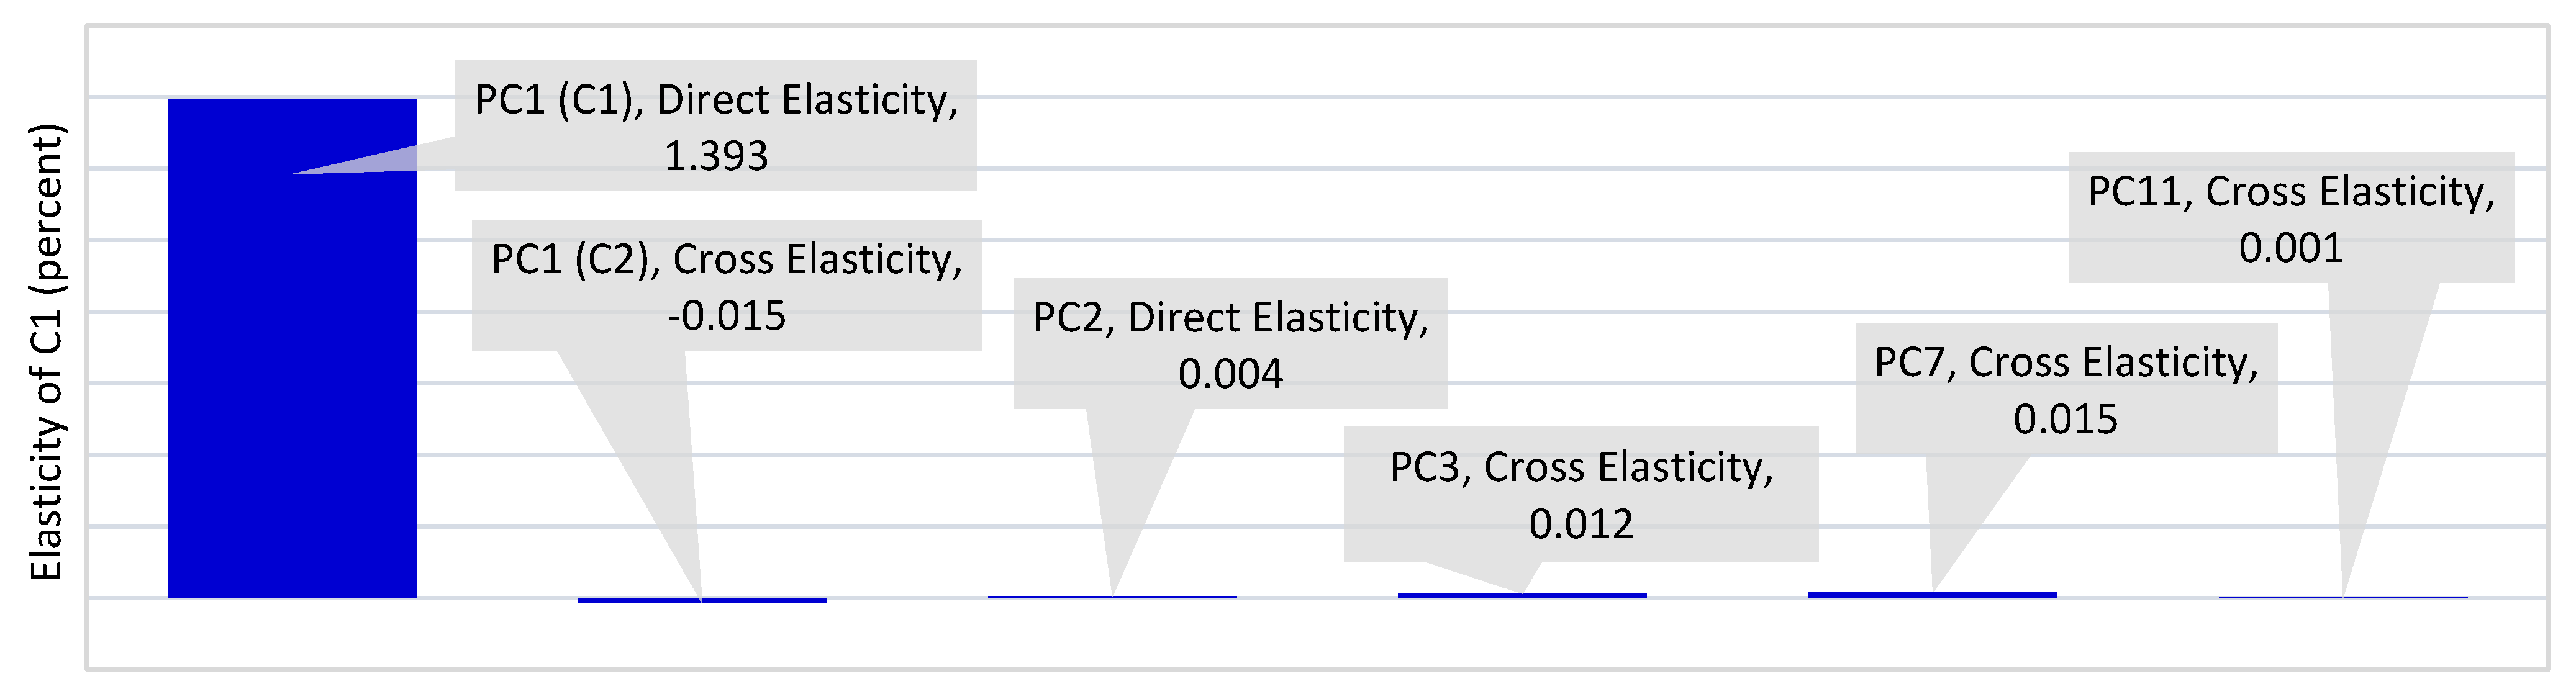
Figure 6 represents the results of the direct and cross elasticity. A 1% increase in
PC1 (meaningful in the first alternative) corresponds to 1.39% increase in the choice probability of CNG and LNG trucks. In addition, the direct elasticity of
PC2 and cross elasticity of other PCs scarcely affect the choice probability of the alternatives.
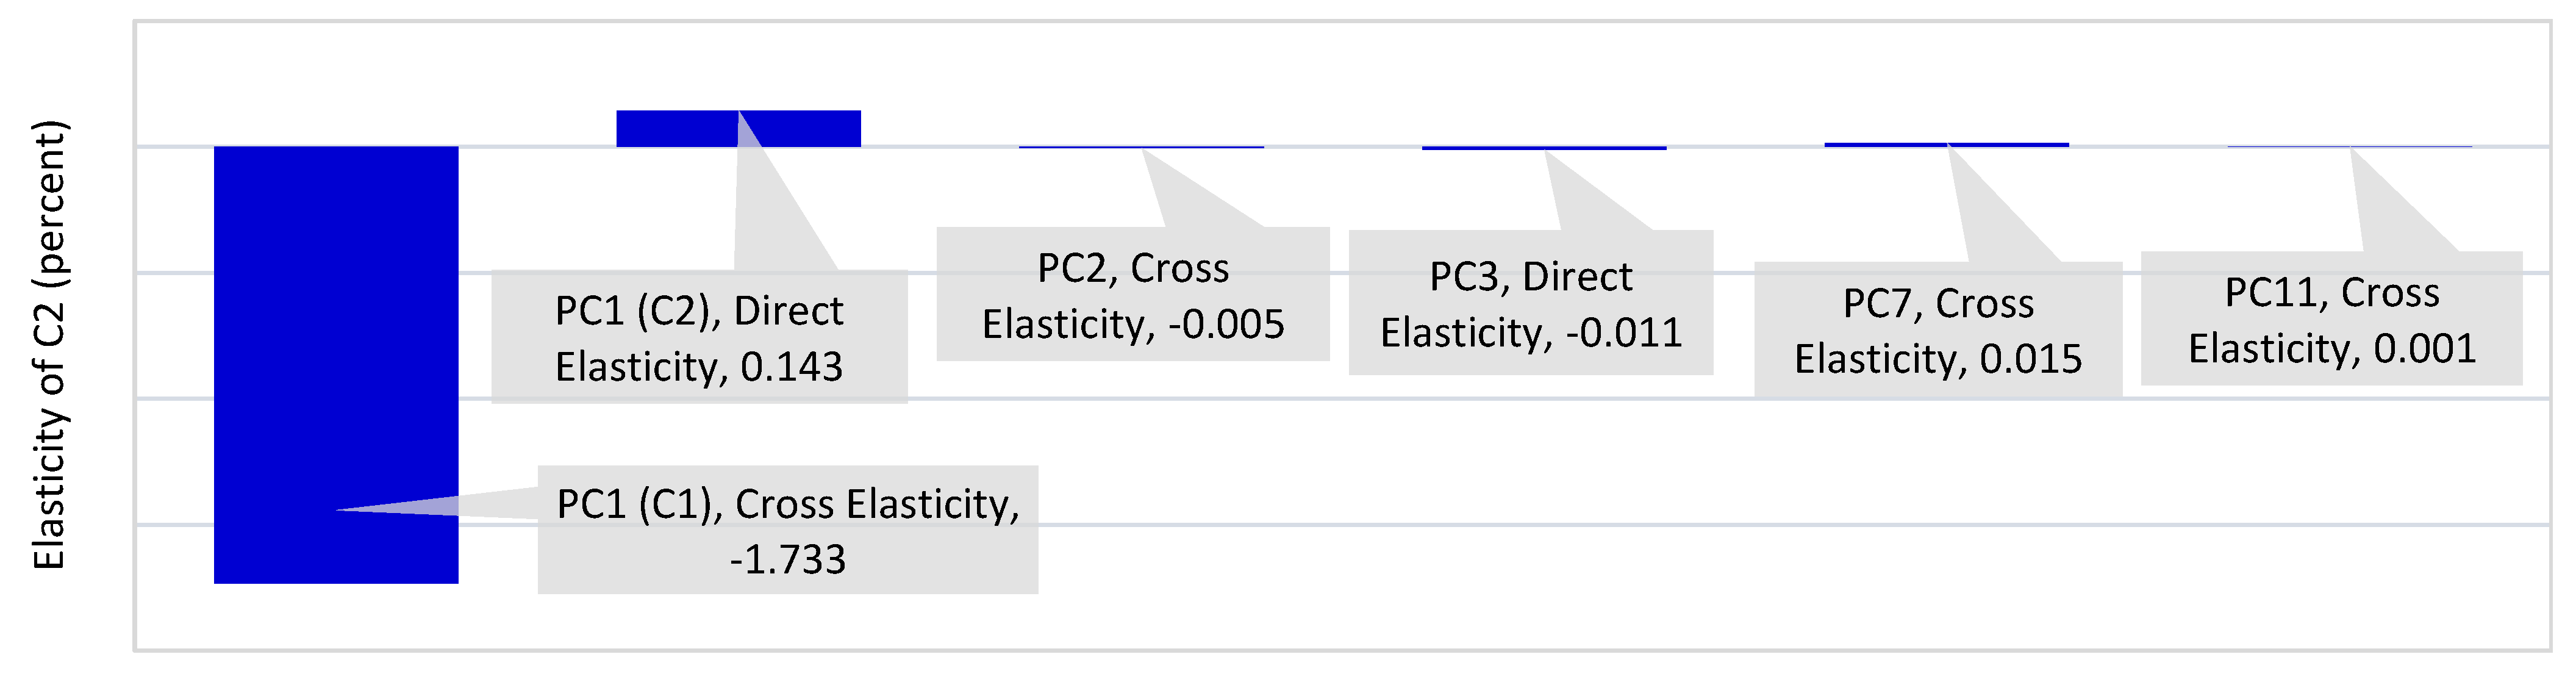
PC1 (AFT Practicability) has a positive coefficient in the second alternative as well. A BET is the second chosen AFT in the questionnaire as well, yet ITCs care less for environmental issues.
PC3 (Environmental Concerns) has a negative association with this alternative. In addition, ITCs prefer BETs to carry
dangerous cargo. Nevertheless, they do not find it suitable for
liquefied bulk cargo.
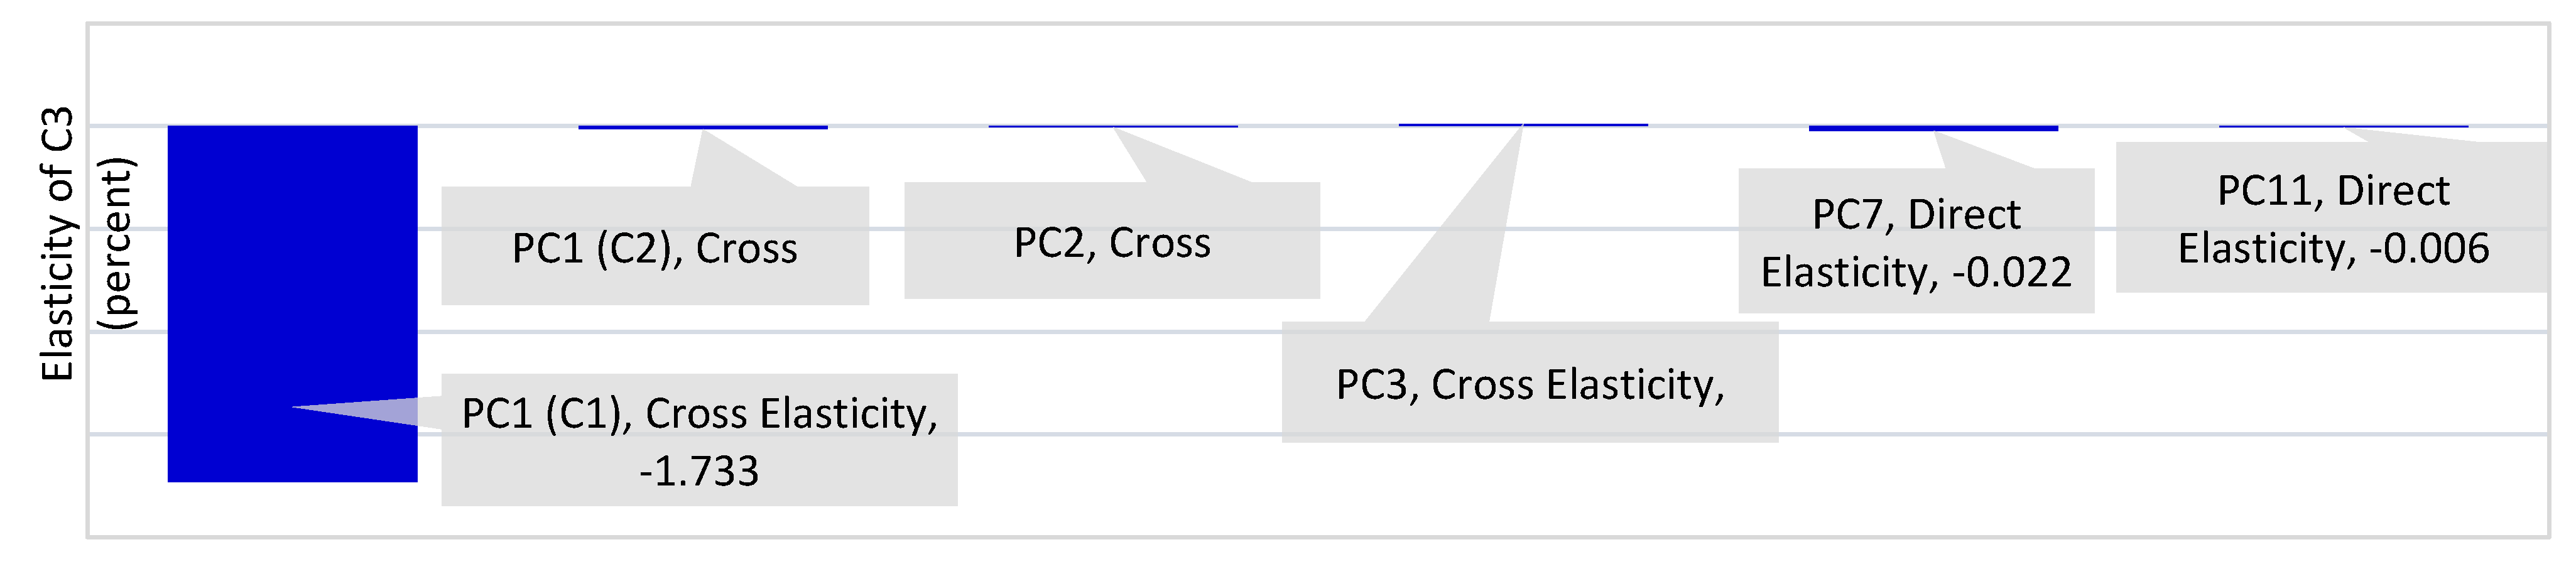
Figure 4 shows the direct and cross elasticity result.
PC1 (meaningful in the first alternative) with a 1% increase decreases the choice probability of BETs by 1.73%, whereas the direct elasticity of
PC1 (in BET choice) ultimately increases the choice probability by 0.14%. Furthermore, other PCs’ elasticity barely changes the choice probability of the alternatives.
PC7 and
PC11 have negative coefficients in the third alternative. AFT characteristics and environmental issues are drawbacks of the hydrogen and biogas trucks. Calculations show high GHG emissions in the supply chain of these fuels [
53]. Probably, ITCs also worry about GHG emissions of the recycling procedure of these trucks (with reference to
Table 2, which demonstrates the linear combination of PCs). Nevertheless, like the previous model, the shorter
refueling time of biogas trucks helps elevate their market share.
Figure 5 illustrates direct and cross elasticity results. Compared to other PCs, a 1% increase in
PC1 has a greater impact on choice probability.
6. Conclusions
Several methods have been employed to analyze AFT choice behavior in domestic land transit in previous studies. Analyzing this issue in international land transit is necessary; by passing through various countries, the AFT market share faces other barriers [
14,
15,
43]. Thus, cognitive, environmental, policy, practical, and economic issues affecting ITCs’ AFT preferences within the Europe–Iran international trade route were evaluated in this study. The online questionnaire was answered by 684 company managers across 20 countries in Europe and Iran.
The extracted eleven PCs revealed the original variables contributing to the AFT choice behavior. Considering the loadings above 0.2, the first PC (practical variables), the second PC (policy variables), the third PC (environmental variables), the fourth PC (cognitive variables), and the fifth PC (economic variables) feature the importance order of the variables for the ITCs. In addition, the generated two MNL models uncovered the variables influencing AFT choices in international land transit. The results of the MNL Models are summarized in
Figure 7.
The model with Likert scale variables illustrates that tank-to-wheel GHG emissions, low noise pollution, unsuccessful short-term alternative fuel pricing policies, and social responsibility do not elevate AFT market shares. Besides the battery capacity of BETs, the top speed of BETs and the short refueling time of biogas trucks are important for ITCs in this study. Moreover, each additionally owned CNG truck, the service quality of the manufacturer, and high maintenance costs deter ITCs from choosing AFT. From the mentioned variables, AFT top speed, social responsibility, and alternative fuel pricing policy have the highest marginal effect.
The effectiveness of mentioned variables has also been argued in previous studies. Tank-to-wheel GHG emissions and social responsibility are not an important priority for ITCs [
30,
36,
49]. As an advantage of BETs, low noise pollution does overcome its problems. Low driving range [
54] and not addressing economic and political issues in the currently implemented regulations [
55] are among the problems. It is believed that logistics planning has been connected to AFT top speed [
17]. Furthermore, each additionally owned CNG truck has a detrimental effect on BET market shares [
8]. Battery capacity and service quality of the manufacturers need improvement [
14,
31,
36,
50,
56]. Maintenance costs and refueling time negatively affect the choice of BET, CNG, and LNG trucks [
23,
56]. Short-term pricing policies also decrease the market shares of hydrogen and biogas trucks [
31,
39,
51].
In the second model, five PCs help explain the AFT choice behavior of the ITCs. PC1 (AFT practicability) positively affects BETs, CNG trucks, and LNG trucks’ choice probability. It accords with the result of the first model illustrating the negative influence of practical issues on the choice probability of hydrogen and biogas trucks. In addition, compared to other PCs, a 1% increase in PC1 has a more considerable influence on the choice probability. The positive coefficient of PC2 (Policy functionality) in the alternative of CNG and LNG trucks indicates the current policies have been much more practical for CNG and LNG trucks only. It is also a reflection of the results of the first model. Alternative fuel pricing policies negatively affect the choice probability of BETs in the first model. In line with the first model, ITCs care less for environmental issues, and PC3 (Environmental concerns) has a negative association with BETs. In addition, the negative coefficient of PC7 shows ITCs have a negative opinion of the characteristics of hydrogen and biogas trucks. It can be related to the fact that GHG emissions in the supply chain of these fuels are considerable [
3]. Finally, like the model with Likert scale variables, refueling time positively affects the choice probability of biogas and hydrogen trucks.
The current study found a meaningful relationship between cargo type and AFT choice. The generated models show ITCs do not find CNG and LNG trucks safe for carrying dangerous cargo. ITCs prefer BETs for this purpose. Yet to carry bulk and liquefied bulk cargo, containerized cargo, and roll-on/roll-off cargo, they prefer CNG and LNG trucks. The effect of cargo type has also been discussed in previous studies [
39].
This study urges policy makers and AFT manufacturers to implement cognitive, environmental, policy, practical, and economic factors to help ITCs adopt alternative fuel trucks (AFTs) for international land transit. Challenging prevailing beliefs, the study highlights the significance of practical aspects, such as battery capacity, top speed, and refueling time, while questioning the impact of factors, such as greenhouse gas emissions and short-term pricing policies. It also emphasizes the need for improvements in battery capacity and manufacturer service quality to promote greater AFT adoption. Additionally, the study emphasizes the importance of tailoring AFT solutions to different cargo types. Overall, it advocates for an approach to meet the expectations of ITCs and encourage the use of alternative fuels. This fact helps us to prioritize sustainability and reduce the environmental impact of the transport sector.
Limitation and Future Work
The importance of cargo type, cognitive, environmental, practical, and policy issues is revealed by the generated models. This study is limited to alternative fuel choice analysis. Future study suggestion is a secondary powertrain choice analysis for hybrid trucks. ITCs who chose none of the AFTs are not included in the MNL models in this study. Therefore, for future studies model calibration on these companies and revealing possible discouraging factors affecting their choice is suggested. Finally, in this study, ITCs’ AFT choice analysis is based on current AFT characteristics. Future technology development may change views of ITCs and their AFT choice. Further analysis on this issue is also advised.


 ,
, 


