Article

The Effect of Climate Change on the Hydropower Potential in the Kunhar River Watershed, Pakistan

by
Haseeb Akbar
1,2,
Pariyapat Nilsalab
1,2,
Thapat Silalertruksa
3 and
Shabbir H. Gheewala
1,2,*
1
The Joint Graduate School of Energy and Environment, King Mongkut’s University of Technology Thonburi, Bangkok 10140, Thailand
2
Center of Excellence on Energy Technology and Environment, Ministry of Higher Education, Science, Research and Innovation, Bangkok 10140, Thailand
3
Department of Environmental Engineering, Faculty of Engineering, King Mongkut’s University of Technology Thonburi, Bangkok 10140, Thailand
*
Author to whom correspondence should be addressed.
World 2023, 4(4), 776-794; https://doi.org/10.3390/world4040049
Submission received: 8 September 2023 / Revised: 9 November 2023 / Accepted: 20 November 2023 / Published: 22 November 2023

Abstract

:
Climate change plays a vital role in the hydrology of any river basin, which may have multidimensional consequences. There is a need to conduct climate change impact assessment studies with updated models and scenarios. This study aimed to assess the impact of climate change on the streamflow and hydropower in Pakistan’s Kunhar River basin. Three general circulation models (GCMs), under two Shared Socioeconomic Pathway scenarios (SSPs 2–45 and 5–85), the Soil and Water Assessment Tool, and the flow duration curve were used to project the change in climatic parameters, streamflow, and hydropower potential, respectively. The findings indicated that in the 2080s, the precipitation, maximum, and minimum temperatures are projected to increase by 10%, 2.0 °C, and 3.0 °C under the SSP 2–45 scenario and are projected to increase by 8%, 3.7 °C, and 4.4 °C under the SSP 5–85 scenario, respectively. The annual streamflow may increase by 15 to 11%, and the seasonal fluctuations are more likely to be dominant compared with the annual fluctuations. The hydropower potential will probably increase by 24 to 16% under the SSP 2–45 and 5–85 scenarios in the 2080s. However, seasonal changes in streamflow and hydropower may impact the hydropower plant operation in the basin. The Kunhar River’s hydrology may change from snow-fed to a rainfall–runoff river.

1. Introduction

We are living in an anthropogenic world [1]. The inadequate use and deterioration of natural resources and ecosystems have resulted from a growing demand from development expansion, and the situation is made worse by climate change [2]. The United Nations has developed the Sustainable Development Goals (SDGs) to divert global development growth in the right direction, reduce the pressure on natural resources and ecosystems, and avoid the hazards from unexpected systematic shifts [3]. In general, SDGs 6, 7, and 13 are related to water, clean energy, and climate change, respectively. Climate change might have an impact on the availability of water and energy, especially hydropower [4,5,6]. The rise in greenhouse gas concentration in the atmosphere brought on by human activity is what causes climate change [2]. In 2019, the atmospheric concentration of CO2 reached its highest point in more than two million years. Additionally, the average temperatures recorded during the decade from 2011 to 2020 surpassed those of the most recent prolonged period of warmth, which took place approximately 6500 years ago. The Intergovernmental Panel on Climate Change (IPCC) has projected that during the period from 2081 to 2100, the average global surface temperature is expected to increase. Under the low greenhouse gas (GHG) emissions scenario, it is highly likely to rise by approximately 1.0 °C to 1.8 °C. In contrast, under the high GHG emissions scenario, there is a potential for a more significant increase, ranging from 3.3 °C to 5.7 °C [7]. Climate change eventually results in modifications to the hydrological cycle, which lead to a change in water availability [8,9,10]. A change in water availability is linked with changes in low-flow and high-flow timings that can influence crop yield, groundwater recharge, green and blue water availability, and hydropower potential [11,12,13,14,15,16]. Hydropower comprises the largest portion of renewable energy sources and is facing a significant challenge due to climate change. According to a study in southern Spain, half of the hydropower production may be reduced due to climate change at the end of this century [17]. A 12% decrease is projected in hydropower generation at the Kariba reservoir due to climate change in the Zambezi River basin (Southern Africa) [18]. A study on the Tekeze reservoir in Ethiopia examined the impact of climate change on hydropower; the results showed a potential increase of up to 30% by the end of this century [19]. A study in the Kaoping river basin in Taiwan used four GCMs to examine climate change’s effect on hydroelectric capacity; the findings showed a future decrease in hydropower potential [20]. According to Hydropower Resources Pakistan (2022), Pakistan possesses an estimated hydropower potential of approximately 64,000 MW, with a significant portion still untapped, as only 10,200 MW has been harnessed to date. On the other hand, Pakistan is currently the fifth-most climate-vulnerable country in the world [21]. This makes it more important to estimate the impact of climate change on hydropower potential in the context of Pakistan. No study has been conducted to investigate the impact of climate change on the hydropower potential of the Kunhar River basin to date.
This study focuses on the impact of climate change on the streamflow and hydropower in the Kunhar River basin, Pakistan. The decision to choose the Kunhar River basin was based on its large capacity for hydropower generation. To determine the effects of climate change on the Kunhar River basin, a few studies have been carried out, but these investigations were only based on historical data analysis [22,23,24,25]. A couple of studies have also reported the projected future streamflow [26,27]. However, these studies used outdated emission scenarios, low resolution, and a very limited number of general circulation models (GCMs) for the projection of future flow. A governing equation for the GCM is the Navier–Stokes equation, which describes the three-dimensional climatic conditions of the Earth, ocean, and atmosphere, as well as their interactions [28]. Uncertainties in climate projections mainly occur due to the variation in spatiotemporal resolution, numerical methods, etc., in climatic models and bias correction techniques [29,30]. However, multimodal combined types can be used to minimize the uncertainty in climate projections [31,32]. The aforementioned points highlight the primary areas where research is lacking. To address these gaps, the main objectives of this study were as follows:
-
To evaluate the impacts of climate change on the streamflow in the Kunhar River basin;
-
To determine how climate change would influence the hydropower potential.
The primary novelty of this study includes the utilization of multiple GCMs using the latest IPCC scenarios and evaluating the influence of climate change on the hydropower potential within the Kunhar River basin. This work used the combined results of three GCMs to quantify the effects of climate change on the streamflow and hydropower potential in the Kunhar River watershed under the SSP 2–45 and 5–85 scenarios in order to reduce uncertainty. With the aid of several methodologies, GCMs were downscaled from the global to the regional level to lessen the uncertainty in climate forecasts [33,34]. The hydrological model Soil and Water Assessment Tool (SWAT) was used to project streamflow. Due to the Kunhar River watershed’s geographic significance, sharp topographic change, climatic fluctuations, water supplies, and hydropower potential, it was chosen as the subject location for this research. The Kunhar River alone offers enormous potential for hydropower production, which is also susceptible to climate change.
The outcomes observed in the Kunhar River basin carry significant implications that could extend to the Neelum and Astor River basins. Furthermore, the results of this study can have even wider implications for other areas such as Amu Darya and Syr Darya River Basins, which are located in Central Asia. Both have a similar terrain and hydrological regimes [35]. This is primarily due to the striking similarities that these basins exhibit in terms of their physical landscape and the dynamics of their hydrological regimes. The topography, characterized by the terrain’s shape and features, is very similar among these river basins, suggesting that any geographical or environmental factors influencing one are likely to be relevant to the others. Furthermore, the hydrological regime, which encompasses the distribution, movement, and quality of water throughout these areas, follows a comparable pattern. This means that the way that water flows, the timing of its flow, and its response to various climatic conditions are almost the same across these basins. Therefore, research or observations yielding insights into water management, conservation efforts, or ecological impacts within the Kunhar River basin could provide a valuable insight into what could be expected for other hydrologically similar basins. Understanding these implications is crucial for regional planning, sustainable development, and environmental protection initiatives across these interconnected landscapes.

2. Materials and Methods

This section consists of two parts: data acquisition and methodology. Hydroclimatic, soil, land, elevation data, and data for three GCMs (under two scenarios) were collected from different sources. The methodology of this study was based on climatic modeling, hydrological modeling, estimation of change in flow, and change in hydropower potential.

2.1. Data Acquisition
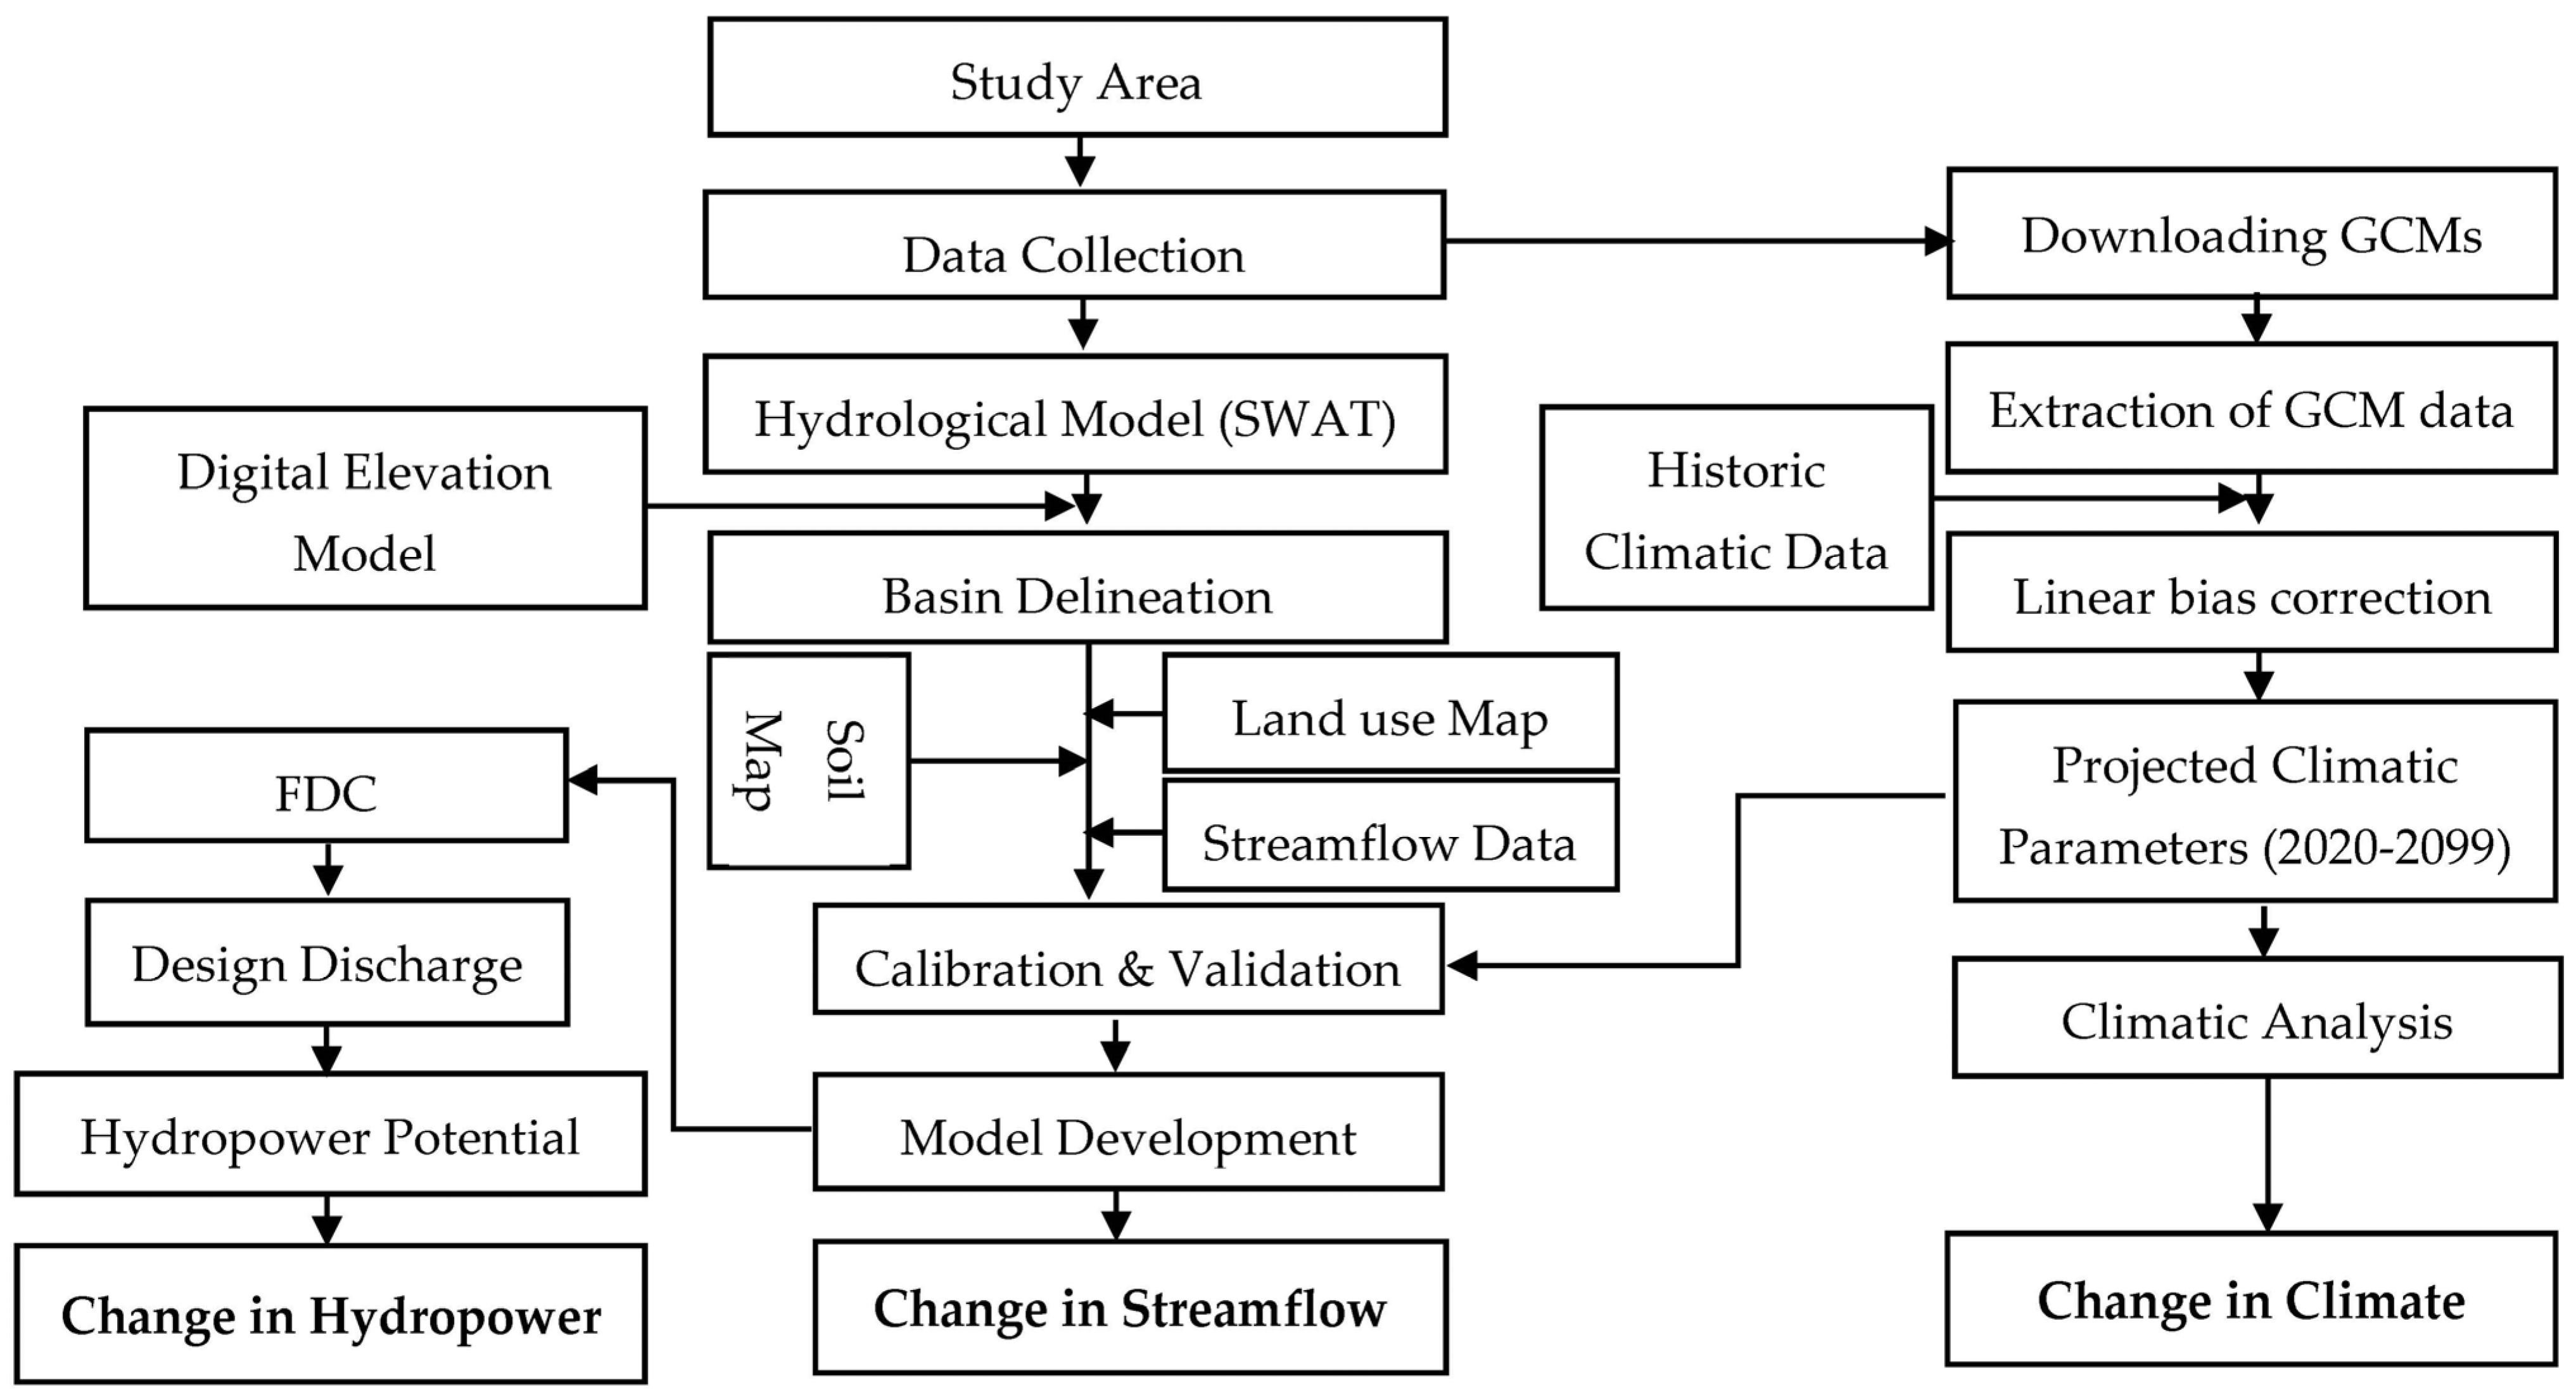
The National Centers for Environmental Prediction’s Climate Forecast System Reanalysis provides daily historical climate data (CFSR), including precipitation, highest and lowest temperatures, wind speed, relative humidity, and solar radiation through the link https://globalweather.tamu.edu/ (accessed on 10 April 2022). These climate variables were incorporated as inputs in the development of the SWAT model, and both maximum and minimum temperatures, along with precipitation, were also utilized in the bias correction process for future climatic projections. The Surface Water Hydrology Project provided the Naran and Balakot daily observed data as well as the Ghari Habibullah/Talhatta station’s streamflow data (SWHP) were used for the hydrological analysis for the baseline and for the calibration and validation of the SWAT model. The Food and Agriculture Organization of the United Nations (FAO) provided the soil information. The Digital Elevation Model (DEM) was retrieved from the Shuttle Radar Topography Mission (SRTM). The land use data were retrieved from the European Space Agency. Soil, land use map, and DEM were used in the SWAT model as inputs. Table 1 lists the specifics of each type of data that were collected for this study.
Future climatic data was extracted from three GCMs, with a resolution of 250 × 250 km. These were obtained from the European Centre for Medium-Range Weather Forecasts (ECMWF) platform through the link https://cds.climate.copernicus.eu/cdsapp#!/dataset/projections-cmip6?tab=form (accessed on 10 December 2022). The characteristics of GCMs are given in Table 2.

2.2. Methodology

The methodology of this study can be divided into three main components: first, an examination of climate patterns using multiple GCMs and scenarios; second, an analysis of how climate affects runoff using the SWAT model; and third, an evaluation of the impact of climate on hydropower potential with help of flow duration curve (FDC). The implications of climate change on river flow and hydropower were estimated using the framework shown below in Figure 1.

2.2.1. Climate Change Assessment

This section introduces the outcomes of relative change in projected climatic parameters (precipitation, maximum and minimum temperatures) with respect to the baseline data (1979–2017). Moreover, to minimize the uncertainty, the precipitation and temperature results of all three GCMs (ACCESS-CM-2, CNRM-CM6.1, and MRI-ESM2.0) were ensembled under two scenarios (SSP 2–45 and 5–85). The SSPs have been developed to offer holistic scenarios that encompass both socioeconomic and climate influences. In contrast, the RCPs mainly concentrate on greenhouse gas concentration trajectories without explicitly factoring in socioeconomic aspects. This incorporation enables a more thorough evaluation of the consequences of future climate change and the formulation of adaptation strategies [36]. The temperatures and precipitation were bias-corrected with linear technique. Projected climatic parameters were divided into three time steps, 2020–2039 (2030s), 2040–2069 (2050s), and 2070–2099 (2080s). ArcGIS was used to extract the climatic parameters (precipitation, maximum and minimum temperatures) from the three GCMs for the historical (1979–2005) and projected run (2020–2099). The range of projection of precipitation of different GCMs is significantly varied in magnitude [37,38]. The projected precipitation and temperatures were bias-corrected with the linear scaling technique. Equations (1) and (2) below provide the scaling factor, observed monthly mean ratio, and historical run that was used to adjust precipitation using the linear scaling approach. Equations (3) and (4) yield scaling value, which represents the difference between the historical run of the climate model and the long-term monthly observed temperature; this was added to the maximum and lowest temperatures to adjust them.
P h i s = P h i s d . u m ( P o b s ( d ) ) u m ( P h i s ( d ) )
P f u t = P f u t d . u m ( P o b s ( d ) ) u m ( P h i s ( d ) )
T h i s = T h i s d + u m T o b s d u m T h i s d
T f u t = T f u t d + u m T o b s d u m T h i s d
where P stands for precipitation, T for temperature, his for historical runs, fut for future runs, obs for station data, u for average, m for monthly, d for day, and an asterisk (*) for bias correction.

2.2.2. Hydrological Modeling

The SWAT hydrological model, which is physically based and semi-distributed, can simulate runoff on a daily or subday time scale. The SWAT model benefits from its utilization of software code that is available in the public domain and open-source resources. Nevertheless, it also exhibits some limitations, such as its constrained capabilities in addressing erosion and sediment transport, as well as its limited capacity to simulate snowmelt [38]. Equation (5), which is based on the water balance equation, serves as the foundation for the hydrologic component of SWAT [39].
S W t = S W 0 + i = 1 t ( R i Q s u r f E i W i Q g w )
where SW0 is the initial soil water concentration, and SWt is the final soil water concentration in t days. Ri is precipitation, Qsurf is surface runoff, Ei is evapotranspiration, Wi is loss to vadose zone, and Qgw is return flow. All quantities are in millimeters.
The Kunhar River watershed discharge was examined in relation to climate change using the SWAT model. The SWAT model received as inputs DEM, soil type, land use maps, and meteorological data. For fifteen years (1985–1999), the SWAT model was calibrated on a monthly time step and validated for fourteen years (2001–2014). A warm-up period of four years was used (1981–1984). Model calibration entails adjusting model parameters so that the simulated flow captures the observed flow’s inconsistencies [40]. Manual calibration was undertaken to enhance the alignment between simulated and observed values. The hydrological model’s performance was assessed using three distinct statistical metrics: Nash–Sutcliffe efficiency (NSE), percentage of bias (PBIAS), and coefficient of determination (R2). The acceptable values of NSE, R2, and PBIAS are >0.5, >0.5, and −15% < PBIAS < +15%, respectively [22]. Streamflow under climate change was predicted using the calibrated SWAT model. Additionally, with the use of SWAT calibration and uncertainty tools, the Sequential Uncertainty Fitting Version 2 (SUFI-2) technique was used to perform the sensitivity analysis (SWAT–CUP). One thousand iterations were used to complete the sensitivity analysis. Sensitivity analysis is a commonly used technique for assessing the significance of individual model parameters in influencing the system’s behavior [40].

2.2.3. Projected Streamflow Assessment

The projected precipitation and temperature were the main inputs to obtain the projected streamflow by using the calibrated SWAT model. However, the baseline data of relative humidity, solar radiation, and wind speed were given as input to the calibrated SWAT model to project the river flow. Moreover, it was assumed that there would be no significant land use change in the watershed in the future. This assumption is based on the baseline land use data (2019), which showed that practically most of the forests in the Kunhar River basin are conserved forests, and that just 0.2 percent of the area was used for urban land use. There is no other use allowed for this space. According to the Pakistan Forest Act of 1927, reserved woods are state-owned forests that have been designated as such. In these woods, unless otherwise noted, no activity is allowed [41]. In order to project the river flow, the SWAT model’s input calibration was carried out using the baseline land use data. The change in streamflow was analyzed with a comparative assessment of baseline and projected streamflow on monthly, seasonal, and annual scales, and percentage change was determined. Secondly, three indices were employed to calculate the change in streamflow as a result of climate change: low flow (Q95), median flow (Q50), and high flow (Q5). The FDC was used to derive Q95, Q50, and Q5. The FDC is a cumulative frequency curve that calculates the percentage of times that a set of discharges was equaled or surpassed over the course of a certain period according to Equation (6), as given by [42].
P % = M ( n + 1 ) × 100
where P is the probability that a given flow will be equaled or exceeded (% of the time), M is the ranked position on the listing (dimensionless), and n is the number of events for the period of record (dimensionless).

2.2.4. Hydropower Analysis

The hydropower potential for a specific stretch of a stream may be easily determined by using Equation (7) [43]. The discharge (Q), the water’s specific weight (γ), and the power potential (P) of flowing water all influence the hydraulic head (H) between the intake point and the turbine. The sole variable in a run-of-the-river hydroelectric plant is streamflow.
  P = γ Q H
The head is the angular separation between two points in space (intake and turbine). The pressure caused by a difference in elevation between the intake and turbine is another way to describe it. For run-of-the-river hydropower plants, the alteration in the head caused by changes in flow is minimal. The water’s specific weight remains constant, with streamflow being the sole variable in Equation (7). Furthermore, there are several hydropower projects at various stages of development, with one already operational. The hydraulic head values for the proposed sites were sourced from [44], while data for sites under construction were extracted from [45,46]. Comprehensive site information can be found in Table S3 within the supplementary materials. Typically, 25 to 40% of the natural stream’s available flow is used as the design discharge [47], and 20–30% of river flow is used for environmental flow, according to a recent estimate of the Water and Power Development Authority (WAPDA), Pakistan [48]. A flow duration curve is employed to determine the river’s design discharge [49]. In this investigation, the design discharge (Q30) was taken as 30% of the available flow of the natural stream. Therefore, Q30 was used to estimate the change in hydropower potential for the baseline as well as for the three projected periods (2030s, 2050s, and 2080s) under the SSP 2–45 and 5–85 scenarios.

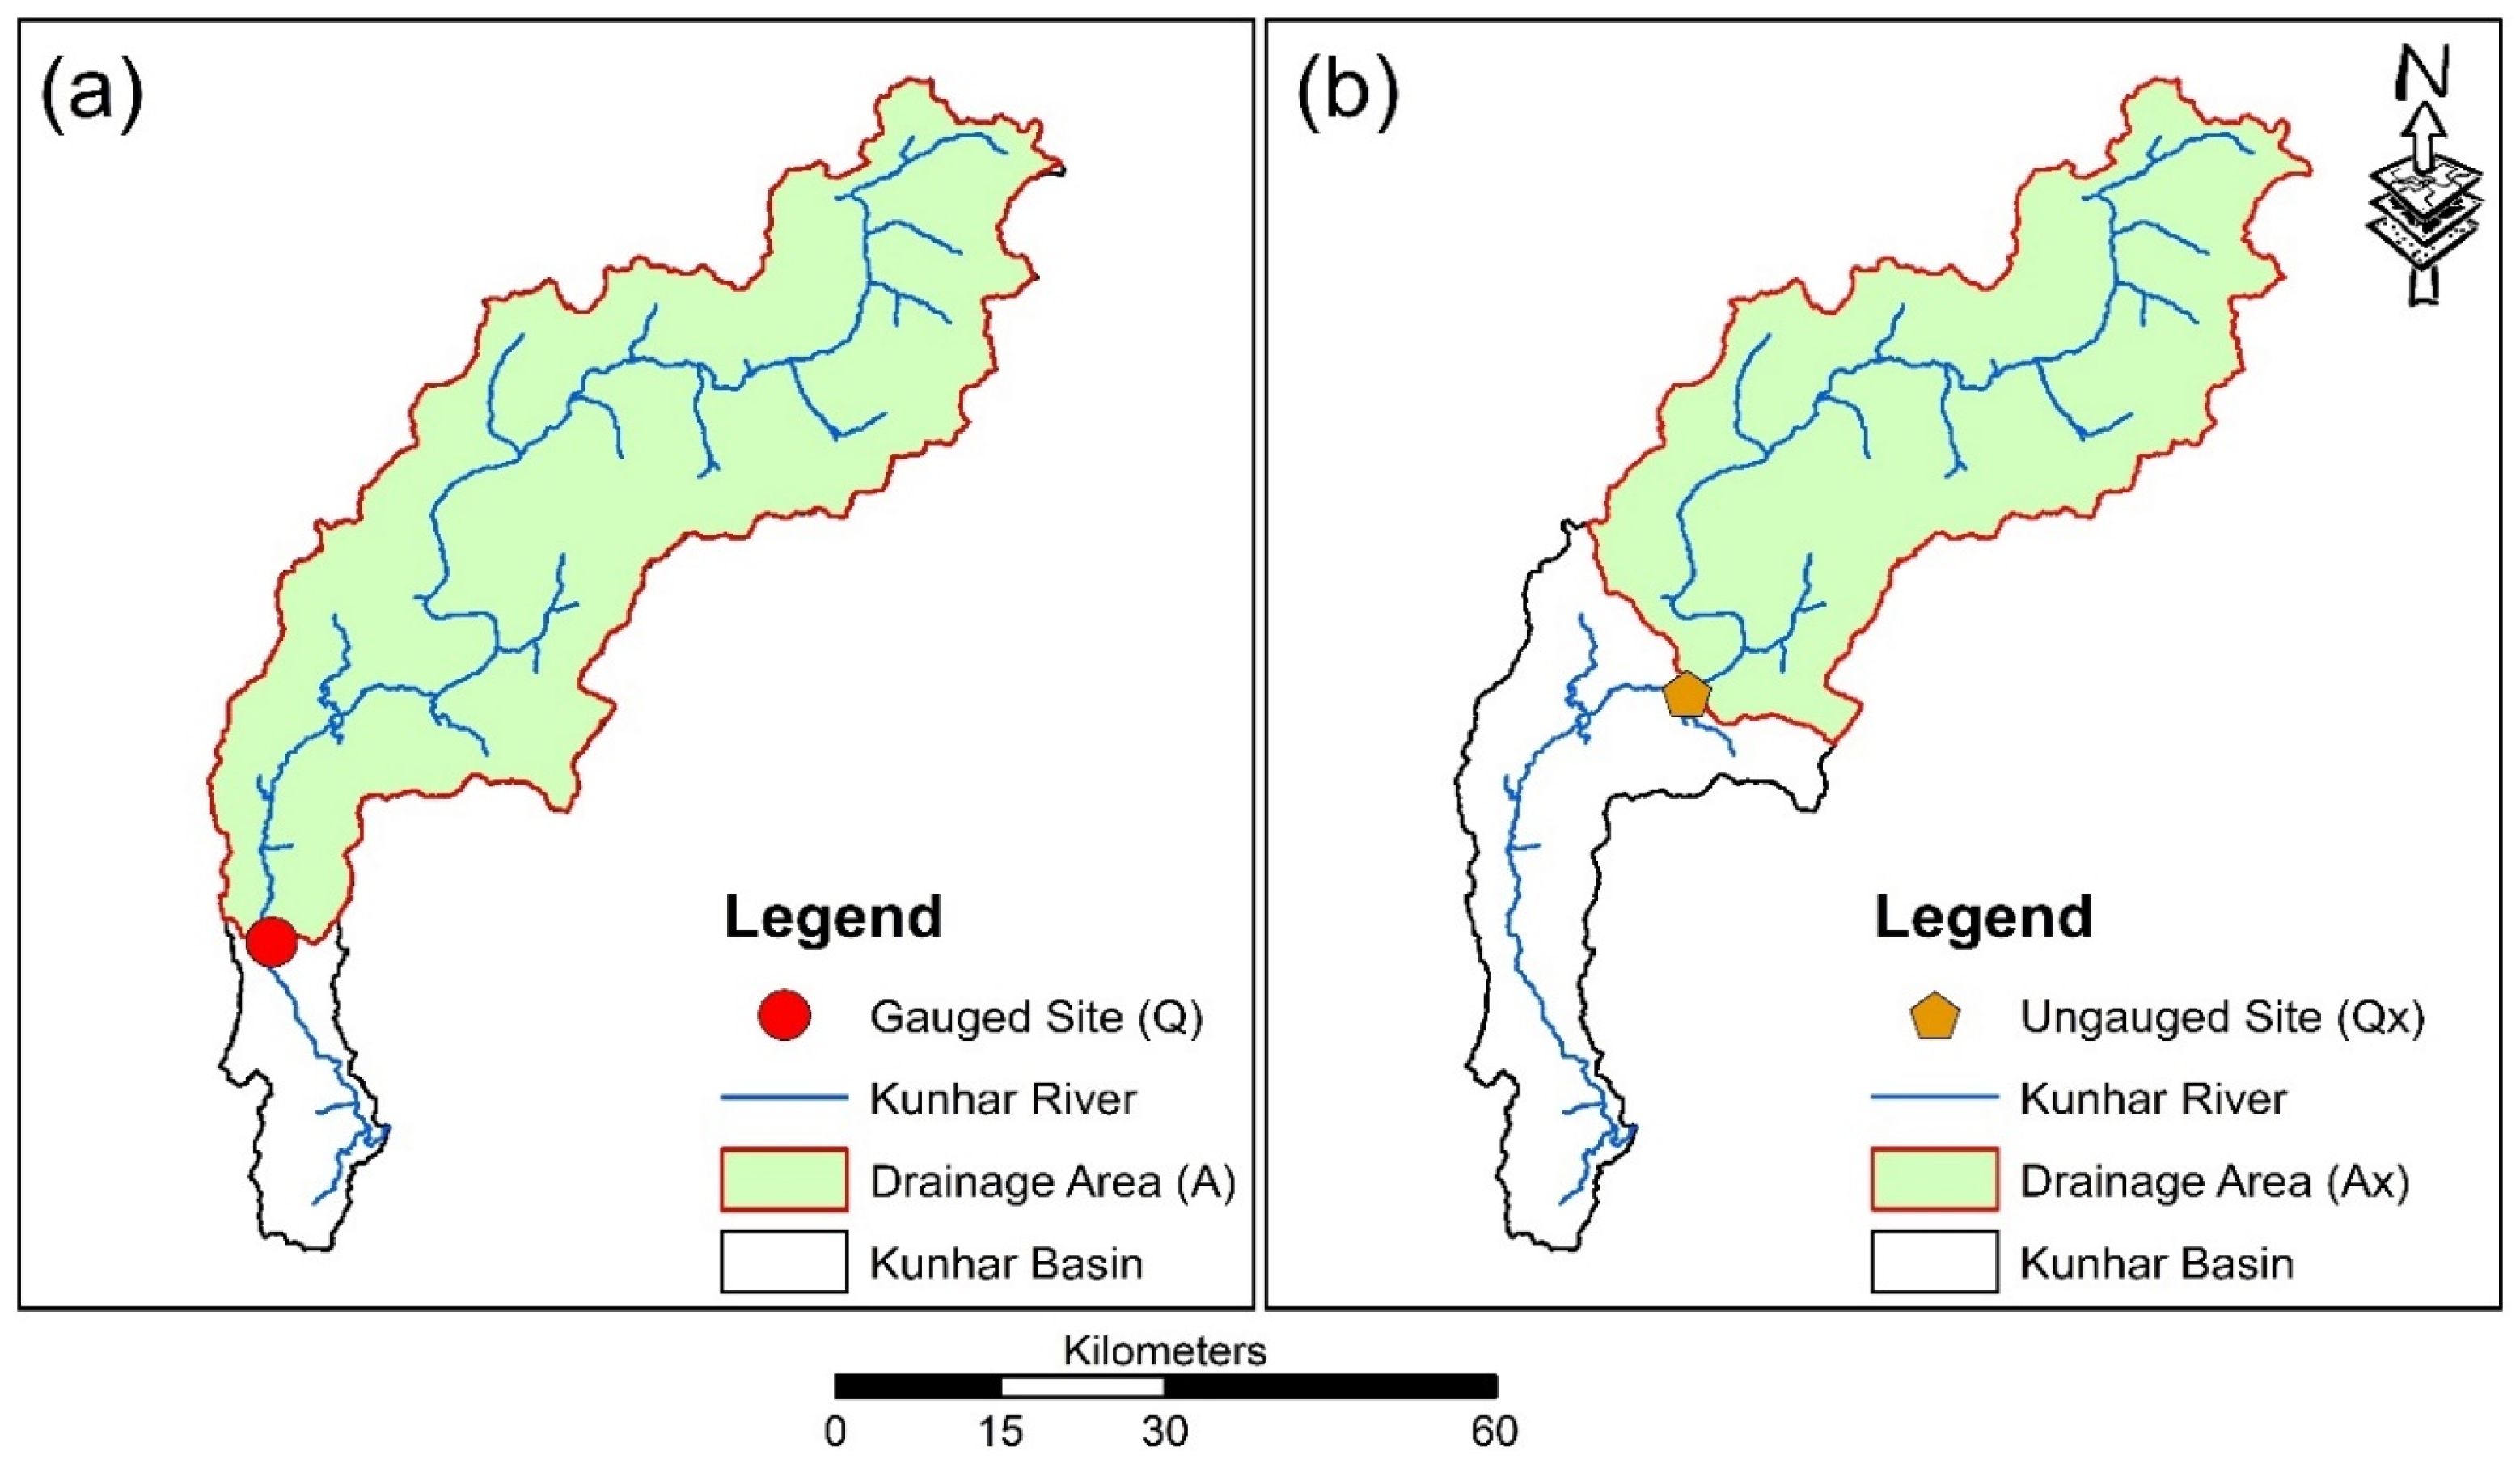
2.2.5. Ungauged Sites Streamflow
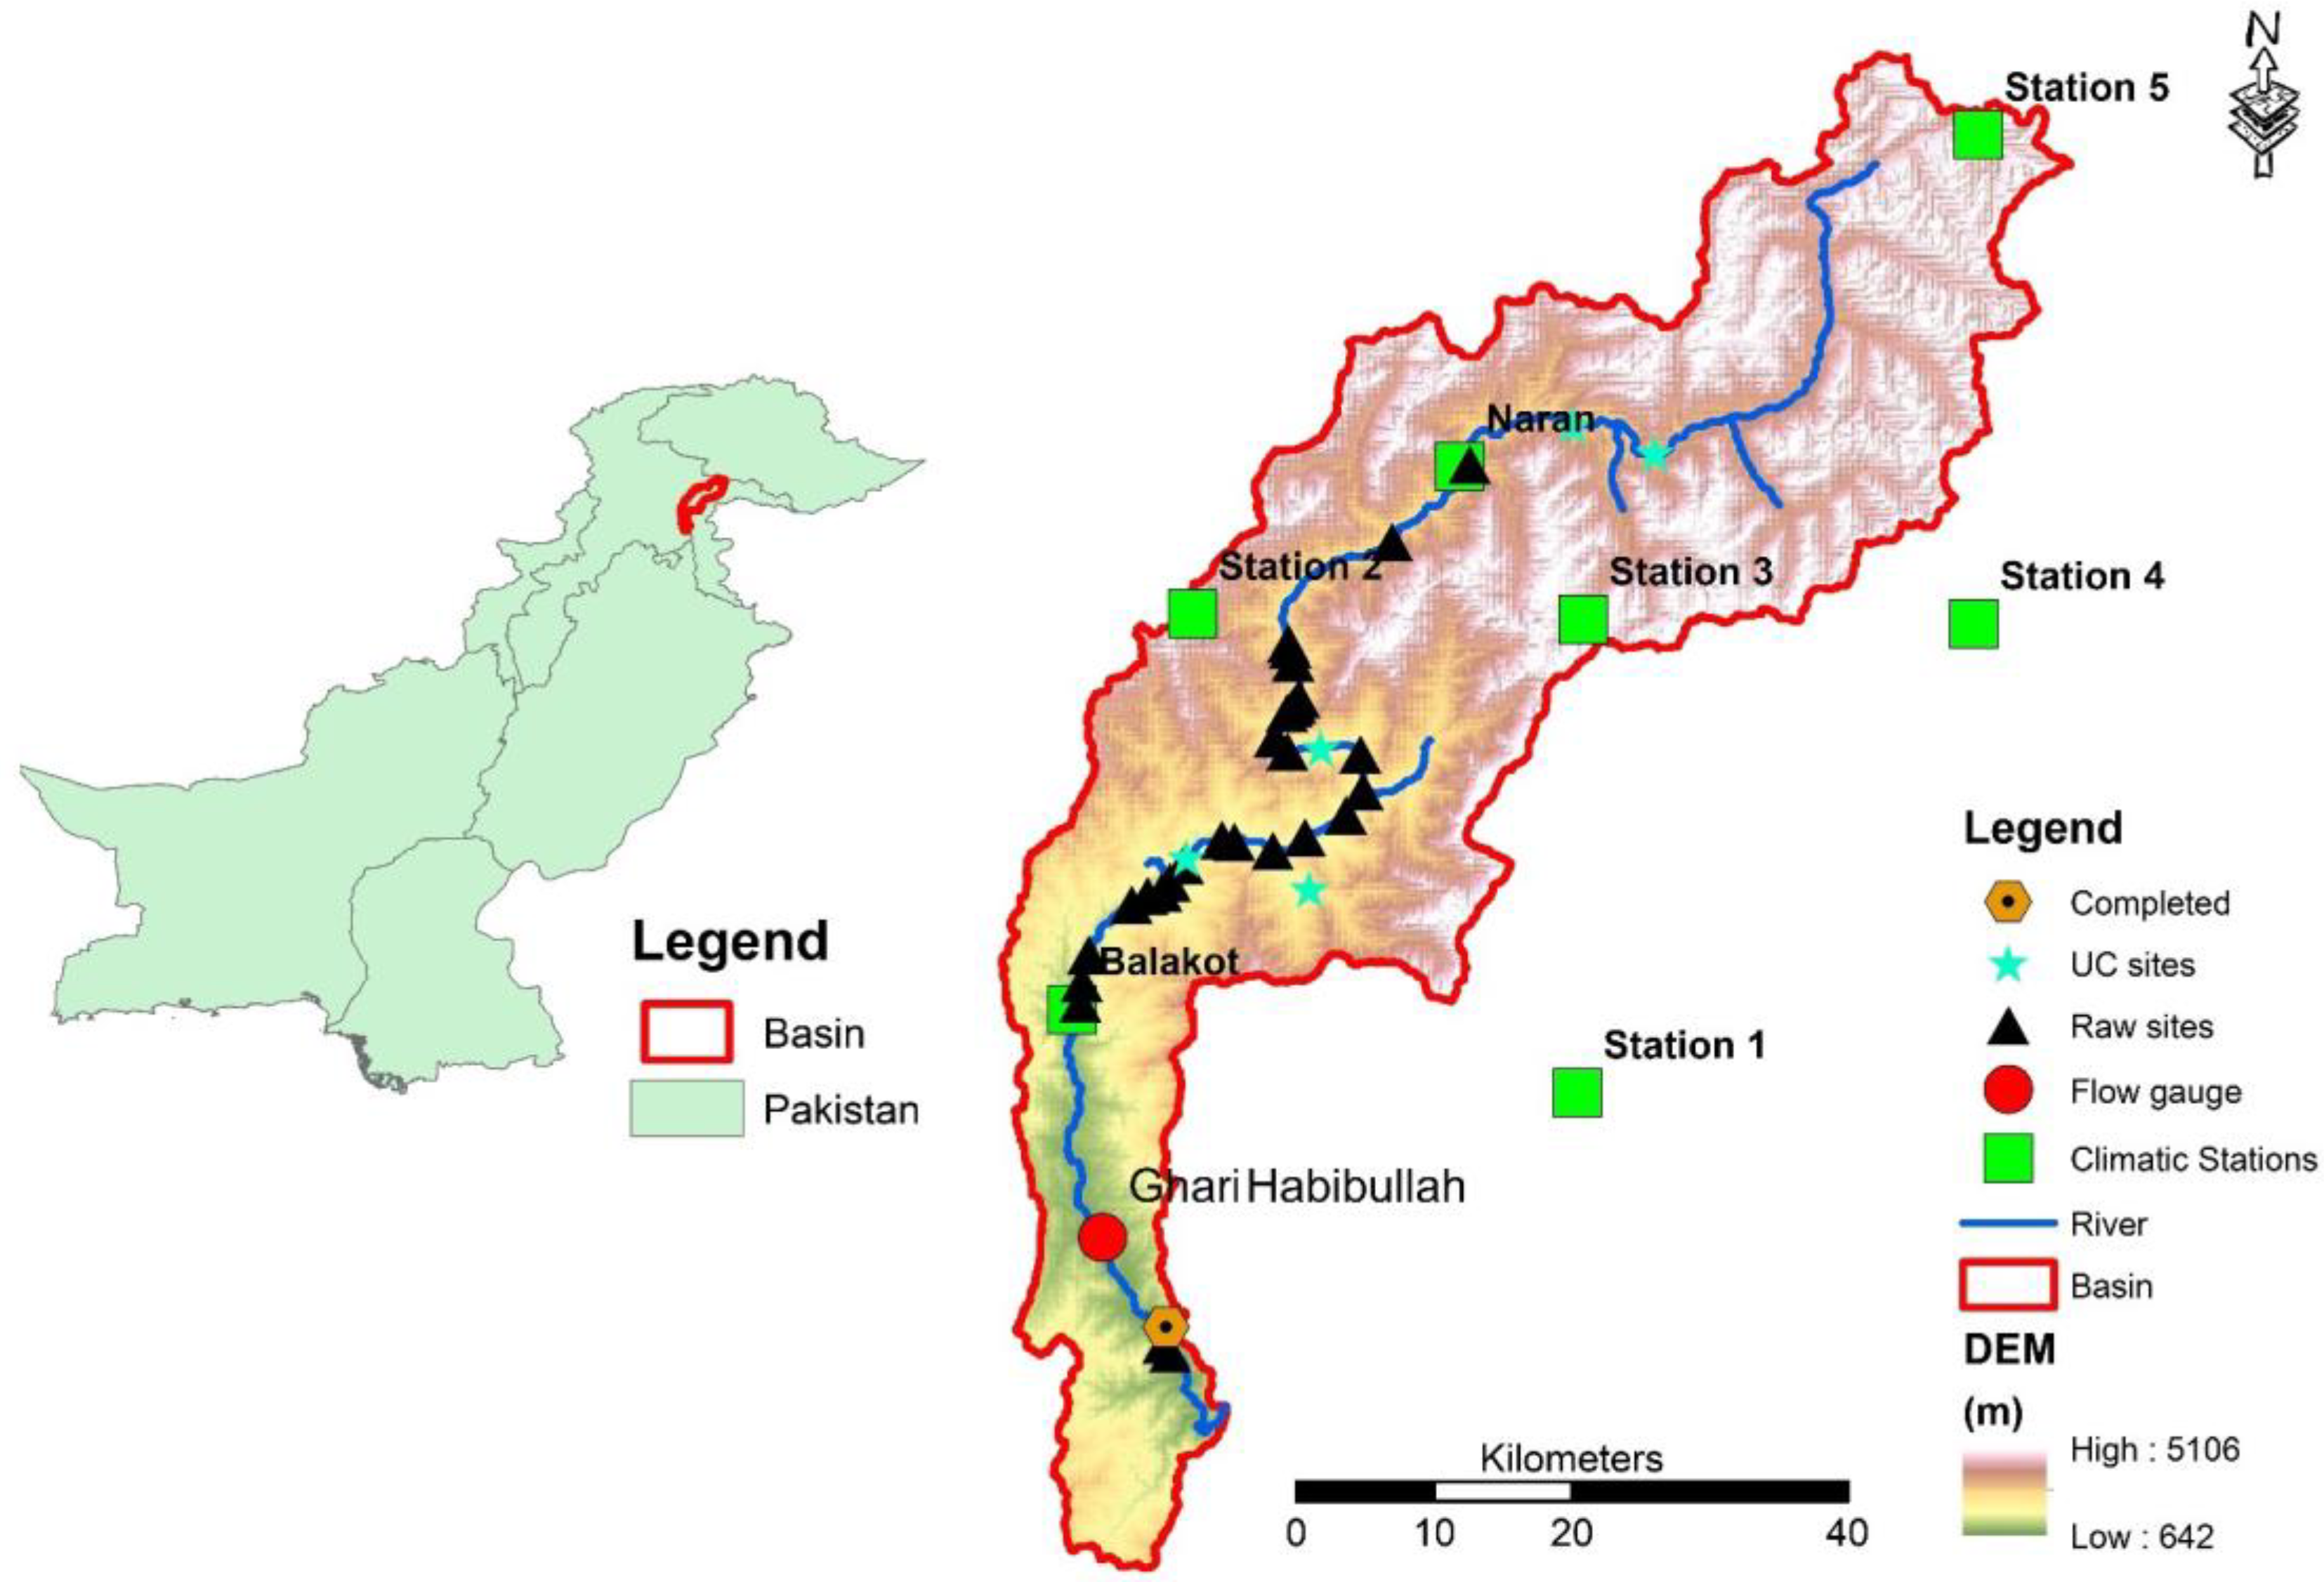
Flow data for Ghari Habibullah were obtainable for both the baseline and projected time spans. The drainage area ratio (DAR) method was employed to establish the relative flow at the specified locations [45]. Equation (8) was used to calculate the discharge at the ungauged location:
  Q x = A x A × Q
where Ax (km2) and A (km2) are the ungauged and gauged sites’ drainage areas, respectively, and Qx (m3/s) is the streamflow at the unmeasured location (x). But the “Q” (m3/s) is the known flow at the position of the gauge. This is further explained graphically by considering an example with a gauge drainage area, as shown in Figure 2a, and an ungauged drainage area, as shown in Figure 2b, with discharges Q and Qx, respectively.

2.3. Study Area

The Kunhar River watershed is in Pakistan’s northeastern part of the country. The Kunhar River is a significant tributary of the Jhelum River in Pakistan. Encompassing a total area of 2632 square kilometers, the Kunhar River basin may not be vast when compared with other watersheds, but it holds considerable significance for a variety of reasons. From a topographical perspective, the Kunhar watershed presents a diverse range of elevations and slopes. The variation in altitude is quite pronounced, with the lowest point of the watershed standing at 642 m above sea level, which contrasts sharply with the highest point, which soars to 5106 m above sea level. This dramatic difference in elevation contributes to the basin’s average slope of 53%, indicating a steep and potentially rugged terrain. Geographically, the watershed’s location and characteristics play a crucial role in the region’s hydrology and climate patterns.
The area is subject to hydroclimatic fluctuations, which can have profound impacts on water availability, agriculture, and the overall ecosystem. Moreover, the watershed’s hydropower potential is significant. The river’s flow and the gradient of the terrain offer opportunities for the generation of hydroelectric power, which can be a clean and renewable energy source for the region. This is particularly important for Pakistan, a country that has been seeking to expand its renewable energy capacity to meet growing energy demands and reduce reliance on fossil fuels. The slope map of the Kunhar River basin is shown in the supplementary material Figure S1, and slope classes and their proportion are given in Table S1. The Kunhar River commences in Babosar Top (4173 m) and flows into the Neelam River near Muzaffarabad. Most of the population is rural and linked with agricultural activity and secondly linked with tourism activities. Agriculture, forestry, and pasture are the major land use classes in the basin. The land use map of the Kunhar River basin is shown in Figure S2, and land use classes and their proportion are given in Table S2. There are four classes of soil in the Kunhar River basin; more than two-thirds of the soil types in the basin is Leptosol Medium. The soil map of the Kunhar River basin is shown in Figure S3, and the proposition of soil classes is given in Table S3. A streamflow gauge (Ghari Habibullah) and seven climatic gauges were used in this study. For the baseline period (1961–2017), the average annual streamflow at Ghari Habibullah station was 102 m2/s. The average annual maximum and minimum temperatures and precipitation in the baseline period (1979–2017) were 11.6 °C, 0.6 °C, and 1927 mm, respectively. Two of the five climatic gauges are named Naran and Balakot; the data of the remaining five climatic stations were obtained from the global data source and are classified with numbers from one to five; moreover, the completed, under construction, and raw sites for the hydropower are also shown in Figure 3.

3. Results

This section is further divided into four subsections, and the details are provided below.

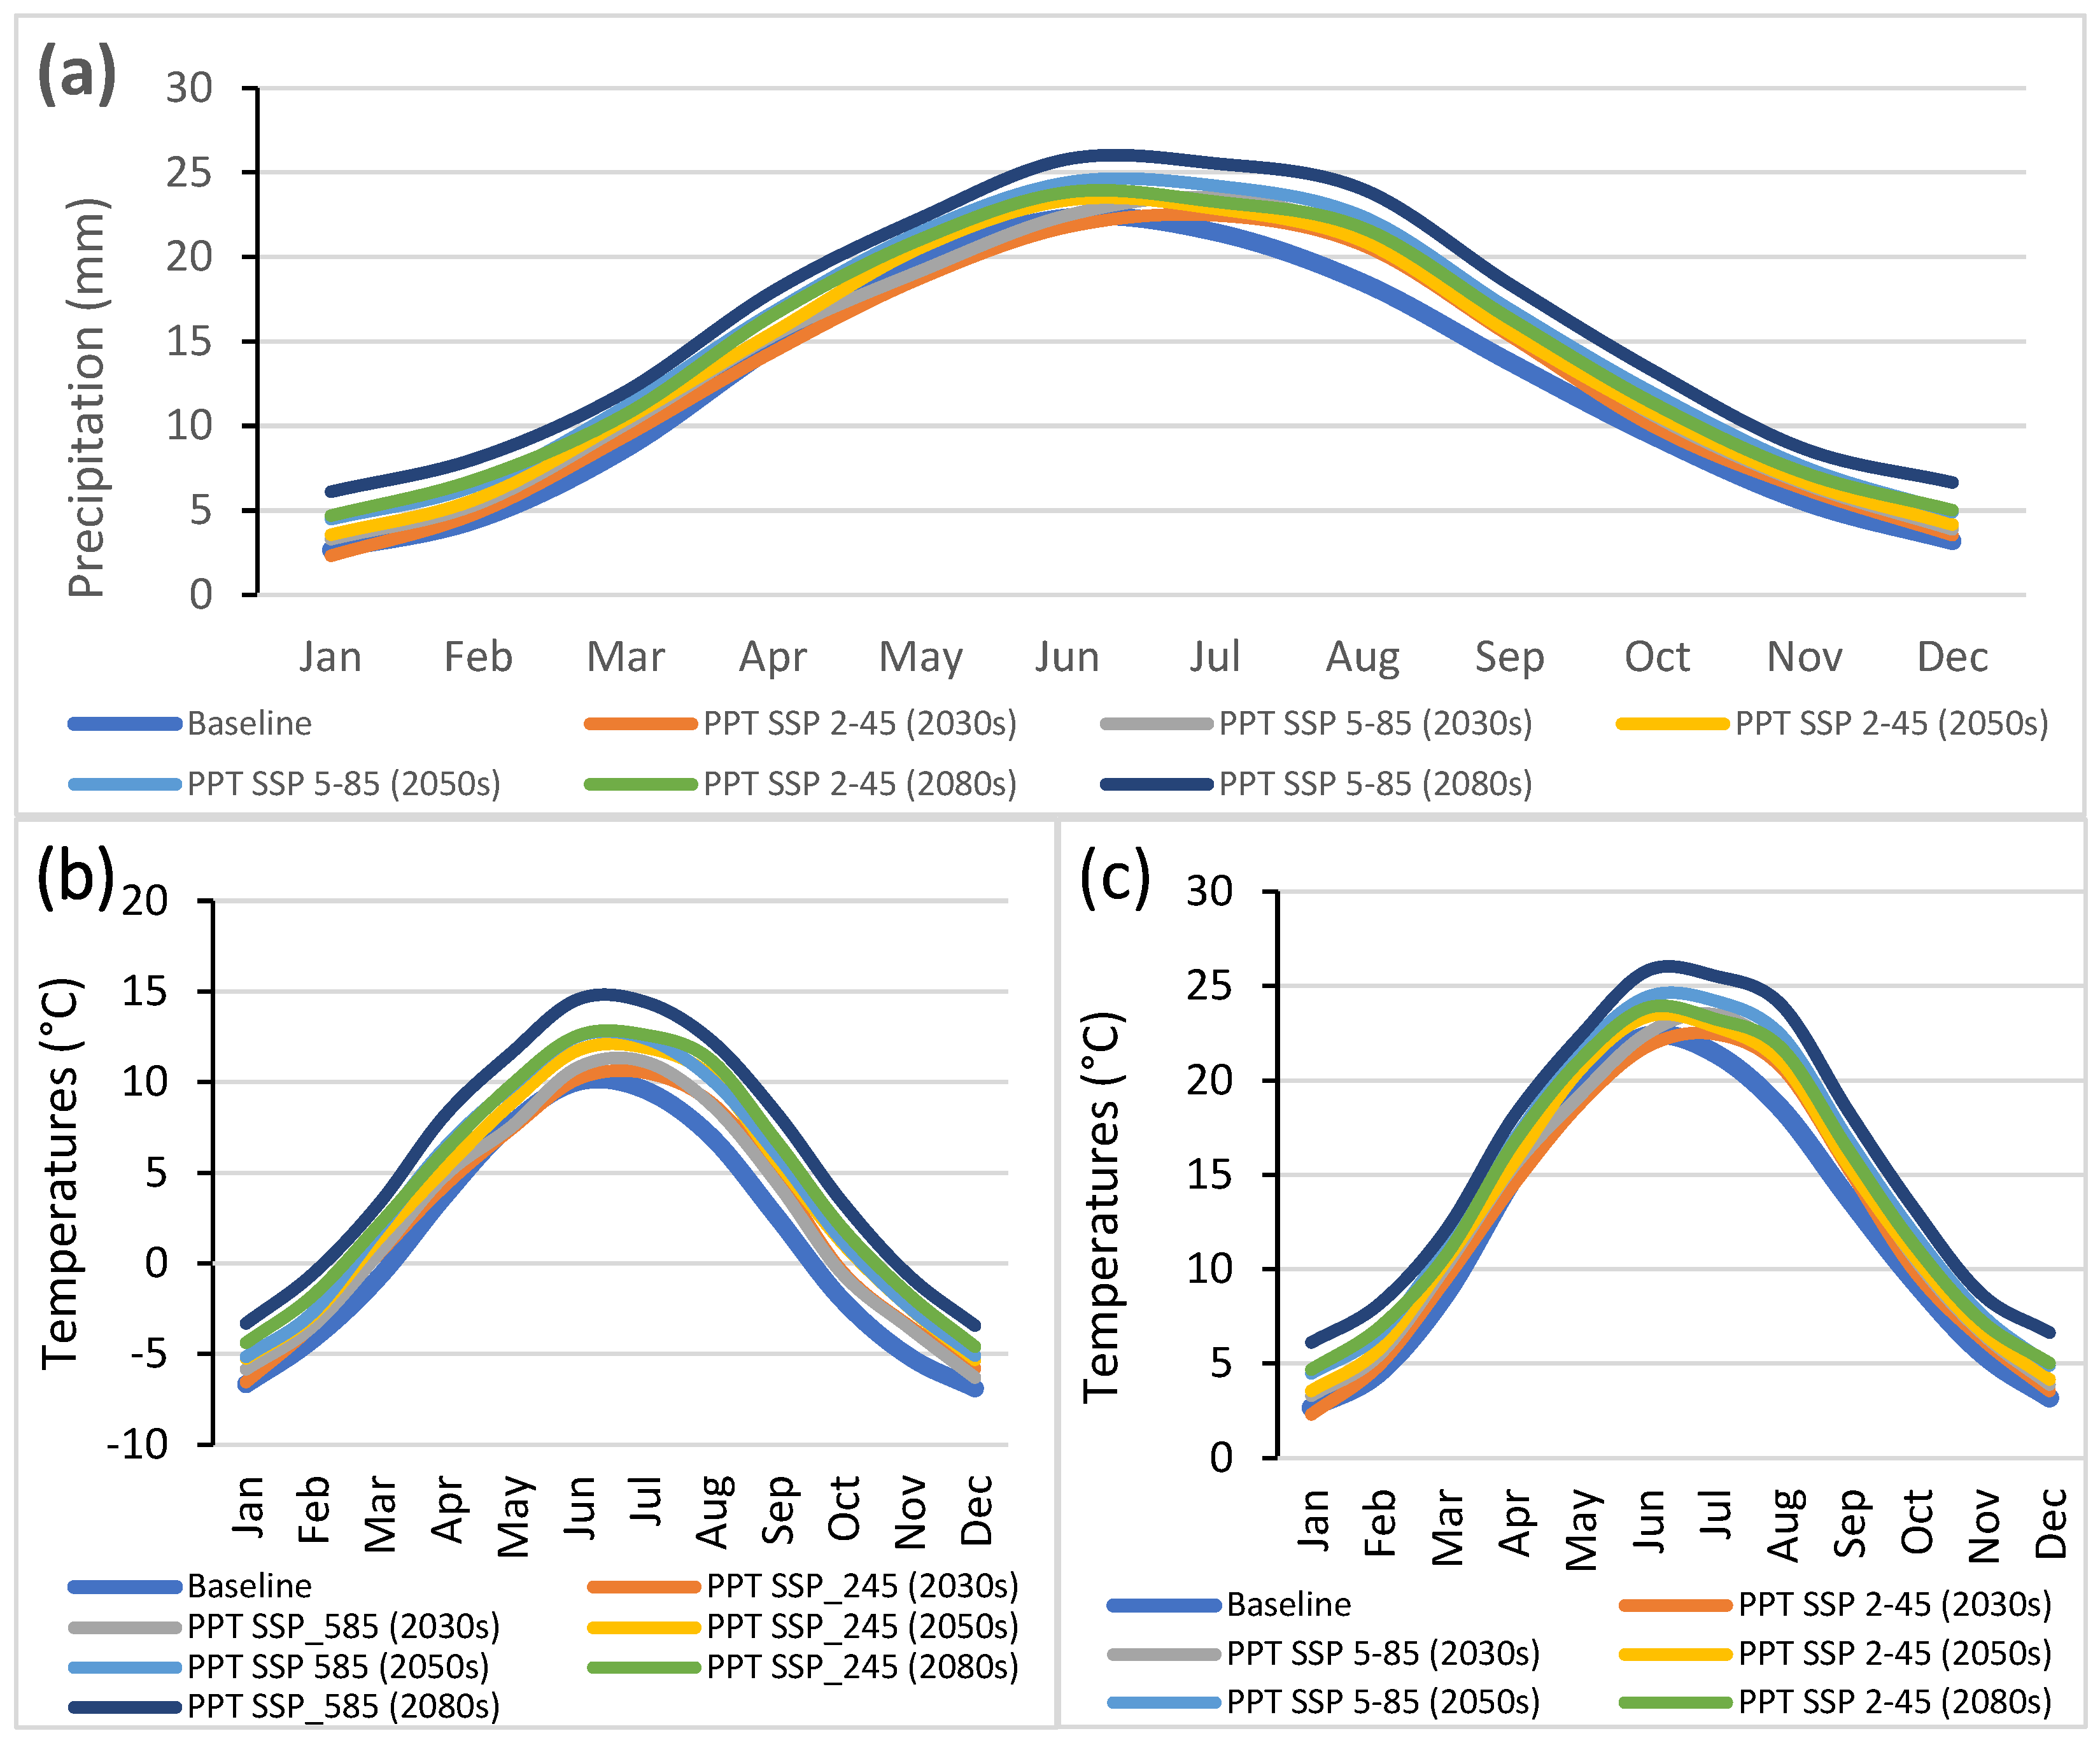
3.1. Climatic Projections

It was projected that the maximum and minimum temperatures may rise by 2.0 °C and 3.7 °C and 3.0 °C and 4.4 °C under SSP 2–45 and 5–85, respectively, in the 2080s. It was noted that the change in minimum temperature is more likely to be higher than the change in maximum temperature in all projected three time steps (2030s, 2050s, 2080s). The precipitation is more likely to be higher than the baseline, under both SSP 5–85 and 2–45, in all three time steps. It is expected that the precipitation may increase by nearly 10% and 8% under the SSP 2–45 and 5–85 scenarios, respectively, in the 2080s. The mean monthly precipitation, minimum temperature, and maximum temperature based on the three GCMs under the two SSP scenarios in the three time steps are shown in Figure 4a, 4b, and 4c, respectively. The monthly fluctuations in projected precipitation were also significant. The precipitation may be higher in the winter months, and early spring (March) may have significantly higher precipitation, while late spring (April, May) may face a decline in precipitation. The monsoon month of July may have higher precipitation, but August may face a decline. Overall, the autumn season is more likely to have more precipitation compared with the baseline.

3.2. Sensitivity, Calibration, and Validation of a Hydrological Model

Sensitivity analysis is frequently used to measure the influence of each model parameter on system behavior [50]. This section discusses the sensitivity analysis, calibration, and validation of the SWAT model. As a result, this section is separated into two parts: the first part deals with the sensitivity analysis, and the second half deals with calibrating and validating the hydrological model.

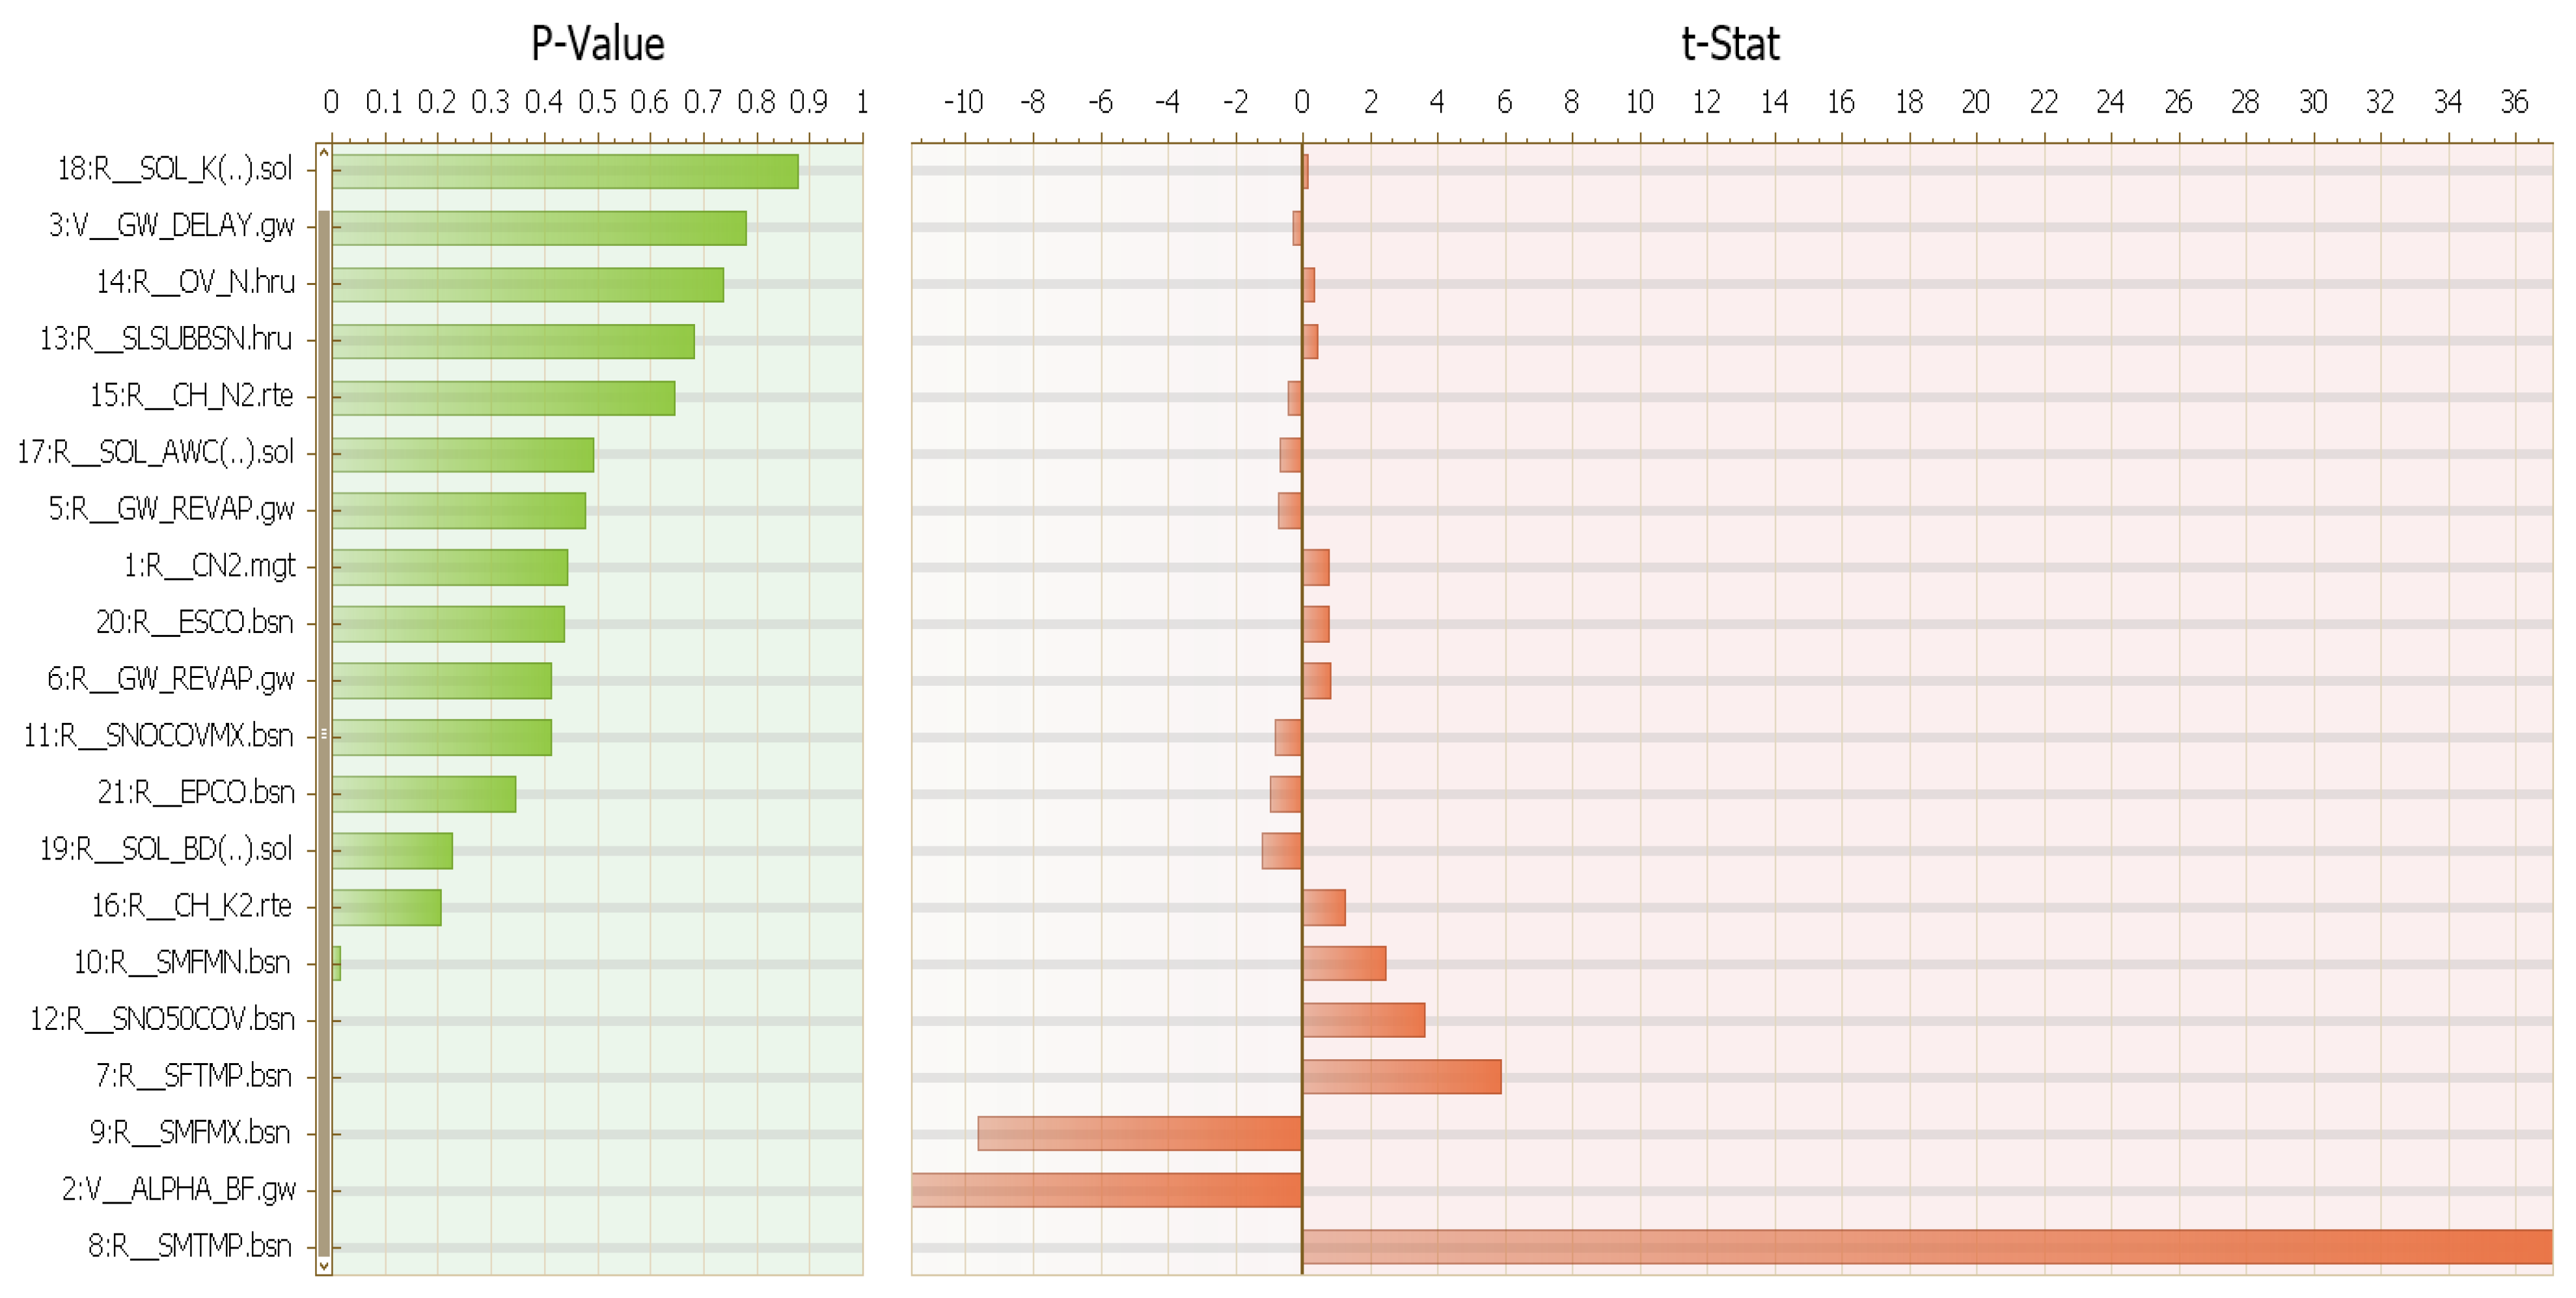
3.2.1. Sensitivity Analysis

Twenty parameters were investigated for the sensitivity analysis with the help of SWAT-CUP; out of the twenty, six were found to be relatively more influential in terms of the modeled streamflow, having a significance level of more than 90%. The top six most sensitive parameters were the following: snowmelt base temperature (SMTMP), base flow alpha factor (ALPHA_BF), maximum snowmelt rate for snow during the year (SMFMX), snowfall temperature (SFTMP), snow cover equivalent that corresponds to 50% snow cover (CNO50COV), and minimum snowmelt rate for snow during the year (SMFMN). However, the modeled streamflow was relatively less sensitive to the remaining fourteen parameters. The sensitivity rank for each parameter based on the p-value and t-test are shown in Figure 5 (the nomenclature of the parameters shown in Figure 5 is given in Table 3). The t-test provides a sensitivity measurement; the highest absolute value indicates greater sensitivity, while the p-value determines the significance of sensitivity. The most sensitive parameter has a p-value near 0 and quite a high t-value. In this study, the modeled streamflow is the most sensitive to the snowmelt base temperature (SMTMP) due to having the smallest p-value and the highest t-value. On the other hand, the modeled streamflow is the least sensitive to saturated hydraulic conductivity (SOL_K) due to having a high p-value and low t-value.

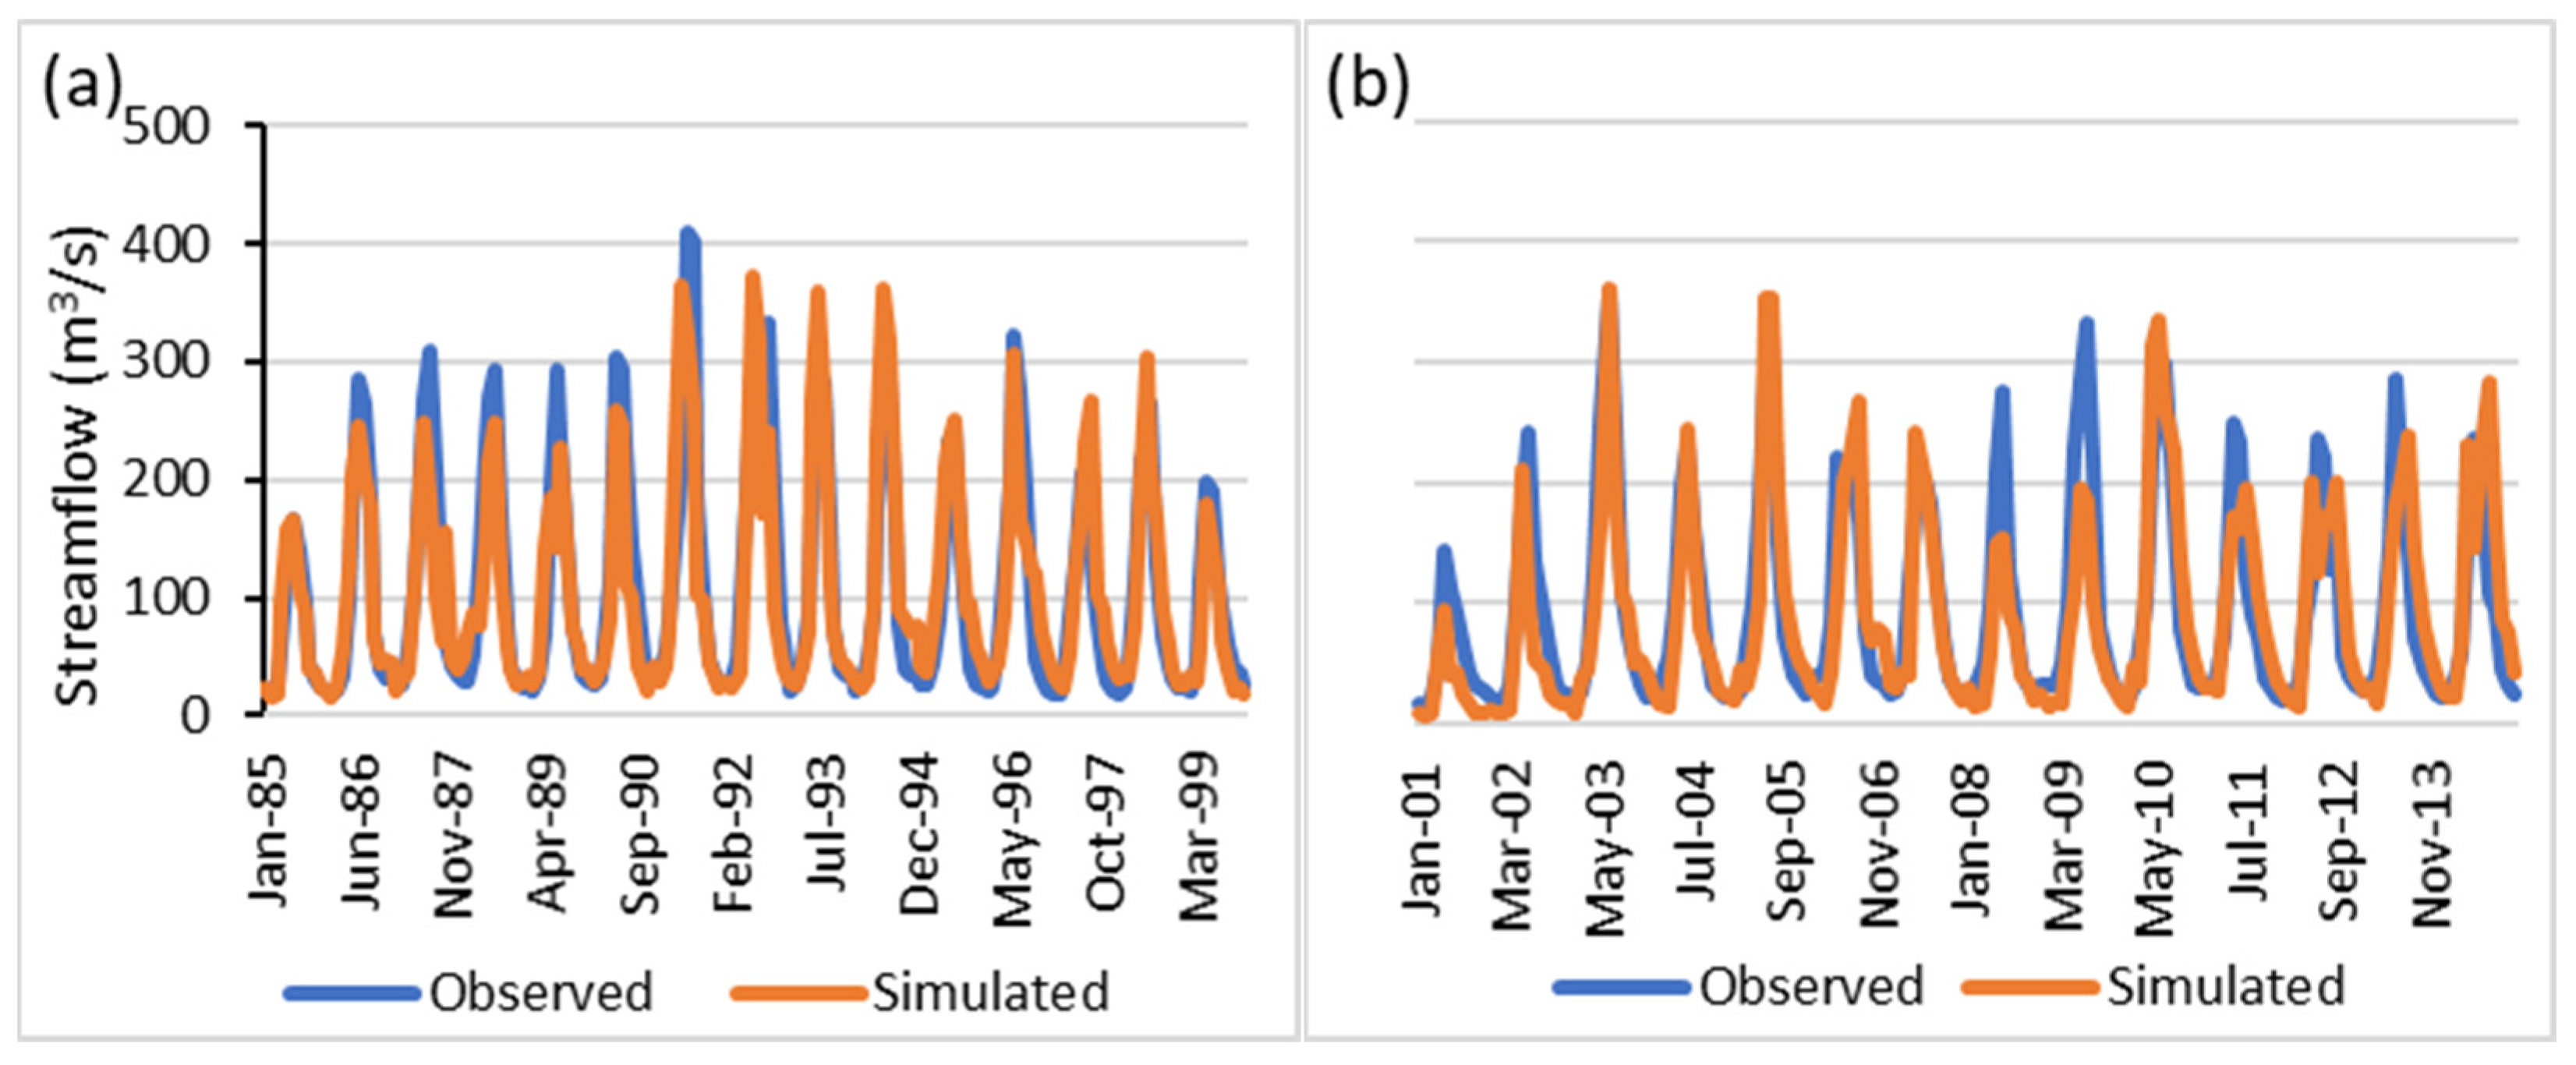
3.2.2. Calibration and Validation

The SWAT model was calibrated for the Ghari Habibullah station (Kunhar River basin) on a monthly basis from 1985 to 1999, and validation was performed from 2001 to 2014 as shown in Figure 6a and 6b, respectively. Table 4 lists the calibration parameters along with a detailed description and their optimum values. The model’s assessment parameter values (R2, NSE, and PBIAS) for the calibration and validation time period at Ghari Habibullah station were obtained using the observed and simulated discharge; their values are given in Table 5. As seen in Table 5, all the statistical parameter values fall within acceptable bounds.

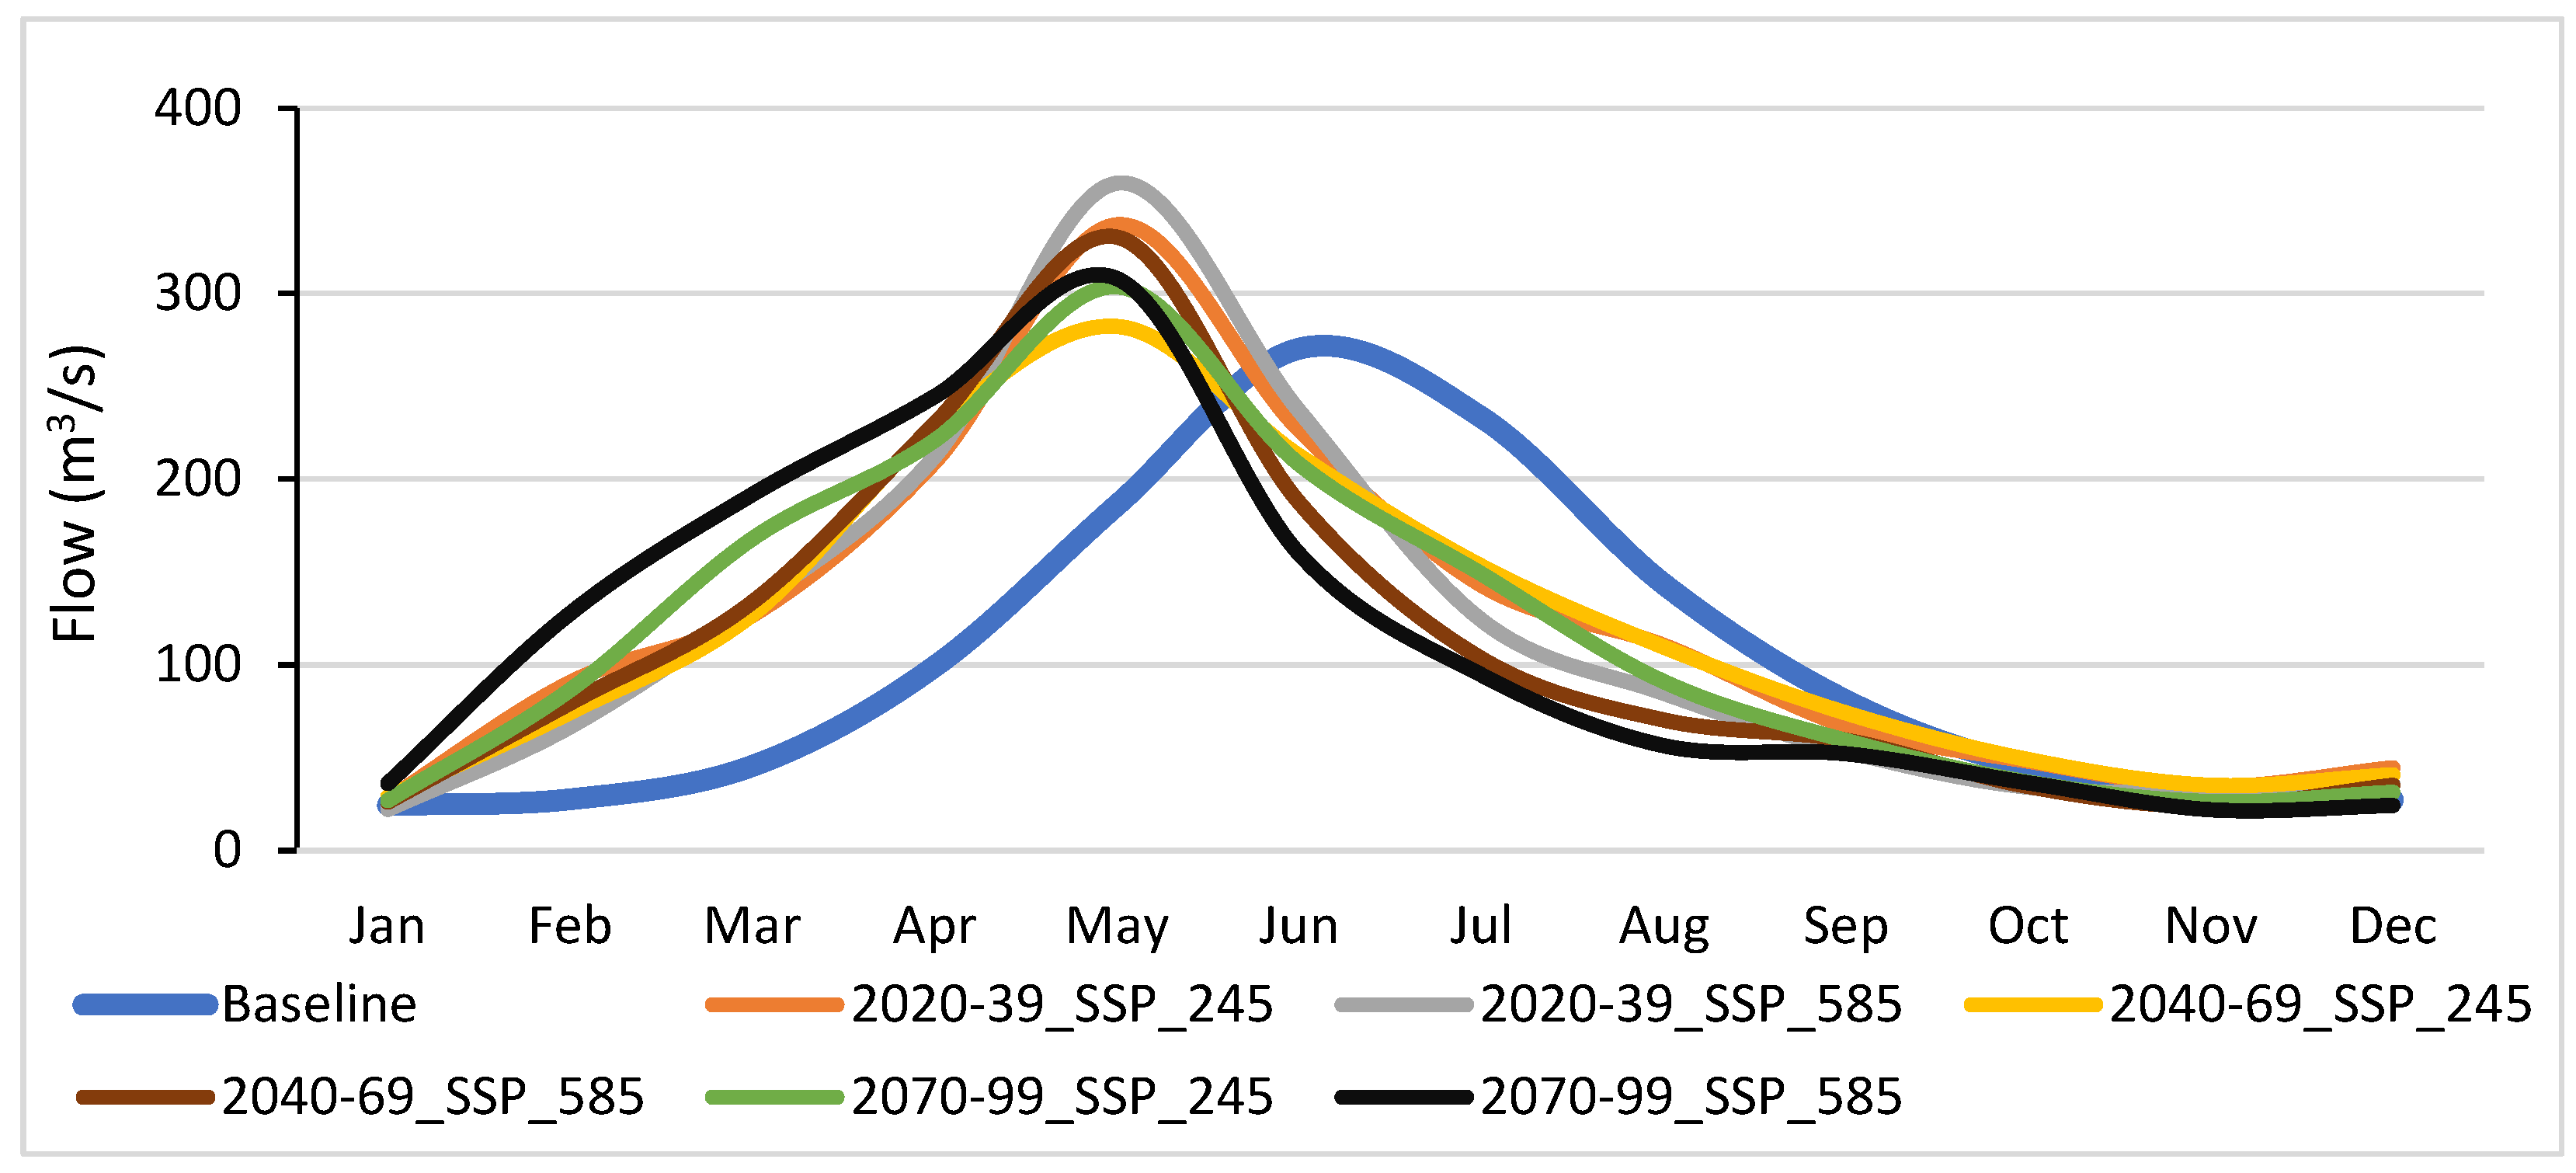
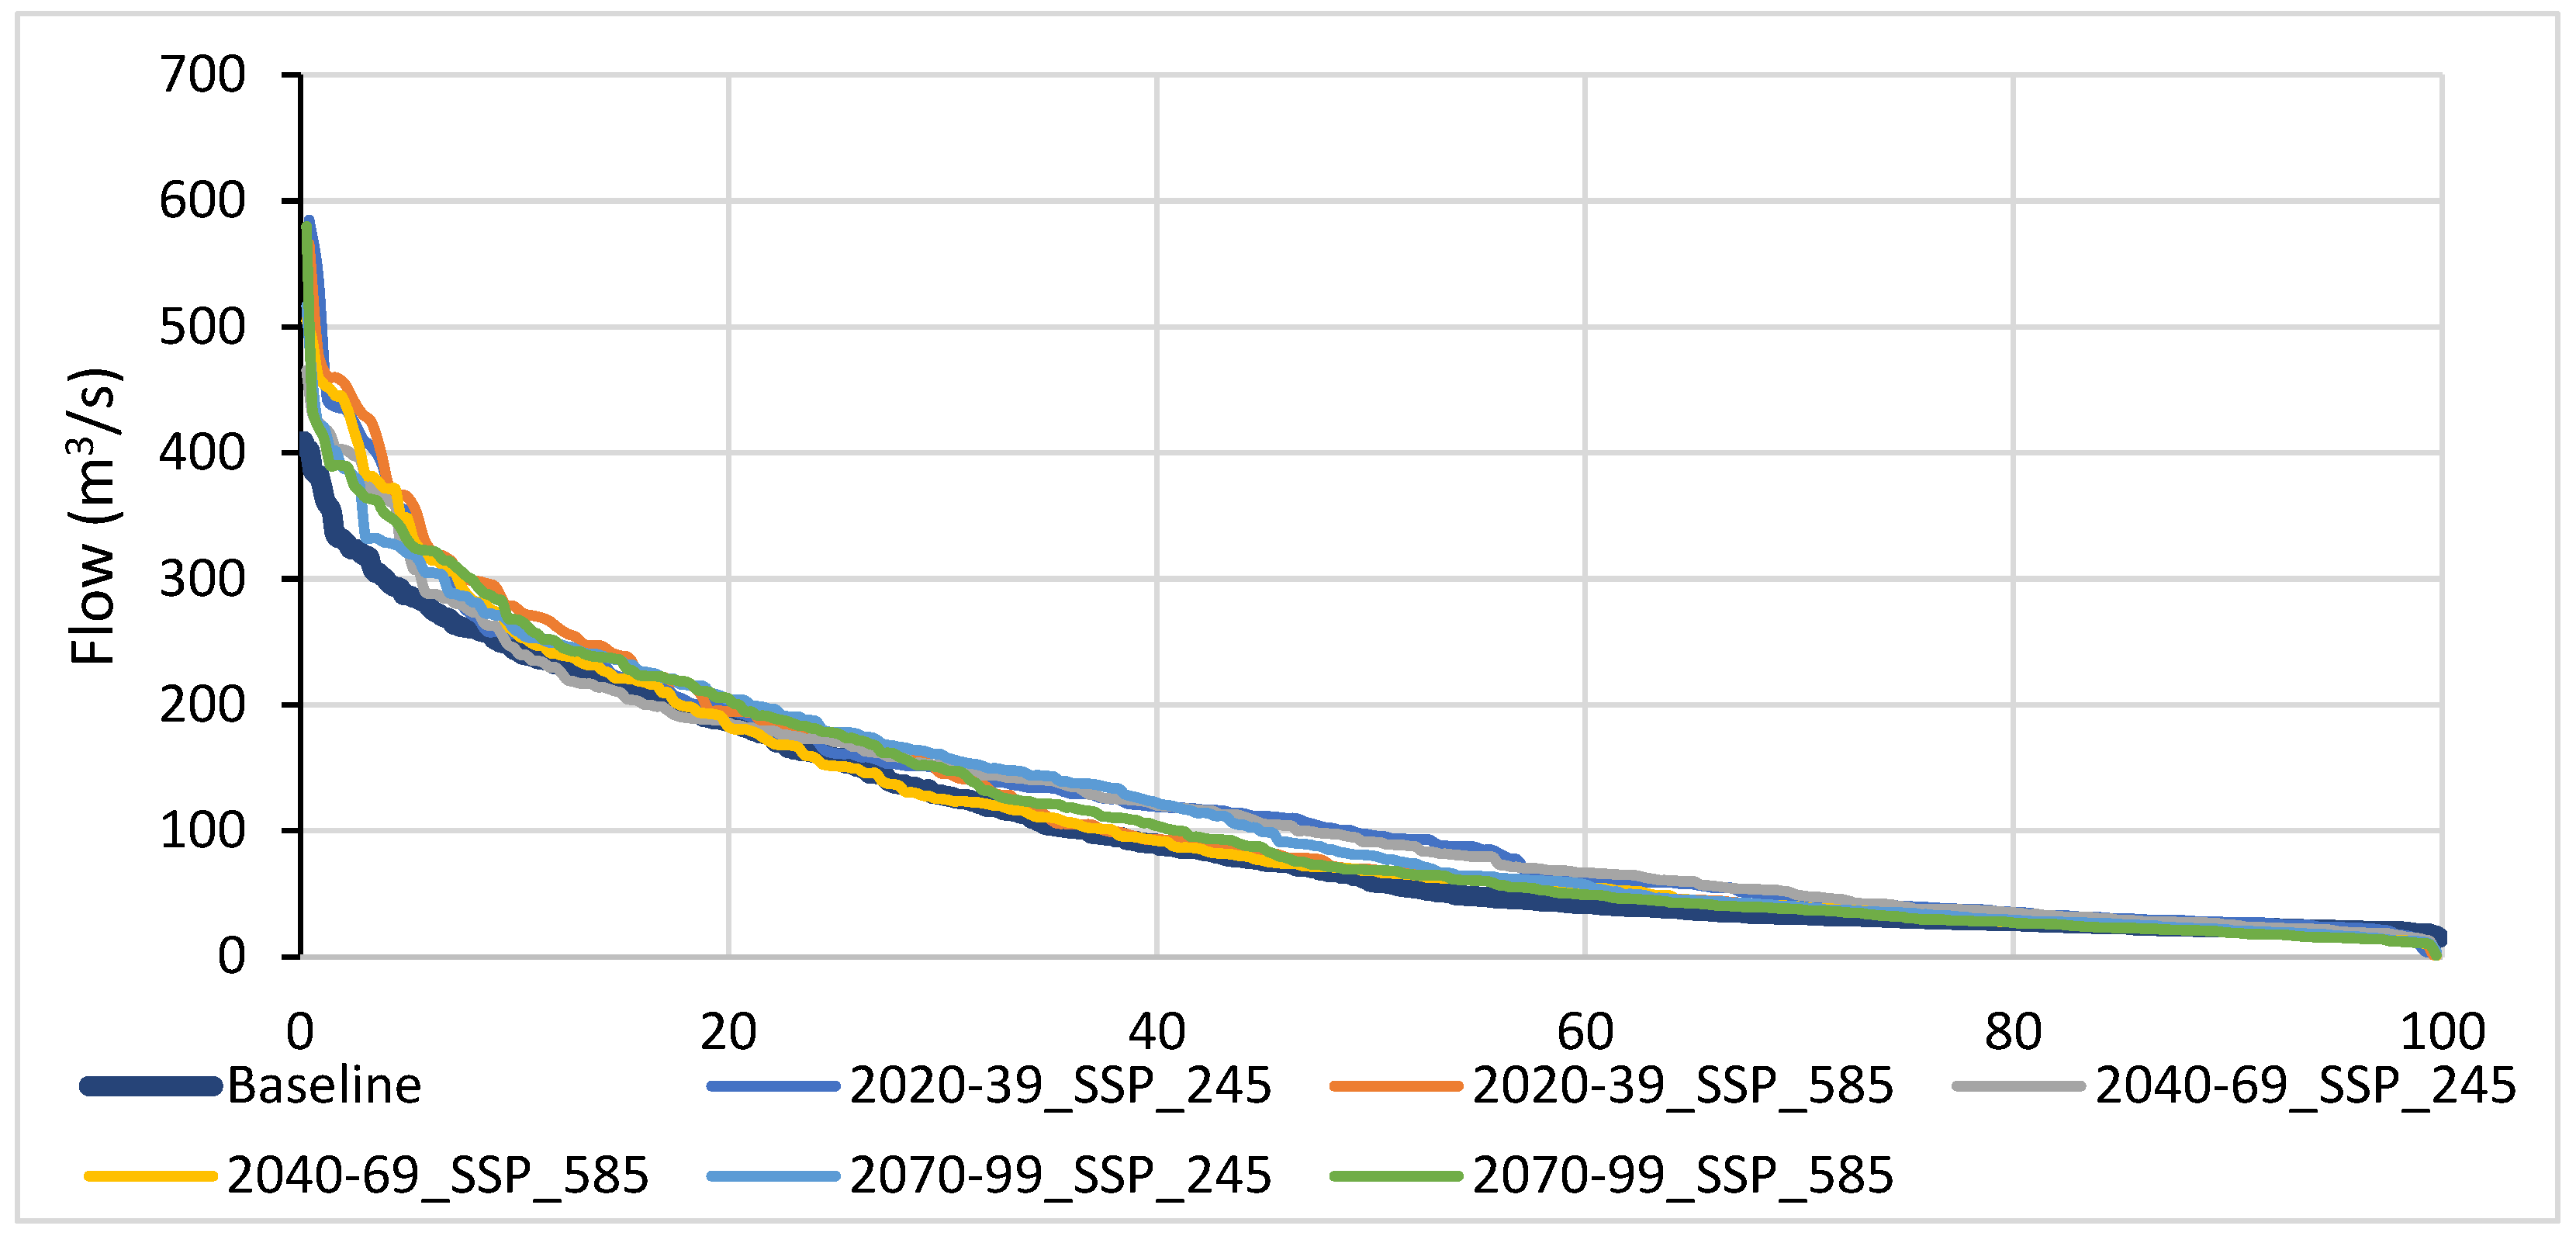
3.3. Impact of Climate Change on Runoff

The Kunhar River basin’s streamflow was predicted using the results of three GCMs for the two scenarios SSP 2–45 and SSP 5–85; the bias-corrected outcomes of these climatic models were converted into a runoff with the help of the SWAT model. The projected streamflow was divided into three classes based on the time steps of 2020–2039 (2030s), 2040–2069 (2050s), and 2070–2099 (2080s). The change in streamflow due to climate change was estimated by the percentage change in seasonal, annual, low flow (Q95), median flow (Q50), and high flow (Q5) compared with the baseline. Precipitation in the winter and spring seasons may rise dramatically in the 2030s. However, it may decrease slightly in the summer and autumn. The streamflow may follow the same pattern in the 2050s and 2080s. The peak flow may shift backward from the summer to the late spring season. In all three projected time steps, the streamflow may be higher under the SSP 5–85 scenario compared with SSP 2–45. Moreover, the Kunhar River streamflow may increase from the 2030s to the 2080s in the winter season. On the other hand, the runoff may decrease in the late summer and autumn seasons from the 2030s to the 2080s. Moreover, the projected mean annual runoff of the river is more likely to be higher in all three projected timesteps (2030s, 2050s, and 2080s) under both scenarios (SSP 2–45 and 5–85). The mean annual flow in the 2080s was projected to increase by almost 15% to 11% based on the SSP 2–45 and 5–85, respectively. The projected mean annual runoff is more likely to be higher under the SSP 2–45 scenario compared with the SSP 5–85. The baseline and projected mean monthly runoff of the Kunhar River basin are illustrated in Figure 7.
The low flow was more likely to be decreased in all three projected time steps compared with the baseline, and the decrease could be more significant under the SSP 5–85. The low flow could be decreased by 23 to 30% under SSP 2–45 and SSP scenarios 5–85, respectively, in the 2080s. However, compared with the baseline, both SSP scenarios have a higher likelihood of increasing the median and high flow, and the rise may be more pronounced under the SSP 5–85 scenario than under the SSP 2–45 scenario. The percentage change in projected seasonal and annual streamflow, low flow, median flow, and high flow compared with the baseline are given in Table 6.

3.4. Estimation of Change in Hydropower Potential

The FDC was used to estimate the change in flow that can affect the hydropower potential. FDCs for the baseline flow and the projected flow under both SSP scenarios were plotted, as shown in Figure 8. In the baseline time period, the Q30 at the Ghari Habibullah station was 128.1 m3/s, while in the 2030s, the Q30 may increase from 14 to 10% compared with the baseline under SSP 2–45 and 5–85, respectively. The change in Q30 in projected time steps with respect to the baseline also represents the change in hydropower potential. Similarly, an increase was noticed in the hydropower potential for the 2050s and 2080s under both scenarios. The details of hydropower change in each projected time step under each scenario are given in Table 7. The Kunhar River basin is rich in hydropower potential because of its steep slope and suitable river flow. Most of the hydropower sites in the Kunhar River are suitable for run-of-the-river hydropower plants. Hydropower sites (completed, under construction, and planned) in the Kunhar River basin have a combined capacity of more than 2391 MW, considering the design discharge of 30% of the available flow of the natural stream. The impact of climate change on hydropower was analyzed with the help of Q30 (design discharge).

4. Discussion

Extreme events, such as hurricanes, floods, wildfires, heatwaves, and droughts, have become more frequent and severe due to climate change. The Intergovernmental Panel on Climate Change (IPCC) has provided evidence that human-induced global warming is leading to changes in the frequency, intensity, and duration of extreme weather events. As a result of climate change, both scenarios anticipate a substantial increase in maximum and minimum temperatures as well as in precipitation levels in the projected time intervals. According to the results of this study, in the 2080s, the maximum and minimum temperatures and precipitation may increase compared with the baseline under the SSP 2–45 and SSP 5–85 scenarios. Similarly, the mean annual streamflow may also increase significantly under the SSP 2–45 and 5–85 scenarios in the 2080s. In the winter and spring, the streamflow may be much greater, and in the late summer and fall, it may be slightly lower. The significant increase in temperature means that the winter season may contract, snowfall may reduce, and the snowmelt rate is more likely to be higher compared with the baseline. The significant increase in temperatures can change snowfall into rainfall in the future, which can lead to an increase in flows in the winter and spring seasons. The sensitivity analysis also supports this hypothesis; it was found that the most sensitive parameters (five out of six) were related to the snow, and snow parameters are significantly sensitive to temperature. These changes can cause water scarcity in the downstream basins, especially in the summer season, because snow deposits may not be able to complement the streamflow in the summer season; this could be the main reason for the decline in summer flow, increase in winter and spring flow, and backward shift of the peak flow. Moreover, the increase in temperatures may cause an increase in evaporation losses and crop water requirements. The change in seasonal flow also affects the low, median, and high flows of the Kunhar River basin.
In the future, low and median flows may increase, while the high and low flows may decline. Therefore, the increase in the low and median flows may help maintain hydropower production in the winter and autumn seasons. The decrease in the high flow may be due to the lowering of the streamflow in the summer season. However, when analyzing the projected monthly streamflow, it was found that extreme events (floods) can occur frequently and with higher intensity with the passage of time. To mitigate the damages from extreme events (floods), it is recommended to construct check dams at the secondary and tertiary tributaries of the Kunhar River. Due to climate change, the overall hydropower potential of the basin may improve in the future. In the mid-future (2050s), the hydropower potential may increase in SSP 2–45 but may decrease slightly in the SSP 5–85 scenario. The projected decrease in hydropower capacity of the Kunhar River basin by 47 MW under the SSP 5–85 scenario in the 2050s could lead to a range of challenges. Energy supplies may become less reliable, and a decrease in hydropower generation could lead to concerns about energy security, especially in regions that are heavily reliant on hydropower for electricity production. This may result in the need to import energy from other sources, potentially increasing energy costs and vulnerability to supply disruptions, which can lead to price volatility in energy markets, as supply and demand dynamics change.
Considering the thirty-four hydropower plants in the Kunhar River basin, the hydropower capacity may increase by 467 to 313 MW under the SSP 2–45 and SSP 5–85 scenarios in the 2080s. In Pakistan, switching to hydropower generation per MW from fossil-fuel-based electricity generation can cut carbon dioxide emissions by over 1900 tCO2e/year [51]. In the 2080s, under the SSP 5–85 scenario, the increase in hydropower production due to climate change can reduce GHG from 0.89 MtCO2e/year, which is “a blessing in disguise”. However, the net hydropower potential may increase in the future, but the peak generation of hydropower may shift significantly from summer to spring due to the peak shift of the streamflow in the future. This thorough investigation provides crucial information that may guide decision making in the areas of energy, water resources, and climate change, especially in connection to reaching Sustainable Development Goals 13.2 (SDG 13.2), 6.6, and 7.2. [27] conducted a similar study to determine how climate change may affect the streamflow in the Kunhar River watershed. However, ref. [27] used only rainfall and temperature data for the hydrological modeling of the Kunhar River, while a major portion of precipitation is received in the form of snowfall in the autumn, winter, and spring seasons. The use of rainfall data, instead of precipitation data, can lead to the underestimation of precipitation and ultimately streamflow, especially in the winter and spring seasons. Possibly, that is why [27] could not predict the significant increase in streamflow in the winter and spring seasons. Moreover, ref. [27] used only one GCM (HadCM3) under A2 and B2 scenarios, which has a very low spatial resolution and outdated scenarios as well. However, this study mainly used climatic data from the well-reputed global database used in multiple studies [6,18] to incorporate the winter and early spring precipitation (snowfall and rainfall). Secondly, three different GCMs under scenarios (SSP 2–45 and 5–85) were used. Two different bias correction techniques were used to overcome uncertainty. Moreover, this study covers the impact of climate change on hydropower potential as well.

Policy Implications

Based on the outcomes of this study, it can be projected that there is a possibility of an increase in temperature from 3.7 to 4.4 °C depending on the scenarios. Moreover, the precipitation is also expected to increase by 8 to 10 percent compared with the baseline. This increase in temperature and precipitation due to climate change is enough to alter the entire hydrological cycle and affect the other sectors, including agriculture, water, hydropower, etc., in the Kunhar River basin. Although climate change is a global phenomenon, its damages can be minimized by taking some steps by the policy makers at the local level. One ministry (climate change) cannot tackle the entire problem. That is why there is a need for an interconnected departmental policy to cope with the severe impacts of climate change. Decision makers from the energy, water management, soil conservation, climate change, agriculture, and forest ministries and related departments should make collective and coherent policies to minimize the impact of climate change.
For example, the forest department can shape the new policy on afforestation of bare land and steep-sloped pasture lands in the Kunhar River basin, while discussing with the agriculture, water, energy, and climate change ministries as well. The agriculture ministry can play a crucial role by forming a policy to prevent agricultural land expansion in the area allocated for afforestation and at the same time provide an alternative way to provide food security, which can contribute to the achievement of the Sustainable Development Goal (SDG 2) that deals with zero hunger. In the same way, the soil conservation department can use the same policy to reduce erosion and sediment transport, which can contribute to SDG 15 (Life on Land), SDG 13 (Climate Action), and SDG 6 (Clean Water and Sanitation) [52]. Similarly, the water resources ministry should also provide some input, because this policy can also influence the groundwater recharge and surface runoff in response to land use changes, which can help to achieve target 6.6 (protect and restore water-related ecosystems, including mountains, forests, etc.) under SDG 6 (Clean Water and Sanitation). Afforestation can also support the improvement of the ecosystem in the area, which can help to achieve target 15.4 (ensure the conservation of mountain ecosystems) under SDG 15 (Life on Land). The energy ministry is one of the main ministries concerned with policy formulation due to the enormous hydropower potential in the Kunhar River basin, which may help to achieve SDG 7 (Affordable and Clean Energy).
In the Kunhar River basin, a couple of hydropower projects are under construction, but still, more than 600 MW of the potential is untapped. By making use of this untapped potential, GHG emissions can be further reduced by more than 1.14 million tons of CO2 eq. Annually, this will contribute to mitigating the climate change impacts locally and, to some extent, globally, and it can also help to attain SDG 13 (Climate Action). Almost all the potential sites are suitable for run-of-the-river hydropower plants due to the steep slope and narrow valleys in the Kunhar River basin. In the case of run-of-the-river hydropower plants, no major reservoir area is required, which makes it more environmentally friendly compared with conventional dams [53,54]. Additionally, the development of a new run-of-the-river hydropower plant in the area can also help generate jobs for the local community, which can also help attain the indicator SDG 1.1 (eradicate extreme poverty for all people everywhere) under SDG 1 (No Poverty). Moreover, the results of this study (Figure 8) also indicate that extreme events, especially floods, may occur at a higher magnitude.
Hence, it is imperative for decision makers to perform a comprehensive risk assessment regarding the influence of climate change on hydropower production and to develop a contingency strategy for handling extreme flood events. The adverse impacts of floods can substantially disrupt the processes involved in hydropower generation, spanning production, transmission, and distribution. By enhancing the operational and managerial aspects of power generation, hydroelectric facilities can not only boost their revenue from generation but also assume a substantial socio-economic role within the community [55]. Significant seasonal changes in the streamflow in the Kunhar River watershed may affect how the hydroelectric plant operates. Policies for climate change or hydropower development should be formulated after a comprehensive discussion with the ministries of agriculture, water, and forestry. Moreover, there should be more departmental stations for a more accurate representation of the hydroclimatic situation of the Kunhar River basin.

5. Conclusions

This study projected the future climate and its impacts on the streamflow and hydropower potential in the Kunhar River basin, Pakistan. Based on the findings, the main conclusions are as follows:
  • The maximum and minimum temperatures are predicted to rise by 2.0 °C and 3.0 °C under the SSP 2–45 and by 3.7 °C and 4.4 °C under the SSP 5–85 scenario in the 2080s.
  • Based on these combined outcomes of three GCMs, precipitation may increase nearly 10 to 8% under the SSP 2–45 and 5–85 scenarios, respectively, in the 2080s.
  • The average annual streamflow may increase by 15 and 11% under the SSP 2–45 and 5–85 scenarios, respectively, in the 2080s.
  • The high flow and median flow may increase by 14 and 15%, respectively, and the low flow may decline by 30% under SSP 5–85 in the 2080s.
  • Moreover, climate change can alter the hydropower potential significantly, from 24 and 16% under SSP 2–45 and SSP 5–85, respectively, in the 2080s.
  • Hydropower operators might need to adjust their reservoir management strategies to optimize energy production while accounting for changing inflow patterns.
  • In most cases, a large uncertainty is associated with the climate change projections, which is a limitation of this study.
  • It is recommended to employ several regional climate models instead of relying solely on GCMs, apply various bias correction techniques, and incorporate future land use data when simulating the hydrological model to minimize uncertainty.

Supplementary Materials

The following supporting information can be downloaded at https://www.mdpi.com/article/10.3390/world4040049/s1: Figure S1: Slope classes map of the Kunhar River basin; Figure S2: Land use map of the Kunhar River basin; Figure S3: Soil classes map of the Kunhar River basin; Table S1: Proportion of slope classes in the Kunhar River basin; Table S2: Proportion of land use classes in the Kunhar River basin; Table S3: Proportion of soil classes in the Kunhar River basin.

Author Contributions

This study was conducted by H.A., P.N., T.S. and S.H.G.; H.A. contributed to data collection, data analysis, original draft preparation, and application of the SWAT model; P.N. and T.S. contributed to conceptualization; S.H.G. contributed to supervision, writing—review and editing, and funding acquisition. All authors have read and agreed to the published version of the manuscript.

Funding

The authors would like to express their gratitude to the King Mongkut’s University of Technology Thonburi (KMUTT), the King Mongkut’s University of Technology Thonburi, Petchra Pra Jom Klao Ph.D. Research Scholarship (KMUTT–NSTDA), The Joint Graduate School of Energy and Environment (JGSEE), and the National Science and Technology Development Agency (NSTDA) of Thailand for their financial support to accomplish this study.

Institutional Review Board Statement

Not applicable.

Informed Consent Statement

Not applicable.

Data Availability Statement

The baseline climatic data was obtained from the National Centers for Environmental Prediction’s Climate Forecast System Reanalysis database through the link https://globalweather.tamu.edu/ (accessed on 7 September 2023) which is publicly available. The soil information was from the Food and Agriculture Organization of the United Nations (FAO). The Digital Elevation Model (DEM) was retrieved from the Shuttle Radar Topography Mission (SRTM). The land use data were retrieved from the European Space Agency. European Centre for Medium-Range Weather Forecasts (ECMWF) platform through the link https://cds.climate.copernicus.eu/cdsapp#!/dataset/projections-cmip6?tab=form (accessed on 7 September 2023). All these databases can be accessed freely. However, the streamflow data was obtained from the Surface Water Hydrology Project (SWHP), Pakistan, which cannot be shared due to confidentiality issue.

Acknowledgments

The authors express their gratitude to the National Centers for Environmental Prediction’s Climate Forecast System Reanalysis (CFSR) and Surface Water Hydrology Project (SWHP), Pakistan, for providing the baseline climatic data, projected climatic date, and observed hydroclimatic data, respectively.

Conflicts of Interest

The authors declare that they have no known competing financial interests or personal relationships that could have appeared to influence the work reported in this paper.

References

  1. Steffen, W.; Crutzen, P.J.; McNeill, J.R. The Anthropocene: Are humans now overwhelming the great forces of nature. Ambio 2007, 36, 614–621. [Google Scholar] [CrossRef] [PubMed]
  2. Intergovernmental Panel on Climate Change (IPCC). Climate Change Fifth Assessment Report. 2014. Available online: https://ar5-syr.ipcc.ch/topic_summary.php (accessed on 15 June 2021).
  3. Kattumuri, R. Sustaining natural resources in a changing environment: Evidence. policy and impact. Contemp. Soc. Sci. 2018, 13, 1–16. [Google Scholar] [CrossRef]
  4. Hamududu, B.; Aanund, K. Assessing Climate Change Impacts on Global Hydropower. Energy 2012, 5, 305–322. [Google Scholar]
  5. Savelsberg, J.; Moritz, S.; Ingmar, S.; Hannes, W. The Impact of Climate Change on Swiss Hydropower. Sustainability 2018, 10, 2541. [Google Scholar] [CrossRef]
  6. Babur, M.; Babel, M.S.; Shrestha, S.; Kawasaki, A.; Tripathi, N.K. Assessment of Climate Change Impact on Reservoir Inflows Using Multi Climate-Models under RCPs—The Case of Mangla Dam in Pakistan. Water 2016, 8, 389. [Google Scholar] [CrossRef]
  7. Intergovernmental Panel on Climate Change (IPCC). Climate Change Sixth Assessment Report. 2021. Available online: https://www.ipcc.ch/report/ar6/wg1/downloads/report/IPCC_AR6_WGI_SPM_final.pdf (accessed on 15 June 2021).
  8. Al-Mukhtar, M.; Dunger, V.; Merkel, B. Assessing the impacts of climate change on hydrology of the upper reach of the Spree river: Germany. Water. Resour. Manag. 2014, 28, 2731–2749. [Google Scholar] [CrossRef]
  9. Abbasa, N.; Wasimia, S.A.; Al-Ansari, N. Assessment of Climate Change Impact on Water Resources of Lesser Zab, Kurdistan, Iraq Using SWAT Model. Engineering 2016, 8, 697–715. [Google Scholar] [CrossRef]
  10. Mahmood, R.; Shaofeng, J. Assessment of Impacts of Climate Change on the Water Resources of the Transboundary Jhelum River Basin of Pakistan and India. Water 2016, 8, 246. [Google Scholar] [CrossRef]
  11. Tehrani, M.J.; Haddad, O.B.; Loáiciga, H.A. Hydropower Reservoir Management Under Climate Change: The Karoon Reservoir System. Water. Resour. Manag. 2014, 29, 749–770. [Google Scholar] [CrossRef]
  12. Liu, X.; Qiuhong, T.; Nathalie, V.; Huijuan, C. Projected impacts of climate change on hydropower potential in China. Hydrol. Earth. Syst. Sci. 2016, 20, 3343–3359. [Google Scholar] [CrossRef]
  13. Akbar, H.; Gheewala, S.H. Effect of climate change on cash crops yield in Pakistan. Arab. J. Geosci. 2020, 13, 390. [Google Scholar] [CrossRef]
  14. Pervez, M.S.; Geoffrey, M.H. Assessing the Impacts of Climate and Land Use and Land Cover Change on The Freshwater Availability in The Brahmaputra River Basin. J. Hydrol. Reg. Stud. 2015, 3, 285–311. [Google Scholar] [CrossRef]
  15. Woldesenbet, T.A.; Nadir, A.E.; Lars, R.; Jürgen, H. Catchment Response to Climate and Land Use Changes in The Upper Blue Nile Sub-Basins, Ethiopia. Sci. Total. Environ. 2018, 644, 193–206. [Google Scholar] [CrossRef]
  16. Strasser, U.; Kristian, F.; Herbert, F.; Florentin, H.; Thomas, M.; Gertraud, M.; Imran, N.; Rike, S.; Markus, S. Storylines of Combined Future Land Use and Climate Scenarios and Their Hydrological Impacts in an Alpine Catchment (Brixental/Austria). Sci. Total Environ. 2019, 657, 746–763. [Google Scholar] [CrossRef] [PubMed]
  17. Kepa, S.; Emilio, C. The Impact of Climate Change on the Generation of Hydroelectric Power—A Case Study in Southern Spain. Energies 2017, 10, 1343. [Google Scholar]
  18. Fecher, R.S.; Arthur, C.; Francis, Y.; Hartley, W.; Harald, L.; Bernard, T.; Imasiku, N.; Boaventura, C. The Vulnerability of Hydropower Production in The Zambezi River Basin to The Impacts of Climate Change and Irrigation Development. Mitig. Mitig Adapt. Strateg. 2014, 19, 721–742. [Google Scholar]
  19. Abera, F.F.; Asfaw, D.H.; Engida, A.N.; Melesse, A.M. Optimal Operation of Hydropower Reservoirs Under Climate Change: The Case of Tekeze Reservoir, Eastern Nile. Water 2018, 10, 273. [Google Scholar] [CrossRef]
  20. Chiang, J.L.; Han, C.Y.; Yie, R.C.; Ming, H.L. Potential Impact of Climate Change on Hydropower Generation in Southern Taiwan. Energy Procedia 2013, 40, 34–37. [Google Scholar] [CrossRef]
  21. OCHA. Global Climate Risk Index. 2023. Available online: https://reliefweb.int/report/pakistan/climate-crisis-pakistan-voices-ground#:~:text=According%20to%20the%20Global%20Climate,the%20years%201999%20to%202018 (accessed on 5 November 2023).
  22. Saifullah, M.; Adnan, M.; Zaman, M.; Wałęga, A.; Liu, S.; Khan, M.I.; Gagnon, A.S.; Muhammad, S. Hydrological Response of the Kunhar River Basin in Pakistan to Climate Change and Anthropogenic Impacts on Runoff Characteristics. Water 2021, 13, 3163. [Google Scholar] [CrossRef]
  23. Akbar, H.; Gheewala, S.H. Changes in the hydroclimatic trends in the Kunhar river watershed. JSEE 2020, 11, 31–41. [Google Scholar]
  24. Akbar, H.; Gheewala, S.H. Impact of Climate and Land Use Changes on flowrate in the Kunhar River Basin, Pakistan, for the Period (1992–2014). Arab. J. Geosci. 2021, 14, 707. [Google Scholar] [CrossRef]
  25. Soomro, S.; Hu, C.; Jian, S.; Wu, Q.; Boota, M.W.; Soomro, M.H.A.A. Precipitation changes and their relationships with vegetation responses during 1982–2015 in Kunhar River basin, Pakistan. Water. Supp. 2021, 21, 3657–3671. [Google Scholar] [CrossRef]
  26. Soomro, S.; Hu, C.; Boota, M.W.; Wu, Q.; Soomro, M.H.A.A.; Zhang, L. Assessment of the Climatic Variability of the Kunhar River Basin, Pakistan. Water 2021, 13, 1740. [Google Scholar] [CrossRef]
  27. Mahmood, R.; Jia, S.; Babel, M.S. Potential Impacts of Climate Change on Water Resources in the Kunhar River Basin, Pakistan. Water 2016, 8, 23. [Google Scholar] [CrossRef]
  28. Edwards, P.N. History of Climate Modeling. Clim. Chang. 2011, 2, 128–139. [Google Scholar] [CrossRef]
  29. Sanderson, B.; Knutti, R. Climate Change Projections: Characterizing Uncertainty Using Climate Models. In Encyclopedia of Sustainability Science and Technology; Meyers, R.A., Ed.; Springer: New York, NY, USA, 2012. [Google Scholar] [CrossRef]
  30. Kim, K.B.; Kwon, H.H.; Han, D. Bias correction methods for regional climate model simulations considering the distributional parametric uncertainty underlying the observations. J. Hydrol. 2015, 530, 568–579. [Google Scholar] [CrossRef]
  31. Parker, W.S. Ensemble modeling, uncertainty and robust predictions. WIREs Clim. Chang. 2013, 4, 213–223. [Google Scholar] [CrossRef]
  32. Falloon, P.; Challinor, A.; Dessai, S.; Hoang, L.; Johnson, J.; Koehler, A.K. Ensembles and uncertainty in climate change impacts. Front. Environ. Sci. 2014, 2, 33. [Google Scholar] [CrossRef]
  33. Giorgi, F. Thirty years of regional climate modeling: Where are we and where are we going next? J. Geophys. Res. Atmos. 2019, 124, 5696–5723. [Google Scholar] [CrossRef]
  34. Guo, D.; Wang, H. Comparison of a very-fine-resolution GCM with RCM dynamical downscaling in simulating climate in China. Adv. Atmos. Sci. 2016, 33, 559–570. [Google Scholar] [CrossRef]
  35. Lutz, A.F.; Droogers, P.; Immerzeel, W. Climate Change Impact and Adaptation on the Water Resources in the Amu Darya and Syr Darya River Basins; Report FutureWater: 110; FutureWater: Wageningen, The Netherlands, 2012. [Google Scholar]
  36. Carbon Brief. Explainer: How ‘Shared Socioeconomic Pathways’ Explore Future Climate Change. 2023. Available online: https://www.carbonbrief.org/explainer-how-shared-socioeconomic-pathways-explore-future-climate-change/ (accessed on 5 November 2023).
  37. Suzuki-Parker, A.; Kusaka, H.; Takayabu, I.; Dairaku, K.; Ishizaki, N.N.; Ham, S. Contributions of GCM/RCM uncertainty in ensemble dynamical downscaling for precipitation in East Asian summer monsoon season. SOLA 2018, 14, 97–104. [Google Scholar] [CrossRef]
  38. Aslam, R.A.; Shrestha, S.; Pal, I.; Ninsawat, S.; Shanmugam, M.S.; Anwar, S. Projections of Climatic Extremes in a Data Poor Transboundary River Basin of India and Pakistan. Int. J. Climatol. 2020, 40, 4992–5010. [Google Scholar] [CrossRef]
  39. Neitsch, S.L.; Arnold, J.G.; Kiniry, J.R.; Williams, J.R. Soil and Water Assessment Tool Theoretical Documentation. 2005. Available online: https://swat.tamu.edu/media/1292/SWAT2005theory.pdf (accessed on 15 June 2021).
  40. Butts, M.B.; Payne, J.T.; Kristensen, M.; Madsen, H. An evaluation of the impact of model structure on hydrological modelling uncertainty for streamflow simulation. J. Hydrol. 2004, 298, 242–266. [Google Scholar] [CrossRef]
  41. The World Bank. Environment and Natural Resources Global Practice South Asia Region, Forests for Green Pakistan: Forest Policy Note. 2018. Available online: https://openknowledge.worldbank.org/entities/publication/7bd5e4a4-173c-562f-a396-9323f5bae78b (accessed on 17 March 2021).
  42. Searcy, J.K. Flow-Duration Curves. In Water Supply Paper 1542-A; United States Government Printing Office: Washington, DC, USA, 1959. [Google Scholar] [CrossRef]
  43. Khare, D.; Patra, D.; Mondal, A.; Kundu, S. Impact of Land Use/Land Cover Change on Run-Off in The Catchment of a Hydropower Project. Appl. Water. Sci. 2017, 7, 787–800. [Google Scholar] [CrossRef]
  44. Zaidi, A.Z.; Khan, M. Identifying high potential locations for run-of-the-river hydroelectric power plants using GIS and digital elevation models. Renew. Sust. Energ. Rev. 2018, 89, 106–116. [Google Scholar] [CrossRef]
  45. PHYDO. 300 MW Balakot Hydropower Project Feasibility Study Report Executive Summary. 2013. Available online: http://pedo.pk/uploads/downloads/es_balakot1.pdf (accessed on 22 March 2021).
  46. PHYDO. Investment Opportunities Hydropower Projects of Khyber Pakhtunkhwa. 2014. Available online: http://www.kpkep.gov.pk/documents/Brochure%202014.pdf (accessed on 11 March 2021).
  47. ADB. Asian Development Bank: Environmental Impact Assessment, Patrind Hydropower Project. 2010. Available online: https://www.1927.org/sites/default/files/project-documents//44914-014-pak-eia-a.pdf (accessed on 7 November 2023).
  48. Moiz, A.; Kawasaki, A.; Koike, T.; Shrestha, M. A systematic decision support tool for robust hydropower site selection in poorly gauged basins. Appl. Energy 2018, 224, 309–321. [Google Scholar] [CrossRef]
  49. Khan, M.; Zaidi, A.Z. Run-of-River Hydropower Potential of Kunhar River, Pakistan. Pak. J. Meteorol. 2015, 12, 25–32. [Google Scholar]
  50. Wang, R.S. Ordinary Differential Equation (ODE), Model. In Encyclopedia of Systems Biology; Dubitzky, W., Wolkenhauer, O., Cho, K.H., Yokota, H., Eds.; Springer: New York, NY, USA, 2013. [Google Scholar] [CrossRef]
  51. UNFCCC. Clean Development Mechanism Project Design Document Form (CDM-PDD) Version 03. 2006. Available online: https://cdm.unfccc.int/filestorage/A/6/V/A6VL3B7IJU2N91CP8Y54HQZGWOXFT0/Patrind%20Hydropower%20Project.pdf?t=bkl8cjZ5Z2xufDD5K4WjERAsxF7P9x4Uhj2h (accessed on 15 March 2021).
  52. Yin, C.; Zhao, W.; Pereira, P. Soil conservation service underpins sustainable development goals. Glob. Ecol. Conserv. 2022, 33, e01974. [Google Scholar] [CrossRef]
  53. Helston, C.; Farris, A. Run of River Power. 2017. Available online: http://www.energybc.ca/runofriver.html (accessed on 25 March 2021).
  54. Afework, B.; Cey, E.; Goodfellow, L.; Hanania, J.; Stenhouse, K.; Donev, J. Energy Education—Run-of-the-River Hydroelectricity. 2018. Available online: https://energyeducation.ca/encyclopedia/Run-of-the-river_hydroelectricity (accessed on 24 May 2022).
  55. Shu, J.; Qu, J.J.; Motha, R.; Xu, J.C.; Dong, D.F. Impacts of climate change on hydropower development and sustainability: A review. IOP Conf. Ser. Environ. Earth. Sci. 2018, 163, 012126. [Google Scholar] [CrossRef]
Figure 1. Complete flowchart of the methodology.
World 04 00049 g001
Figure 2. Kunhar River discharge at (a) gauged and (b) ungauged sites.
World 04 00049 g002
Figure 3. Location map of Kunhar River basin with DEM and studied hydro-meteorological observations.
World 04 00049 g003
Figure 4. Baseline and combined projected monthly (a) precipitation, (b) minimum temperature, and (c) maximum temperature.
World 04 00049 g004
Figure 5. Sensitivity analysis of parameters using SWAT–CUP.
World 04 00049 g005
Figure 6. Hydrograph of simulated and observed runoff for (a) calibration and (b) validation periods at Ghari Habibullah.
World 04 00049 g006
Figure 7. The baseline and projected mean monthly runoff of the Kunhar River basin.
World 04 00049 g007
Figure 8. Flow duration curve and design discharge of Kunhar River at Ghari Habibullah.
World 04 00049 g008
Table 1. Detail of data types and their sources.
Data TypeSourcSpatial and Temporal ResolutionTime PeriodStationRetrieval Date
DEMSRTM30 × 30 m--20 January 2022
SoilFAO1 × 1 km--10 February 2022
Land useEuropean Space Agency300 × 300 m2019-15 February 2022
General circulating modelsECMWF250 × 250 km1979–2099-10 December 2022
Streamflow SWHPDaily1961–20171 station1 April 2022
TemperaturesCFSR30 × 30 km and Daily1979–20145 stations10 April 2022
SWHPDaily1979–20172 stations10 April 2022
PrecipitationCFSR30 × 30 km and Daily1979–20145 stations10 April 2022
SWHPDaily1979–20172 stations10 April 2022
Relative humidityCFSR30 × 30 km and Daily1979–20145 stations10 April 2022
Solar radiationCFSR30 × 30 km and Daily1979–20145 stations10 April 2022
Wind speedCFSR30 × 30 km and Daily1979–20145 stations10 April 2022
Table 2. Characteristics of used global climate models.
SourceGCMsInstituteResolutionScenario (SSPs)Duration
ECMWFACCESS-CM-2Australian Community Climate and Earth System Simulator Climate Model Version 2250 × 250 km2–45 & 5–852020–2099
CNRM-CM6.1Centre National de Recherches Météorologiques Coupled Model version 6.1250 × 250 km2–45 & 5–852020–2099
MRI-ESM2.0The Meteorological Research Institute Earth System Model Version 2.0250 × 250 km2–45 & 5–852020–2099
Table 3. Complete details of the hydropower sites in the Kunhar River basin.
SiteLatLongPower (MW)γ * (kN/m3)Head (m)Flow (m3/s)Area (km2)Status
134.8673.6016.979.812569.21274Planned Sites
234.7973.5230.649.814176.21403Planned Sites
334.7973.5214.249.811976.41407Planned Sites
434.7873.5218.769.812576.51408Planned Sites
534.7673.5336.619.814877.71432Planned Sites
634.7573.5240.539.815377.91435Planned Sites
734.7573.5220.669.812778.01436Planned Sites
834.7573.5214.569.811978.11438Planned Sites
934.7373.5115.809.812080.61483Planned Sites
1034.7273.5214.279.811880.81489Planned Sites
1134.7273.5714.709.811883.31533Planned Sites
1234.7073.581.749.811710.4192Planned Sites
1334.6873.5620.399.812294.51740Planned Sites
1434.6673.5339.749.814296.41776Planned Sites
1534.6673.5140.309.8140102.71891Planned Sites
1634.6673.4833.929.8133104.81930Planned Sites
1734.6673.4716.459.8116104.81930Planned Sites
1834.6573.4418.709.8118105.91950Planned Sites
1934.6373.4319.759.8119106.01952Planned Sites
2034.6373.4224.359.8122112.82078Planned Sites
2134.6273.4120.279.8118114.82114Planned Sites
2234.6273.4023.759.8121115.32123Planned Sites
2334.5973.3612.659.8111117.22158Planned Sites
2434.5773.3614.989.8113117.42163Planned Sites
2534.5573.3615.389.8113120.62221Planned Sites
2634.3373.4331.909.8124135.52495Planned Sites
2734.3373.4323.949.8118135.62497Planned Sites
Balakot HHP34.6573.44343.549.81227.4154.01952Planned Sites
Naran HPP34.9473.74223.189.8132570.0905Under
Construction
Batakundi HPP34.9273.81111.219.8121852.0702Under
Construction
Saif Ul Malook34.9173.668.529.814501.957Planned Sites
Nila da Katha HPP34.6373.5414.889.813943.965Under
Construction
Patrind Hydropower Plant34.3473.43140.289.81110130.01274Completed
Suki Kinari34.7273.54953.349.81848114.61403Under
Construction
* γ is specific weight of water.
Table 4. Parameters used for calibration of SWAT model with their ranges and fitted values at the Ghari Habibullah station.
Sr. #ParameterDescriptionRangeOptimum ValueUnit
1SFTMPSnowfall temperature−5 to 5−1.60°C
2SMTMPSnow melt base temperature−5 to 54.60°C
3SMFMXMax snowmelt rate for snow during the year0 to 102.50°C
4SMFMNMin snowmelt rate for snow during the year0 to 100.10°C
5SNOCOVMXMin snow water content that corresponds to 100% snow cover0 to 50020.00mm H2O
6SNO50COVSnow cover equivalent that corresponds to 50% snow cover0 to 10.44-
7ESCOSoil evaporation compensation factor0 to 10.55-
8EPCOPlant uptake consumption factor0 to 11.00-
9CN2Initial SCS runoff curve no. for moisture condition II35 to 9878.00-
10APHA_BFBase flow alpha factor0 to 10.11day
11GW_DELAYGroundwater delay0 to 50086.00day
12GWQMNThreshold depth of water in shallow aquifer required for the return flow to occur0 to 5000900.00mm
13GW_REVAPGroundwater “revap” coefficient0.02 to 0.20.075-
14REVAPMNThreshold depth of water in the shallow aquifer for “revap” to occur0 to 500450.00mm
15SLSUBBSNAverage slope length10 to 15061.38m
16OV_NManning’s “n” value for overland flow0.01 to 300.13-
17CH_N2Manning’s “n” value for the main channel0 to 30.30-
18CH_K2Effective hydraulic conductivity in main channel alluvium0 to 5006.10mm/h
19SOL_AWCAvailable water capacity of the soil layer0 to 10.21mm H2O/mm soil
20SOL_KSaturated hydraulic conductivity0 to 200014.80mm/h
Table 5. Statistical indicator ranges that are suitable for the calibration period.
Sr. #Statistical IndicatorsAcceptable RangesCalibrationValidation
1Coefficient of determination (R2)>0.50.7690.710
2Nash–Sutcliffe efficiency (NSE)>0.50.7410.662
3Percent bias (PBIAS)−15% < PBIAS < +15%−3.076−6.142
Table 6. Change in the projected seasonal, annual, low, median, and high flow compared with the baseline.
TimestepScenariosAnnualWinterSpringSummerAutumnQ95Q50Q5
Change in Streamflow (%)
2030s2020–39_SSP_2–4520.1104.9103.3−25.8−5.79.762.818.2
2020–39_SSP_5–8514.157.1112.5−31.2−24.9−15.616.625.3
2050s2040–69_SSP_2–4515.981.492.5−26.5−0.3−3.553.310.0
2040–69_SSP_5–857.677.4109.7−44.2−25.9−25.014.818.5
2080s2070–99_SSP_2–4515.482.7109.2−30.8−22.8−22.335.111.4
2070–99_SSP_5–8510.9136.9124.8−52.0−30.4−29.915.614.4
Table 7. Change in hydropower potential in the Kunhar River basin.
TimestepScenarioQ30 (m3/s)Change in Hydropower Potential (%)
1961–2017Baseline128.1-
2030sSSP 2–45146.5514.40
SSP 5–85141.4010.38
2050sSSP 2–45150.5517.53
SSP 5–85124.95−2.46
2080sSSP 2–45159.2524.32
SSP 5–85149.0016.32
Disclaimer/Publisher’s Note: The statements, opinions and data contained in all publications are solely those of the individual author(s) and contributor(s) and not of MDPI and/or the editor(s). MDPI and/or the editor(s) disclaim responsibility for any injury to people or property resulting from any ideas, methods, instructions or products referred to in the content.

