1. Introduction
The role that natural resources play in economic growth has been debated in the economics literature for decades. One argument suggests that economies that specialize in natural resource extraction and export experience comparatively low rates of economic growth. Several reasons are provided to support what has been frequently called a curse associated with natural resource production and export. First, natural resource extraction processes consume economic resources that could otherwise be allocated to industries thought to better promote long-term economic growth, such as manufacturing or professional services [
1]. Second, natural resource prices vary over time, which can destabilize exporting economies [
2]. Third, the concentrated locations of many natural resource supplies facilitate rent capture by governments interested more in retaining political power than facilitating economic growth [
3].
A second argument, often relying on basic neoclassical economic theory, suggests that natural resources increase economic growth. In the short run, the revenue earned from the domestic or international sale of natural resources contributes directly to gross domestic product (GDP). Over time, the rents gained from natural resource production can be invested in human or physical capital and thus help promote long-term economic growth. In the very long run, if the rents from natural resources enrich a broad group of diverse resource owners rather than a single regime, then this diverse group can exert pressure on governments to adopt institutions favorable to economic growth such as democracy, respect for and protection of private property, and the establishment of an impartial system of justice [
4].
Perhaps because both of these arguments can be persuasive, the debate over whether natural resource production helps or hinders economic growth turned to the empirical data. The anecdotal evidence by itself is unconvincing. Comparing resource-rich growth losers such as Nigeria, Zambia, Sierra Leone, Angola, and Venezuela with resource-poor growth winners such as Japan, Korea, Taiwan, Hong Kong, and Singapore seems to support the notion of a natural resource curse. But resource-rich growth winners such as the United States, Canada, and Australia can also be compared to dozens of resource-poor growth losers across Africa and Asia to draw a different conclusion. Resource-rich Norway was one of Europe’s poorest countries in 1900 but is now one of its richest and may have relied on its natural resources to facilitate this transition. However, resource-rich Nigeria’s economy has been hampered by its reliance on oil exports. Thus, anecdotal referencing brings us no closer to understanding the core relationship between natural resources and economic prosperity.
Reliable gross domestic product (GDP) data for a large cross-section of countries became available starting in about 1970. In a series of papers, Sachs and Warner [
5,
6,
7] (collectively referred to throughout this paper as S&W) make use of this data to estimate the empirical relationship between natural resource exports and subsequent economic growth. The results suggest a negative relationship—natural resource exports dampen economic growth. Or, as S&W suggest, “one of the surprising features of modern economic growth is that economies abundant in natural resources have tended to grow slower than economies without substantial natural resources”. S&W estimate that, controlling for other variables, a one standard deviation change in the ratio of primary exports to GDP leads to a 1% annual decrease in the subsequent averaged 20-year GDP growth rate. Instead of growing at, say, 3% over the subsequent 20-year period, an identical country with those natural resource exports will grow at a rate of only 2%. These seminal papers were collectively cited over 6000 times by 2012 [
8]. The results of the paper were also replicated by [
8]. The results of the paper were also replicated by [
9], who confirmed the major findings.
A plethora of empirical papers—reviewed below—followed S&W. Ref. [
10] reviewed this early literature and concluded that the empirical evidence collectively supports the notion of a natural resource curse. However, after Van der Ploeg, several empirical papers made use of the most recent data, included better control variables, and developed econometric models that better control for omitted variable bias. This more recent literature is essentially unified in its findings that natural resources indeed promote economic growth rather than hinder it. Yet a comprehensive literature review by [
11] reaffirmed the existence of a natural resource curse despite this recent evidence from these “contrarian studies”.
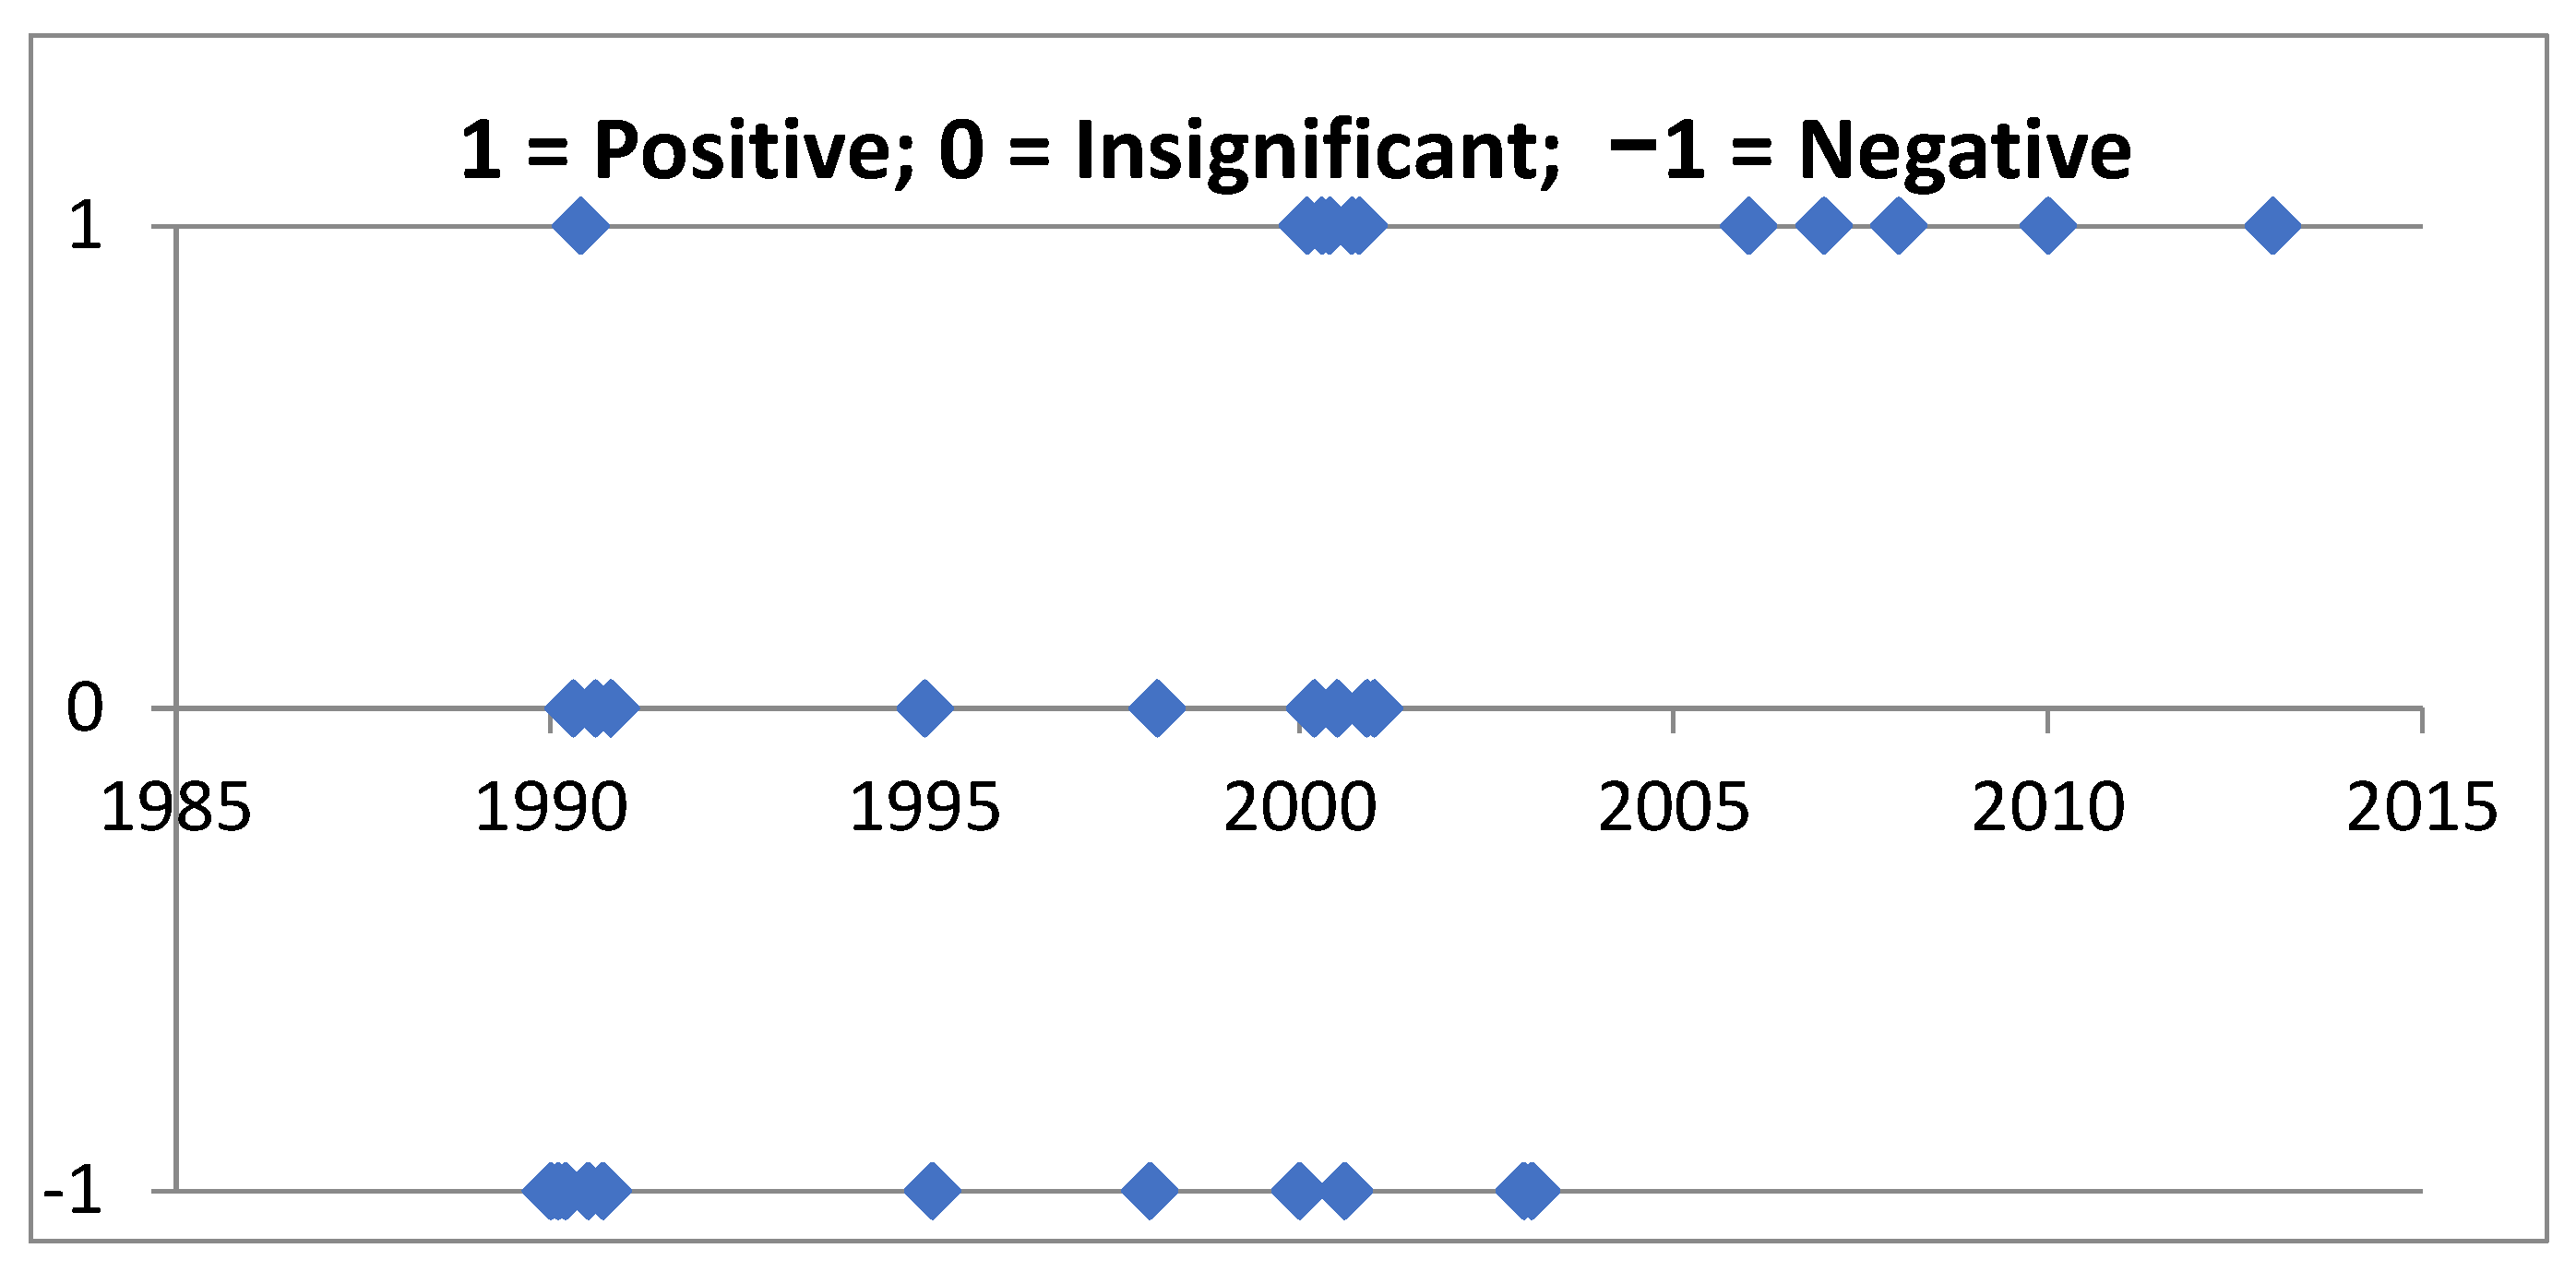
Figure 1 summarizes several empirical results from the literature (listed in
Appendix A and better described below). The empirical results estimated in each paper found natural resources to either contribute to economic growth (which is coded simply as 1), have no significant impact on GDP growth (coded as 0), or deter economic growth (coded as −1). The horizontal axis in
Figure 1 measures the final year of the panel data frame used in each paper. The S&W papers, for example, utilize a panel data set from 1970 to 1990 and are thus coded as 1990 in
Figure 1 with a −1.
The pattern observed suggests a positive correlation between the mere passage of time and the estimated coefficient on natural resource exports in the vast literature. For example, nine papers analyzed GDP data over a time span that ended in 1990. Five of these papers estimated a resource curse, three papers found an insignificant coefficient on natural resources, and only one paper estimated that resources increase GDP. However, all five papers using panels ending after 2005 estimated a positive coefficient on natural resources. Note that none of these papers identified the data timeframe itself as important to their results.
How should we interpret this apparent time-based phenomenon? One explanation, espoused by the most recent literature, is that improved econometric modeling over time may have allowed economists to estimate without bias the relationship between natural resource exports and economic growth. The empirical evidence originally supporting a natural resource curse may have been unconvincing if the estimation relied upon econometric models that produce biased coefficient estimates.
This is all fine, but a second explanation could also explain that pattern. Perhaps the underlying relationship between natural resource exports and economic growth structurally changed over the past several decades. If a natural resource curse originally existed in the 1970s and 1980s, then the economic and political institutions that contributed to that curse may have abated over the past few decades. The current body of literature, as a whole, is ill equipped to address this question because (1) time is not held constant across the literature—each new author tends to utilize the most recent data in their own estimation—and (2) the econometric model is not held constant across the literature—each new author utilizes new variables or new econometric methods in their estimation. Again, these papers differ in many important ways. However, the mere passage of time may also be responsible for changes in the relationship between nature resources and economic performance, and none of the papers seems cognizant of this possibility.
To better isolate the role that the passage of time, and only the passage of time, has played on the relationship between natural resources and economic growth, this paper resurrects the original S&W model and its original sample of countries—as imperfect as they may be—to estimate the role of natural resource exports repeatedly over time. The results suggest that the coefficient on natural resource dependence steadily increases with time from a value that was negative and significant to a value that becomes positive and significant. The original S&W model and its sample of countries estimated again with recent data concurs with the recent literature by estimating a positive relationship between natural resources and economic growth. Thus, it appears that the nature of the relationship between natural resources and economic growth may have changed over the past several decades. If so, then it may be important to understand why.
2. Specifics of the Resource Curse Literature
As mentioned above, the first paper to make use of a cross-section sample of countries to estimate the effect of natural resources on economic growth was Sachs and Warner [
5,
6,
7]. The data were used to estimate the following model, which deserves some attention.
GDPit denotes country i’s gross domestic product in period t. Thus, the dependent variable is the natural log of country i’s ratio of GDP in year t + 20 to its GDP in year t. This ratio represents the total growth rate between year t and t + 20. The important independent variable in the model is the ratio of country i’s exports of primary resources to its GDP in year t and only in year t. This specification is essentially allowing for 20 separate lagged effects on GDP from a single year’s natural resource exports. The coefficient represents the total of these 20 lagged effects. A negative implies that the export of these natural resources reduces 20-year GDP growth.
Control variables include each country’s capital investment expenditures (as a portion of GDP), each country’s reliance on international trade (imports plus exports as a portion of GDP), and an index of each country’s institutional quality. Instead of a single value from year t, each of these three variables is defined as the 20-year average commencing in period t, , for k = 3, 4, and 5. The model’s final control variable is the level of GDP in year t, a control variable included in many long-run growth models. Including the initial level of GDP controls for the possibility that low-GDP countries may grow at different rates than high-GDP countries. The expected sign on is negative, suggesting that low-GDP countries grow faster than high-GDP countries—growth rates converge over time. Controlling for initial GDP also holds constant the denominator of other control variables and especially the natural resource exports. Holding GDP constant is important. Otherwise, if high-GDP countries consume rather than export their own natural resources, then the estimate of would be biased.
To summarize, the model is designed to estimate the difference in 20-year GDP growth rates among countries with the same initial GDP, the same 20-year average of physical capital investment, the same 20-year average level of trade openness, and the same 20-year average of institutional quality but with different initial ratios of natural resource exports to GDP. Sachs and Warner estimate that, controlling for these variables, a one standard deviation change in the ratio of primary exports to GDP leads to a 1% annual decrease in the averaged 20-year GDP growth rate. Instead of growing at, say, a rate of 3% over a 20-year period, an identical country with those extra natural resources will grow at a rate of only 2%.
This econometric specification raised several questions in the subsequent literature. Some papers argued that the level of some future value of GDP should replace the average growth rate as the dependent variable [
12]. Others questioned how to best measure natural resource dependency. Natural resource exports have been replaced by natural resource abundance [
13] and the stock of natural resources [
14,
15,
16,
17]. Papers have also questioned dividing any measure of natural resources by GDP when GDP is the dependent variable in the model. Dividing instead by the population is used as a substitute [
18]. The literature has also questioned the assumption that institutional quality and GDP are exogenous and used various methods to control for possible endogeneity. Finally, the papers vary with respect to the scope of the data set. Whereas many use data from all nations, others use data from just Africa [
19], just the Middle East [
20], or just China [
21]. A number of papers focus on the role of natural resources on economic outcomes in just developing countries, including [
22,
23,
24,
25,
26].
One group of papers uses the S&W data to better understand the reason for the curse, a question left unanswered by S&W. Ref. [
27] replaces S&W’s “Rule of Law” with a corruption index and then disaggregates the natural resource variable into four categories and finds that only food exports generate a resource curse. Commodity price variation is found to reduce GDP but only for Africa. Ref. [
14] redefines resources as share of natural capital in national wealth and adds several human capital variables. Ref. [
14] finds that a 10% increase in natural capital share reduces GDP growth by 1%—partly due to its effect on how resources affect the availability of public education. The model does not control for institutional quality. Ref. [
28] uses the S&W data and redefine resources as a share of natural capital in national wealth (World Bank) to find that the curse disappears for all resources except land area.
Another set of papers focuses on the role of political and economic institutions in determining economic growth. Institutions that promote shared governance and respect for individual property rights and equality under the law are considered important to long-run growth. The political science literature [
29] suggests that natural resources may compromise political institutions through rent seeking. Ref. [
4] suggests that institutions are the only significant predictor of growth. Other variables, including natural resources, are insignificant once institutions, which may be endogenous, are controlled for. Ref. [
30] also finds that only institutions, and not natural resources, matter to economic growth. Ref. [
15] redefines resources as the share of resource rents in GDP. The natural resource curse exists only if resource rents are consumed by governments rather than invested. Ref. [
31] considers forms of human welfare other than GDP and finds that the resource curse operates via its negative impact on institutional quality. Once institutional quality and initial GDP are controlled for, the natural curse disappears. Ref. [
17] finds that natural resources increase GDP unless the population of the country is ethnically fractionalized. Ref. [
32] uses S&W data to estimate a positive coefficient on an interaction term comprised of institutional quality and natural resources. The negative effect of natural resources subsides as institutional quality improves. Ref. [
33] uses the S&W data and interact resources with institutional quality, and estimated a positive coefficient—essentially confirming [
32] but with heterogeneous resource categories. Ref. [
34] also interacts natural resources with institutional quality. Countries with poor institutions do not enjoy the positive effect of natural resources on GDP. Ref. [
20] uses a time-varying cointegration approach to estimate that institutional quality reduces the unfavorable effect of oil reserves on GDP.
A number of papers in the literature redefine natural resources as a stock variable rather than a flow variable. Ref. [
16] utilizes S&W data but replaces the export share of GDP with the share of natural capital in national wealth and add human capital. Resource exports become insignificant and natural capital is estimated to be positive and significant. Ref. [
18] also redefines resources as the share of natural capital in national wealth to find that small non-resource sectors of the economy are responsible for slow growth. Once the size of the non-resource sector is controlled for, the natural resource curse dissipates. Ref. [
18] also finds that replacing exports per USD of GDP with exports per person causes the coefficient on natural resources to become insignificant (both for exports and for natural capital endowment). Ref. [
13] distinguishes natural resource abundance (stock) and natural resource dependence (export flow). Both are considered endogenous to the model. Resource dependence is found to be insignificant and resource abundance is estimated to be positive and significant. Ref. [
35] responds directly to [
13] and finds that natural resources have no impact (positive or negative) on GDP. Ref. [
36] estimates that stocks of natural resources reduce institutional quality but not economic growth. Export flows do not affect institutions (when controlling for stocks) but do impact growth. Ref. [
12] develops instruments for 1970 GDP to find that oil and minerals enhance economic growth and are neutral towards institutional quality. Ref. [
37] utilizes a heterogeneous panel data approach and find that oil production and oil rents improve GDP, whereas oil reserves are neutral. A simple OLS model with cross-section data estimates a resource curse when not controlling for institutional quality. Ref. [
38] redefines resources as the share of natural capital in national wealth (using World Bank data) and use instruments for institutional quality and openness to estimate that both resource stocks and resource exports reduce GDP growth. Finally, [
39] estimates that major resource discoveries increase GDP by 40% in the long run. This increase is greater for non-OECD countries than for OECD countries. To summarize, of all of the more recent papers reviewed above, only [
38] finds evidence of a natural resource curse for broad categories of natural resources. Ref. [
40] distinguishes between GDP growth and GDP levels. Using panel data from just the United States, natural resource abundance is estimated to decrease growth rates but increase income levels.
However, none of these papers recognizes the role of time in the results. Early papers tend to estimate a resource curse. Latter papers tend to find that resources improve the economy. Has this entire literature overlooked something simple regarding the mere passage of time?
3. The Data and Model
Any single econometric model can be applied to data panels over time to isolate the passage of time on the estimated coefficient on natural resource exports. The original S&W model is chosen for this task for a few reasons. First, the S&W model is widely cited, making it widely known to researchers in the field. Second, the data demands of the S&W model are modest, which allows for the estimation to take place in the early years, when data were less available. The S&W model is once again given here, with all variables defined above.
Regarding the original S&W sample, there were 182 sovereign countries in 1970. The S&W data set initially includes 95 of these countries, but that number falls to 59 countries when all variables are included in the model. One question never posed by the literature devoted to advancing the S&W results is whether or not these 59 countries represented a random sample of all 182 countries in 1970. Countries not included in the original sample of 59 countries include Bahrain, Kuwait, Qatar, Saudi Arabia, and the United Arab Emirates—countries that are known to export large quantities of natural resources. Many African countries are also excluded. One concern is that although all wealthy countries may have had the administrative resources necessary to collect and provide data on primary exports in 1970, resource-rich income-poor countries may have been more likely than resource-poor income-poor countries to report resource export quantities to data agencies. Resource-poor income-poor countries may therefore be systematically underrepresented in the sample.
One way to expand the sample is to rely on a different data source. S&W obtain primary export data from the World Bank, which gathers data from exporting countries. A second data source reporting exports of primary natural resources is available from the Center for International Data (CID) and housed by the economics department at the University of California, Davis. This data set includes the same SITC categories as those in the World Bank data. However, instead of relying on countries to report their exports, the CID relies on data submitted by importing countries, who report the origination of each import. Thus, total exports from a non-reporting country are identified by the culmination of all countries that import from that country. The number of countries in the 1970 sample increases from 59 to 87 using the CID data. Iran, Iraq, the United Arab Emirates, and several African countries are included. The results from both data sources are provided below.
The model is estimated with both the original 1970 S&W sample and the larger 1970 sample based on the CID data. All variables are defined in
Table 1, and summary statistics are provided in
Table 2 (for the 1970 sample). Data on GDP, population, capital investments, and total exports and imports are obtained from the United Nations Comtrade Database. Adding total exports to total imports and then dividing by GDP provides a measure of trade openness. Institutional quality is obtained from the Heritage Foundation Freedom index. This index is based on factors such as the protection of private property, freedom from corruption, and equality before the law. Each country’s institutions are indexed each year, but unfortunately the number of countries indexed in 1970 is just 98 (see
Table 2).
The average annual growth rate of GDP in the sample for the 1970 to 1989 period is 31%, or 1.19% per year. Capital expenditures comprise 22% of GDP on average, and a country’s imports plus exports constitute an average of 48% of GDP. The institutional quality index, which varies between 27.4 and 88.6, averages 58.5 among the 98 countries indexed in 1970.
The results from estimating the econometric model above are reported in
Table 3. Column 1 reflects the best effort to replicate the results in S&W. For this estimation, only the 59 countries in the original S&W data set are included. Natural resource exports (UNsxp) are estimated to have a negative and significant effect on the average 20-year growth rate of GDP (1970–1989). A one standard deviation increase in the rate of natural resource export is estimated to decrease economic growth by 17.91% over a 20-year period, or about 1.16% per year—a little larger than S&W’s estimate of about 1%. Note that the sources of some of the control variables differ from those used by S&W because the larger goal is to regress the model in subsequent years and not just 1970. Thus, the S&W results are not perfectly duplicated. The other control variables have the expected signs. GDP decreases subsequent 20-year growth—countries with low levels of GDP in 1970 grew faster than countries with high levels of GDP.
The model is then estimated with the same sample of 59 countries but using the CID data rather than the UN data. These results are reported in column 2 of
Table 3. The results are nearly identical, although the estimated coefficient on CIDsxp is closer to zero than for UNsxp. The difference between these estimated coefficients is not statistically significant. Switching from UN data to CID data appears to make only a modest difference when the sample is held constant.
The model is then estimated a third time with the CID data from 1970 but with all available observations. The sample size increases to 86 observations. The results are reported in column 3 of
Table 3. The estimated coefficient on natural resources is once again negative and significant but is roughly half the magnitude of the that estimated in column 1 of
Table 3. Based on this coefficient, annual GDP growth is estimated to decrease by 1.12% if the ratio of natural resource exports to GDP increases by one standard deviation.
To further explore the effect that sample size might have on the estimated coefficients, the institutional quality (IQ) variable is dropped from the model. Due to the lack of data on institutional quality, its presence constrains the sample size when using the CID data. The model results portrayed in column 4 of
Table 3 utilize the original sample of 59 countries but without the IQ variable. The estimated coefficients on the remaining variables change only marginally (compare column 4 with column 2). Dropping the IQ variable does not appear to introduce omitted variable bias to the other estimated coefficients. Therefore, the final column of
Table 3 provides model estimates from once again dropping the IQ variable but utilizing all available data. The sample size sharply increases to 130 countries. The results are rather surprising. The coefficient on natural resources remains negative but is now statistically insignificant. The original S&W model run on a larger sample of countries in 1970 generates no statistically significant estimate of a natural resource curse.
To conclude this section, the estimated coefficient on natural resource exports estimated by S&W appears robust to modest increases in the sample size. However, the resource curse appears to vanish as the sample size increases to 130 countries. Although this process is in no way sufficient to prove that the original sample of 59 countries used by S&W was not random or that the sample of 130 countries used here is random, the results do suggest that sample size appears to matter. Ideally, data on natural resource imports would be available for all countries. Such data increasingly become available with the passage of time (t > 1970). The next section of this paper reports these findings.
4. Updating Results through Time
Twenty-year data sets are available to estimate the model for initial periods beginning in 1970 (using data through to 1989) to 1994 (with data extending to 2013). Estimated coefficients for the model with initial data in 1994 are reported in
Table 4. The results portrayed in column 1 are based on the same original sample of countries used by S&W and reported in column 1 of
Table 3. Seven countries included in the original 1970 S&W data set did not report export data in 1994, and thus the sample size is reduced to 52. The results suggest that for t = 1994, the estimated coefficient on natural resource exports for these 52 countries is no longer negative and no longer significant. Using S&W’s small sample, the resource curse disappears over time. Column 2 of
Table 2 portrays the results when all 104 countries that reported export data to the UN in 1994 are included. For this sample, the estimated coefficient on natural resources is positive and significant. Exporting natural resources is estimated to improve growth rates when holding other variables constant. Finally, the UNsxp variable is replaced by the CIDsxp variable in column 3, allowing the sample size to increase to 153 countries. The coefficient on natural resource exports with the full sample of 153 countries is once again positive and significant. A one standard deviation increase (the standard deviation of this variable in 1994 is 0.109) in the ratio of natural resource exports to GDP increases annual GDP by 1.20% when compared to a similar economy without natural resources. These results affirm the notion that sample size is crucial to the estimates.
However, more importantly, it appears that the effect on GDP of exporting natural resources changed rather substantially over these years. Resource exports in 1970 may have dampened the 1970–1989 average growth of GDP. However, by 1994, resource exports improved 1994–2013 GDP growth rates for most samples considered—especially the large samples considered.
What happened between 1970 and 1994? The model was run 25 separate times, once for each year, starting with t = 1970 and ending with t = 1994.
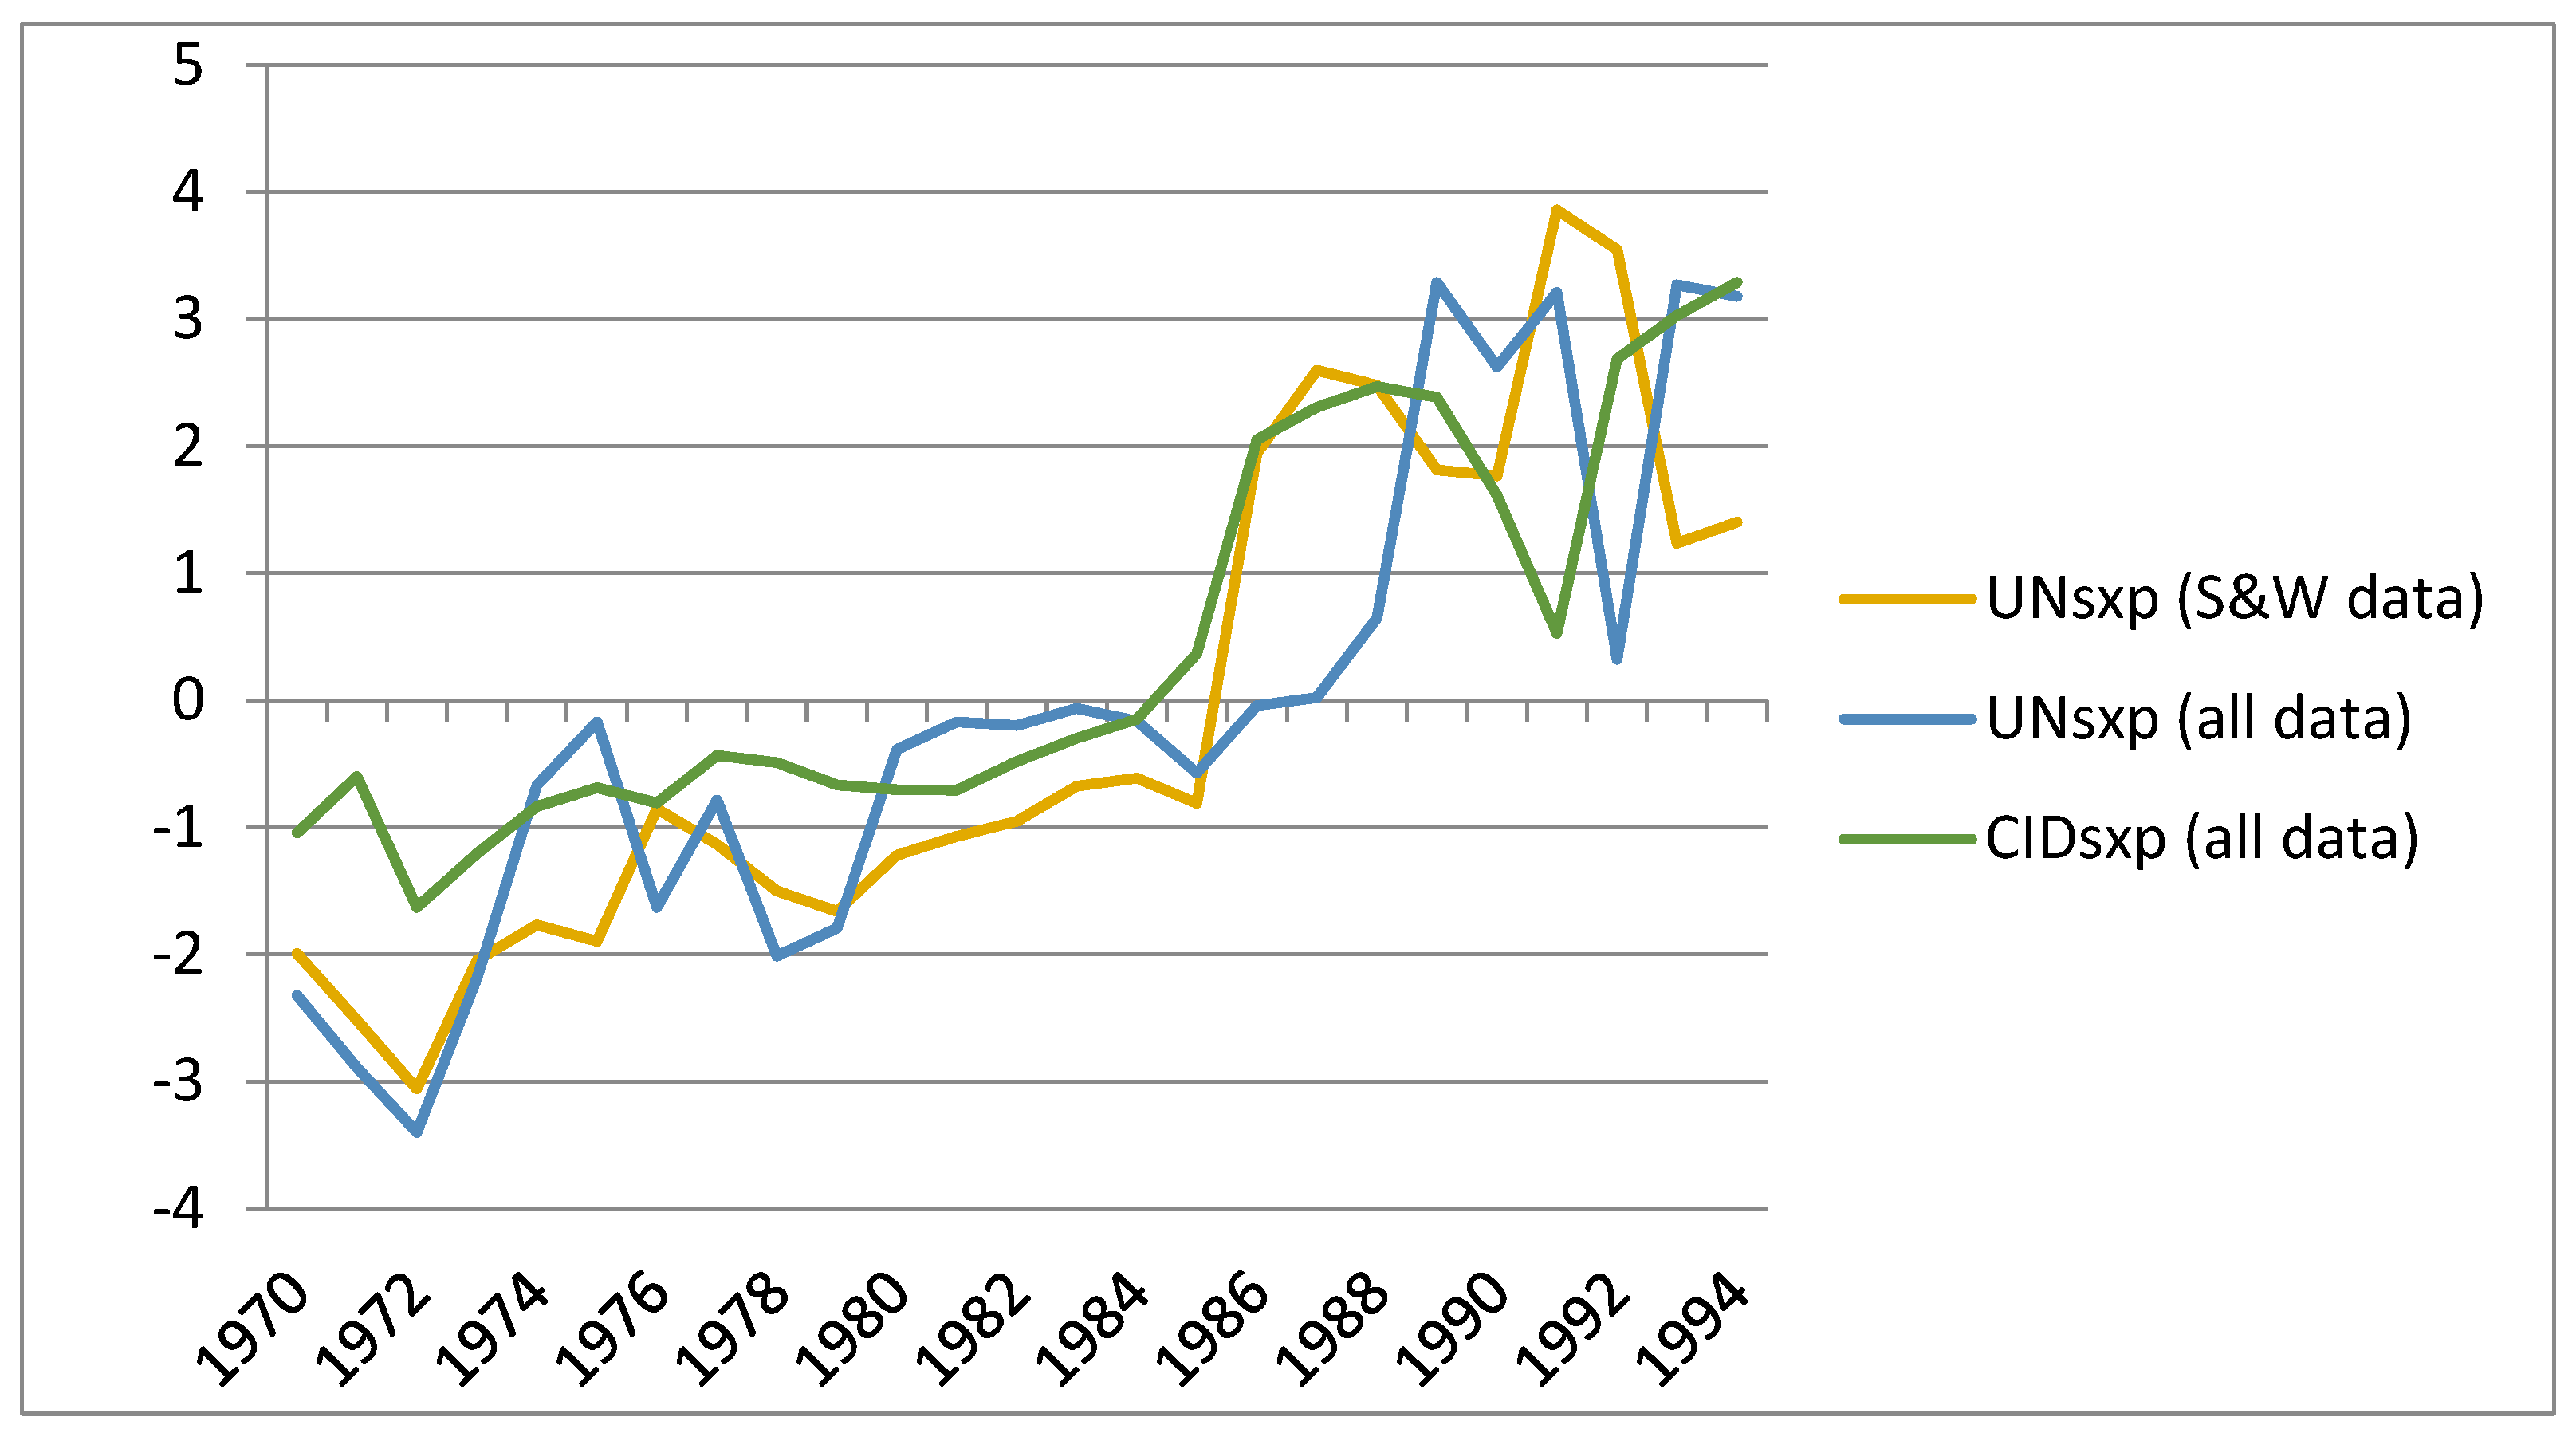
Figure 2 illustrates the value of the estimate coefficient on natural resources for each year for each of the three models represented in
Table 4. The first line, consistent with the first column of
Table 4, only considers the 59 or so countries that originally appeared in the 1970 S&W sample and utilizes the UNsxp variable to represent natural resource exports. The other two lines are consistent with the models in columns 2 and 3 of
Table 4. The sample sizes were unconstrained each year, and the number of countries in the sample steadily grew as the data allowed.
All three lines in
Figure 2 illustrate a positive trend in the estimated relationship between natural resources and subsequent economic growth. Regardless of which sample is considered, a clear upward trend is evident when mapping the estimated coefficient over time. Apparently, whichever economic or political factors once resulted in a curse from natural resource exports in 1970 have since subsided. Using just the SW data, the last year for which a negative and statistically significant coefficient is estimated is 1986. For the full data set, a natural resource curse is last estimated in 1979. These results suggest that something has fundamentally changed the relationship between natural resource exports and economic growth rates over the time frame of these data.
5. Discussions
The natural resource curse seems to have disappeared in the mid-1980s. What could be the reasons for this phenomenon? This paper is not designed to definitively answer that question, but possible reasons are listed in this section. First, [
9] and [
41] find that the natural resource sector within countries has been decreasing relative to the overall economy. Gradual growth in non-resource sectors of the economy as other industries emerge can mask any curse associated with natural resource production and export.
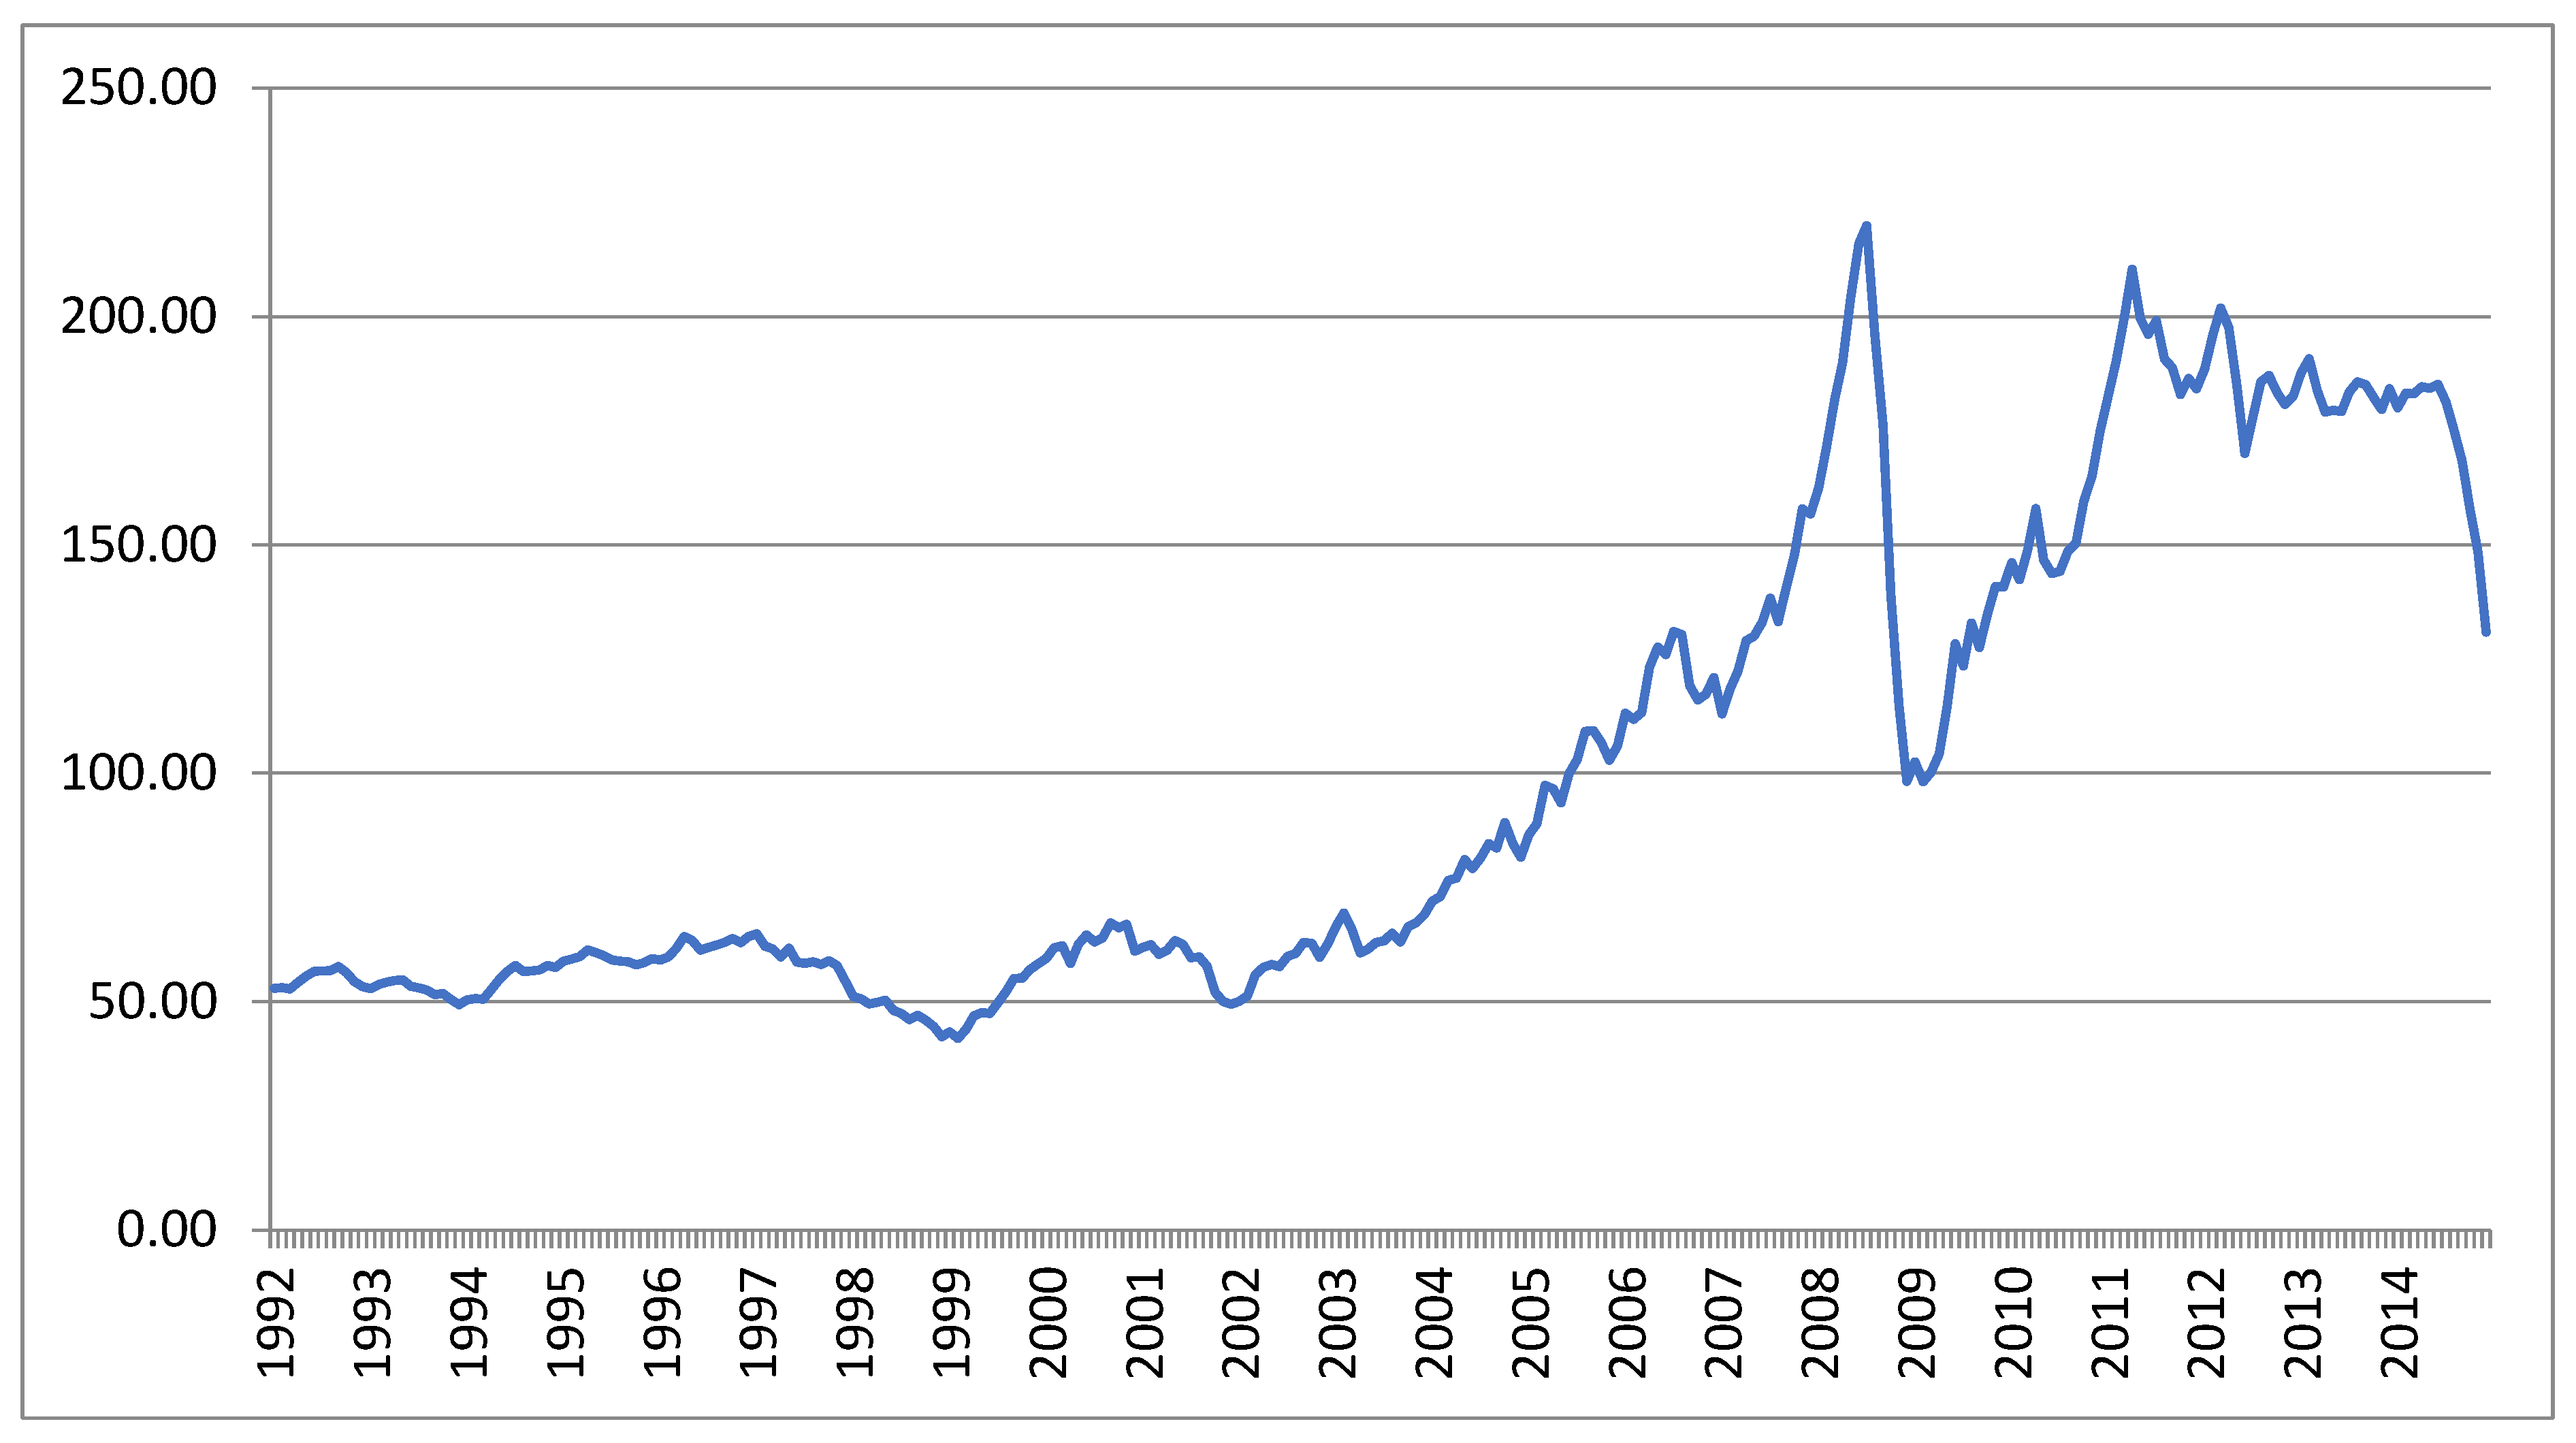
Second, perhaps global prices of natural resources have increased over the past several decades, bringing economic prosperity to the countries exporting natural resources.
Figure 3 illustrates a composite price index of natural resources (both fuel and non-fuel resources) between 1992 and 2014 from the International Monetary Fund. Commodity prices appear to have increased beginning in about the year 2000 and especially after 2005 following several prior years of apparent stability. If these price rises increased the GDP of resource-exporting countries, then the 20-year average growth of GDP (the dependent variable in all estimations above) would slowly begin to rise beginning in about
t = 1980 and continue to rise each year. This explanation appears to fit the data, but further analysis is required before formally linking changes in the effect of natural resources on GDP to changes in global resource prices. If resource prices indeed drive the relationship between natural resource exports, then nothing unusual is happening here—price increases can be expected to generate wealth for all suppliers regardless of whether the product is a natural resource or any other good or service. Price decreases will diminish GDP for the same reason. Any country that devotes a substantial portion of their economic resources to natural resource production, or to the single production of any other good or service, is most susceptible to price changes for the usual reasons.
However, it is important to be careful with this argument when explaining long-run growth. One of the early arguments explaining the core reasons for a natural resource curse cite the volatility associated with natural resource prices as a destabilizing factor for long-term growth [
2]. The recent increase in natural resource prices could be followed by another decrease in prices, which could perhaps fuel another curse.
Third, perhaps the capital-to-labor ratio in the natural resource extraction industry has risen. Traditional labor-intensive resource extraction processes may provide few opportunities for workers to increase knowledge skills to boost productivity in other industries. However, a capital-intensive extraction process often requires skills. Workers can develop and then apply these knowledge skills to positions in construction, plumbing, electrical, and engineering. The economy with resource extraction is thus given an opportunity to diversify its economic activity.


