
Spatial Analysis of Mountain and Lowland Anoa Habitat Potential Using the Maximum Entropy and Random Forest Algorithm


 , ,
, ,
Abstract
:1. Introduction
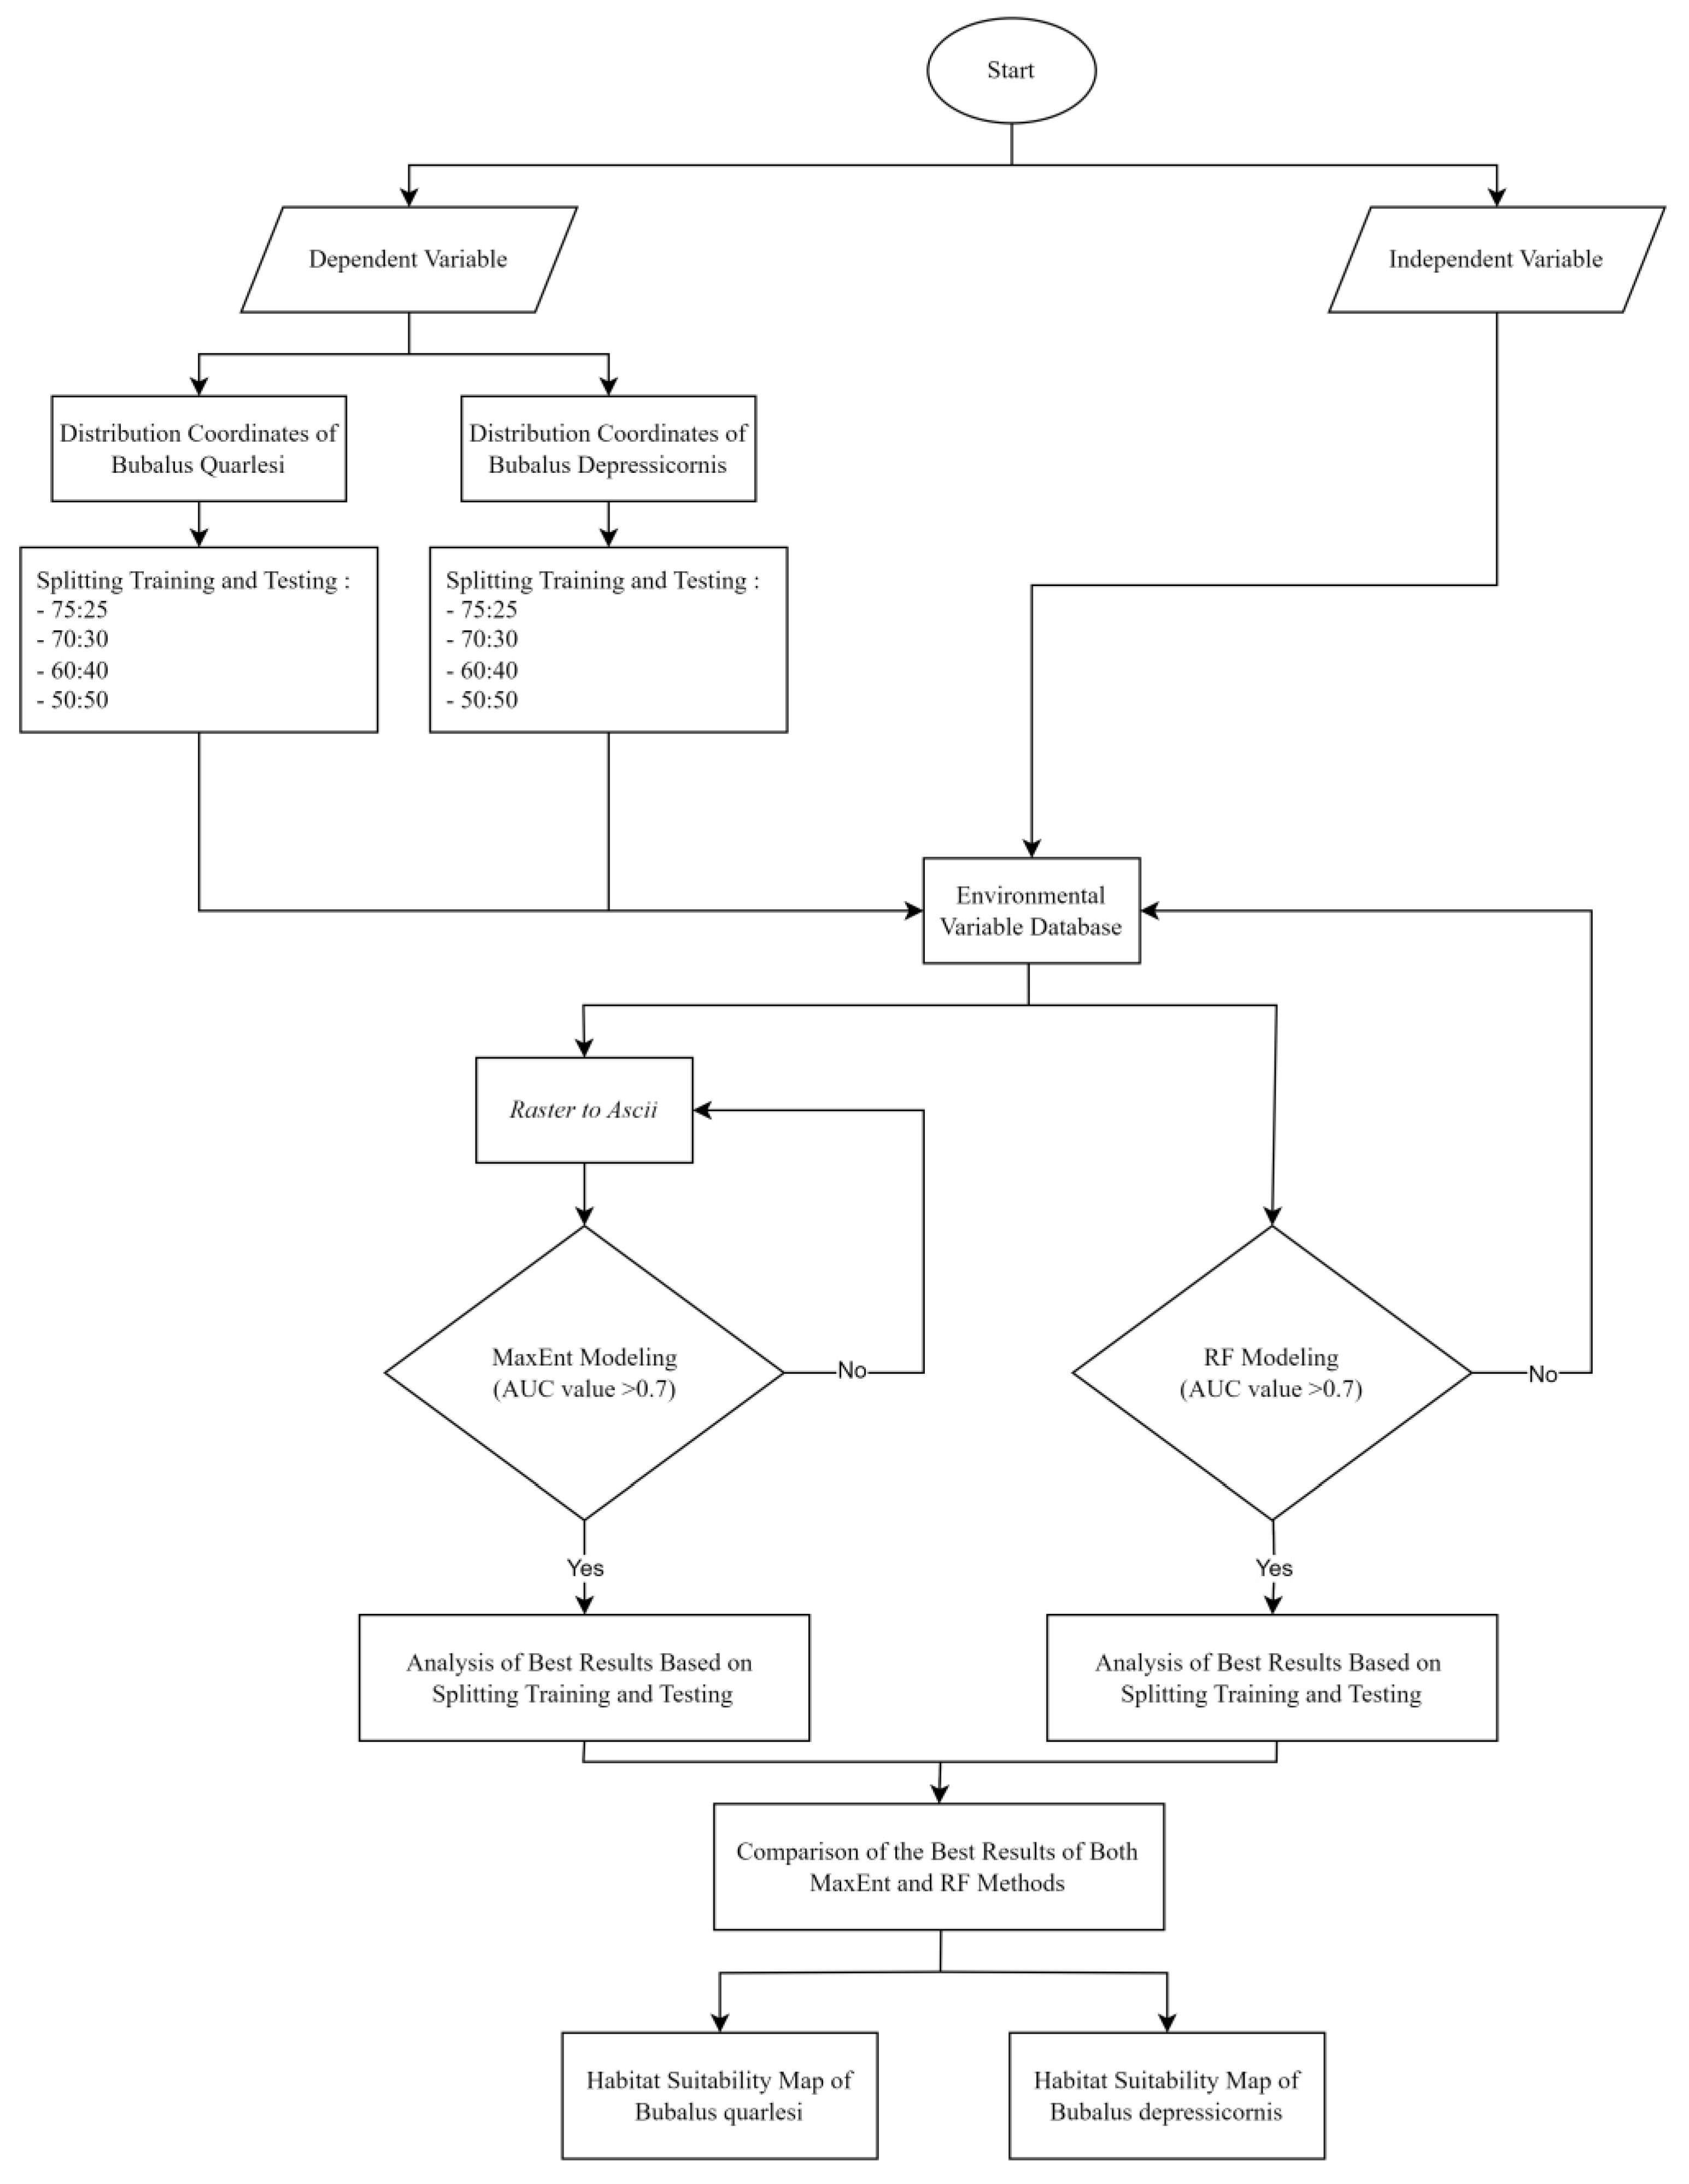
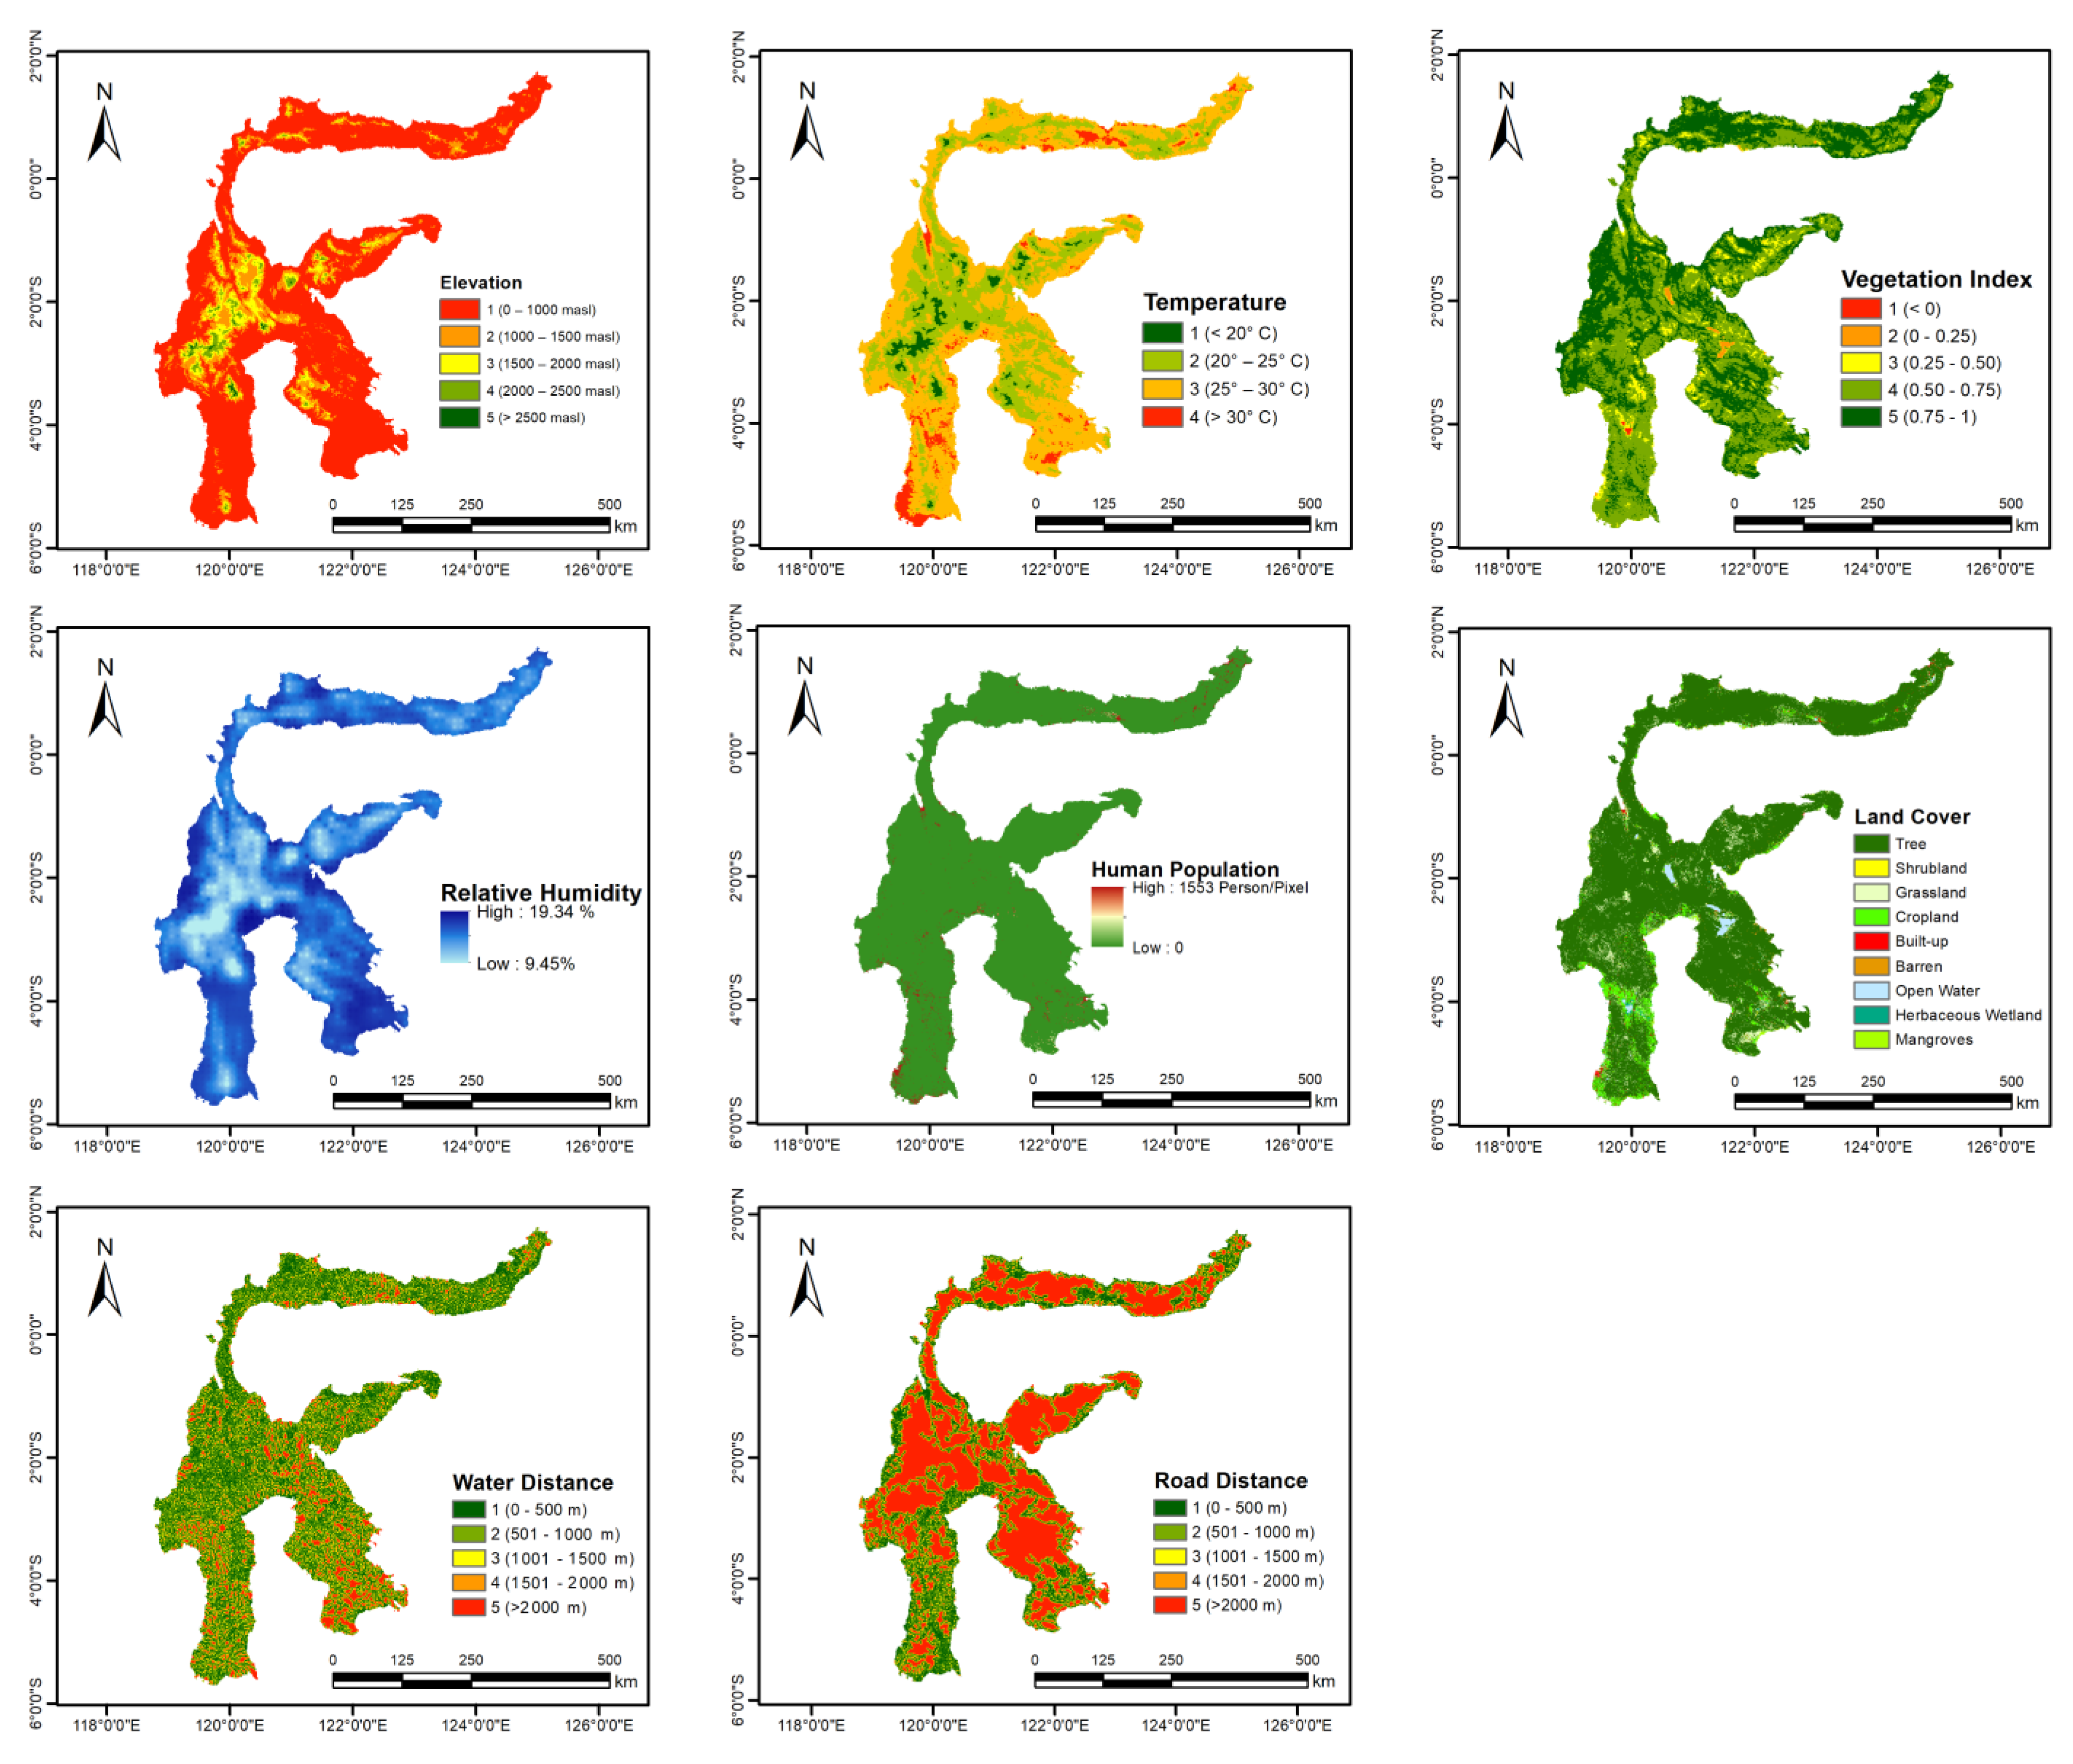
2. Materials and Methods
3. Results
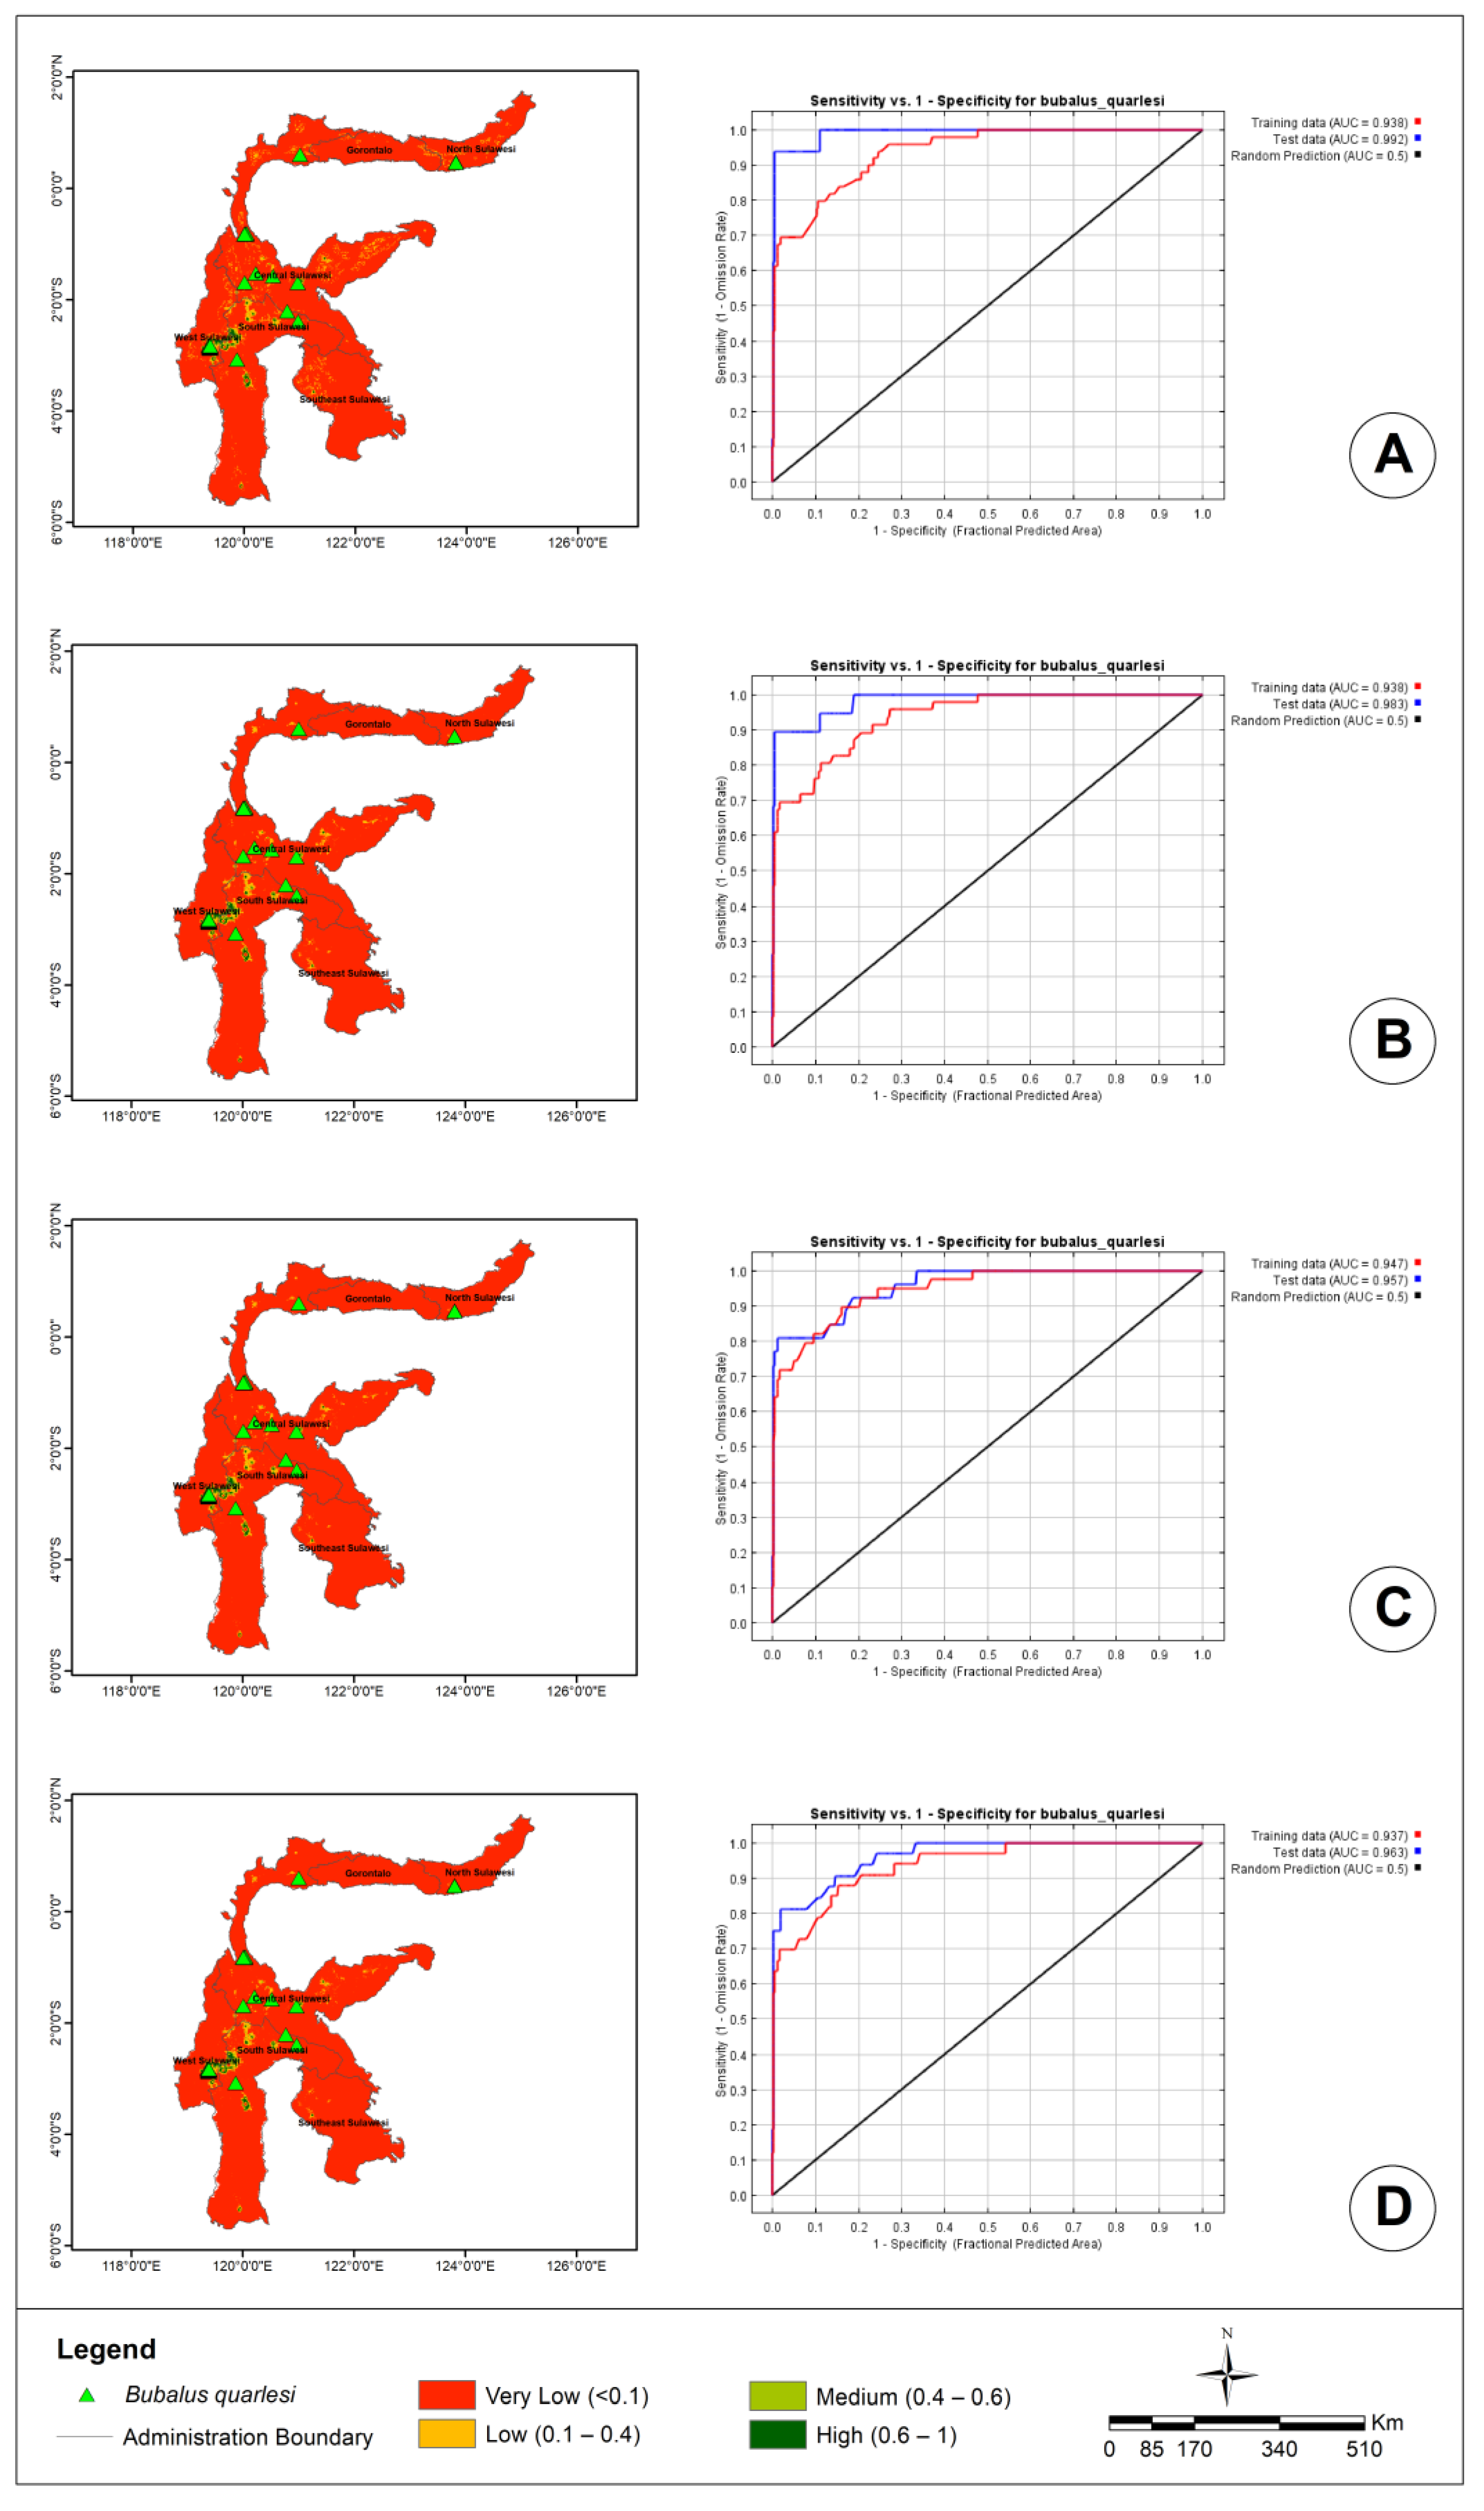
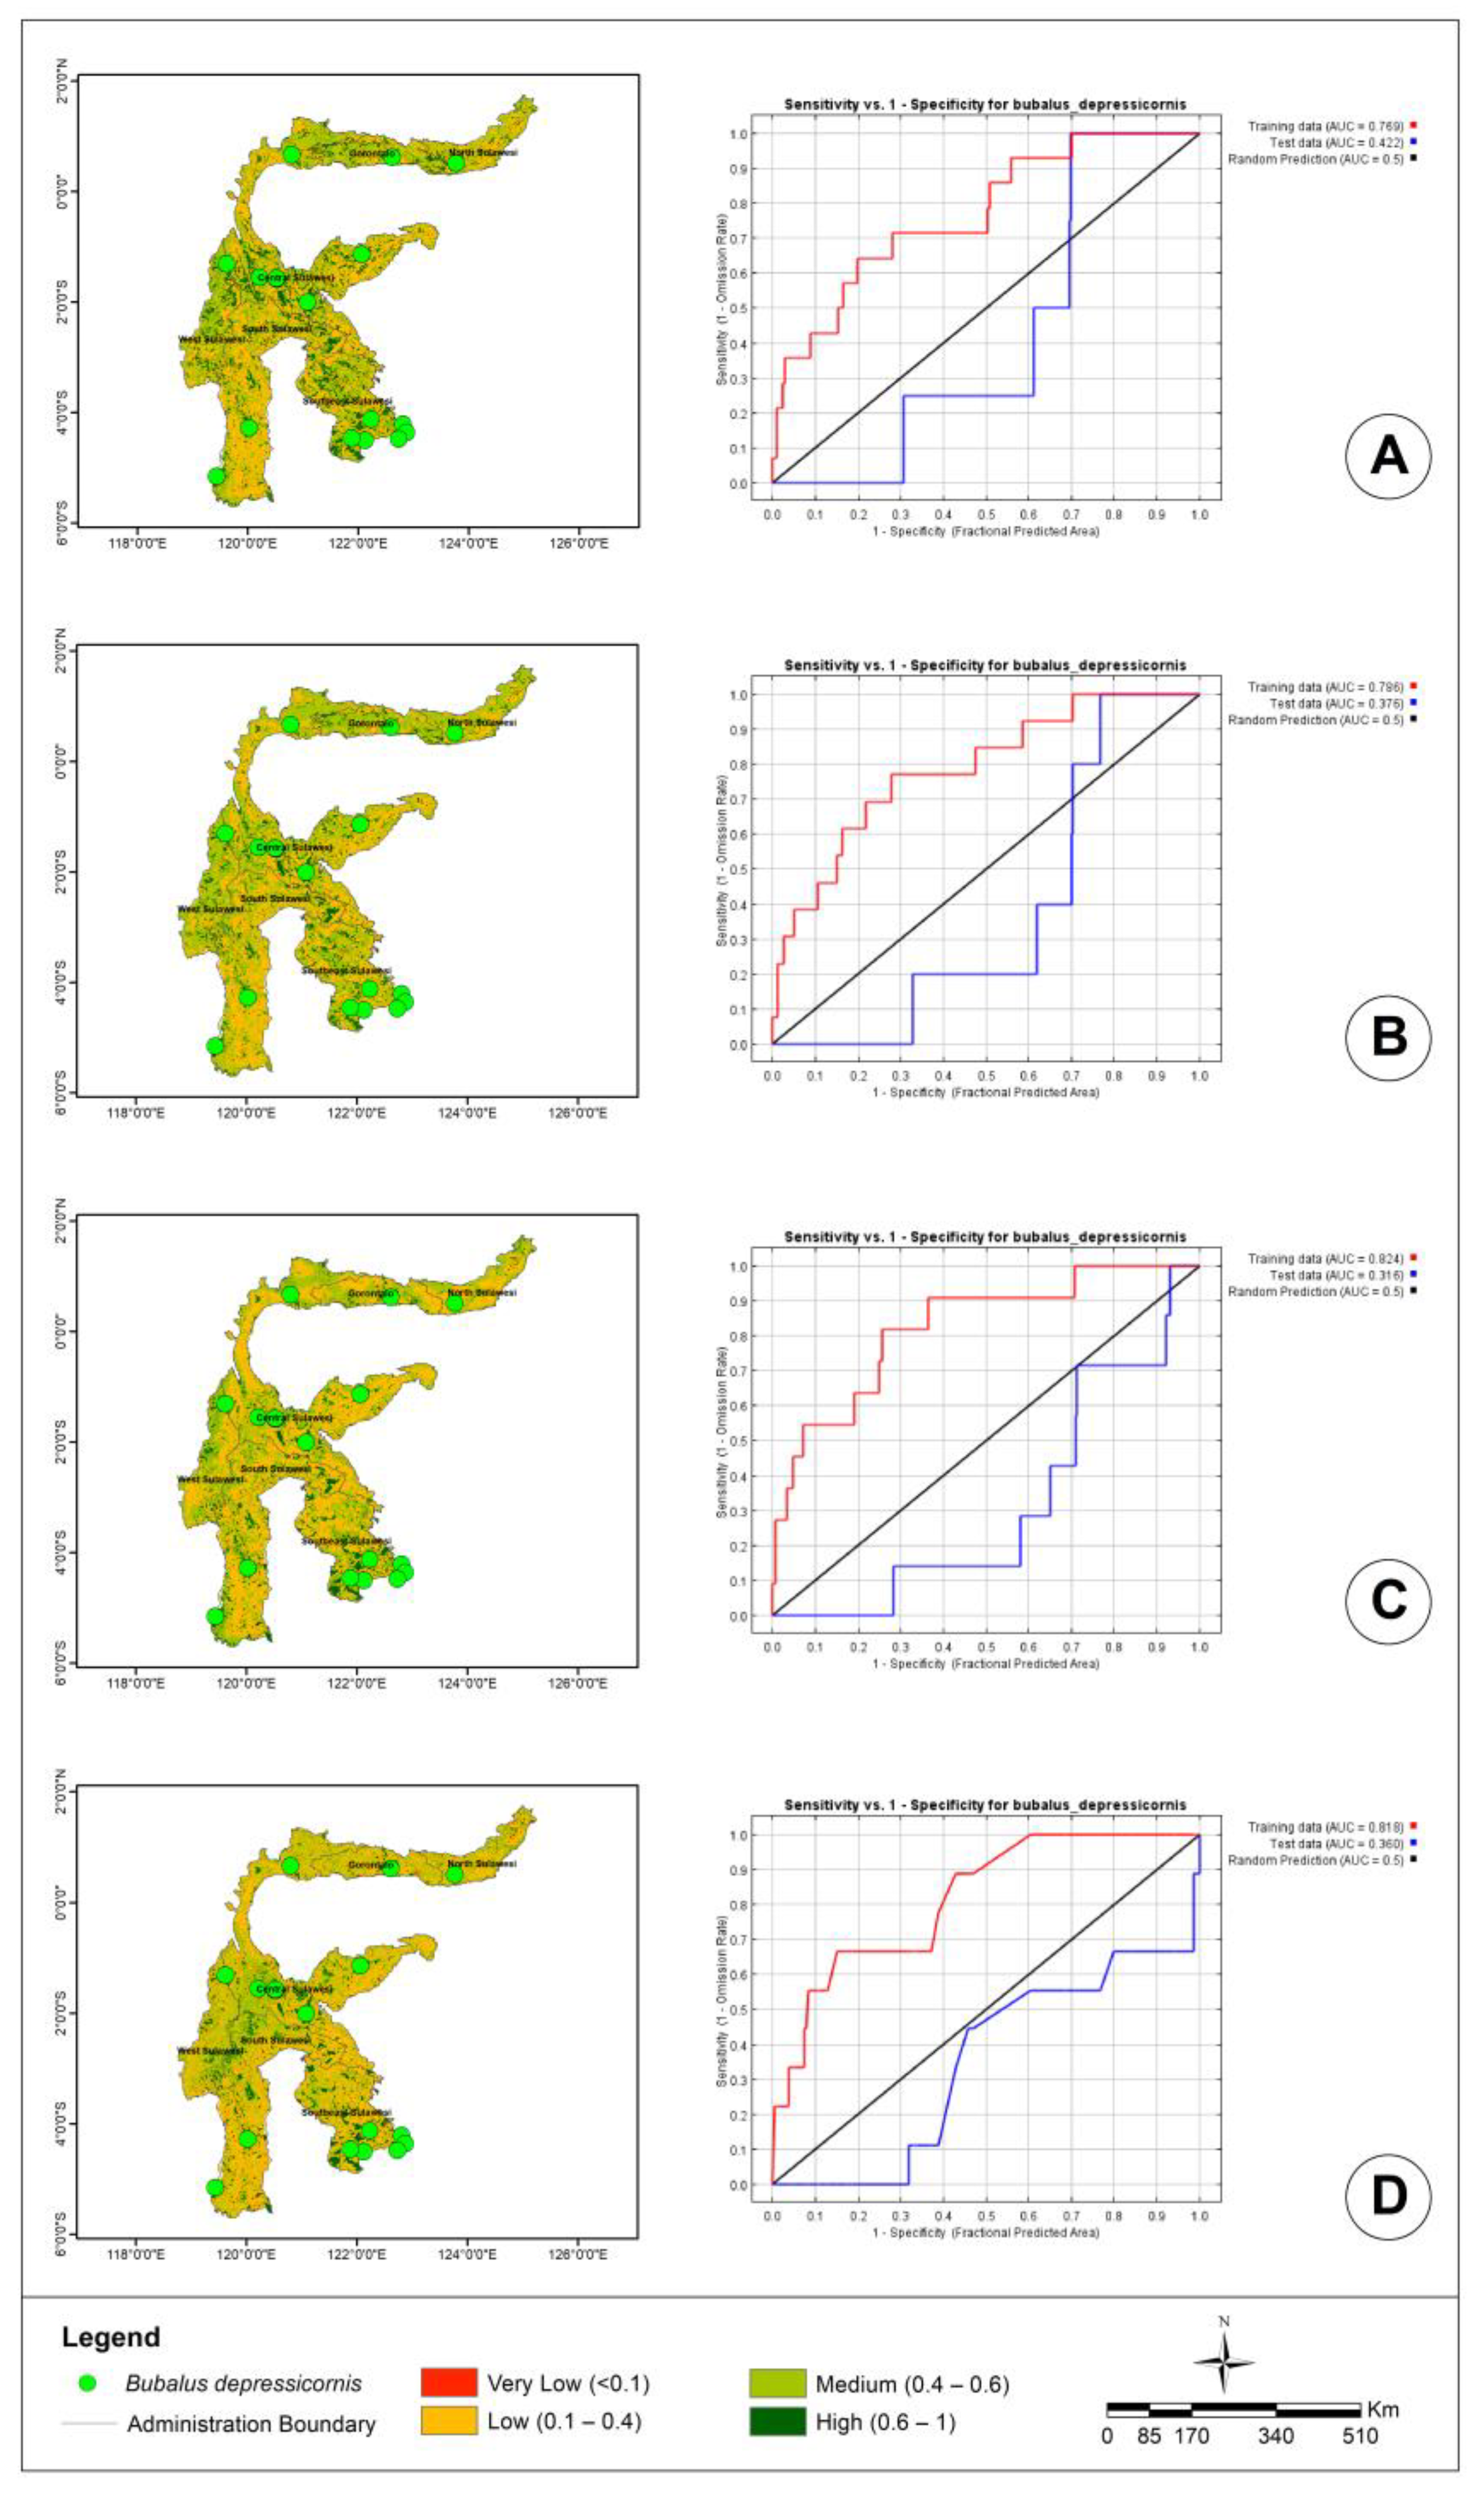
3.1. MaxEnt Modeling Results
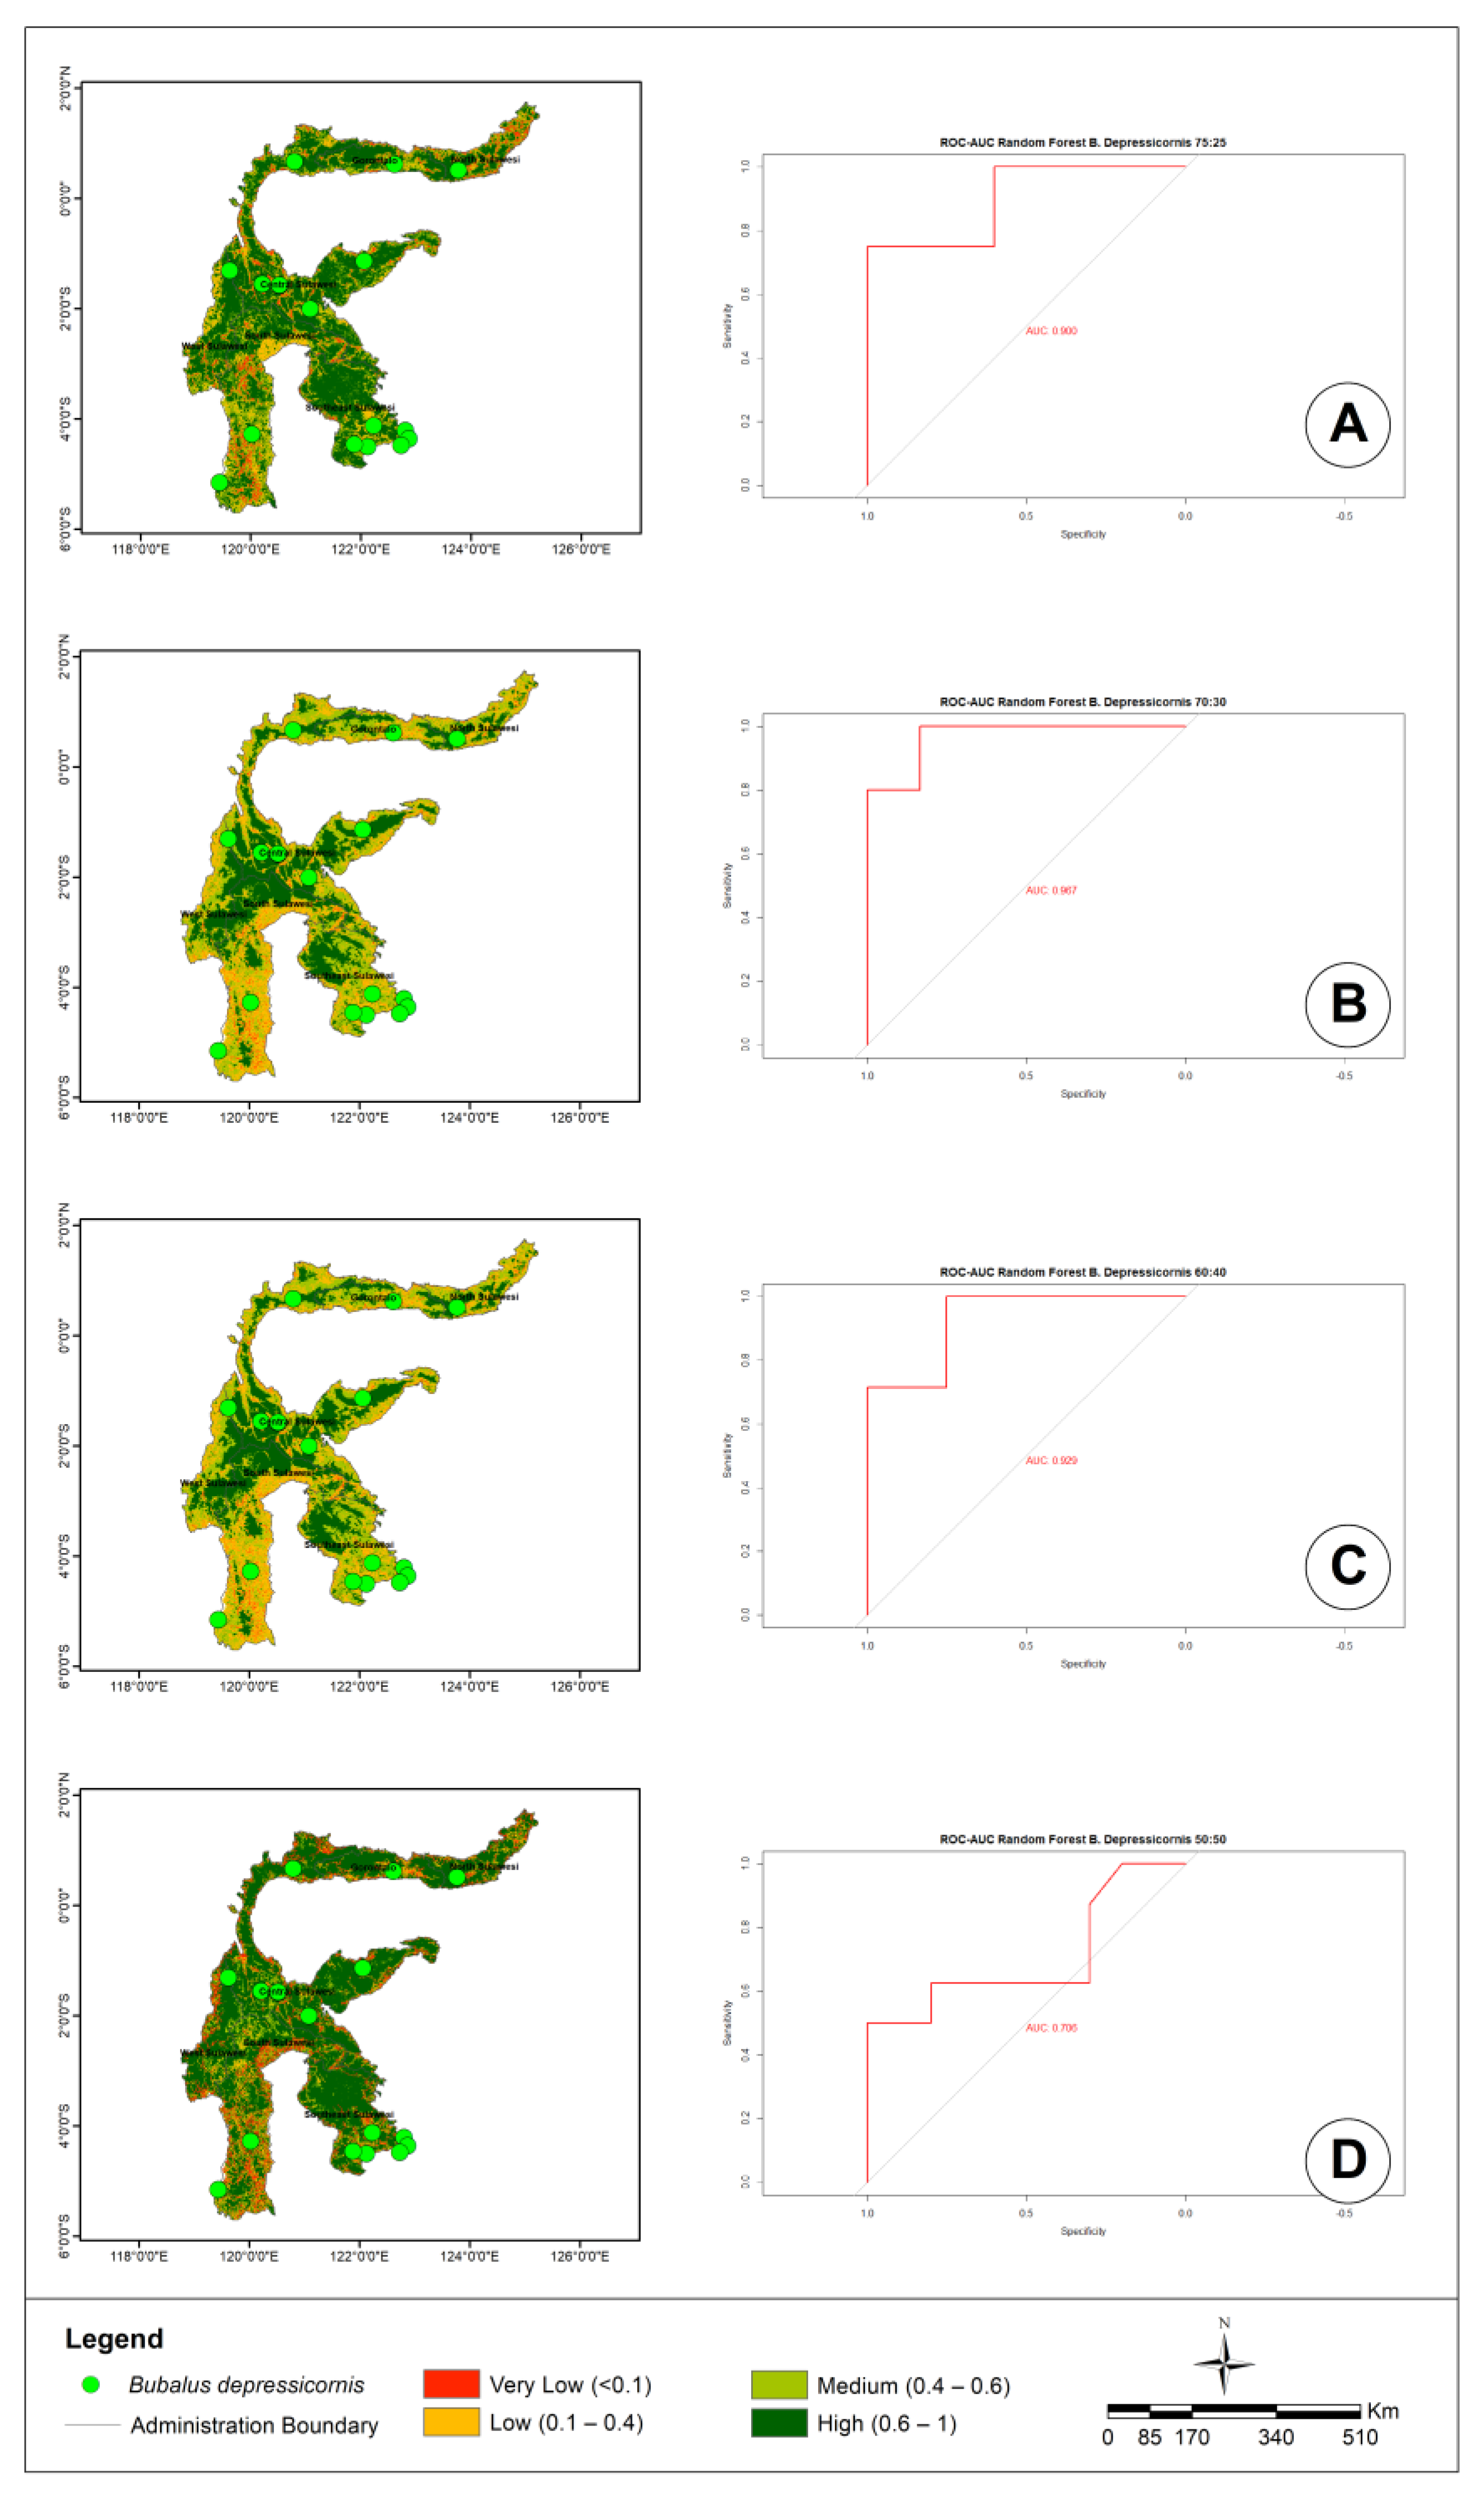
3.2. RF Modeling Results
3.3. Best Results
4. Discussion
5. Conclusions
Author Contributions
Funding
Data Availability Statement
Acknowledgments
Conflicts of Interest
Appendix A

| No | Spesies | Longitude (°) | Latitude (°) | Source |
|---|---|---|---|---|
| 1 | Bubalus quarlesi | 120.51870 | −1.57008 | [32] |
| 2 | Bubalus quarlesi | 120.04250 | −0.80722 | [33] |
| 3 | Bubalus quarlesi | 120.04050 | −0.81842 | [33] |
| 4 | Bubalus quarlesi | 120.04510 | −0.80831 | [33] |
| 5 | Bubalus quarlesi | 120.21340 | −1.52712 | [34] |
| 6 | Bubalus quarlesi | 120.00920 | −1.68975 | [34] |
| 7 | Bubalus quarlesi | 123.80960 | 0.47658 | [35] |
| 8 | Bubalus quarlesi | 123.80990 | 0.46652 | [35] |
| 9 | Bubalus quarlesi | 121.00570 | 0.60439 | [36] |
| 10 | Bubalus quarlesi | 120.00180 | −0.82303 | [37] |
| 11 | Bubalus quarlesi | 120.01500 | −0.80661 | [37] |
| 12 | Bubalus quarlesi | 120.03370 | −0.83094 | [37] |
| 13 | Bubalus quarlesi | 120.01270 | −0.82683 | [37] |
| 14 | Bubalus quarlesi | 120.77800 | −2.20443 | [38] |
| 15 | Bubalus quarlesi | 120.96800 | −1.69737 | [38] |
| 16 | Bubalus quarlesi | 120.97300 | −2.39240 | [38] |
| 17 | Bubalus quarlesi | 119.87400 | −3.07609 | [38] |
| 18 | Bubalus quarlesi | 119.39188 | −2.87850 | - |
| 19 | Bubalus quarlesi | 119.39369 | −2.87648 | Footprints |
| 20 | Bubalus quarlesi | 119.39366 | −2.87647 | Resting Place |
| 21 | Bubalus quarlesi | 119.39366 | −2.87646 | Footprints |
| 22 | Bubalus quarlesi | 119.39450 | −2.87313 | 2 Year Old Juvenile Female Stool—1 Week Stool Age—11 cm × 10 cm |
| 23 | Bubalus quarlesi | 119.38334 | −2.87160 | Traces—1 Month—3 Years Old |
| 24 | Bubalus quarlesi | 119.38450 | −2.86527 | Parent Footprints—1 Week—5.5 cm × 6.5 cm |
| 25 | Bubalus quarlesi | 119.38459 | −2.86526 | Child’s Footprints—1 Week—3 cm × 3.5 cm |
| 26 | Bubalus quarlesi | 119.38456 | −2.85850 | Male Stool—1 Week Stool Age |
| 27 | Bubalus quarlesi | 119.38484 | −2.84280 | 3 Day Trail 6 × 7—1.5 cm deep |
| 28 | Bubalus quarlesi | 119.38478 | −2.84275 | 3 Month Old Stool—13.5 × 14 |
| 29 | Bubalus quarlesi | 119.38467 | −2.84297 | 8 Month Anoa Trail—4.5 × 5.5 |
| 30 | Bubalus quarlesi | 119.38460 | −2.84316 | Male Stool—1 Week Old—20.5 × 3 |
| 31 | Bubalus quarlesi | 119.38274 | −2.84330 | Anoa Trail 1 Week—6 × 8. 1.4 cm deep |
| 32 | Bubalus quarlesi | 119.38276 | −2.84331 | 3-Month Male Stool—26 × 13.5 |
| 33 | Bubalus quarlesi | 119.38274 | −2.84322 | Nest 82 cm × 41 cm |
| 34 | Bubalus quarlesi | 119.38277 | −2.84351 | - |
| 35 | Bubalus quarlesi | 119.38277 | −2.84351 | Male Trail—7 Years Old—3 Day Trail—7.4 cm × 7 cm—2 cm Depth |
| 36 | Bubalus quarlesi | 119.38276 | −2.84351 | 7 Year Old Female Trail—3 Day Trail—4 cm × 7 cm—1.5 cm Depth |
| 37 | Bubalus quarlesi | 119.38561 | −2.84361 | 5 Day Trail—6 × 8—2 cm deep |
| 38 | Bubalus quarlesi | 119.38596 | −2.84350 | 2 Day Trail—5.3 cm × 8 cm—2 cm Depth |
| 39 | Bubalus quarlesi | 119.38623 | −2.84363 | Resting Place—90 cm × 80 cm × 40 cm |
| 40 | Bubalus quarlesi | 119.38655 | −2.84368 | Juvenile Stool < 1 Year—1 Week Stool Age—6.5 cm × 7.5 cm |
| 41 | Bubalus quarlesi | 119.38652 | −2.84372 | Child Trail (Youth)—1 Week Trail Age—4 cm × 5.7 cm |
| 42 | Bubalus quarlesi | 119.38697 | −2.84411 | Footprints of 5 Year Old Male—Age of Footprints 2 Days—6 cm × 7 cm—Depth 0.9 cm—Blunt Hooves |
| 43 | Bubalus quarlesi | 119.38616 | −2.84435 | Male Stool—1 Month Stool Age—9.5 cm × 10 cm |
| 44 | Bubalus quarlesi | 119.38577 | −2.84400 | Female Trail 4–5 Years—Trail Age 8 Days—6.5 cm × 7.5 cm—Depth 1 cm |
| 45 | Bubalus quarlesi | 119.38574 | −2.84397 | 4–5 Year Old Female Manure—2 Weeks Manure Age—20.5 cm × 23.5 cm |
| 46 | Bubalus quarlesi | 119.38575 | −2.84386 | 2.5 Year Old Male Trail—3 Day Trail Age—6.6 cm × 4.5 cm—2 cm Depth |
| 47 | Bubalus quarlesi | 119.38567 | −2.84387 | Female Resting Place—90 cm × 60 cm × 35 cm |
| 48 | Bubalus quarlesi | 119.38565 | −2.84387 | Female Trail—2 Weeks of Trail Age—6 cm × 7 cm—1 cm Depth |
| 49 | Bubalus quarlesi | 119.38482 | −2.84401 | 1.5 Year Old Male Imprint—3 Weeks Manure Age—10.5 cm × 10 cm |
| 50 | Bubalus quarlesi | 119.38482 | −2.84386 | 1.5 Year Old Male Trail—3 Week Trail—5 cm × 6.5 cm—2 cm Depth |
| 51 | Bubalus quarlesi | 119.38323 | −2.84537 | Footprint—6 cm × 7.5 cm—2.3 cm depth |
| 52 | Bubalus quarlesi | 119.38309 | −2.84509 | Footprint—5.3 cm × 8 cm—3 cm depth |
| 53 | Bubalus quarlesi | 119.38311 | −2.84484 | Stools—16 cm × 10 cm |
| 54 | Bubalus quarlesi | 119.38872 | −2.84201 | 4 Day Female Trail—5 cm × 7 cm—1.4 cm Depth |
| 55 | Bubalus quarlesi | 119.38878 | −2.84194 | 4 Day Male Trail—7 cm × 6 cm—1.5 cm depth |
| 56 | Bubalus quarlesi | 119.39028 | −2.83982 | Lantalomo Peak |
| 57 | Bubalus quarlesi | 119.39047 | −2.83873 | 3 Month Male Manure—9 cm × 12 cm |
| 58 | Bubalus quarlesi | 119.39124 | −2.83710 | 3 Day Female Trail—6 cm × 6 cm—1 cm depth |
| 59 | Bubalus quarlesi | 119.39193 | −2.83586 | 1 Month Female Manure—14 cm × 12 cm |
| 60 | Bubalus quarlesi | 119.39194 | −2.83584 | 1.5 Year Old Child Imprint—2 Weeks Imprint Age—3 cm × 5 cm—Depth |
| 61 | Bubalus quarlesi | 119.39316 | −2.83215 | 2 Day Female Trail—6 cm × 8 cm—3 cm depth |
| 62 | Bubalus quarlesi | 119.39316 | −2.83197 | Female footprint 2–3 yrs—1 week footprint—6 cm × 8 cm—2 cm deep |
| 63 | Bubalus quarlesi | 119.39289 | −2.82419 | 2 Day Female Trail—6 cm × 6 cm—2 cm depth |
| 64 | Bubalus quarlesi | 119.38518 | −2.82199 | The Nest |
| 65 | Bubalus quarlesi | 119.38431 | −2.82164 | Stools—18 cm × 20 cm |
| 66 | Bubalus quarlesi | 119.38346 | −2.81992 | Stools—14 cm × 15 cm |
| 67 | Bubalus quarlesi | 119.38342 | −2.81958 | Stools—16 cm × 13 cm |
| 68 | Bubalus quarlesi | 119.38349 | −2.81960 | Male Manure 1 Day—9 cm × 8 cm |
| 69 | Bubalus quarlesi | 119.38172 | −2.81800 | Female Manure < 1 Year Old—1 Week Manure—12 cm × 14 cm |
| 70 | Bubalus quarlesi | 119.38175 | −2.81802 | 2 Month Old imprint—8 cm × 9 cm—3 cm depth |
| 71 | Bubalus quarlesi | 119.38089 | −2.81808 | Male Tracks Age > 1 Year—3 Day Tracks—5 cm × 6.5 cm—2 cm depth |
| 72 | Bubalus quarlesi | 119.38098 | −2.81804 | 5–6 Year Old Female Stool—5 Day Stool—29.5 cm × 18 cm |
| 73 | Bubalus quarlesi | 119.38108 | −2.81791 | 1 Day Female Trail—6.3 cm × 7 cm—0.6 cm Depth |
| 74 | Bubalus quarlesi | 119.38101 | −2.81792 | 1 Day Male Footprint—4.5 cm x 5 cm—1 cm depth |
| 75 | Bubalus quarlesi | 119.37827 | −2.81687 | 4 Day Female Trail—4.5 cm × 8 cm—1 cm depth |
| 76 | Bubalus quarlesi | 119.37728 | −2.81484 | Nest—95 cm × 113 cm × 64 cm |
| 77 | Bubalus quarlesi | 119.37725 | −2.81487 | Resting Place |
| 78 | Bubalus quarlesi | 119.37707 | −2.81525 | 1 Day Female Trail—6 cm × 9 cm—1 cm depth |
| 79 | Bubalus quarlesi | 119.37729 | −2.81541 | Male Footprints 1 Day—5.5 cm x 6.3 cm—0.5 cm Depth |
| 80 | Bubalus quarlesi | 119.37739 | −2.81538 | 1 Week Female Manure—15.5 cm × 14 cm |
| 81 | Bubalus quarlesi | 119.37747 | −2.81556 | 2 Year Old Male Stool—1 Day Stool Age—13.7 cm × 9 cm |
| 82 | Bubalus quarlesi | 119.37746 | −2.81560 | Female Trail 4–5 years old—Trail Age 1 Day—5.1 cm × 7 cm—Depth 3 cm |
| 83 | Bubalus quarlesi | 119.38848 | −2.82364 | 1.5 Year Male Stool—1 Day Stool Age—10 cm × 8 cm |
| 84 | Bubalus quarlesi | 119.39298 | −2.82827 | Parent male 1.5 years old—1 day old—4.5 cm × 6 cm—0.3 cm depth |
| 85 | Bubalus depressicornis | 122.12180 | −4.49525 | [39] |
| 86 | Bubalus depressicornis | 120.52510 | −1.58031 | [32] |
| 87 | Bubalus depressicornis | 120.52360 | −1.57728 | [32] |
| 88 | Bubalus depressicornis | 120.51810 | −1.56668 | [32] |
| 89 | Bubalus depressicornis | 123.76800 | 0.51531 | [38] |
| 90 | Bubalus depressicornis | 122.61000 | 0.62516 | [38] |
| 91 | Bubalus depressicornis | 120.21500 | −1.55003 | [38] |
| 92 | Bubalus depressicornis | 120.79300 | 0.66886 | [38] |
| 93 | Bubalus depressicornis | 119.61900 | −1.30254 | [38] |
| 94 | Bubalus depressicornis | 122.06100 | −1.13299 | [38] |
| 95 | Bubalus depressicornis | 121.87800 | −4.45523 | [38] |
| 96 | Bubalus depressicornis | 122.80600 | −4.20800 | [38] |
| 97 | Bubalus depressicornis | 122.87000 | −4.35533 | [38] |
| 98 | Bubalus depressicornis | 122.72800 | −4.47538 | [38] |
| 99 | Bubalus depressicornis | 119.43333 | −5.15000 | [40] |
| 100 | Bubalus depressicornis | 120.02000 | −4.27083 | [40] |
| 101 | Bubalus depressicornis | 121.08086 | −2.00000 | [40] |
| 102 | Bubalus depressicornis | 122.23148 | −4.11590 | [40] |
References
- Mustari, A.H. Ekologi, Perilaku, dan Konservasi Anoa (Ecology, Behaviour, and Conservation of Anoa, Bovidae: Bubalus depressicornis and Bubalus quarlesi); Bogor, C.P., Ed.; PT Penerbit IPB Press: Bogor City, Indonesia, 2019. [Google Scholar]
- IUCN. The 2013 IUCN Red List of Threatened. 2013. Available online: https://www.iucnredlist.org/ (accessed on 13 September 2021).
- Groves, C.P. Systematics of the Anoa (Mammalia, Bovidae). Zool. Museum Univ. Amst. 1969, 17, 1–12. [Google Scholar]
- Harper, F. Extinct and Vanishing Mammals of the Old World; American Committee for International Wild Life Protection: New York, NY, USA, 1945; Available online: https://www.biodiversitylibrary.org/item/59320 (accessed on 5 January 2022).
- Fradrich, H. Einige Bemerkungen Uber den Anoa; Zeitschrift des Kolner Zoo: Bakersfield, CA, USA, 1973; Volume 16. [Google Scholar]
- Ardiani, D.; Jaelani, L.M.; Aldiansyah, S.; Tambunan, M.P.; Indrawan, M.; Wibowo, A.A. The Effect of Human Disturbance on the Spatial Distribution of Anoa (Bubalus sp.) Using MaxEnt Modeling. IOP Conf. Ser. Earth Environ. Sci. 2023, 1127, 012020. [Google Scholar] [CrossRef]
- Jaelani, L.M.; Benedict; Ardiani, D.; Tambunan, M.P.; Indrawan, M.; Wibowo, A.A. An Extensive Coverage Anoa Distribution Modelling in Sulawesi Using Maximum Entropy. HAYATI J. Biosci. 2023, 30, 716–724. [Google Scholar] [CrossRef]
- Zhao, Z.; Xiao, N.; Shen, M.; Li, J. Comparison Between Optimized MaxEnt and Random Forest Modeling in Predicting Potential Distribution: A Case Study with Quasipaa boulengeri in China. Sci. Total Environ. 2022, 842, 156867. [Google Scholar] [CrossRef] [PubMed]
- Ao, Y.; Li, H.; Zhu, L.; Ali, S.; Yang, Z. The linear random forest algorithm and its advantages in machine learning assisted logging regression modeling. J. Pet. Sci. Eng. 2019, 174, 776–789. [Google Scholar] [CrossRef]
- Fawagreh, K.; Gaber, M.M.; Elyan, E. Random forests: From early developments to recent advancements. Syst. Sci. Control Eng. 2014, 2, 602–609. [Google Scholar] [CrossRef]
- Phillips, S.J.; Anderson, R.P.; Schapire, R.E. Maximum Entropy Modeling of Species Geographic Distributions. Int. J. Glob. Environ. Issues 2006, 6, 231–259. [Google Scholar] [CrossRef]
- Nurwatik, N.; Ummah, M.H.; Cahyono, A.B.; Darminto, M.R.; Hong, J.H. A Comparison Study of Landslide Susceptibility Spatial Modeling Using Machine Learning. ISPRS Int. J. Geo-Inf. 2022, 11, 602. [Google Scholar] [CrossRef]
- Pemerintah Pusat, UU Nomor 5 Tahun 1994. 1994. Available online: https://peraturan.go.id/id/uu-no-5-tahun-1994 (accessed on 5 January 2022).
- Sosilowati, S.T.; Handayani, A.; Wahyudi, A.R.; Massudi, W.; Febrianto, S.; Suhendri, N.A. Sinkronisasi Program dan Pembiayaan Pembangunan Jangka Pendek 2018–2020; PUPR: San Juan, PR, USA, 2017. [Google Scholar]
- USGS. Earth Explorer. 2022. Available online: https://earthexplorer.usgs.gov/ (accessed on 5 September 2022).
- Phillips, S.J.; Dudík, M.; Schapire, R.E. Maxent Software for Modeling Species Niches and Distributions (Version 3.4.1). 2021. Available online: http://biodiversityinformatics.amnh.org/open_source/maxent/ (accessed on 1 September 2021).
- Chambers, J.M. The Comprehensive R Archive Network. 2021. Available online: https://cran.r-project.org/ (accessed on 1 November 2021).
- GEE. Google Earth Engine. 2022. Available online: https://code.earthengine.google.com/ (accessed on 11 July 2022).
- Baldwin, R.A. Use of maximum entropy modeling in wildlife research. Entropy 2009, 11, 854–866. [Google Scholar] [CrossRef]
- Phillips, S. ‘A Brief Tutorial on Maxent’ in Species Distribution Modeling for Educators and Practitioners. Lessons Conserv. 2010, 3, 107–135. Available online: http://ncep.amnh.org/linc (accessed on 3 September 2021).
- Kumar, S.; Stohlgren, T.J. Maxent modeling for predicting suitable habitat for threatened and endangered tree Canacomyrica monticola in New Caledonia. J. Ecol. Nat. Environ. 2009, 1, 94–98. [Google Scholar]
- Noer, I.S.; Gunawan, H.; Rahman, D.A. Penggunaan Habitat dan Pemodelan Distribusi Spasial Macan Tutul Jawa di Kawasan Gunung Sawal Jawa Barat. J. Penelit. Hutan Dan Konserv. Alam 2021, 18, 53–66. [Google Scholar] [CrossRef]
- Li, Z.; Liu, Y.; Zeng, H. Application of the MaxEnt model in improving the accuracy of ecological red line identification: A case study of Zhanjiang, China. Ecol. Indic. 2022, 137, 108767. [Google Scholar] [CrossRef]
- West, A.M.; Kumar, S.; Brown, C.S.; Stohlgren, T.J.; Bromberg, J. Field validation of an invasive species Maxent model. Ecol. Inform. 2016, 36, 126–134. [Google Scholar] [CrossRef]
- Gorunescu, F. Data Mining Concepts, Models and Techniques; Springer: Berlin/Heidelberg, Germany, 2011. [Google Scholar] [CrossRef]
- Chicco, D.; Warrens, M.J.; Jurman, G. The Matthews Correlation Coefficient (MCC) is More Informative Than Cohen’s Kappa and Brier Score in Binary Classification Assessment. IEEE Access 2021, 9, 78368–78381. [Google Scholar] [CrossRef]
- Petrosino, A.; Salvi, G. A Rough Fuzzy Neural Network Approach for Robust Face Detection and Tracking; Elsevier Inc.: Amsterdam, The Netherlands, 2015. [Google Scholar] [CrossRef]
- Yang, S.; Berdine, G. The receiver operating characteristic (ROC) curve. Southwest Respir. Crit. Care Chron. 2017, 5, 34. [Google Scholar] [CrossRef]
- Narkhede, S. Understanding AUC–ROC Curve. Towar. Data Sci. 2018, 6–11. Available online: https://towardsdatascience.com/understanding-auc-roc-curve-68b2303cc9c5 (accessed on 13 June 2023).
- Trifonova, O.P.; Lokhov, P.G.; Archakov, A.I. Metabolic profiling of human blood. Biochem. Suppl. Ser. B Biomed. Chem. 2013, 7, 179–186. [Google Scholar] [CrossRef]
- Kaky, E.; Nolan, V.; Alatawi, A.; Gilbert, F. A comparison between Ensemble and MaxEnt species distribution modelling approaches for conservation: A case study with Egyptian medicinal plants. Ecol. Inform. 2020, 60, 101150. [Google Scholar] [CrossRef]
- Ranuntu, R.A.; Mallombasang, S.N. Studi Populasi dan Habitat Anoa (Bubalus sp.) si Kawasan Hutan Lindung Desa Sangginora Kabupaten Poso. Mitra Sains 2015, 3, 81–94. [Google Scholar]
- Wardah, W.; Labiro, E.; Massiri, S.D.; Sustri, S.; Mursidin, M. Vegetasi Kunci Habitat Anoa Di Cagar Alam Pangi Binangga, Sulawesi Tengah. J. Penelit. Kehutan. Wallacea 2012, 1, 1–12. [Google Scholar] [CrossRef]
- Stephens, W. Anoa Gunung (Bubalus quarlesi). 2014. Available online: https://www.inaturalist.org/observations/40653991 (accessed on 3 September 2021).
- Arini, D.I.D. Anoa dan Habitatnya di Sulawesi Utara; no. 1; Balai Penelitian Kehutanan Manado: Manado, Indonesia, 2013.
- Allo, R.P.A.; Sudhartono, A.; Labiro, E. Karakteristik Komponen Abiotik Anoa (Bubalus sp.) Habitat dalam Hutan Pendidikan Tadulako Universitas Kecamatan Bolano Lambunu Kabupaten Parigi Moutong. J. War. Rimba 2018, 6, 25–31. [Google Scholar]
- Valentino, M.W.S. Distribusi Jejak Anoa (Bubalus sp.) di Kawasan Cagar Alam Pangi Binangga Kabupaten Parigi Moutong. 2013. Available online: https://dokumen.tips/documents/distribusi-jejak-anoa-bubalus-spp-di-kawasan-cagar-alam-pangi-binangga-kab.html?page=1 (accessed on 17 September 2023).
- Burton, J.A. The taxonomic status, distribution and conservation of the lowland anoa Bubalus depressicornis and mountain anoa Bubalus quarlesi. Mamm. Rev. 2005, 35, 25–50. [Google Scholar] [CrossRef]
- Analuddin, K.; Raya, R.; Rahim, S. Struktur Hutan Mangrove Sebagai Habitat Hewan Endemik Anoa Dataran Rendah (Bubalus sp.) di Taman Nasional Rawa Aopa Watumohai. BioWallacea J. Biol. Res. 2016, 3, 384–395. [Google Scholar]
- GBIF. Occurrence Download; The Global Biodiversity Information Facility: Copenhagen, Denmark, 2023. [Google Scholar] [CrossRef]


| No | Variables | Cell Size (m) | Source | Class | Range Data |
|---|---|---|---|---|---|
| 1 | DEM/Elevation | 30 | Shuttle Radar Topography Mission (SRTM) | 1 | 0–1000 m |
| 2 | 1000–1500 m | ||||
| 3 | 1500–2000 m | ||||
| 4 | 2000–2500 m | ||||
| 5 | >2500 m | ||||
| 2 | Temperature | 100 (resampled to 30) | MOD11A1 Version 6 product | 1 | <20 °C |
| 2 | 20–25 °C | ||||
| 3 | 25–30 °C | ||||
| 4 | >30 °C | ||||
| 3 | Vegetation Index | 100 (resampled to 30) | MOD11A1 Version 6 product | 1 | <0 |
| 2 | 0–0.25 | ||||
| 3 | 0.25–0.50 | ||||
| 4 | 0.50–0.75 | ||||
| 5 | 0.75–1 | ||||
| 4 | Land Cover | 10 (resampled to 30) | ESA WorldCover | 10 | Trees |
| 20 | Shrubland | ||||
| 30 | Grassland | ||||
| 40 | Cropland | ||||
| 50 | Built-up | ||||
| 60 | Barren/Sparse Vegetation | ||||
| 80 | Open Water | ||||
| 90 | Herbaceous Wetland | ||||
| 95 | Mangroves | ||||
| 5 | Transportation | 30 | BIG | 1 | 0–500 m |
| 2 | 501–1000 m | ||||
| 3 | 1001–1500 m | ||||
| 4 | 1501–2000 m | ||||
| 5 | >2000 m | ||||
| 6 | Water | 30 | BIG | 1 | 0–500 m |
| 2 | 501–1000 m | ||||
| 3 | 1001–1500 m | ||||
| 4 | 1501–2000 m | ||||
| 5 | >2000 m | ||||
| 7 | Human Population | 100 (resampled to 30) | WorldPop | 0–1553 people/pixel | |
| 8 | Relative Humidity | 11,000 (resampled to 30) | FLDAS | 9.45–19.34% | |
| Elevation | Temperature | Vegetation | Relative Humidity | Human Population | Land Cover | Water | Transportation | |
|---|---|---|---|---|---|---|---|---|
| Elevation | 1 | |||||||
| Temperature | −0.851 | 1 | ||||||
| Vegetation | −0.672 | 0.478 | 1 | |||||
| Relative Humidity | −0.912 | 0.932 | 0.513 | 1 | ||||
| Human Population | −0.159 | 0.345 | −0.255 | 0.218 | 1 | |||
| Land Cover | −0.237 | 0.403 | 0.038 | 0.353 | 0.460 | 1 | ||
| Water | −0.501 | 0.482 | 0.379 | 0.541 | 0.051 | −0.043 | 1 | |
| Transportation | 0.467 | −0.666 | −0.260 | −0.549 | −0.367 | −0.272 | −0.316 | 1 |
| Province | Gorontalo | West Sulawesi | South Sulawesi | Central Sulawesi | Southeast Sulawesi | North Sulawesi | |
|---|---|---|---|---|---|---|---|
| Class | |||||||
| Very Low | 676,577 | 784,321 | 2,247,574 | 2,283,917 | 1,337,869 | 666,963 | |
| Low | 473,689 | 624,690 | 1,602,293 | 2,719,151 | 1,164,064 | 496,856 | |
| Medium | 17,705 | 93,083 | 227,439 | 329,480 | 75,105 | 25,420 | |
| High | 20,383 | 129,326 | 285,650 | 295,184 | 71,256 | 35,613 | |
| Province | Gorontalo | West Sulawesi | South Sulawesi | Central Sulawesi | Southeast Sulawesi | North Sulawesi | |
|---|---|---|---|---|---|---|---|
| Class | |||||||
| Very Low | 23,773 | 17,105 | 179,476 | 91,704 | 23,915 | 33,029 | |
| Low | 317,990 | 372,482 | 1,638,132 | 1,238,548 | 638,400 | 347,087 | |
| Medium | 504,452 | 584,004 | 1,185,045 | 1,865,110 | 1,144,664 | 465,104 | |
| High | 342,139 | 657,829 | 1,360,304 | 2,432,371 | 841,315 | 379,632 | |
Disclaimer/Publisher’s Note: The statements, opinions and data contained in all publications are solely those of the individual author(s) and contributor(s) and not of MDPI and/or the editor(s). MDPI and/or the editor(s) disclaim responsibility for any injury to people or property resulting from any ideas, methods, instructions or products referred to in the content. |
© 2023 by the authors. Licensee MDPI, Basel, Switzerland. This article is an open access article distributed under the terms and conditions of the Creative Commons Attribution (CC BY) license (https://creativecommons.org/licenses/by/4.0/).
Share and Cite
Ardiani, D.; Jaelani, L.M.; Aldiansyah, S.; Tambunan, M.P.; Indrawan, M.; Wibowo, A.A. Spatial Analysis of Mountain and Lowland Anoa Habitat Potential Using the Maximum Entropy and Random Forest Algorithm. World 2023, 4, 653-669. https://doi.org/10.3390/world4040041
Ardiani D, Jaelani LM, Aldiansyah S, Tambunan MP, Indrawan M, Wibowo AA. Spatial Analysis of Mountain and Lowland Anoa Habitat Potential Using the Maximum Entropy and Random Forest Algorithm. World. 2023; 4(4):653-669. https://doi.org/10.3390/world4040041
Chicago/Turabian StyleArdiani, Diah, Lalu Muhamad Jaelani, Septianto Aldiansyah, Mangapul Parlindungan Tambunan, Mochamad Indrawan, and Andri A. Wibowo. 2023. "Spatial Analysis of Mountain and Lowland Anoa Habitat Potential Using the Maximum Entropy and Random Forest Algorithm" World 4, no. 4: 653-669. https://doi.org/10.3390/world4040041
APA StyleArdiani, D., Jaelani, L. M., Aldiansyah, S., Tambunan, M. P., Indrawan, M., & Wibowo, A. A. (2023). Spatial Analysis of Mountain and Lowland Anoa Habitat Potential Using the Maximum Entropy and Random Forest Algorithm. World, 4(4), 653-669. https://doi.org/10.3390/world4040041