Abstract
Typical fertilizer applicators are often restricted in performance due to non-uniformity in distribution, required labor and time intensiveness, high discharge rate, chemical input wastage, and fostering weed proliferation. To address this gap in production agriculture, an automated variable-rate fertilizer applicator was developed for the cotton crop that is based on deep learning-initiated electronic control unit (ECU). The applicator comprises (a) plant recognition unit (PRU) to capture and predict presence (or absence) of cotton plants using the YOLOv7 recognition model deployed on-board Raspberry Pi microprocessor (Wale, UK), and relay decision to a microcontroller; (b) an ECU to control stepper motor of fertilizer metering unit as per received cotton-detection signal from the PRU; and (c) fertilizer metering unit that delivers precisely metered granular fertilizer to the targeted cotton plant when corresponding stepper motor is triggered by the microcontroller. The trials were conducted in the laboratory on a custom testbed using artificial cotton plants, with the camera positioned 0.21 m ahead of the discharge tube and 16 cm above the plants. The system was evaluated at forward speeds ranging from 0.2 to 1.0 km/h under lighting levels of 3000, 5000, and 7000 lux to simulate varying illumination conditions in the field. Precision, recall, F1-score, and mAP of the plant recognition model were determined as 1.00 at 0.669 confidence, 0.97 at 0.000 confidence, 0.87 at 0.151 confidence, and 0.906 at 0.5 confidence, respectively. The mean absolute percent error (MAPE) of 6.15% and 9.1%, and mean absolute deviation (MAD) of 0.81 g/plant and 1.20 g/plant, on application of urea and Diammonium Phosphate (DAP), were observed, respectively. The statistical analysis showed no significant effect of the forward speed of the conveying system on fertilizer application rate (p > 0.05), thereby offering a uniform application throughout, independent of the forward speed. The developed fertilizer applicator enhances precision in site-specific applications, minimizes fertilizer wastage, and reduces labor requirements. Eventually, this fertilizer applicator placed the fertilizer near targeted plants as per the recommended dosage.
1. Introduction
Cotton is one of the most significant cash crops that influences the textile and agricultural industries [1]. India cultivates approximately 12.15 million ha for cotton, constituting 36% of the global cotton cultivation. In 2021–2022, India recorded 31.37 million bales of cotton with an average cotton yield of 445 kg/ha, which is about half of the worldwide average of 812 kg/ha [2]. As a result, the farmers earn a meager income per unit area. Cotton production is influenced by several factors, including precipitation, weeding and spraying, fertilizer application, and irrigation among others [3,4,5]. Fertilization is one of the most crucial and efficient approaches for improving soil abilities and boosting crop yields [6,7]. Fertilizer should be applied to the crop at the desired rate, as it is a costly input and adversely affects the environment and soil, if overused [8,9].
Conventionally, broadcasting and placement methods have been the two commonly employed methods to apply microgranular fertilizers. In the broadcasting method, fertilizer is spread over an entire field. This causes operational difficulties by fostering weed growth, inefficiency in fertilizer usage, and an uneven distribution of fertilizer over the field [10,11]. Over the past few years, several new designs of fertilizer applicators have been introduced with a specific emphasis on managing granular fertilizers. A spreader distributes fertilizer [12] in a small area; however, maintaining consistency and distribution over the entire field is challenging. Several researchers have reported similar constraints with spreader-type fertilizer applicators [13,14]. Chandel et al. [15] developed a map-based granular fertilizer application system that continuously delivered fertilizer during sowing, thereby resulting in potential input losses and weed germinations ahead of crop initiation.
Several electronically controlled fertilizer mechanisms [16,17] have also been developed to apply micro granular fertilizer during sowing. Fertilizer rates in such systems are adjusted by changing the exposure length of the metering unit. Qian et al. [18] developed a broadcasting method-based applicator to handle solid fertilizer. However, this applicator suffered challenges of dispensing more fertilizer per unit area, leading to weed growth due to spread of the fertilizer over an entire field and difficulties in maintaining uniformity. Yanan et al. [19] developed a drill-type fertilizer applicator for site-specific dispensation. However, the applicator needs to be paused near each plant during application that posed operational challenge and time extensiveness.
Artificial intelligence (AI) has emerged as a prominent component of precision agriculture, including variable-rate automated application technologies. Farooque et al. [20] developed a variable-rate fertilizer applicator using AI for liquid spraying. The study deployed the YOLOv3 deep learning model that provided high precision (0.87), mAP (76.4%), and recall (0.75) in detecting weeds, unhealthy plants, and healthy plants. The outcomes showed that developed algorithms reduced spray inputs by 47% and 51% for weed eradication and treating infected plants, respectively, however, at low detection speed. Similarly, [21,22,23] developed a dose-control system for weed detection and precise spraying based on machine vision and demonstrated potential to save agrochemical spraying inputs by 50%. Additional studies have used AI techniques for variable-rate fertilizer, pesticides, and herbicide applications [24,25,26]. Researchers who investigated different fertilizer application methods demonstrated that precision in fertilizer placement can maximize yield and quality of crops produced, reduce wastage, and enhance input utilization efficiencies [27,28,29]. Application of AI and machine vision can realize this potential.
Based on the above-mentioned review, it is evident that integrated electronic-control and machine vision techniques, as applied in spreader and liquid spraying technologies, can also be used for granular fertilizer applications using plant recognition approach in conjunction with the fertilizer placement techniques. Most fertilizer applicators employ broadcasting methods, which often results in uneven distribution, enhanced weed emergence, and labor intensiveness. In contrast, placement-type applicators dispense fertilizer after pausing near each plant. Therefore, this study is an attempt to improve placement-method of granular fertilizer application for cotton crops using AI and electronic-control techniques with key objectives to (a) develop an AI-based plant recognition unit (PRU) for identifying cotton crop plant; (b) develop an electronic control unit (ECU) for controlling proportional release of fertilizer from metering unit; and (c) development of first mechatronic prototype and its evaluation for fertilizer application in cotton crops.
2. Materials and Methods
The system was tested on a custom testbed using artificial cotton plants in the laboratory of controlled light conditions. The camera was fixed 0.21 m in front of the discharge tube and 16 cm above the plant canopy, and the applicator was connected to an electronically controlled fertilizer metering unit. The trials were carried out at forward speeds between 0.2 and 1.0 km/h. The laboratory had no windows and had five LED lights on the ceiling. Additional voltage-regulated LED light source was placed 15 cm above the camera to vary illumination over/around the plants for imaging. Lux measurements were conducted, and LED illuminations were adjusted for the levels of 3000, 5000, and 7000 lux to study the system performance. The LEDs were placed 15 cm above the camera. The cotton fertilizer applicator prototype integrated a PRU, an ECU, a fertilizer metering unit, and a crop conveying unit for evaluations. The developed prototype was evaluated for performance over a testbed. Methods pertaining to prototype components, their development, and performance evaluation have been detailed in the following sections.
2.1. Plant Recognition Unit
A plant recognition unit (PRU) was developed for cotton plant detection in real-time. This unit integrates a webcam (8MP, HP, Pune, India) and a microprocessor (Raspberry Pi®) deploying an AI model for plant recognition. The model identifies the presence or absence of cotton plants and converts this information into a Boolean signal (1 for presence detected, 0 for otherwise). This signal is then transmitted by the microprocessor to the ECU to control the fertilizer metering unit. In the present study, fertilizer application is triggered only based on plant identification, with a fixed dose delivered once the presence of a plant is detected.
2.1.1. The AI-Computer Vision Model for Plant Recognition
A convolutional neural network (CNN)-based YOLOv7 object detection model was formulated for plant recognition on the go [30,31]. This model was selected for its accuracy and computational efficiency that are desired for resource-constrained edge-computing devices. To train the model (Figure 1), 500 images of cotton plants under diverse lighting conditions were collected using the selected webcam (8MP camera; HP, India). The dataset was collected from cotton fields in Khandwa district, Madhya Pradesh, India under natural field conditions. The image dataset was randomly divided into three sets, 400 for training, 50 for testing, and 50 for validation. Within all images, complete cotton plants were manually labeled using the bounding-box (BBox) in Makesense® annotation tool (version: 1.11.0-alpha, Bengaluru, India) that provides the coordinates or locations for each object within the image (Figure 2). All annotations were stored in the text file. The model structure is illustrated in Figure 3 and is based on ELAN (Efficient Layer Aggregation Network). The formulated model was fine-tuned for hyperparameters to obtain the best-fit and optimized model.
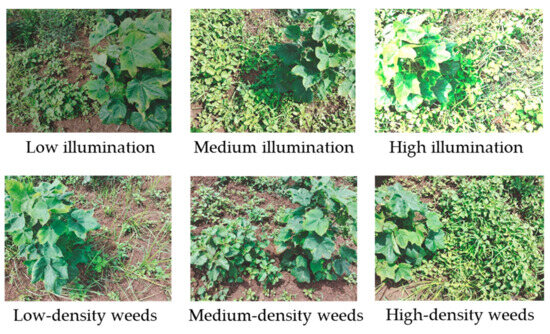
Figure 1.
Cotton crop images with different light conditions and densities of weed infestations.
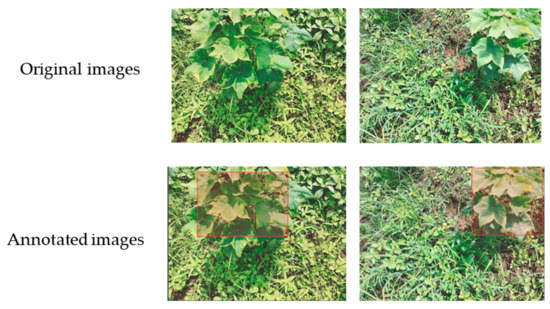
Figure 2.
Annotation of acquired sample images of cotton crop field using labeling tool Makesense®.
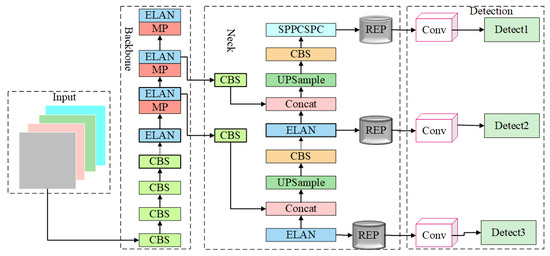
Figure 3.
Network structure of the YOLOv7 object detection model used for cotton crop plant recognition in this study. (CBS–Convolutional + Batch Normalization + SiLU; ELAN–Efficient Layer Aggregation Network; Conv–Conventional; REP–Reparameterization; Con–concatenation).
2.1.2. Performance Evaluation of the Plant Recognition Model
The model’s effectiveness for detecting target cotton plants was evaluated using metrics of Accuracy, Precision, Recall, F1-score, and Mean Average Precision (mAP). Here, accuracy determines model’s performance across all classes and is calculated as the ratio of correct model predictions to the total number of predictions (Equation (1)). Precision outlines the number of true positive predictions out of all the positive predictions (Equation (2)). Recall quantifies the actual positives in the dataset that were correctly predicted as positives by the model (Equation (3)), and F1-score measures effectiveness of the model to optimally trade-off with confidence between Precision and Recall values. The mAP calculates a score by comparing the detected box to the ground truth bounding box. The model’s detections are more precise at higher scores and shown by the area under a precision-recall curve. “mAP 0.5” refers to the mean Average Precision (mAP) at a threshold of 0.5 for intersection over the union (IoU). “mAP_0.5:0.95” is a mAP over various IoU thresholds, ranging from 0.5 to 0.95.
where TP is true positives that indicate instances when the model correctly identified the objects in the images, TN is true negatives that indicate instances when the model did not identify any object when it was not present, FP is false positives that represents instances when the model incorrectly identified an object when it was not present, and FN is false negatives that indicate instances when the model did not identify an object when it was present. In this study, a TP is a “cotton plant” and a TN is a “no plant”.
Accuracy = (TP + TN)/(TP + TN + FP + FN)
Precision = TP/(TP + FP)
Recall = TP/(TP + FN)
F1-score = 2 × Recall × Precision/(Recall + Precision)
2.1.3. Model Training
The YOLOv7 object detection model was trained on a custom dataset of 2500 cotton plant images collected from cotton fields. These images covered different growth stages of the crop under various lighting conditions. The images were manually annotated with bounding boxes around the whole plant using the “LabelImg, 1.7.0” tool and then divided into 70% portion for training, 20% for validation, and 10% for testing. Plant recognition model was fine-tuned on collected plant dataset, and the best fit hyperparameters identified for the optimized model were batch size =16; input image size = 640 × 640; epoch = 100, learning rate = 0.01; iou_thres = 0.6; momentum = 0.937; weight_delay =0.0005; warmp_epoch = 3.0; and Optimizer = Adam. These parameters were identified based on performance evaluation metrics. The flow chart of the dataset preparation, model training, and validation is shown in Figure 4. The optimized model was validated and tested on respective datasets (Figure 5), following which the validated model was deployed on Raspberry Pi single-board computer through Pycharm 2018.3.1 (JetBrains, St. Petersburg, Russia) for plant recognition on the go (real time). Raspberry Pi connects to the web camera through a USB cable to capture images within its field of view for plant recognition. When a cotton plant is detected, the output signal is converted into a Boolean signal and subsequently sent to the Arduino microcontroller of the ECU via PySerial 3.5.
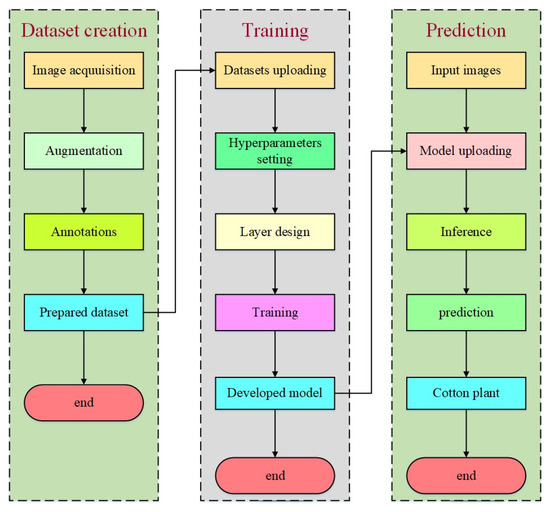
Figure 4.
Flow chart for the dataset preparation, model training, and model prediction validation.
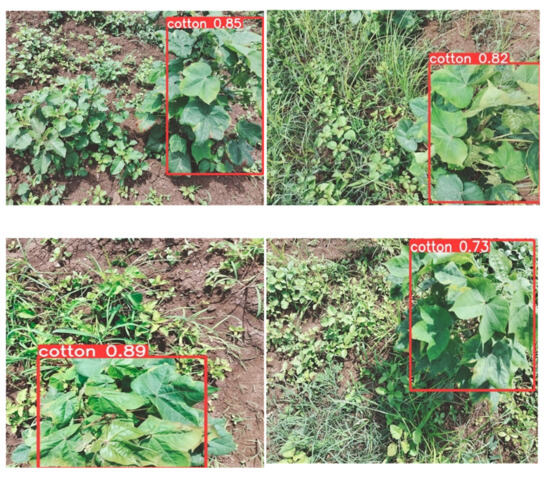
Figure 5.
Performance of the plant recognition model demonstrated on sample images from test dataset.
2.2. Electronic Control Unit
An electronic control unit (ECU, Figure 6) was developed to control the stepper motor of fertilizer metering mechanism, based on the outcomes of plant recognition model. This unit consists of a microcontroller (Arduino UNO, 2KB SRAM, Smart Projects, Monza, Italy), a motor driver (TB6600, Unimech Engineering, Mumbai, India), and a Hall effect sensor (Saket Electronics, Pune, India) for forward speed measurement. Following the plant recognition outcome, PySerial communication is initiated to enable transmission of signals from Raspberry Pi microprocessor of the PRU to the Arduino UNO microcontroller. This ensures coordinated motor control of the fertilizer metering mechanism to release fertilizer.

Figure 6.
Circuit box showing electronic control unit with (1) motor driver, (2) Arduino Uno microcontroller, (3) Raspberry Pi microprocessor (from plant recognition unit), (4) camera connection port, and (5) motor connector socket.
2.3. Fertilizer Metering Unit
The fertilizer metering unit consists of a fluted roller metering mechanism, hopper, fertilizer tube, and shifting unit (Figure 7). The fluted-roller-type mechanism (36 mm diameter, 40 mm length) is deployed for achieving even and uniform fertilizer distribution [32,33]. A stepper motor was used to regulate the fluted roller via metering shaft by adjusting the rotational speed in sync with the forward speed. Stepper motor was controlled by the ECU through motor driver, based on the signal received from PRU. Fertilizer dispensed from the hopper is dispensed near the targeted plant owing to the metering unit’s rotation. The duration of rotation of the fluted roller directly affects the fertilizer flow rate. To modify this, the fertilizer metering shaft can be adjusted using a shifting lever.

Figure 7.
A fertilizer metering mechanism deployed in the automated site-specific fertilizer applicator prototype (all dimensions are in mm).
2.4. Prototype Evaluation Testbed
The prototype of automated variable-rate fertilizer applicator was evaluated in-house on a custom developed testbed (Figure 8). The testbed consists of a plant conveying unit that facilitates movement of cotton plants along the frame length (L × B × H = 3160 × 220 × 330 mm). A lead screw with a pitch of 12.7 mm transmitted power from the AC motor (220V, Nbe Motor Pvt. Ltd., Ahmedabad, India) to a roller that anchors the crop holding platform movement at a customizable speed. The crop holding unit with slit, measuring 1900 mm in length, was designed to vertically support plants and maintain a custom-selected spacing between them. Artificial plants mimicking cotton plants were placed in those slits of the plant holding unit for evaluations. A Hall effect sensor connected to the ECU was installed at one end of lead screw to measure forward speed of the plant conveying unit [34,35].
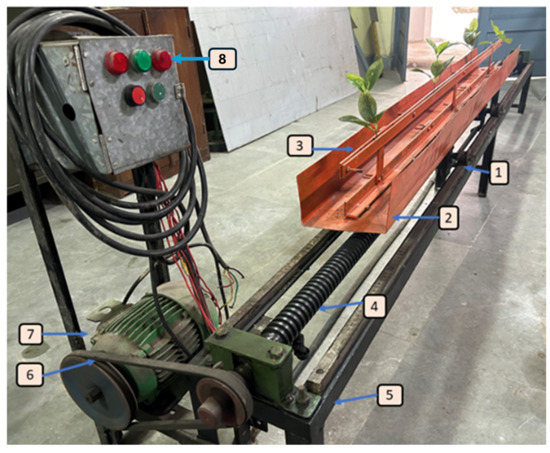
Figure 8.
Testbed developed for evaluation of the automated site-specific fertilizer applicator for cotton crops. The testbed consists of (1) roller, (2) crop holding unit, (3) crop holding slit, (4) lead screw, (5) testbed frame, (6) belt pulley, (7) AC motor to operate plant conveying unit, and (8) AC motor driver and operating unit.
2.5. Prototype Assembly and Performance Evaluation
Prototype of AI-enabled automated variable-rate fertilizer applicator (Figure 9) was assembled and evaluated for applying micro granular fertilizer on the testbed. The camera was positioned 0.21 m ahead of the fertilizer discharge tube to compensate for the computational delay between image capture and the actual fertilizer application. The webcam was placed 16 cm vertically above the plants that were spaced at 60 cm on the plant conveying unit. Once the evaluation speed of conveying unit was selected and maintained, the prototype performance was evaluated.

Figure 9.
(a) Process flow chart of the developed automated variable-rate cotton fertilizer applicator system and (b) assembled prototype for testbed evaluation with (1) electronic control unit, (2) stepper motor, (3) webcam, (4) crop holding unit, (5) crop holding slit, (6) lead screw, (7) testbed frame, (8) belt pulley, (9) AC motor to operate plant conveying unit, and (10) AC motor driver and operating unit.
For evaluations, urea and DAP (Diammonium Phosphate) fertilizers were used to determine the effectiveness of the fertilizer applicator. The bulk density, granular diameter, angle of internal friction, and angle of repose for both fertilizers were determined to be 0.705 and 0.785 g/cm3, 4.44 ± 0.28 mm and 4.85 ± 0.29 mm, 16° and 18°, and 34.92° and 30.92°, respectively. The fertilizer application rate recommended for cotton plants [34] is 150:40:20 kg/ha of NPK (Nitrogen, Phosphorous, and Potassium) fertilizers. Given a row and plant spacing of 70 cm × 60 cm, each plant should receive about 13.10 g of urea or 5.80 g of DAP. In field conditions, farmers can adjust the exposure length of the fluted roller metering mechanism to customize fertilizer quantities and achieve different NPK ratios.
The prototype was evaluated for these inconsistencies at five forward speeds of the crop conveying unit (0.2, 0.4, 0.6, 0.8, and 1 km/h) and four exposure lengths of fluted rollers in the metering unit. A list of independent and dependent parameters for prototype evaluation is mentioned in Table 1, and Figure 10 illustrates a scenario of evaluation after the micro-granular fertilizer has been applied by the prototype. The applicator’s accuracy was investigated using mean absolute percentage error (MAPE, Equation (1)) and mean absolute deviation (MAD, Equation (2)). MAPE quantifies the disparity between the recommended and actual delivered application doses, while MAD signifies the average deviation.
where e_i is the difference between delivered and recommended fertilizer amount, and T_i is delivered fertilizer amount, for the ith observation. The collected data was analyzed using statistical analysis, as detailed in the experimental plan presented in Table 1. Figure 10 shows a sample image with fertilizer dispensed near plants by the prototype developed in this study for autonomous variable-rate application.

Table 1.
Independent and dependent factors selected for testbed evaluation of prototype for automated site-specific fertilizer applicator.

Figure 10.
Image showing fertilizer dispensed near plants by the automated variable-rate fertilizer applicator.
3. Results and Discussion
3.1. Performance of Plant Recognition Model
Precision, Recall, and mAP metrices were used to evaluate performance of the developed plant recognition model. The box and objectness loss plots of the developed plant recognition model demonstrate that the loss decreases as the epoch increases throughout the training and validation process (Figure 11). The constructed model successfully identified the cotton plant with incurring losses of 2.51% and 1.38% for bounding boxes and object boxes, respectively, over 100 epochs. Pertaining to in-house evaluation, there was only one class (i.e., plant) to be identified; therefore, no misidentification was observed. The model’s Precision and Recall improved as training epochs increased and eventually reached peak values. Precision demonstrated an upward trend with increasing confidence scores, peaking at 1 when the confidence score reached 0.669. Beyond this threshold, there was no significant improvement in accuracy based on confidence levels. At a confidence level of 0.00, the Recall was 0.97 (Figure 12). Precision values remained constant as Recall increased to a certain point, after which Precision decreased as Recall increased (Figure 13). This occurred as the number of positives increased. At a confidence level of 0.87, the F1-score reached its peak of 0.87 (Figure 13), indicating a higher alignment between Recall and Precision.
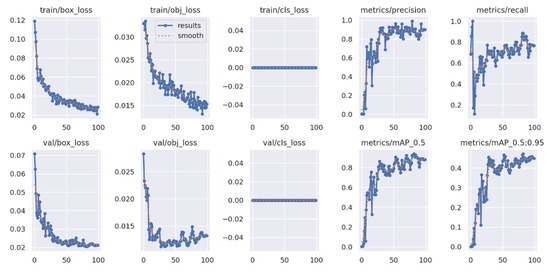
Figure 11.
Box loss, objectness loss, class loss, Precision, Recall, and mean average precision (mAP) curves for training and validation of the plant recognition model for cotton plant identification.

Figure 12.
(a) Precision–confidence and (b) Recall–confidence curves for the plant recognition models obtained during model training.

Figure 13.
(a) Precision–Recall and (b) F1-score–confidence curves for the plant recognition models obtained during model training.
3.2. Effect of Fluted Roller Speed of Metering Unit on Fertilizer Discharge at Different Exposure Lengths
The speed of the fluted roller of fertilizer metering unit was incrementally varied between 10 and 100 rpm using the stepper motor of the ECU to observe changes in fertilizer discharge rate variations at four different exposure lengths (100, 75, 50, and 25%) of the total metering shaft length. Discharged fertilizer amounts were recorded (Figure 14), where for urea, the discharge rates ranged from a minimum of 1.12 g/s (at 10 rpm and 25% exposure) to a maximum of 39.12 g/s (at 100 rpm and full exposure). For DAP, discharge rates varied between 1.52 g/s (at 10 rpm and 25% exposure) and 46.21 g/s (at 100 rpm and full exposure).

Figure 14.
Evaluation of granular fertilizer delivery rate for (a) urea and (b) Diammonium Phosphate (DAP), with the speed of fluted roller of metering unit varied using stepper motor.
3.3. Effect of Forward Speed on Recommended Fertilizer Amount at Fixed Shaft Exposure Lengths
Figure 15 presents the deviation between actual and recommended fertilizer amounts at constant shaft exposure lengths for both urea and DAP fertilizers. The MAPE was found to be 6.15% for urea and 9.1% for DAP, with MAD of 0.81 g/plant for urea and 1.20 g/plant for DAP. These results align with those reported by [16], which observed a MAPE of 8.9% and a MAD of 1.03 g/plant. Statistical analysis indicated that the forward speed of the plant conveying unit did not significantly influence the fertilizer delivery amounts (p > 0.05 for both urea and DAP). This aligns with findings from [17,36], which also showed that linear speed did not significantly impact on the actual fertilizer delivery (p > 0.05). The developed system demonstrated an application accuracy averaging 86%, within a range of 85–87%. Accuracy was assessed by subtracting the delivered fertilizer amount from the recommended application rate for both urea and DAP micro-granular fertilizers. Consistent with these results, Kim et al. [37] reported granular applicator precision between 81.9% and 97.4%, exceeding the 80% threshold typically regarded as acceptable for system accuracy.
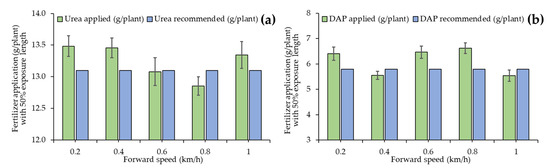
Figure 15.
Comparison of the fertilizer delivered by the developed automated variable-rate fertilizer applicator and recommended dosage at various forward speeds for (a) urea and (b) Diammonium Phosphate (DAP).
3.4. Effect of Exposure Length on Fertilizer Amount at Different Forward Speeds
Figure 16 illustrates the variation in the application rate of urea and DAP granular fertilizers with varying exposure lengths of the metering shaft at different forward speeds. A two-way ANOVA indicated that exposure lengths had, and forward speeds did not have a significant impact on fertilizer application (p > 0.05). There was a significant increase in fertilizer discharge as the exposure length of the fertilizer metering shaft increased. Nevertheless, the ECU consistently discharged fertilizer quantities closer to the recommended dosage for urea and DAP granules across all tested forward speeds.

Figure 16.
Variation in fertilizer amount for (a) Urea and (b) Diammonium Phosphate (DAP) with different exposure lengths at different forward speeds.
3.5. Effect of Forward Speed on Missing Plant Index
The evaluation of the impact of forward speed of the plant conveying unit on missing plant index (MPI) was also conducted. This index is a measure indicating the percentage of plants not receiving fertilizer. The analysis revealed direct correlation between forward conveying speeds and MPI (Figure 17), suggesting the likelihood of missing plants for fertilizer application at higher forward speeds (p < 0.05). The MPIs were in the ranges of 0.22–3.35% for urea and 0.22–3.77% for DAP when evaluated at selected range of forward speeds of conveying unit. These values however were fairly lower than the MPI of 6.25% as reported by a study by Hasan et al. [38]. Therefore, optimizing forward speed to achieve higher efficiency in fertilizer application is critical for agricultural operations.
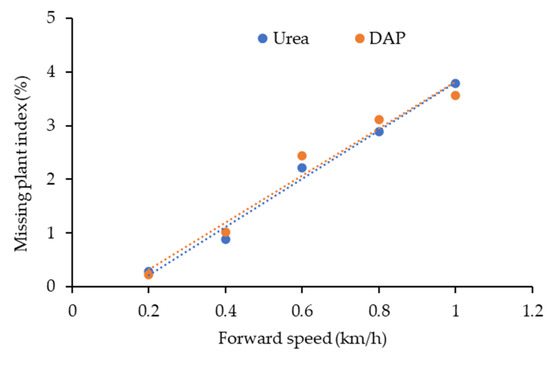
Figure 17.
Effect of forward speeds on missing fertilizer application for plants. DAP: Diammonium Phosphate.
3.6. Effect of Illumination on Fertilizer Delivery
The effect of different lighting conditions on the fertilizer delivery was also evaluated for the AI-computer vision-based fertilizer applicator. An adjustable LED light, equipped with a voltage regulator, was installed near the camera to allow control of illumination intensity within the camera’s field of view. Three lighting levels were tested: 3000, 5000, and 7000 lux, to assess potential variations in the fertilizer discharge amounts for urea and DAP (Figure 18). Results indicate that discharge amounts remained stable across all illumination levels for both fertilizers, regardless of the selected forward speeds of the plant conveying unit and the varied shaft exposure lengths of the fertilizer metering unit (p < 0.05). The results suggest that fertilizer delivery was unaffected by illumination changes, indicating that the plant recognition model reliably identified cotton plants across a range of lighting conditions, thereby outlining system’s robustness against varying environmental lighting, ensuring consistent fertilizer application under diverse ambient conditions.

Figure 18.
Effect of ambient illumination on fertilizer discharge for (a) Urea and (b) DAP (Diammonium Phosphate) from the automated variable-rate fertilizer applicator prototype.
The system has so far been tested under controlled conditions, and real field trials are needed to establish its practical performance. The developed system can be scaled to field conditions and is expected not to get impacted in performance due to varying illumination conditions. However, rigorous field trials would be needed to evaluate optimal performance with respect to environment conditions, soil surface undulations, forward speed of operation, slippage, and soil moisture conditions. The developed system also has the potential to be scaled for other crop types by retraining the detection model and adjusting the metering mechanism. A limitation of the developed system is that fertilizer is applied based on plant detection rather than the actual nutrient needs of soil-crop interaction. Future research refinements could focus on integrating soil health sensors to enhance precision in fertilizer application. The system currently deploys Raspberry Pi computer for detecting cotton plants and is relatively slow in performance that could hinder efficiency in field conditions; advanced microcomputing systems could be used to alleviate this concern and enable system operation at higher speeds in the field. As in its current form, the Raspberry Pi-based system can be deployed for walk-behind-type fertilizer application systems that operate at 0.2–1.0 km/h.
Final outcomes of this research can be considered as an automated prototype of retrofit with PRU and ECU that can be integrated with the existing fertilizer application systems. Therefore, excessive fabrication or chassis designs may not be needed when mounting over existing walk-behind-type or tractor-based applicators. Although for tractor-based applicators, processing refinements within the PRU and ECU would be needed. In general, fertilizer granules are metered by the rollers in the metering mechanism which then fall through the tube. In this arrangement, field undulations have not been reported to impact the fall of fertilizer as the releasing tubes are not in touch with the ground. However, through further research, there could be a possibility of enhancing the efficiency of fertilizer application against noise and vibration resulting from field undulations.
4. Conclusions
An automated site-specific fertilizer applicator was developed based on cotton crop plant identification using AI-computer vision. The system deployed YOLOv7 object detection model to identify cotton plants in real-time, with Precision, Recall, F1-score, and mAP values of 1.00 at 0.666 confidence, 0.97 at 0% confidence, 0.87 at 15.1% confidence, and 0.906 at 50% confidence, respectively. Based on identification, the integrated ECU could effectively control the fertilizer metering unit with a high precision of approximately 86% to apply fertilizer near the identified plant. Pertaining to fertilizer application, the maximum deviation between fertilizer applied and recommended dose was below 10%, citing accurate placement of fertilizer near the plant. No notable impact of forward speeds and illumination was noted on the amount of fertilizer discharged, thereby highlighting the potential robustness of the system under varied field conditions. However, future field studies may be required to evaluate the performance under varied conditions. The designed applicator significantly upgrades placement method of fertilizer application, at minimum loss, maximum uniformity, with site-specific application capabilities. The system could be deployed as a retrofit in existing walk-behind-type fertilizer applicators as well as tractor-based applicators, and with some modifications in the on-board computing and control system. This system could eventually provide economic and environmental advantages by delivering a metered quantity of fertilizer to the target plants.
Author Contributions
Conceptualization, A.C. and P.S.; methodology, A.C. and A.K.P.; software, A.C.; validation, A.C., P.S. and A.K.C.; formal analysis, A.C. and P.S.; investigation, A.C. and A.K.C.; resources, P.S. and A.K.C.; data curation, A.C. and A.K.P.; writing—original draft preparation, A.C. and A.K.C.; writing—review and editing, P.S., A.K.C. and A.K.P.; visualization, A.C., P.S. and A.K.C.; supervision, P.S.; project administration, P.S. All authors have read and agreed to the published version of the manuscript.
Funding
This research received no external funding.
Institutional Review Board Statement
Not applicable.
Informed Consent Statement
Not applicable.
Data Availability Statement
Data is contained within the article.
Acknowledgments
Research facilities of the Indian Institute of Technology Kharagpur.
Conflicts of Interest
The authors declare no conflicts of interest.
References
- Wu, J.; Chen, X. Present situation, problems, and countermeasures of cotton production mechanization de-velopment in Xinjiang Production and Construction Corps. Trans. Chin. Soc. Agric. Eng. 2015, 31, 5–10. [Google Scholar] [CrossRef]
- Cotton: World Markets and Trade. 2023. Available online: https://apps.fas.usda.gov/psdonline/circulars/cotton.pdf (accessed on 30 April 2023).
- El Naim, A.M. Growth and Yield of Seed Cotton Response to Plant Spacing and Weeding Frequency under Flood Irrigation. J. Renew. Agric. 2013, 1, 27. [Google Scholar] [CrossRef]
- Jalota, S.; Sood, A.; Chahal, G.; Choudhury, B. Crop water productivity of cotton (Gossypium hirsutum L.)–wheat (Triticum aestivum L.) system as influenced by deficit irrigation, soil texture and precipitation. Agric. Water Manag. 2006, 84, 137–146. [Google Scholar] [CrossRef]
- Wang, H.; Wu, L.; Cheng, M.; Fan, J.; Zhang, F.; Zou, Y.; Chau, H.W.; Gao, Z.; Wang, X. Coupling effects of water and fertilizer on yield, water and fertilizer use efficiency of drip-fertigated cotton in northern Xinjiang, China. Field Crop. Res. 2018, 219, 169–179. [Google Scholar] [CrossRef]
- Bronson, K.F.; Keeling, J.W.; Booker, J.D.; Chua, T.T.; Wheeler, T.A.; Boman, R.K.; Lascano, R.J. Influence of Landscape Position, Soil Series, and Phosphorus Fertilizer on Cotton Lint Yield. Agron. J. 2003, 95, 949–957. [Google Scholar] [CrossRef]
- Dong, H.; Kong, X.; Li, W.; Tang, W.; Zhang, D. Effects of plant density and nitrogen and potassium fertilization on cotton yield and uptake of major nutrients in two fields with varying fertility. Field Crop. Res. 2010, 119, 106–113. [Google Scholar] [CrossRef]
- Mózner, Z.; Tabi, A.; Csutora, M. Modifying the yield factor based on more efficient use of fertilizer—The environmental impacts of intensive and extensive agricultural practices. Ecol. Indic. 2012, 16, 58–66. [Google Scholar] [CrossRef]
- Astaneh, N.; Bazrafshan, F.; Zare, M.; Amiri, B.; Bahrani, A. Nano-fertilizer prevents environmental pollution and improves physiological traits of wheat grown under drought stress conditions. Sci. Agropecu. 2021, 12, 41–47. [Google Scholar] [CrossRef]
- Grant, K.N.; Macrae, M.L.; Rezanezhad, F.; Lam, W.V. Nutrient Leaching in Soil Affected by Fertilizer Application and Frozen Ground. Vadose Zone J. 2019, 18, 1–13. [Google Scholar] [CrossRef]
- Ombódi, A.; Saigusa, M. Broadcast application versus band application of polyolefin-coated fertilizer on green peppers grown on andisol. J. Plant Nutr. 2000, 23, 1485–1493. [Google Scholar] [CrossRef]
- Crozier, C.R.; Roberson, G.T. Granular Fertilizer Spreader Swath Uniformity Achieved at Varying Target Application Rates. Crop. Manag. 2014, 13, 1–6. [Google Scholar] [CrossRef]
- Schumann, A.W.; Miller, W.M.; Zaman, Q.U.; Hostler, K.H.; Buchanon, S.; Cugati, S. Variable rate granular fertilization of citrus groves: Spreader performance with single-tree prescription zones. Appl. Eng. Agric. 2006, 22, 19–24. [Google Scholar] [CrossRef]
- Yildirim, Y.; Parish, R.L. Band application performance of single-disc rotary fertilizer spreaders. Appl. Eng. Agric. 2013, 29, 149–153. [Google Scholar] [CrossRef]
- Chandel, N.S.; Mehta, C.R.; Tewari, V.K.; Nare, B. Digital map-based site-specific granular fertilizer application system. Curr. Sci. 2016, 111, 1208–1213. Available online: https://www.jstor.org/stable/24909128 (accessed on 30 April 2023). [CrossRef]
- May, S.; Kocabiyik, H. Design and development of an electronic drive and control system for micro-granular fertilizer metering unit. Comput. Electron. Agric. 2019, 162, 921–930. [Google Scholar] [CrossRef]
- Alameen, A.A.; Al-Gaadi, K.A.; Tola, E. Development and performance evaluation of a control system for variable rate granular fertilizer application. Comput. Electron. Agric. 2019, 160, 31–39. [Google Scholar] [CrossRef]
- Gao, Y.; Qian, X.; Sun, B.; Huang, W. Solid Fertilizer Broadcaster. Patent No. CN102498811B, 27 March 2013. [Google Scholar]
- Sun, Y.; Zhao, X.; Chen, M.; Liu, L. Adjustable Depth Drilling Fertilizer Distributor. Patent No. CN210406184U, 28 April 2020. [Google Scholar]
- Farooque, A.A.; Hussain, N.; Schumann, A.W.; Abbas, F.; Afzaal, H.; McKenzie-Gopsill, A.; Esau, T.; Zaman, Q.; Wang, X. Field evaluation of a deep learning-based smart variable-rate sprayer for targeted application of agrochemicals. Smart Agric. Technol. 2022, 3, 100073. [Google Scholar] [CrossRef]
- Søgaard, H.; Lund, I. Application Accuracy of a Machine Vision-controlled Robotic Micro-dosing System. Biosyst. Eng. 2007, 96, 315–322. [Google Scholar] [CrossRef]
- Diao, Z.; Guo, P.; Zhang, B.; Yan, J.; He, Z.; Zhao, S.; Zhao, C.; Zhang, J. Spatial-spectral attention-enhanced Res-3D-OctConv for corn and weed identification utilizing hyperspectral imaging and deep learning. Comput. Electron. Agric. 2023, 212, 108092. [Google Scholar] [CrossRef]
- Diao, Z.; Guo, P.; Zhang, B.; Zhang, D.; Yan, J.; He, Z.; Zhao, S.; Zhao, C. Maize crop row recognition algorithm based on improved UNet network. Comput. Electron. Agric. 2023, 210, 107940. [Google Scholar] [CrossRef]
- Liu, J.; Abbas, I.; Noor, R.S. Development of Deep Learning-Based Variable Rate Agrochemical Spraying System for Targeted Weeds Control in Strawberry Crop. Agronomy 2021, 11, 1480. [Google Scholar] [CrossRef]
- Gao, P.; Zhang, Y.; Zhang, L.; Noguchi, R.; Ahamed, T. Development of a Recognition System for Spraying Areas from Unmanned Aerial Vehicles Using a Machine Learning Approach. Sensors 2019, 19, 313. [Google Scholar] [CrossRef]
- Zhao, X.; Wang, X.; Li, C.; Fu, H.; Yang, S.; Zhai, C. Cabbage and Weed Identification Based on Machine Learning and Target Spraying System Design. Front. Plant Sci. 2022, 13, 924973. [Google Scholar] [CrossRef] [PubMed]
- Gildow, M.; Aloysius, N.; Gebremariam, S.; Martin, J. Fertilizer placement and application timing as strategies to reduce phosphorus loading to Lake Erie. J. Great Lakes Res. 2016, 42, 1281–1288. [Google Scholar] [CrossRef]
- Prasertsak, P.; Freney, J.; Denmead, O.; Saffigna, P.; Prove, B.; Reghenzani, J. Effect of fertilizer placement on nitrogen loss from sugarcane in tropical Queensland. Nutr. Cycl. Agroecosystems 2002, 62, 229–239. [Google Scholar] [CrossRef]
- Zhang, Y.-Q.; Pang, L.-L.; Yan, P.; Liu, D.-Y.; Zhang, W.; Yost, R.; Zhang, F.-S.; Zou, C.-Q. Zinc fertilizer placement affects zinc content in maize plant. Plant Soil 2013, 372, 81–92. [Google Scholar] [CrossRef]
- Chouriya, A.; Soni, P.; Thomas, E.; Mahore, V.; Patidar, P.; Nagar, H. Detection of Cotton Plants Using the YOLOv7 Deep Learning Model. In Proceedings of the 2023 2nd International Conference on Futuristic Technologies (INCOFT), Karnataka, India, 24–26 November 2023; pp. 1–4. [Google Scholar]
- Yang, H.; Liu, Y.; Wang, S.; Qu, H.; Li, N.; Wu, J.; Yan, Y.; Zhang, H.; Wang, J.; Qiu, J. Improved Apple Fruit Target Recognition Method Based on YOLOv7 Model. Agriculture 2023, 13, 1278. [Google Scholar] [CrossRef]
- Gurjar, B.; Sahoo, P.K.; Kumar, A. Design and development of variable rate metering system for fertilizer application. J. Agric. Eng. 2017, 54, 12–21. [Google Scholar] [CrossRef]
- Chouriya, A.; Thomas, E.V.; Soni, P.; Patidar, V.K.; Dhruw, L. Development and evaluation of a machine vision-based cotton fertilizer applicator. Span. J. Agric. Res. 2024, 22, e0201. [Google Scholar] [CrossRef]
- Chouriya, A.; Tewari, V.K.; Soni, P.; Singh, N.; Kumar, P. Development of microcontroller-based draft measuring system using Xbee technology. Cogent Eng. 2024, 11, 2331178. [Google Scholar] [CrossRef]
- Mahore, V.; Patidar, P.; Soni, P.; Nagar, H.; Chouriya, A.; Paul, A. An IoT-Enabled Tractor Data Sensing System for Precision Agriculture. In Proceedings of the 2023 2nd International Conference on Futuristic Technologies (INCOFT), Karnataka, India, 24–26 November 2023; pp. 1–4. [Google Scholar]
- Tola, E.; Kataoka, T.; Burce, M.; Okamoto, H.; Hata, S. Granular fertiliser application rate control system with integrated output volume measurement. Biosyst. Eng. 2008, 101, 411–416. [Google Scholar] [CrossRef]
- Kim, Y.; Kim, H.; Ryu, K.; Rhee, J. Fertiliser application performance of a variable-rate pneumatic granular applicator for rice production. Biosyst. Eng. 2008, 100, 498–510. [Google Scholar] [CrossRef]
- Hasan, M.; Rahman, M.A.; Ashik-E-Rabbani, M. Design and development of manually push type USG applicator. Agric. Eng. Int. CIGR J. 2018, 20, 80–87. [Google Scholar]
Disclaimer/Publisher’s Note: The statements, opinions and data contained in all publications are solely those of the individual author(s) and contributor(s) and not of MDPI and/or the editor(s). MDPI and/or the editor(s) disclaim responsibility for any injury to people or property resulting from any ideas, methods, instructions or products referred to in the content. |
© 2025 by the authors. Licensee MDPI, Basel, Switzerland. This article is an open access article distributed under the terms and conditions of the Creative Commons Attribution (CC BY) license (https://creativecommons.org/licenses/by/4.0/).