Article

Visual Signal Recognition with ResNet50V2 for Autonomous ROV Navigation in Underwater Environments

by
Cristian H. Sánchez-Saquín
1,2,
Alejandro Gómez-Hernández
1,*,
Tomás Salgado-Jiménez
2,
Juan M. Barrera Fernández
2,
Leonardo Barriga-Rodríguez
2 and
Alfonso Gómez-Espinosa
3,*
1
Division of Engineering in Automation Technologies, Universidad Tecnológica de Querétaro (UTEQ), Av. Pie de la Cuesta 2501, Santiago de Querétaro 76148, Mexico
2
Engineering and Industrial Development Center (CIDESI), Av. Pie de la Cuesta 702, Santiago de Querétaro 76125, Mexico
3
Escuela de Ingenieria y Ciencias, Tecnologico de Monterrey, Av. Epigmenio González 500, Fracc. San Pablo, Santiago de Querétaro 76130, Mexico
*
Authors to whom correspondence should be addressed.
Automation 2025, 6(4), 51; https://doi.org/10.3390/automation6040051
Submission received: 6 August 2025 / Revised: 21 September 2025 / Accepted: 22 September 2025 / Published: 1 October 2025
(This article belongs to the Section Robotics and Autonomous Systems)

Abstract

This study presents the design and evaluation of AquaSignalNet, a deep learning-based system for recognizing underwater visual commands to enable the autonomous navigation of a Remotely Operated Vehicle (ROV). The system is built on a ResNet50 V2 architecture and trained with a custom dataset, UVSRD, comprising 33,800 labeled images across 12 gesture classes, including directional commands, speed values, and vertical motion instructions. The model was deployed on a Raspberry Pi 4 integrated with a TIVA C microcontroller for real-time motor control, a PID-based depth control loop, and an MPU9250 sensor for orientation tracking. Experiments were conducted in a controlled pool environment using printed signal cards to define two autonomous trajectories. In the first trajectory, the system achieved 90% success, correctly interpreting a mixed sequence of turns, ascents, and speed changes. In the second, more complex trajectory, involving a rectangular inspection loop and multi-layer navigation, the system achieved 85% success, with failures mainly due to misclassification resulting from lighting variability near the water surface. Unlike conventional approaches that rely on QR codes or artificial markers, AquaSignalNet employs markerless visual cues, offering a flexible alternative for underwater inspection, exploration, and logistical operations. The results demonstrate the system’s viability for real-time gesture-based control.

1. Introduction

The growing demand to explore and preserve aquatic ecosystems has accelerated the development of advanced underwater image processing techniques [1]. These tools are essential for operating under challenging conditions, enabling applications such as marine biodiversity conservation, environmental monitoring, and submerged infrastructure maintenance [2]. However, visual data in these environments is often degraded by turbidity, uneven lighting, and color distortion, significantly hindering perception and decision-making. Recent surveys and experimental studies confirm that light attenuation, refraction, and color variability remain persistent challenges in underwater robotic vision, underscoring the need for robust perception systems [3,4].
To address these issues, recent studies have proposed enhancement methods based on multi-scale local contrast adjustment and deep fusion models [5], as well as adaptive style transfer techniques tailored to underwater imagery [6]. Domain adaptation strategies, such as feature alignment and unsupervised learning, have proven effective in narrowing the gap between training and deployment conditions, particularly when working with synthetic or limited datasets [7,8]. These advancements have contributed to the increasing adoption of deep neural networks, especially Convolutional Neural Networks (CNNs) and Residual Networks (ResNets), for tasks such as object detection, visual signal recognition, and autonomous navigation in underwater environments [2]. While architectures such as EfficientNet and Vision Transformers have demonstrated strong performance in general-purpose vision tasks, their applicability to underwater environments remains limited by computational overhead and domain generalization issues. Recent studies show that ResNet variants offer a favorable balance between accuracy and efficiency [9], and comparative evaluations confirm the robustness and deployment suitability of ResNet-based models relative to EfficientNet and ViT alternatives [10]. For these reasons, ResNet50V2 was selected for the present study.
Deep learning techniques have revolutionized object detection in complex marine environments [11]. Their capacity for processing large volumes of visual data enables the identification of organisms, objects, and structures both on the surface and underwater—invaluable in marine engineering, maritime security, and ecological research [11,12]. Techniques such as transfer learning and image preprocessing address limitations arising from sparse or imbalanced datasets [10], improving model accuracy even under variable conditions.
CNNs have proven effective for diverse tasks, including marine organism recognition [13], coral detection [14,15,16,17,18], fish classification [18], infrastructure inspection [19,20,21,22,23,24,25,26,27,28], and underwater gesture recognition for human–robot interaction [25,26,27,28,29,30,31,32,33,34,35,36,37]. In particular, networks such as ResNet perform strongly under varying underwater conditions due to their ability to generalize across different levels of visibility and color distortion [11,38]. ResNet, introduced in [39], is based on residual learning and incorporates skip connections that facilitate information flow across layers. This structure enables training deeper models while mitigating vanishing gradients and performance degradation. Variants that incorporate bottleneck blocks further improve efficiency and accuracy over traditional architectures such as VGG [39,40].
These advantages make ResNet well-suited for underwater environments, where illumination changes, color absorption, and turbidity pose additional challenges [11]. Its ability to adapt to such complexities has led to its adoption in numerous applications, including marine organism classification and submerged infrastructure inspection [18,19,20,21,22,23,27,28,33].
Robust training also requires large and diverse datasets. Having a substantial number of representative images reduces reliance on artificial augmentation, which can introduce unrealistic patterns and harm model generalization [12]. While augmentation remains useful, task-specific datasets provide stronger foundations for reliable classification.
Developing a task-specific dataset such as the Underwater Visual Signals Recognition Dataset (UVSRD) is therefore essential to optimizing machine learning models for underwater signal classification. A lack of diverse and representative samples can hinder a model’s ability to learn critical features of the underwater environment [12,36], while a well-curated dataset improves accuracy and generalization, facilitates learning, and reduces bias [41]. Transfer learning techniques can also be effectively applied, with pretrained models on large datasets such as ImageNet fine-tuned for underwater tasks, accelerating training and boosting performance [41].
Building on these insights, the present work proposes AquaSignalNet, a ResNet50 V2-based model designed to recognize 12 underwater visual commands, including directional gestures, PWM-based speed signals, and vertical movement instructions. The convolutional backbone of ResNet50V2 is used as a feature extractor, while the dense layers are adapted to optimize classification for underwater tasks [42]. This design builds upon prior contributions in underwater image enhancement [43,44,45,46,47,48], deep learning architectures for visual recognition [44,45,46,47,48,49,50,51,52,53,54], transfer learning strategies [55], and specialized datasets for marine applications [56,57]. System validation was performed using two printed-signal-based trajectories in a controlled pool environment. These tests evaluated the ROV’s ability to interpret and act upon a sequence of underwater commands—rotating, adjusting speed, ascending, and descending—without manual intervention.
Unlike traditional approaches based on QR codes, ArUco tags, or fiducial markers, which are task-specific and not interpretable by human divers, this system leverages intuitive underwater signs. Being universally understood regardless of language, they are ideal for collaborative scenarios between ROVs and divers or for field deployment in international contexts. Furthermore, each command can be visually confirmed in real time, allowing human operators to validate the intended ROV action by simply observing the symbol. By contrast, QR-based systems encode abstract instructions that are only interpretable by algorithms, preventing divers from understanding or anticipating the ROV’s behavior. AquaSignalNet therefore offers a more general, transparent, and flexible alternative for underwater missions where reliability, simplicity, and human-readability are essential.

2. Materials and Methods

2.1. Underwater Visual Signaling

Underwater visual signaling enables intuitive communication between divers and autonomous systems in environments where radio or acoustic transmission is limited. These gestures are widely used for commanding Remotely Operated Vehicles (ROVs) during inspection, rescue, and exploration tasks [25,26,27,28,29]. Effective recognition of such signals under varying visibility, background, and lighting conditions is essential for reliable autonomous response [19,20].

2.2. Deep Neural Networks for Visual Recognition

CNNs have demonstrated strong performance in underwater image classification tasks such as marine species identification, object detection, and gesture recognition [14,15,16,17,18,21]. Among these, ResNet-based architectures offer a balance between accuracy and strong generalization under adverse visual conditions such as low visibility or color distortion [11,37].
The Rectified Linear Unit (ReLU) function was applied to all dense layers and is defined as
R e L U z = max 0 , z
to convert output scores into class probabilities, the SoftMax function was used:
S o f t m a x z k = e z k j e z j
model optimization employed the categorical cross-entropy loss function, expressed as
L o s s y , y ^ = 1 N i = 1 N C = 1 C y i , C log y ^ i , C
where N is the number of samples, C is the number of classes, y i , C is the true label for sample i and class C , and y ^ i , C is the predicted probability for sample i and class C .

2.3. Visual Dataset Construction and Augmentation

The model was trained using the customized Underwater Visual Signals Recognition Dataset (UVSRD), containing 33,800 manually labeled images across 13 distinct classes. These include navigational instructions (“forward”, “backward”, “left”, “right”), PWM levels (20%, 40%, 60%, 80%, 100%), and a “no signal” class for idle frames [30].
Images were captured with a Sony IMX415 camera (Image Quality, Inc., Beijing, China) under controlled conditions in three water types (clear, green, and blue) and three background scenarios (white panel, pool tiles, and simulated seabed). To enhance robustness, samples included variations in angle, distance, illumination, and perspective [30].
The camera system was calibrated using Zhang’s method [58], which estimates both the intrinsic matrix and lens distortion parameters from multiple images of a planar checkerboard. The intrinsic camera matrix k is defined as follows:
k = f x s c x 0 f y c y 0 0 1
where f x , f y are the focal lengths in pixels, ( c x , c y ) is the optical center, and s is the skew factor. To correct for lens distortion, the radial distance is first computed as
r 2 = x d 2 + y d 2
using the distortion coefficients k 1 , k 2 (radial) and p 1 , p 2 (tangential), distorted pixel coordinates ( u , v ) are modeled as follows:
u = x d 1 + k 1 r 2 + k 2 r 4 + 2 p 1 x d y d + p 2 3 x d 2 + y d 2
v = y d 1 + k 1 r 2 + k 2 r 4 + p 1 x d 2 + 3 y d 2 + 2 p 2 x d y d
These corrections were implemented using OpenCV functions to eliminate fisheye distortion, improving the consistency and reliability of image-based signal recognition.

2.4. Embedded System Architecture

The embedded control system consists of a Raspberry Pi 4 running the AquaSignalNet model and a TIVA C TM4C123G microcontroller managing low-level motor control [30]. Communication occurs via serial UART. The PWM signals for motor drivers are generated through a PCA9685 module, which controls six 30 A bidirectional ESCs connected to brushless thrusters capable of operating between 12 V and 24 V and drawing up to 20 A [30].
The assembly is housed in a waterproof PETG structure, with a frontal acrylic dome providing optical access to the camera [30]. Power is supplied by a 12 V 100 A source, regulated to 5 V for the control electronics via an XL4015 DC-DC converter.

2.5. Depth Control System

Stable operation during autonomous tasks is maintained using a pressure-based depth control system integrated into the ROV. A pressure sensor estimates the vehicle’s depth, and its readings are processed by the TIVA C microcontroller to maintain the ROV at a predetermined vertical position before executing movement commands [30].
This functionality is essential to ensure that gesture recognition and motor actions are performed at a consistent depth, avoiding visual distortions and navigation errors due to vertical drift or unintentional buoyancy.
The control strategy implemented is a Proportional–Integral–Derivative (PID) feedback controller, described by
u t = k p e t + k i 0 t e t d t + k d d e t d t
where u ( t ) is the control signal sent to the vertical thrusters; e ( t ) is the error between the desired and measured depth; and k p , k i and k d are the proportional, integral, and derivative gains.
By stabilizing depth, the ROV maintains a consistent camera viewpoint for signal detection. This approach eliminates depth-related variabilities common to earlier gesture-based control systems lacking vertical stabilization [28,31].

2.6. Evaluation Metrics

Model performance was evaluated using both quantitative metrics and qualitative visual validation. Training optimization relied on categorical cross-entropy loss and classification accuracy. Validation was performed on a set of 6760 unseen images, covering the full range of water conditions and backgrounds in the dataset [30].
Prediction quality during deployment was evaluated using visual mosaics of classified frames, allowing manual verification of label consistency. This qualitative assessment was supported by quantitative metrics, with the model consistently achieving over 94% accuracy in multiple test scenarios [30].
The accuracy metric is defined as follows:
A c c u r a c y = T P + T N T P + T N + F P + F N
where TP = true positives (correctly identified signals), TN = true negatives (correctly identified “no signal” frames), FP = false positives (incorrectly classified signals), and FN = false negatives (missed detections of actual signals).
In addition to recognition tests, autonomous navigation trials were conducted to evaluate end-to-end integration between gesture recognition and ROV movement. Unlike previous studies focused mainly on gesture classification [25,26,27,28,29,32,33,34,35], these trials demonstrated how recognized signals can be directly translated into real-time navigational commands within a controlled aquatic environment.

3. Experimental Setup

3.1. Dataset Construction: Underwater Visual Signals Recognition Dataset (UVSRD)

To ensure proper network training in submerged environments, a dataset was designed to emulate an underwater setting. It incorporated variations in scene configuration, perspective, distance, background, and water coloration to enhance generalization during in situ testing.
Three types of environments were defined for image capture:
Water with 2.5 g of blue dye.
Water with 2.5 g of green dye.
Clean water.
Three types of backgrounds were used: white, pool tiles, and a simulated rocky seabed. The twelve classes utilized in the study are listed in Table 1.
To increase dataset complexity, three arbitrary distances between the signal and the ROV were modified, with the signal representing the mobile element, and images were captured from multiple perspectives and positions within the camera’s field of view.
This approach enhances the likelihood that the network will generalize effectively in a real-world environment, as demonstrated in Table 1.
Images were captured using the camera described in Section 3.3. A 3D-printed support structure was used to ensure proper alignment of the camera at the center of the housing. The acrylic enclosure incorporates a hemispherical dome (Figure 1).
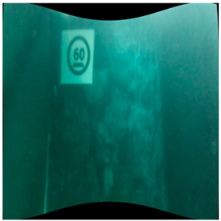
As expected, the images captured using the configuration shown in Figure 1 exhibit a “fisheye” distortion effect. To correct this, a camera calibration process was performed using Zhang’s algorithm [58], estimating radial and tangential distortion coefficients and applying them to each image. Corrected images are presented in Table 1.
Figure 2 depicts the experimental setup used for image capture. The camera was mounted on the ROV inside a water tank measuring 120 × 80 × 80 cm. The tank was lined with matte black material to minimize reflections. Constant illumination was provided by a 10 W white LED lamp positioned 50 cm above the tank.
To vary the color of the water, 2.5 g of blue dye was added to the tank, mixed thoroughly to achieve uniform coloration, and images were captured. For captures with green dye, the water was replaced with clean water, to which 2.5 g of green dye was then added, repeating the same mixing and capture procedure (Figure 3).
Figure 2A shows the tank dimensions and ROV positions relative to the signals, while Figure 2B provides the ROV’s perspective during captures.
Figure 3 details the camera calibration and image capture process under diverse conditions, encompassing both clean and tinted water. Thirty checkerboard images were captured to calibrate the camera, and the internal parameters were adjusted using the MATLAB Stereo Camera Calibration toolbox 2023 b. The camera housing was validated for proper functioning. Images were then captured across the three background types in clean water, followed by blue- and green-tinted water, maintaining the same perspective and distance variations. A total of 33,800 images were collected, with 2600 images per class.
The dataset comprises 13 distinct classes (Table 1): Five numerical classes (20, 40, 60, 80, and 100) representing PWM percentages applied to the six thrusters, seven action signals (stop, right, left, front, down, up, and back), and one “nothing” class for images not falling into any other category. This dataset, known as the Underwater Visual Signals Recognition Dataset (UVSRD), was split into 60% for training, 20% for validation, and 20% for testing to ensure balanced evaluation and reproducibility. Cross-validation was not applied to maintain a fixed partition across experiments.

3.2. AquaSignalNet Model Implementation

The network was trained using the ADAM optimizer with a learning rate of 1 × 10 5 . Categorical cross-entropy was used as the loss function, and accuracy was monitored throughout training. The model was trained with a batch size of 32 for 16 epochs, and an Early Stopping mechanism monitored validation loss with a patience threshold of 5 epochs, automatically restoring the best model weights when no improvements were observed.
The CNN architecture was based on ResNet50V2 pre-trained on ImageNet, with its initial weights frozen to prevent adjustment during training. This base layer was followed by a Global Average Pooling layer to reduce spatial dimensions. Five intermediate dense layers with ReLU activation were added, configured with 1030, 521, 265, 130, and a final 13-neuron SoftMax output layer (Figure 4). The configuration of these dense layers, including the number of neurons and layers, was determined experimentally [49].
Training was performed on a dataset of 20,280 images in the training folder and 6760 images in the validation folder. All images were resized to 299 × 299 × 3 pixels and normalized before input., allowing for stable convergence toward minimizing the loss function. Images in which visual signals were blurry or not fully visible were removed, ensuring that only clear and representative samples were used.
Equations (10)–(14) represent the dense layers of the proposed AquaSignalNet model, described by
h 1 = R e L U W 1 x + b 1 , W 1 R 1030 × 2048 , b 1 R 1030
h 2 = R e L U W 2 h 1 + b 2 , W 2 R 521 × 1030 , b 2 R 521
h 3 = R e L U W 3 h 2 + b 3 , W 3 R 265 × 521 , b 3 R 265
h 4 = R e L U W 4 h 3 + b 4 , W 4 R 130 × 265 , b 4 R 130
y = S o f t m a x W 5 h 4 + b 5 , W 5 R 13 × 130 , b 5 R 13
where x is the 2048-dimensional input vector generated by GlobalAvergaPooling2D, W i is the weights matrix of the i -th layer, b i is the bias vector of the i -th layer, ReLU is th ReLU activation function defined as R e L U z = m a x ( 0 , z ) , and SoftMax is defined as S o f t m a x z k = e z k j e z j .
The loss function is described in Equation (3).
Figure 5 presents the accuracy and loss curves, showing an accuracy of 94% and a near-zero loss of 0.21. This indicates consistent improvement in both training and validation data, with no clear signs of overfitting, suggesting that the model configurations and batch size were appropriately selected for the task at hand.
Generalization was verified using a test set of images unseen during training. Figure 6 presents a mosaic of 36 predictions from the test set, with 34 correctly identified, resulting in an accuracy of 94%. Similarly, Figure 7 shows a mosaic of 24 predictions, with only one misclassification, achieving 95% accuracy. This procedure was repeated using mosaics of varying sizes, consistently achieving a minimum accuracy of 94%.
These results confirm that the ResNet50V2 convolutional backbone is effective for feature detection in underwater images, even when faced with variations in scene, lighting, and object perspective. Consequently, additional testing in a pool environment evaluated the model’s generalization under more challenging conditions, as detailed in Section 4.

3.3. Embedded System Integration and Mechanical Design

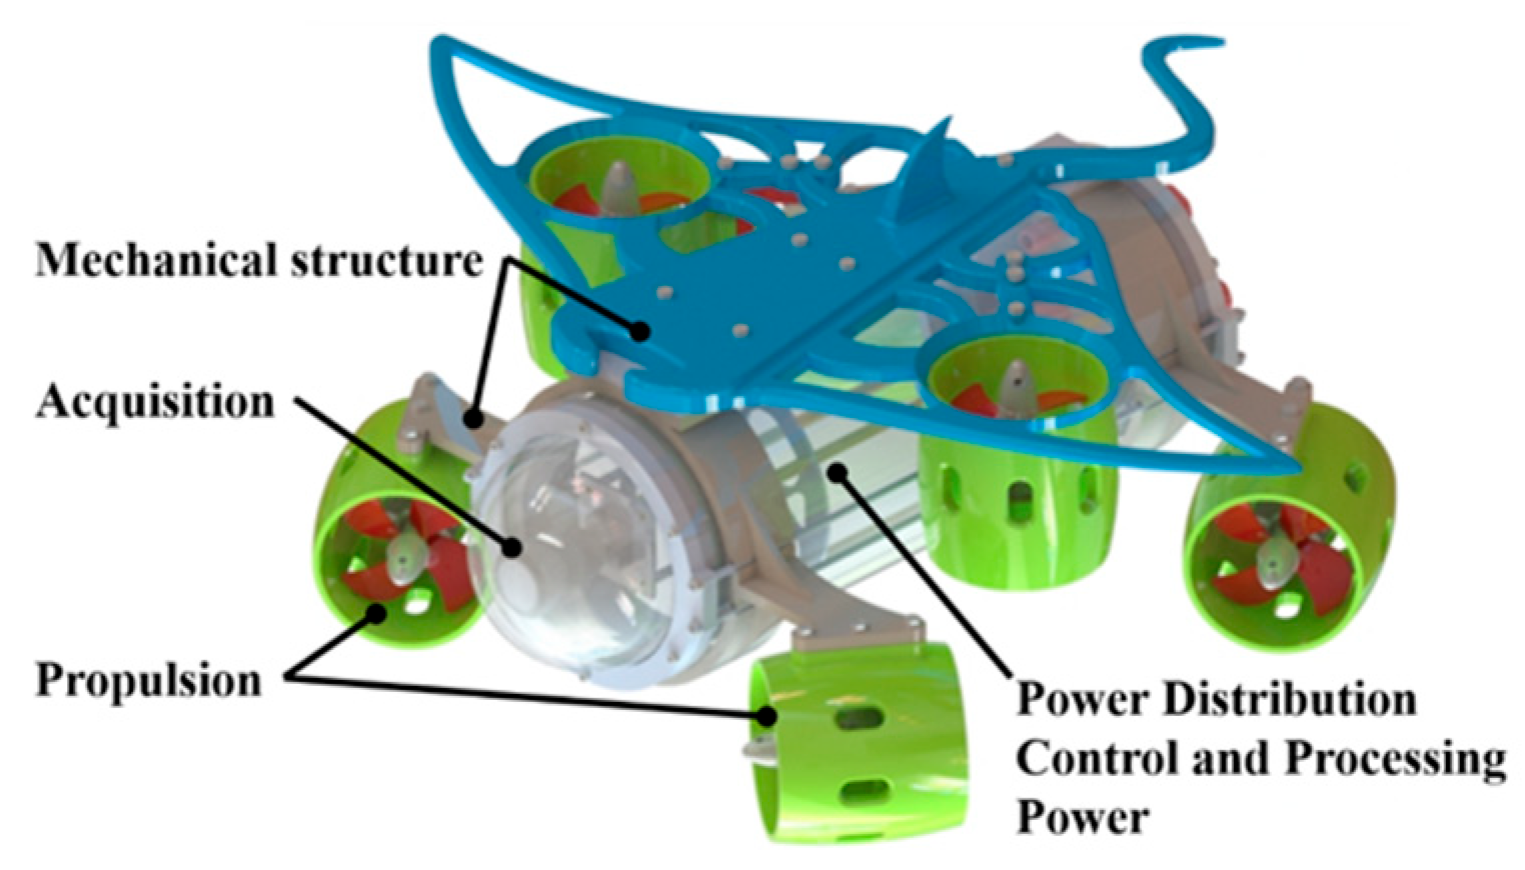
The development of ROVs has emerged as a key technological solution for exploring and operating in underwater environments, where extreme conditions limit human intervention. These systems incorporate mechanical, electronic, and software components to ensure functionality, stability, and adaptability to diverse tasks, from underwater structure inspection to scientific data collection. This study addresses the design and implementation of the ROV hardware, including component selection and the integration of power distribution, control, propulsion, and data acquisition systems, as illustrated in Figure 8. The results reflect a combination of efficiency and modularity, establishing a solid foundation for future applications in aquatic environments.
The ROV hardware consists of both digital and analog structural and electronic components that perform various tasks. The ROV is typically divided into systems designed for specific purposes, some housed within the capsule. Figure 9 presents a schematic of the ROV components and their interactions. The systems comprising the ROV are described below:
Power Distribution (Figure 9A): The system is powered by a 12 V, 100 A, 1200 W switched-mode power supply combined with a Booster Step-Down XL4015 regulator rated at 5 A and 32 V for reliable power delivery to all electronic components. The switched power supply delivers high current and stable voltage for the motors and control/communication modules, while the XL4015 regulator acts as a step-down voltage converter for sensitive components such as the Raspberry Pi 4 and the Tiva C Series. Its high efficiency, precise output voltage adjustment, and 5 A nominal current capacity ensure efficient energy management, preventing fluctuations that could compromise system performance.
Control (Figure 9B): The control system integrates a Raspberry Pi 4 and a Tiva C Series TM4C123G microcontroller to optimize the ROV’s performance. The Raspberry Pi 4, with a powerful quad-core ARM Cortex-A72 processor, manages high-level tasks such as real-time video streaming, remote communication via Ethernet, and running AquaSignalNet to classify captured images. It then sends frames via serial communication to the Tiva C, which, based on an ARM Cortex-M4 microcontroller, handles real-time operations, including PWM signal generation and direct motor control, through the PCA9685 module. This combination of vision processing and low-level actuation enables fully autonomous ROV operation without intermediaries, providing precise, low-latency responses.
The control system also includes an MPU9250 inertial measurement unit, combining a 3-axis accelerometer, 3-axis gyroscope, and a 3-axis magnetometer. This sensor enables real-time estimation of pitch, roll, and yaw angles. Notably, the yaw angle is essential for enabling the ROV to perform 90° turns in response to “left” and “right” visual signals, ensuring precise orientation control during autonomous navigation.
Power (Figure 9C): The power system consists of a PCA9685 module and six bidirectional 30 A ESC controllers to manage the brushless motors. The PCA9685 is an advanced 16-channel PWM controller with configurable frequencies, facilitating simultaneous control of multiple signals through a single I2C interface. Acting as an intermediary between the Tiva C Series TM4C123G and the ESC controllers, it generates PWM signals for motor speed and direction. The 30 A bidirectional ESC controllers convert these signals into electrical commands for the motors, providing torque control and directional adjustments.
Propulsion (Figure 9D): The propulsion system consists of six four-blade underwater thrusters equipped with brushless motors, operating at 12 to 24 V and up to 20 A, providing the force necessary for maneuvering in various underwater scenarios.
Image capture (Figure 9E): The system uses an IMX415 camera with a resolution of 1920 × 1080 × 3 pixels.
Mechanical Structure (Figure 9F): The mechanical structure includes an acrylic housing with a hemispherical face, a chassis for mounting electronics, and an aluminum alloy cover with ports for connections, ensuring a hermetic seal and robustness against underwater pressures and conditions. The hemispherical dome provides clear visibility and optimal camera access, while the chassis integrates and supports all electronic subsystems. Additionally, PETG-printed mounts are strategically positioned to house the six underwater thrusters for functional component integration and reliable performance in underwater applications.

3.4. Testing Environment and Validation Procedure

To assess the functionality of AquaSignalNet and its integration into the ROV system, controlled experiments were conducted in an 800 × 500 × 200 cm pool to simulate an aquatic environment. These tests aimed to validate the model’s accuracy in real-world conditions and evaluate the ROV’s ability to execute autonomous actions based on detected signals. All experiments were carried out under natural lighting.
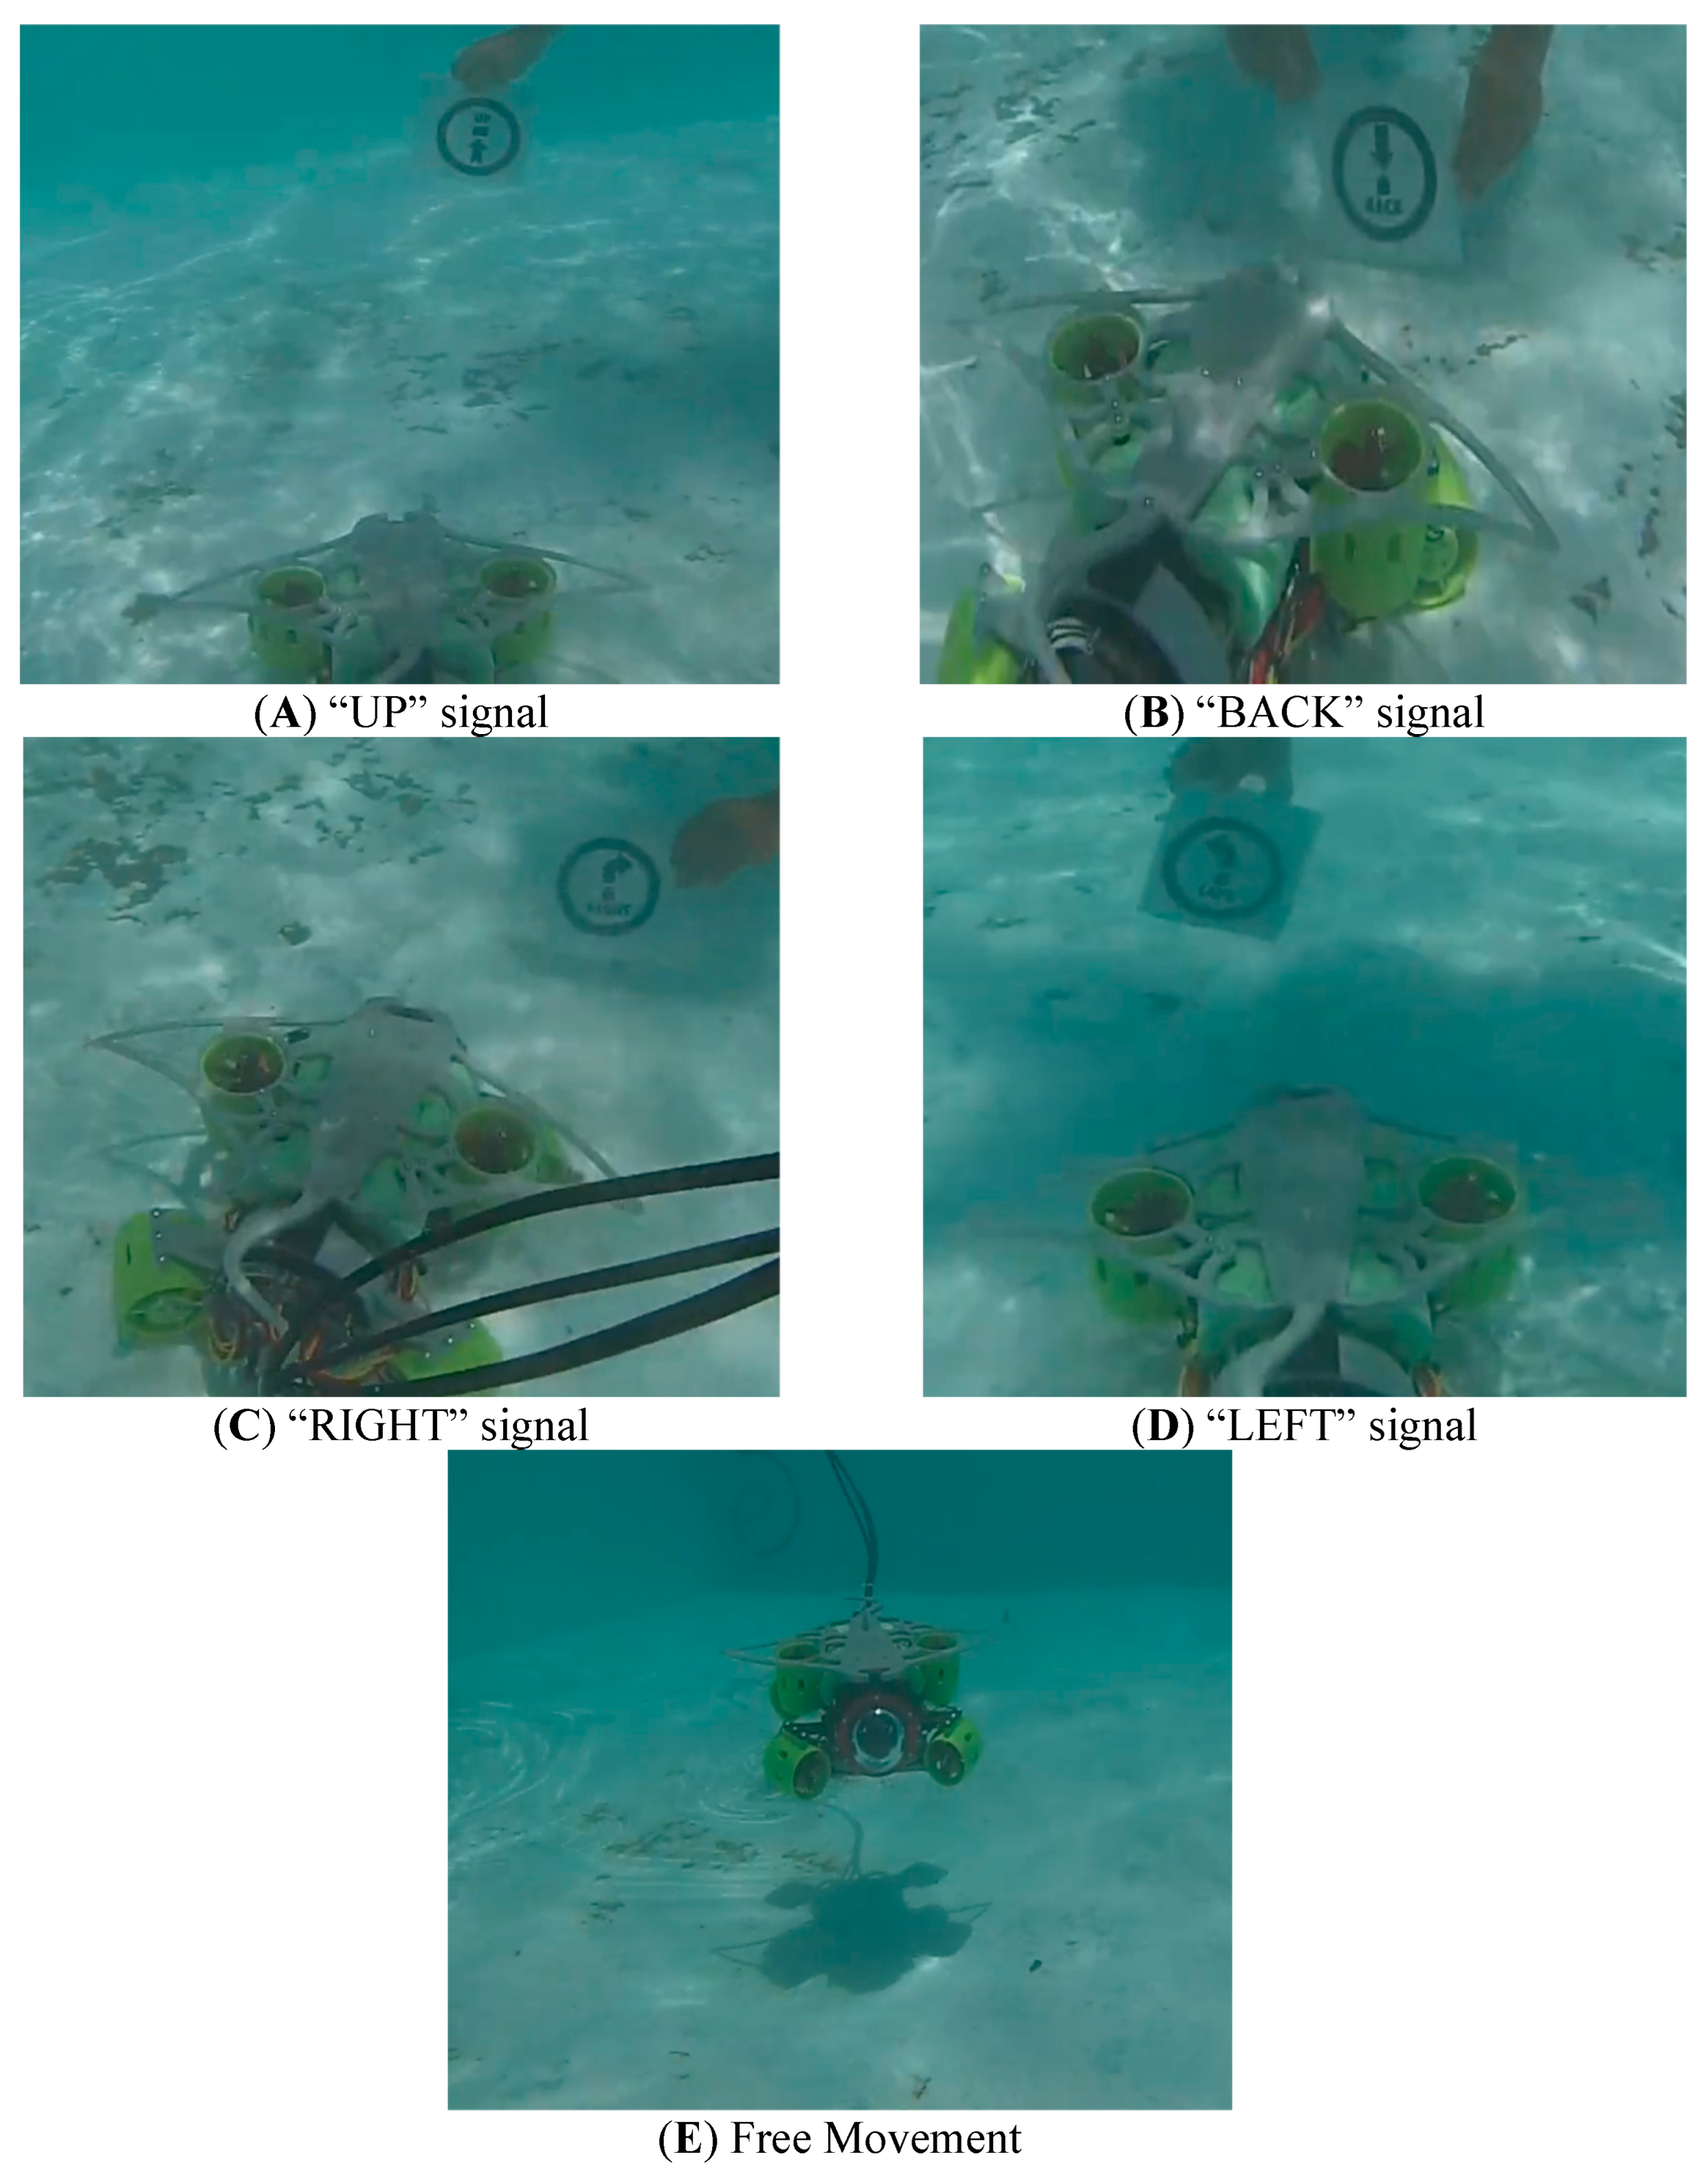
In the initial trial, the ROV was commanded to move vertically upward. Upon identifying the “UP” signal, the system activated the upper motors, generating the thrust necessary to ascend stably (Figure 10A).
Next, a backward motion test was conducted. The system identified the “BACK” signal, processed it, and synchronized the rear motors to achieve smooth, straight movement, thereby demonstrating effective and even motor control (Figure 10B).
Rotational tests were also performed. For lateral movement, the ROV rotated to the right or left upon detecting the corresponding “RIGHT” (Figure 10C) or “LEFT” signal (Figure 10D).
During the free movement test, the ROV was subjected to a series of consecutive signals, including forward motion, stops, rotations, and numerical setpoint adjustments (Figure 10E). This dynamic environment, with variations in distances, angles, and lighting conditions, evaluated AquaSignalNet’s ability to accurately identify signals and integrate them into an autonomous decision-making system capable of executing precise underwater maneuvers. These tests demonstrated the system’s resilience to challenges such as water turbidity, validating its operational effectiveness under less structured conditions.
Table 2 and Figure 11 summarize the accuracy tests conducted on the pool of data for each signal class identified by the AquaSignalNet system. Accuracy ranged from 87% to 91%, depending on the signal. Movement-related commands such as “STOP,” “UP,” and “RIGHT” achieved 90% accuracy, while “DOWN” showed the lowest accuracy (87%), likely due to variations in lighting or signal positioning within the camera’s field of view.
Furthermore, the numerical classes, corresponding to the PWM values applied to the ROV’s motors, demonstrated accuracy levels exceeding 89%, with the “40” class achieving the highest precision, at 91%. This further validates the system’s ability to reliably interpret and execute motor intensity commands.
The results demonstrate that AquaSignalNet exhibits robust performance in signal detection and classification in a controlled aquatic environment, validating its potential for real-world operation and effective autonomous ROV control.

4. Results and Discussion

To evaluate the autonomous capabilities of the proposed system, the trained AquaSignalNet model was implemented in real-time on the embedded hardware and tested in a pool environment. The purpose of these tests was to verify whether recognized visual signals could successfully trigger autonomous navigation sequences without human intervention.
Two distinct trajectories were designed and executed by the ROV, each guided by a series of printed underwater signals strategically placed along predefined trajectories. These signals acted as commands, instructing the vehicle to perform maneuvers such as turning, accelerating, stopping, and changing depth, according to the detected class.
Before each trial, the ROV was stabilized at a depth of 50 cm from the pool floor using the pressure-based PID control described in Section 2.5. Once stabilized, the system began interpreting visual commands captured by its onboard camera.
The movement logic associated with each recognized class was as follows:
“LEFT” and “RIGHT” signals caused the ROV to execute a 90° yaw rotation, using the angle estimation provided by the MPU9250 sensor.
Numerical signals (20 to 100) were interpreted as PWM values, modulating the thrust intensity across all motors to increase or reduce speed.
“UP” or “DOWN” signals triggered the vertical thrusters to move the vehicle upward or downward, respectively. The ROV continued in this direction until a new signal was detected.
The combination of these behaviors enabled end-to-end autonomy, allowing the ROV to navigate across the pool in response to environmental cues represented by printed signs. These experiments validated not only the model’s classification performance but also its functional integration with the control architecture for real-world navigation tasks.

4.1. Trajectory 1

The first autonomous navigation trial guided the ROV from the lower right to the upper right corner of the pool. A sequence of nine underwater visual signals was printed and placed at strategic locations to define a complete, interpretable trajectory. Each signal was captured in real time, classified by AquaSignalNet, and translated into a corresponding motor command.
  • LEFT → UP → RIGHT → 80 → 40 → RIGHT → 20 → UP → STOP
  • The behavior associated with this trajectory is described below:
  • LEFT—The ROV executed a 90° yaw rotation to the left using angle estimation from the MPU9250 sensor.
  • UP—The ROV ascended vertically using the upper thrusters until the next signal was detected.
  • RIGHT—Another 90° rotation was executed.
  • 80/40/20—These numerical signals modulated the PWM duty cycle to adjust forward speed. Higher values produced stronger thrust.
  • RIGHT—A third 90° yaw rotation aligned the ROV with the final segment of the trajectory.
  • UP—The vehicle ascended again to reach the final navigation level.
  • STOP—The ROV ceased all propulsion and maintained position.
This sequence involved multiple vertical and horizontal changes in position, speed modulation, and orientation control, all executed without human intervention. Each response was completed within one second after signal detection, with the vehicle maintaining stability and correct heading throughout.
This trajectory (Figure 12) reflects real-world operational scenarios such as the following:
Pipeline or cable tracking, where the ROV must adjust depth and heading to follow underwater infrastructure.
Inspection of submerged structures, requiring navigation around obstacles located at different elevations.
Targeted retrieval or deployment, where the vehicle must reach specific coordinates using visual cues issued by a diver or automated system.
Exit path guidance, enabling the ROV to autonomously retrace a safe route back to its launch or recovery point.
Resupply missions, where the ROV delivers tools, sensors, or emergency payloads to specific locations under operator guidance or preprogrammed paths.
Repeatability was evaluated by executing this trajectory under identical test conditions. The ROV successfully completed the full sequence, achieving a 90% success rate. In one trial, the system misclassified a “RIGHT” signal as “UP,” causing the ROV to initiate an unintended ascent. As a result, it surfaced prematurely and failed to detect the subsequent signal, interrupting the planned navigation path. This outcome highlights the importance of classification accuracy under varied lighting and background conditions and suggests that additional training data or improved post-processing may be necessary to further enhance system robustness.

4.2. Trajectory 2

The second trajectory was designed to simulate a complex mission scenario involving multiple consecutive movements, vertical repositioning, and dynamic speed modulation. The ROV initially advanced toward the center of the pool and then executed a rectangular inspection routine measuring approximately 1 m in height by 3 m in width, before redirecting to the upper right corner as the final target position.
The command sequence for this path, shown in Figure 13, was as follows:
Left → Right → Right → Left → Left → 20 → Up → Right → 60 → Down → 20 → Right → Left → 80 → 20 → Up → Stop
The sequence required the ROV to accomplish the following tasks:
  • Perform precise horizontal orientation adjustments using yaw-based 90° turns.
  • Regulate its propulsion speed using visual PWM percentage signals.
  • Execute vertical ascents and descents in response to UP and DOWN commands.
  • Respond to a long chain of commands while maintaining proper signal detection and control coordination.
The system successfully achieved an 85% success rate. In the two failed attempts, the misclassifications occurred during the final upward leg of the trajectory:
In one instance, the ROV misinterpreted an UP signal as DOWN, resulting in a descent rather than an ascent.
In the second failure, a misreading of the “60” PWM signal led to incorrect thrust modulation, resulting in deviation from the intended trajectory.
Both errors occurred near the surface of the tank, where sunlight interference altered the perceived color of the water, subtly shifting the hue and contrast of the printed signals. This affected the CNN’s ability to maintain reliable classification performance. These findings emphasize the importance of consistent lighting conditions and suggest that adaptive brightness compensation or color normalization may be necessary for robust deployment in outdoor or open-water environments.
This trajectory can be directly used in the following applications:
Infrastructure inspections, such as scanning pipelines, underwater tanks, or ship hulls in a systematic sweep.
Environmental sampling, where the ROV is required to follow predefined grids or corridors to gather water or image data.
Monitoring of artificial reefs or submerged installations, which often require repeated scans at different depths.
Pre-docking alignment routines, where a vehicle must maneuver into position before coupling with a charging station or transport frame.
Despite the reduced success rate compared to Trajectory 1, the ROV’s ability to correctly interpret and act on a multi-step signal sequence—including mixed horizontal and vertical instructions—demonstrates the system’s viability in structured autonomous missions. Improving robustness against dynamic lighting remains a priority for future iterations.
Most conventional AUV and ROV navigation strategies incorporate artificial markers such as QR codes, ArUco tags, or custom fiducial landmarks to support localization and task execution. For example, ref. [51] implemented a persistent localization system using AprilTags and cylindrical visual references for underwater SLAM, while ref. [52] applied deep learning with visual markers to guide ROV trajectories during net inspection operations in aquaculture environments.
As an alternative approach, the system proposed in this study employs printed visual commands, including directional indicators (e.g., “LEFT,” “UP”) and numeric PWM values, recognized in real time using a CNN-based model (AquaSignalNet). This method enables similar autonomous behaviors, such as trajectory execution, navigation, and task-oriented movement, without relying on predefined landmarks. By using class-based signal recognition, the proposed system offers a flexible solution that complements marker-based strategies for underwater exploration, inspection, and maintenance tasks.

5. Conclusions

This work introduces AquaSignalNet, a complete system for class-based visual signal recognition and autonomous underwater navigation using printed signals. By combining a CNN-based classification model with an embedded processing architecture, the system enables real-time interpretation of directional, vertical, and speed-related commands conveyed through underwater signs.
The ROV platform integrates a Raspberry Pi 4 for vision processing, a TIVA C microcontroller for actuation, a pressure sensor for depth stabilization, and an MPU9250 IMU for orientation control. All components were tested in a controlled aquatic environment using a custom dataset (UVSRD) under varied water color and background conditions.
Two autonomous trajectories were executed using only visual signals as input. In Trajectory 1, the system reached a 90% success rate, executing a directional route with precise turns and vertical positioning. In Trajectory 2, which included a rectangular inspection routine and multi-step vertical transitions, the system achieved an 85% success rate, with failures attributed to lighting-induced misclassification of signals near the surface.
This proposal demonstrates that printed gesture recognition offers a viable alternative to traditional marker-based navigation systems such as QR codes or ArUco tags. By eliminating the need for artificial landmarks, the system enhances flexibility and simplifies deployment in situ. However, the experiments were limited to a controlled pool environment, and factors such as dataset size, environmental variability, and hardware constraints may influence performance. ResNet50V2 has demonstrated acceptable performance in similar tasks, and for this application, training with a task-specific dataset improved generalization capability. Furthermore, prior studies have reported that this network provides strong results in aquatic environments when used as a feature extractor, supporting its suitability for the present application.
Future work will involve a more systematic evaluation of the system’s robustness under different turbidity levels and detailed measurements of the proposed model’s computational efficiency in real-time embedded deployments. In addition, the evaluation protocol will be expanded by incorporating statistical analyses, baseline comparisons with other models, and qualitative error analysis. Furthermore, exploring lighter architectures (e.g., MobileNet, EfficientNet-Lite) is a promising direction to improve onboard computation efficiency. Implementation of a central stop functionality based on independent light recognition and simple visual feedback mechanisms (e.g., green or red lights) is also under consideration to enhance safety and operator awareness.

Author Contributions

Conceptualization, C.H.S.-S. and T.S.-J.; Methodology, C.H.S.-S., J.M.B.F. and L.B.-R.; Software, C.H.S.-S. and L.B.-R.; Validation, A.G.-H. and L.B.-R.; Formal analysis, T.S.-J.; Investigation, C.H.S.-S., A.G.-H., T.S.-J. and J.M.B.F.; Resources, C.H.S.-S.; Data curation C.H.S.-S.; Writing—original draft preparation, A.G.-H. and T.S.-J.; Writing—review and editing, A.G.-E., J.M.B.F. and L.B.-R.; Visualization, C.H.S.-S.; Supervision, A.G.-E.; Project administration, C.H.S.-S.; Funding acquisition, A.G.-E. All authors have read and agreed to the published version of the manuscript.

Funding

This research received no external funding.

Data Availability Statement

The data that support the findings of this study are available from the corresponding author upon reasonable request.

Acknowledgments

We would like to thank Engineers Antonio Jiménez and Mario Villalobos for their valuable contributions to the project during their professional internships.

Conflicts of Interest

The authors declare no conflicts of interest.

References

  1. Zhang, R.; Li, S.; Ji, G.; Zhao, X.; Li, J.; Pan, M. Survey on Deep Learning-Based Marine Object Detection. J. Adv. Transp. 2021, 2021, 1–18. [Google Scholar] [CrossRef]
  2. Thum, G.W.; Tang, S.H.; Ahmad, S.A.; Alrifaey, M. Toward a Highly Accurate Classification of Underwater Cable Images via Deep Convolutional Neural Network. J. Mar. Sci. Eng. 2020, 8, 924. [Google Scholar] [CrossRef]
  3. González-Sabbagh, S.P.; Robles-Kelly, A. A Survey on Underwater Computer Vision. ACM Comput. Surv. 2023, 55, 1–39. [Google Scholar] [CrossRef]
  4. Li, Y.; Sun, K.; Han, Z. Vision Technology in Underwater: Applications, Challenges and Perspectives. In Proceedings of the 2022 4th International Conference on Control and Robotics (ICCR), Guangzhou, China, 2–4 December 2022; pp. 369–378. [Google Scholar]
  5. Cheng, Z.; Wu, Y.; Tian, F.; Feng, Z.; Li, Y. MSF-ACA: Low-Light Image Enhancement Network Based on Multi-Scale Feature Fusion and Adaptive Contrast Adjustment. Sensors 2025, 25, 4789. [Google Scholar] [CrossRef]
  6. Chen, Y.-W.; Pei, S.-C. Domain Adaptation for Underwater Image Enhancement via Content and Style Separation. IEEE Access 2022, 10, 90523–90534. [Google Scholar] [CrossRef]
  7. Wang, Z.; Shen, L.; Xu, M.; Yu, M.; Wang, K.; Lin, Y. Domain Adaptation for Underwater Image Enhancement. IEEE Trans. Image Process. 2023, 32, 1442–1457. [Google Scholar] [CrossRef]
  8. Yang, C.; Jiang, L.; Li, Z.; Huang, J. Towards domain adaptation underwater image enhancement and restoration. Multimed. Syst. 2024, 30, 1–14. [Google Scholar] [CrossRef]
  9. Mehrunnisa; Leszczuk, M.; Juszka, D.; Zhang, Y. Improved Binary Classification of Underwater Images Using a Modified ResNet-18 Model. Electronics 2025, 14, 2954. [Google Scholar] [CrossRef]
  10. Jeong, M.; Yang, M.; Jeong, J. Hybrid-DC: A Hybrid Framework Using ResNet-50 and Vision Transformer for Steel Surface Defect Classification in the Rolling Process. Electronics 2024, 13, 4467. [Google Scholar] [CrossRef]
  11. Wang, N.; Wang, Y.; Er, M.J. Review on deep learning techniques for marine object recognition: Architectures and algorithms. Control. Eng. Pr. 2022, 118, 104458. [Google Scholar] [CrossRef]
  12. Mittal, S.; Srivastava, S.; Jayanth, J.P. A Survey of Deep Learning Techniques for Underwater Image Classification. IEEE Trans. Neural Netw. Learn. Syst. 2022, 34, 6968–6982. [Google Scholar] [CrossRef]
  13. Birk, A. A Survey of Underwater Human-Robot Interaction (U-HRI). Curr. Robot. Rep. 2022, 3, 199–211. [Google Scholar] [CrossRef]
  14. Gómez-Ríos, A.; Tabik, S.; Luengo, J.; Shihavuddin, A.; Herrera, F. Coral species identification with texture or structure images using a two-level classifier based on Convolutional Neural Networks. Knowl.-Based Syst. 2019, 184, 104891. [Google Scholar] [CrossRef]
  15. Raphael, A.; Dubinsky, Z.; Iluz, D.; Netanyahu, N.S. Neural Network Recognition of Marine Benthos and Corals. Diversity 2020, 12, 29. [Google Scholar] [CrossRef]
  16. Mahmood, A.; Bennamoun, M.; An, S.; Sohel, F.A.; Boussaid, F.; Hovey, R.; Kendrick, G.A.; Fisher, R.B. Deep Image Representations for Coral Image Classification. IEEE J. Ocean. Eng. 2018, 44, 121–131. [Google Scholar] [CrossRef]
  17. Lumini, A.; Nanni, L.; Maguolo, G. Deep learning for plankton and coral classification. Appl. Comput. Inform. 2020, 19, 265–283. [Google Scholar] [CrossRef]
  18. Khai, T.H.; Abdullah, S.N.H.S.; Hasan, M.K.; Tarmizi, A. Underwater Fish Detection and Counting Using Mask Regional Convolutional Neural Network. Water 2022, 14, 222. [Google Scholar] [CrossRef]
  19. Guo, X.; Zhao, X.; Liu, Y.; Li, D. Underwater sea cucumber identification via deep residual networks. Inf. Process. Agric. 2019, 6, 307–315. [Google Scholar] [CrossRef]
  20. Mathur, M.; Goel, N. FishResNet: Automatic Fish Classification Approach in Underwater Scenario. SN Comput. Sci. 2021, 2, 1–12. [Google Scholar] [CrossRef]
  21. Qu, P.; Li, T.; Zhou, L.; Jin, S.; Liang, Z.; Zhao, W.; Zhang, W. DAMNet: Dual Attention Mechanism Deep Neural Network for Underwater Biological Image Classification. IEEE Access 2022, 11, 6000–6009. [Google Scholar] [CrossRef]
  22. Marin, I.; Mladenović, S.; Gotovac, S.; Zaharija, G. Deep-Feature-Based Approach to Marine Debris Classification. Appl. Sci. 2021, 11, 5644. [Google Scholar] [CrossRef]
  23. Szymak, P.; Piskur, P.; Naus, K. The Effectiveness of Using a Pretrained Deep Learning Neural Networks for Object Classification in Underwater Video. Remote. Sens. 2020, 12, 3020. [Google Scholar] [CrossRef]
  24. López-Barajas, S.; Sanz, P.J.; Marín-Prades, R.; Gómez-Espinosa, A.; González-García, J.; Echagüe, J. Inspection Operations and Hole Detection in Fish Net Cages through a Hybrid Underwater Intervention System Using Deep Learning Techniques. J. Mar. Sci. Eng. 2023, 12, 80. [Google Scholar] [CrossRef]
  25. Kvasić, I.; Antillon, D.O.; Nađ, Đ.; Walker, C.; Anderson, I.; Mišković, N. Diver-robot communication dataset for underwater hand gesture recognition. Comput. Netw. 2024, 245, 110392. [Google Scholar] [CrossRef]
  26. Nađ, Đ.; Walker, C.; Kvasić, I.; Antillon, D.O.; Mišković, N.; Anderson, I.; Lončar, I. Towards Advancing Diver-Robot Interaction Capabilities. IFAC-PapersOnLine 2019, 52, 199–204. [Google Scholar] [CrossRef]
  27. Martija, M.A.M.; Dumbrique, J.I.S.; Naval, P.C., Jr. Underwater Gesture Recognition Using Classical Computer Vision and Deep Learning Techniques. J. Image Graph. 2020, 8, 9–14. [Google Scholar] [CrossRef]
  28. Mangalvedhekar, S.; Nahar, S.; Maskare, S.; Mahajan, K.; Bagade, A. Inter-pretable Underwater Diver Gesture Recognition. arXiv 2023. [Google Scholar]
  29. Liu, T.; Zhu, Y.; Wu, K.; Yuan, F. Underwater Accompanying Robot Based on SSDLite Gesture Recognition. Appl. Sci. 2022, 12, 9131. [Google Scholar] [CrossRef]
  30. Saquín, H. Underwater Visual Signals Recognition Dataset UVSRD. Available online: https://ieee-dataport.org/documents/underwater-visual-signals-recognition-dataset-uvsrd (accessed on 10 February 2025).
  31. Plotnikov, V.A.; Akhtyamov, T.R.; Serebenny, V.V. Diver Gestures Recognition in Underwater Human-Robot Interaction Using Recurrent Neural Networks. In Proceedings of the 2024 6th International Youth Conference on Radio Electronics, Electrical and Power Engineering (REEPE), Moscow, Russia, 29 February–2 March 2024; pp. 1–5. [Google Scholar]
  32. Chiarella, D.; Bibuli, M.; Bruzzone, G.; Caccia, M.; Ranieri, A.; Zereik, E.; Marconi, L.; Cutugno, P. A Novel Gesture-Based Language for Underwater Human–Robot Interaction. J. Mar. Sci. Eng. 2018, 6, 91. [Google Scholar] [CrossRef]
  33. Qi, J.; Ma, L.; Cui, Z.; Yu, Y. Computer vision-based hand gesture recognition for human-robot interaction: A review. Complex Intell. Syst. 2023, 10, 1581–1606. [Google Scholar] [CrossRef]
  34. Xia, Y.; Sattar, J. Visual Diver Recognition for Underwater Human-Robot Collaboration. In Proceedings of the 2019 International Conference on Robotics and Automation (ICRA), Montreal, QC, Canada, 20–24 May 2019; pp. 6839–6845. [Google Scholar]
  35. Zhang, Y.; Jiang, Y.; Qi, H.; Zhao, M.; Wang, Y.; Wang, K.; Wei, F. An Underwater Human–Robot Interaction Using a Visual–Textual Model for Autonomous Underwater Vehicles. Sensors 2022, 23, 197. [Google Scholar] [CrossRef] [PubMed]
  36. He, K.; Gkioxari, G.; Dollár, P.; Girshick, R. Mask R-CNN. In Proceedings of the 2017 IEEE International Conference on Computer Vision (ICCV), Venice, Italy, 22–29 October 2017; pp. 2961–2969. [Google Scholar] [CrossRef]
  37. He, K.; Zhang, X.; Ren, S.; Sun, J. Identity Mappings in Deep Residual Networks. In Proceedings of the Computer Vision-ECCV 2016-14th European Conference, Amsterdam, The Netherlands, 11–14 October 2016; pp. 630–645. [Google Scholar]
  38. Kingma, D.P.; Ba, J. Adam: A method for stochastic optimization. arXiv 2014. [Google Scholar] [CrossRef]
  39. Huang, G.; Liu, Z.; Van Der Maaten, L.; Weinberger, K.Q. Densely connected convolutional networks. In Proceedings of the 2017 IEEE Conference on Computer Vision and Pattern Recognition, Honolulu, HI, USA, 21–26 July 2017; pp. 2261–2269. [Google Scholar] [CrossRef]
  40. Szegedy, C.; Liu, W.; Jia, Y.; Sermanet, P.; Reed, S.; Anguelov, D.; Erhan, D.; Vanhoucke, V.; Rabinovich, A.; Liu, W.; et al. Going deeper with convolutions. In Proceedings of the 2015 IEEE Conference on Computer Vision and Pattern Recognition (CVPR), Boston, MA, USA, 7–12 June 2015; pp. 1–9. [Google Scholar] [CrossRef]
  41. Szegedy, C.; Ioffe, S.; Vanhoucke, V.; Alemi, A. Inception-v4, Inception-ResNet and the Impact of Residual Connections on Learning. In Proceedings of the AAAI Conference on Artificial Intelligence, San Francisco, CA, USA, 4–9 February 2017; pp. 4278–4284. [Google Scholar] [CrossRef]
  42. Boom, B.J.; Huang, P.X.; He, J.; Fisher, R.B. Supporting ground-truth annotation of image datasets using clustering. In Proceedings of the 21st International Conference on Pattern Recognition (ICPR), Tsukuba, Japan, 11–15 November 2012; pp. 1542–1545. [Google Scholar]
  43. Anantharajah, K.; Ge, Z.; McCool, C.; Denman, S.; Fookes, C.; Corke, P.; Sridharan, S. Local inter-session variability modelling for object classification. In Proceedings of the IEEE Winter Conference on Applications of Computer Vision, Steamboat Springs, CO, USA, 24–26 March 2014; pp. 309–316. [Google Scholar] [CrossRef]
  44. Marques, T.P.; Albu, A.B. L2UWE: A Framework for the Efficient Enhancement of Low-Light Underwater Images Using Local Contrast and Multi-Scale Fusion. In Proceedings of the 2020 IEEE/CVF Conference on Computer Vision and Pattern Recognition Workshops (CVPRW), Seattle, WA, USA, 14–19 June 2020; pp. 2286–2295. [Google Scholar]
  45. Liu, R.; Fan, X.; Zhu, M.; Hou, M.; Luo, Z. Real-World Underwater Enhancement: Challenges, Benchmarks, and Solutions Under Natural Light. IEEE Trans. Circuits Syst. Video Technol. 2020, 30, 4861–4875. [Google Scholar] [CrossRef]
  46. Li, C.; Guo, C.; Ren, W.; Cong, R.; Hou, J.; Kwong, S.; Tao, D. An Underwater Image Enhancement Benchmark Dataset and Beyond. IEEE Trans. Image Process. 2019, 29, 4376–4389. [Google Scholar] [CrossRef]
  47. Islam, J.; Luo, P.; Sattar, J. Simultaneous Enhancement and Super-Resolution of Underwater Imagery for Improved Visual Perception. In Proceedings of the Robotics: Science and Systems 2020, Corvalis, OR, USA, 12–16 July 2020. [Google Scholar]
  48. Islam, J.; Xia, Y.; Sattar, J. Fast Underwater Image Enhancement for Improved Visual Perception. IEEE Robot. Autom. Lett. 2020, 5, 3227–3234. [Google Scholar] [CrossRef]
  49. Sandler, M.; Howard, A.; Zhu, M.; Zhmoginov, A.; Chen, L. MobileNetV2: Inverted Residuals and Linear Bottlenecks. In Proceedings of the IEEE conference on computer vision and pattern recognition, Salt Lake City, UT, USA, 18–23 June 2018; pp. 4510–4520. [Google Scholar] [CrossRef]
  50. Krizhevsky, A.; Sutskever, I.; Hinton, G.E. ImageNet classification with deep convolutional neural networks. Commun. ACM 2017, 60, 84–90. [Google Scholar] [CrossRef]
  51. Szegedy, C.; Vanhoucke, V.; Ioffe, S.; Shlens, J.; Wojna, Z. Rethinking the Inception Architecture for Computer Vision. In Proceedings of the IEEE Conference on Computer Vision and Pattern Recognition (CVPR), Las Vegas, NV, USA, 27–30 June 2016; pp. 2818–2826. [Google Scholar]
  52. He, K.; Zhang, X.; Ren, S.; Sun, J. Deep Residual Learning for Image Recognition. In Proceedings of the 2016 IEEE Conference on Computer Vision and Pattern Recognition (CVPR), Las Vegas, NV, USA, 27–30 June 2016; pp. 770–778. [Google Scholar] [CrossRef]
  53. Goodfellow, I.; Bengio, Y.; Courville, A. Deep Learning; MIT Press: Cambridge, MA, USA, 2016. [Google Scholar]
  54. Sánchez-Saquín, C.H.; Barriga-Rodríguez, L.; Baldenegro-Pérez, L.A.; Ronquillo-Lomeli, G.; Rodríguez-Olivares, N.A. Novel Neural Networks for Camera Calibration in Underwater Environments. IEEE Access 2024, 12, 181767–181786. [Google Scholar] [CrossRef]
  55. Zhuang, F.; Qi, Z.; Duan, K.; Xi, D.; Zhu, Y.; Zhu, H.; Xiong, H.; He, Q. A Comprehensive Survey on Transfer Learning. Proc. IEEE 2021, 109, 43–76. [Google Scholar] [CrossRef]
  56. Japan Agency for Marine Earth Science and Technology, Deep-Sea Debris Database. Available online: http://www.godac.jamstec.go.jp/catalog/dsdebris/metadataList?lang=en (accessed on 10 February 2025).
  57. Jung, J.; Choi, H.-T.; Lee, Y. Persistent Localization of Autonomous Underwater Vehicles Using Visual Perception of Artificial Landmarks. J. Mar. Sci. Eng. 2025, 13, 828. [Google Scholar] [CrossRef]
  58. Zhang, Z. A flexible new technique for camera calibration. IEEE Trans. Pattern Anal. Mach. Intell. 2000, 22, 1330–1334. [Google Scholar] [CrossRef]
Figure 1. The camera assembled with the acrylic housing.
Automation 06 00051 g001
Figure 2. Experimental setup for dataset image capture: (A) 120 × 80 × 80 cm test tank with clean water and a tiled pool bottom, with printed visual signals placed at different positions. (B) Perspective view of the ROV during data collection, showing the camera orientation relative to the underwater signs. This setup was used to build the UVSRD dataset under controlled conditions.
Automation 06 00051 g002
Figure 3. Methodology for dataset image capture. The process included (A) camera calibration using 30 checkerboard images and validation of intrinsic parameters, followed by systematic image acquisition in controlled pool conditions. For each water type (B) clean, (C) blue, and (D) green, 2423 images were captured under three different backgrounds (blank, pool mosaic, and simulated seabed), with variations in perspectives and distances to increase dataset diversity.
Automation 06 00051 g003
Figure 4. AquaSignalNet network architecture. The process starts with underwater image input, passes through convolutional layers of ResNet50V2 for feature extraction, and ends with dense layers and a SoftMax classifier that outputs the recognized signal class.
Automation 06 00051 g004
Figure 5. Training performance curves. (A) Accuracy evolution for training and validation sets across epochs. (B) Loss evolution for training and validation sets across epochs.
Automation 06 00051 g005
Figure 6. Mosaic of 36 test images used for generalization validation. The selected images were excluded from the training set to provide an independent evaluation of model performance.
Automation 06 00051 g006
Figure 7. Mosaic with 24 test images used for generalization validation. The selected images were excluded from the training set to provide an independent evaluation of model performance.
Automation 06 00051 g007
Figure 8. ROV hardware distribution.
Automation 06 00051 g008
Figure 9. ROV component diagram. The system includes (A) a 120 V AC–12 V DC power supply, (B) a Raspberry Pi 4 for vision processing, (C) six ESCs controlling (D) six thrusters, (E) a camera module, and (F) the ROV frame. A Tiva C microcontroller manages actuation, with a regulator supplying 5 V DC and an IMU for orientation control.
Automation 06 00051 g009
Figure 10. Experimental tests in a pool using AquaSignalNet to provide instructions to the ROV. (A) Recognition of the “UP” signal. (B) Recognition of the “BACK” signal. (C) Recognition of the “RIGHT” signal. (D) Recognition of the “LEFT” signal. (E) Free movement of the ROV during testing.
Automation 06 00051 g010
Figure 11. Examples of class generalization in an uncontrolled environment. Images captured by the ROV’s onboard camera show successful detection of visual signals (“right,” “100,” and “back”) during pool experiments, demonstrating its ability to recognize commands under natural underwater conditions not seen during training.
Automation 06 00051 g011
Figure 12. Autonomous trajectory 1 of the ROV. (A) Top view showing the trajectory guided by distributed visual signals. (B) Bottom view illustrating the same trajectory from a different perspective, where the signals direct the ROV from the lower right corner to the upper right corner.
Automation 06 00051 g012
Figure 13. Execution path of Trajectory 2. (A) Top view showing the ROV following a rectangular inspection path guided by visual signals. (B) Bottom view illustrating the continuation of the trajectory, where the ROV redirects toward the upper-right corner of the pool.
Automation 06 00051 g013
Table 1. Representative examples of the 13 classes in the UVSRD dataset, including PWM-based speed commands and directional actions class. Images were captured across varied water types, backgrounds, and perspectives to maximize dataset diversity.
Background TypeWater With Blue DyeClean WaterWater With Green Dye
WhiteAutomation 06 00051 i001Automation 06 00051 i002Automation 06 00051 i003
Pool tile mosaicAutomation 06 00051 i004Automation 06 00051 i005Automation 06 00051 i006
Simulated seabedAutomation 06 00051 i007Automation 06 00051 i008Automation 06 00051 i009
ClassesAutomation 06 00051 i010
Table 2. Precision per class during generalization validation in an uncontrolled pool condition. Results demonstrate the model’s ability to correctly classify directional commands and PWM-based speed signals under real experimental scenarios.
ClassPrecision (%)
STOP90
FRONT89
BACK88
LEFT88
RIGHT90
UP90
DOWN87
2089
4091
6090
8089
10090
Disclaimer/Publisher’s Note: The statements, opinions and data contained in all publications are solely those of the individual author(s) and contributor(s) and not of MDPI and/or the editor(s). MDPI and/or the editor(s) disclaim responsibility for any injury to people or property resulting from any ideas, methods, instructions or products referred to in the content.