
Wave Propagation and Structural Health Monitoring Application on Parts Fabricated by Additive Manufacturing


Abstract
:1. Introduction
2. Materials and Methods
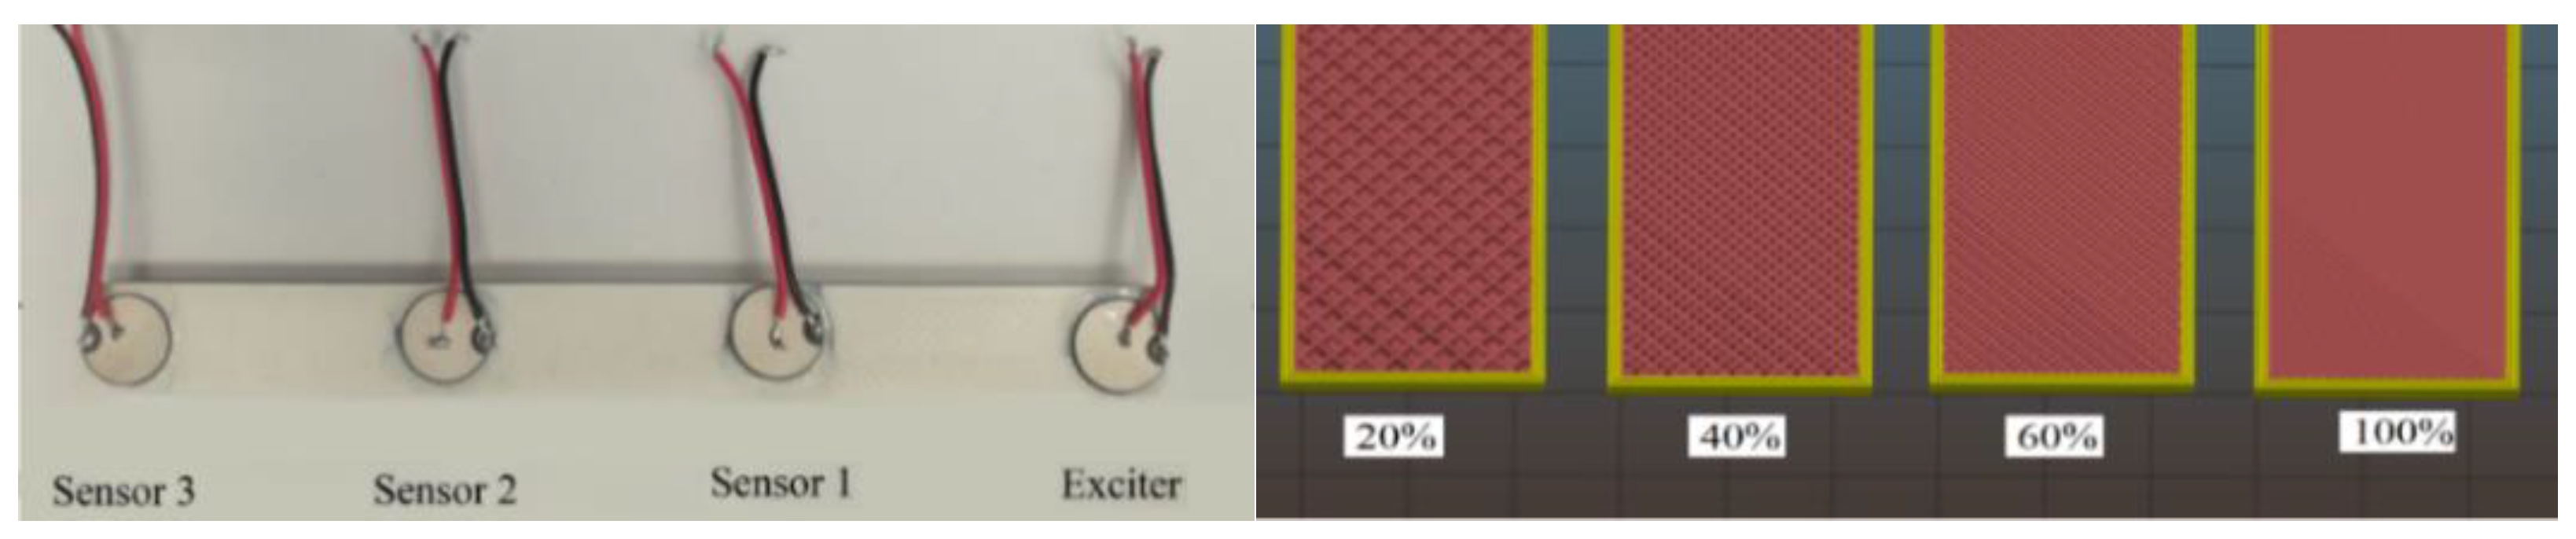
3. Experimental Setup
4. Results and Discussion
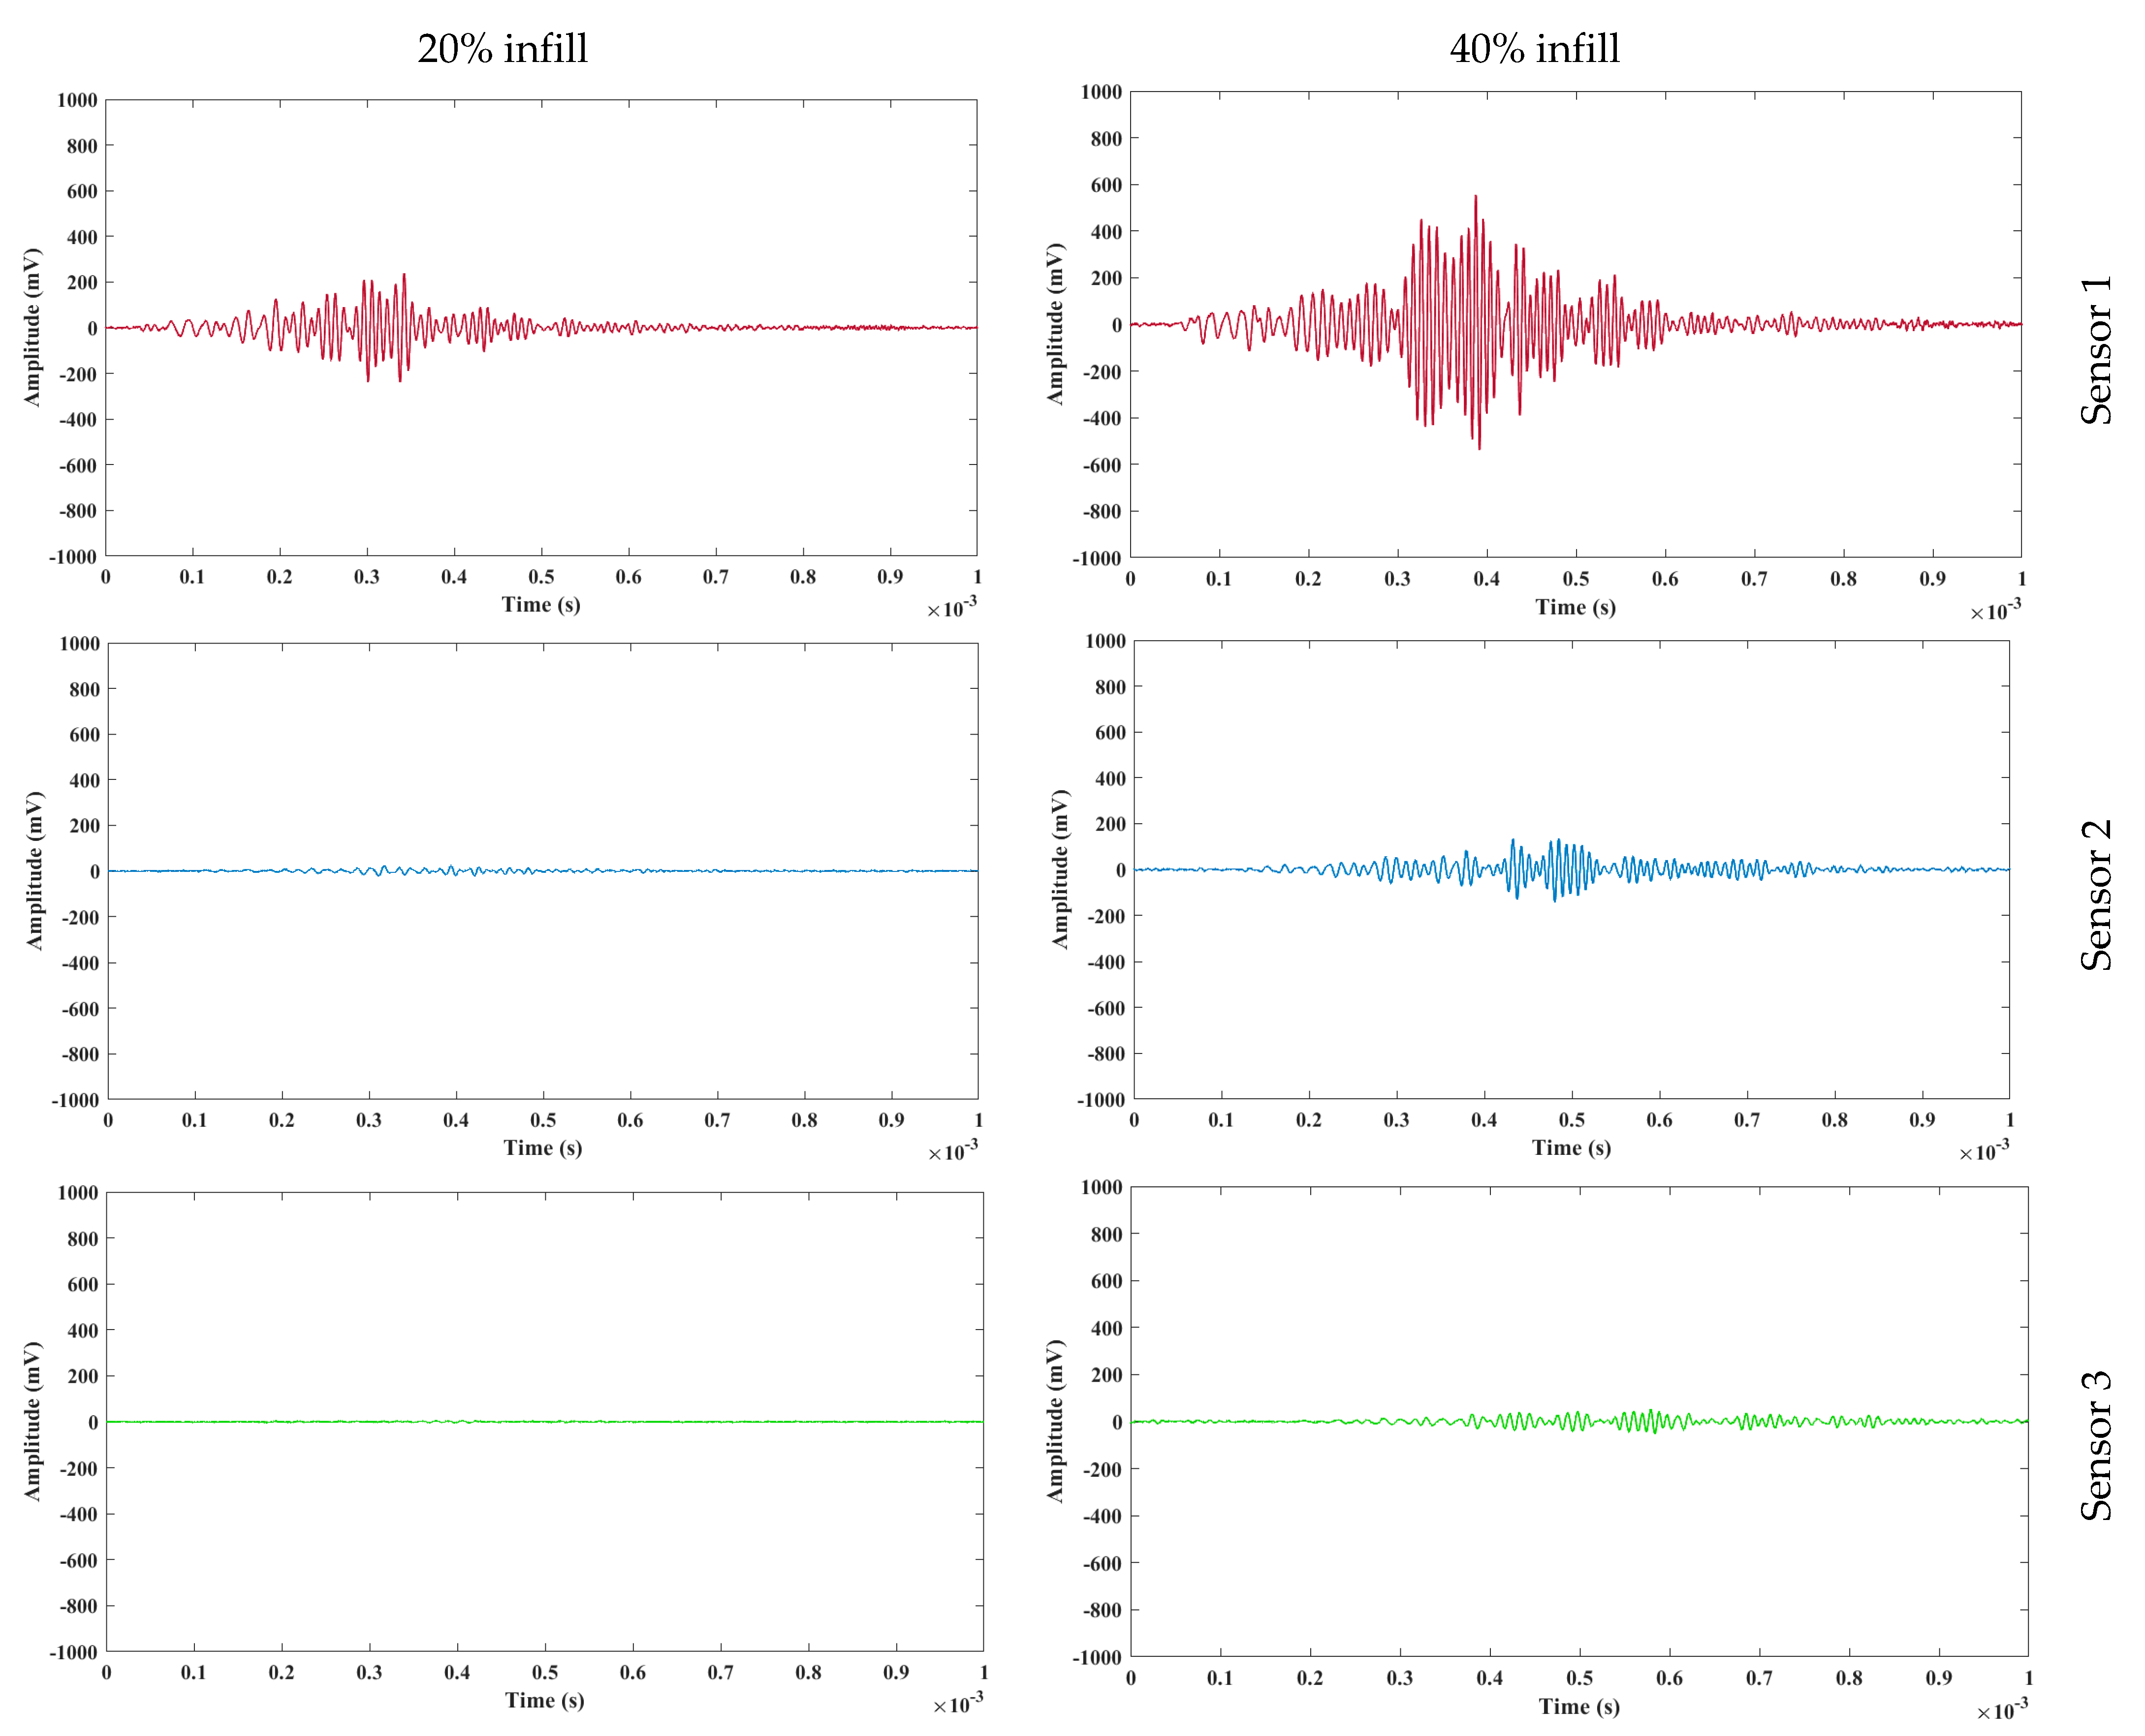
4.1. Time Domain
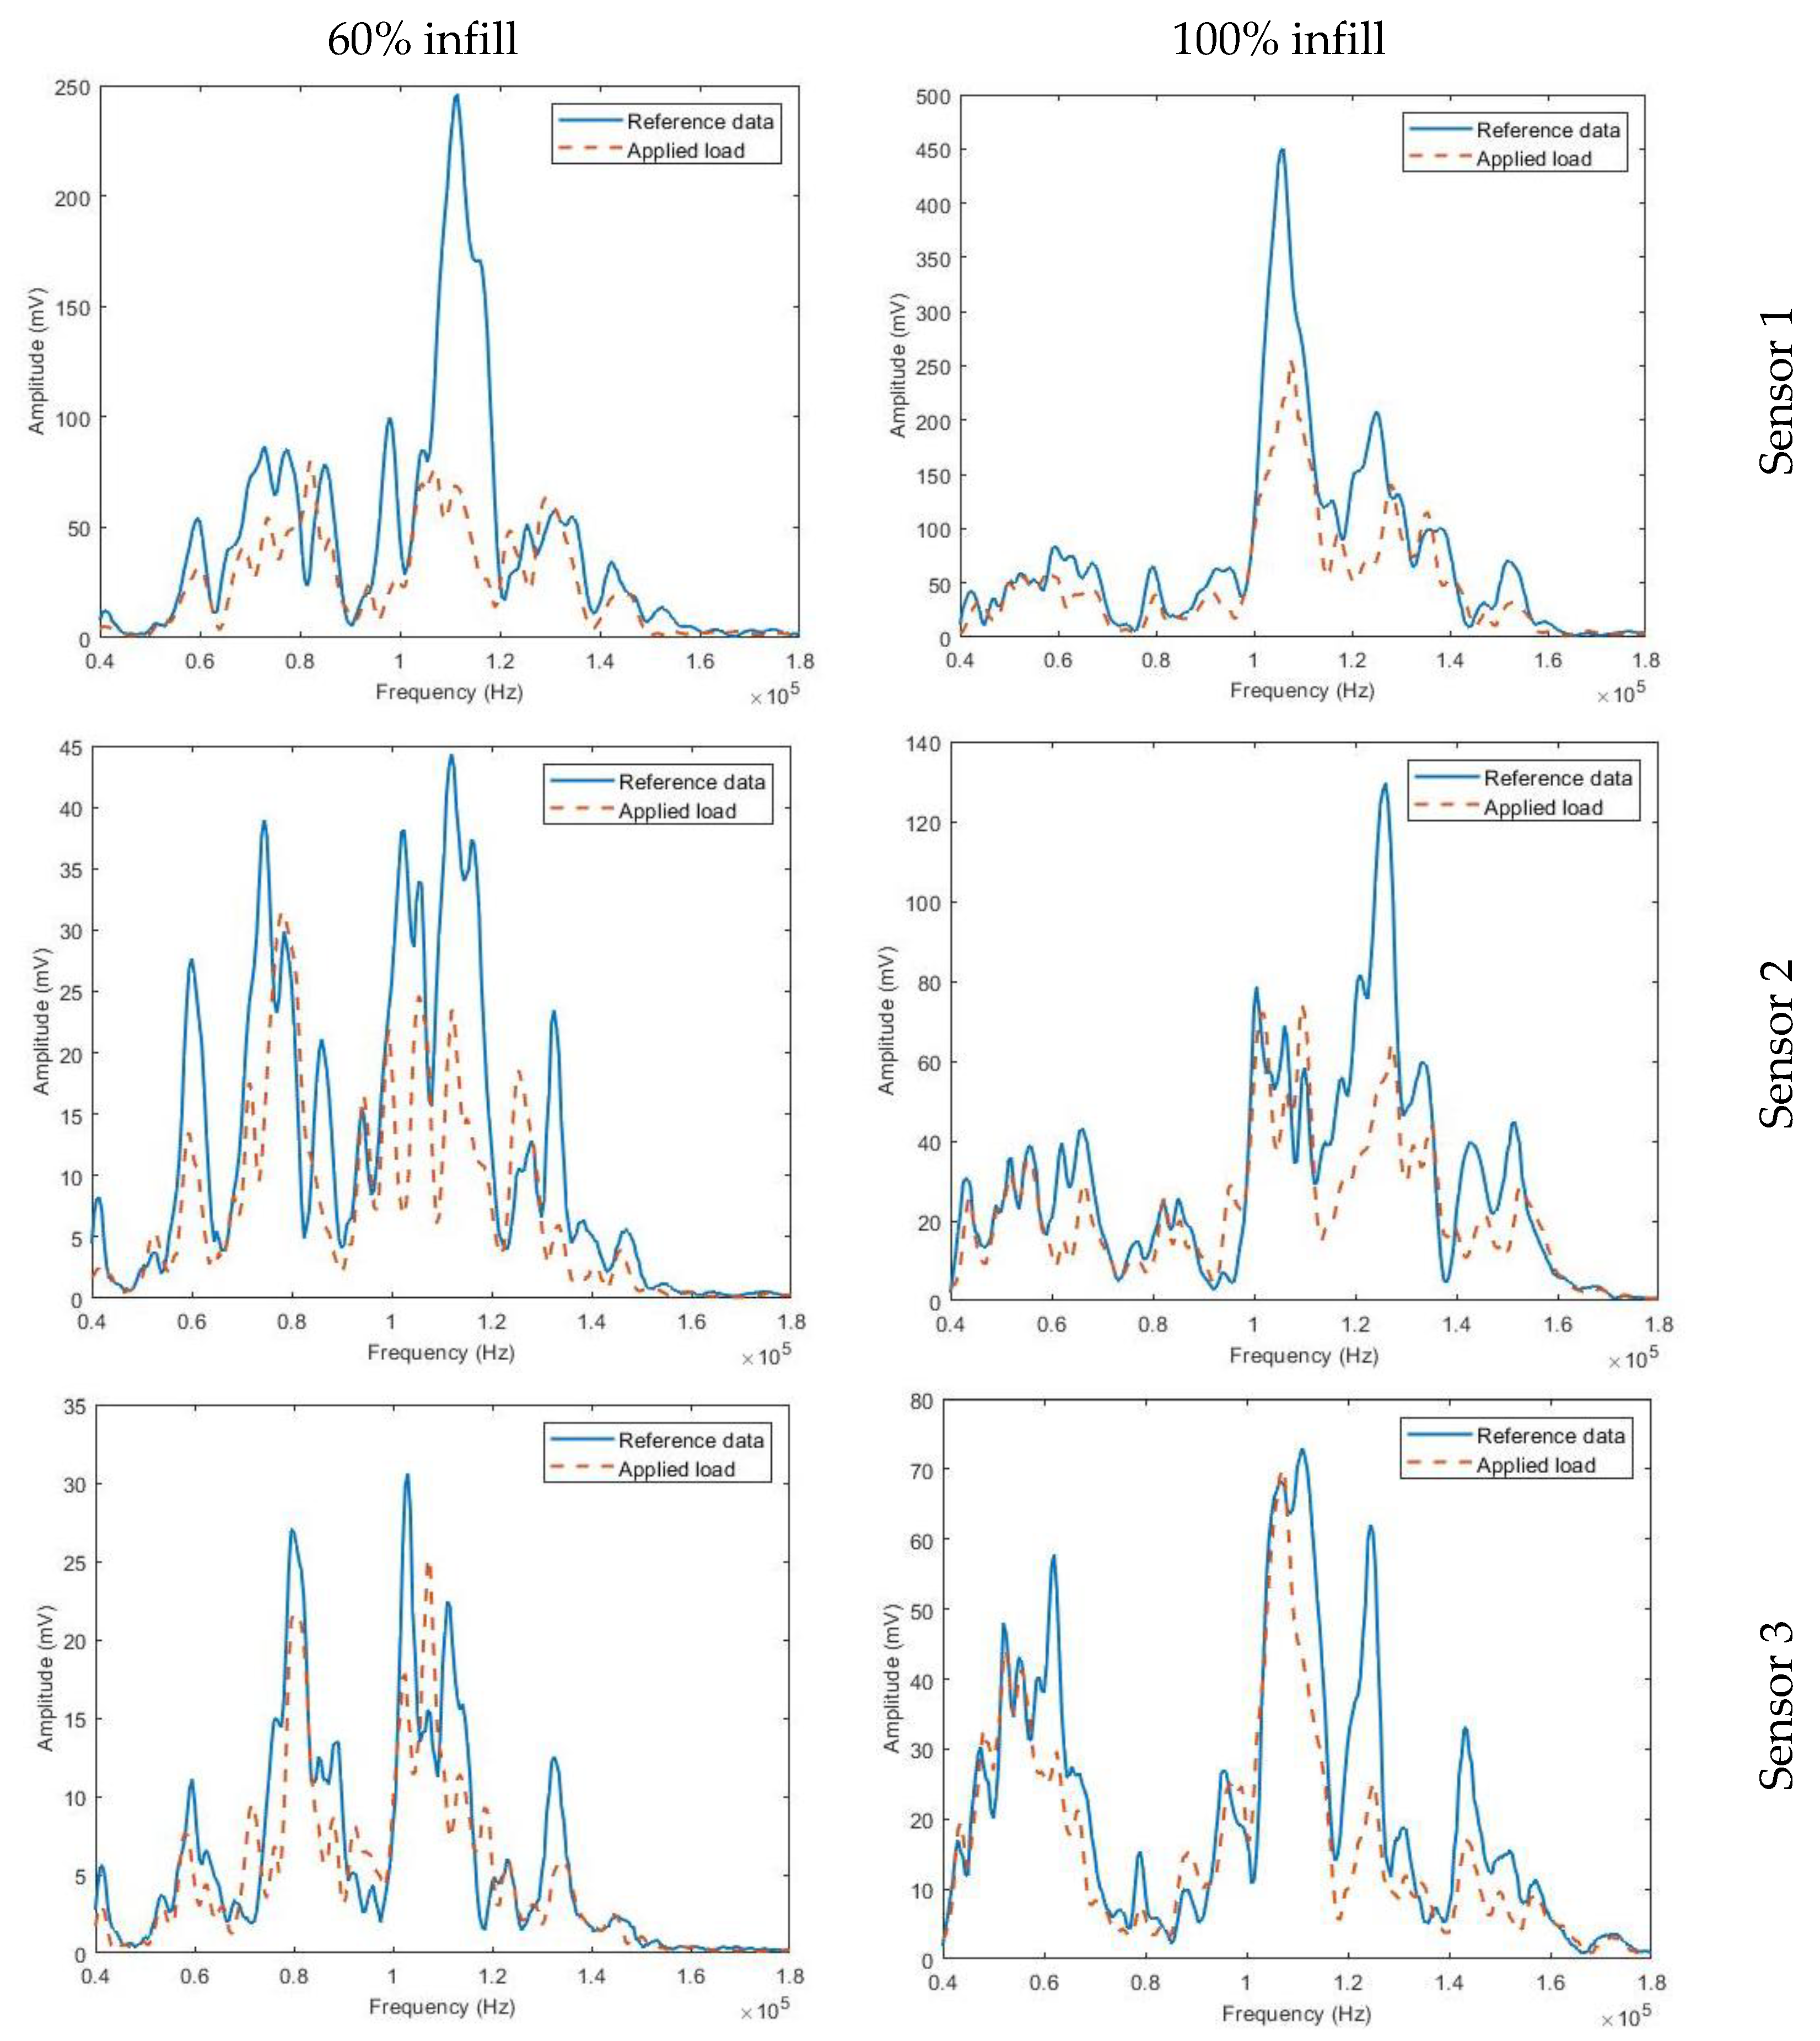
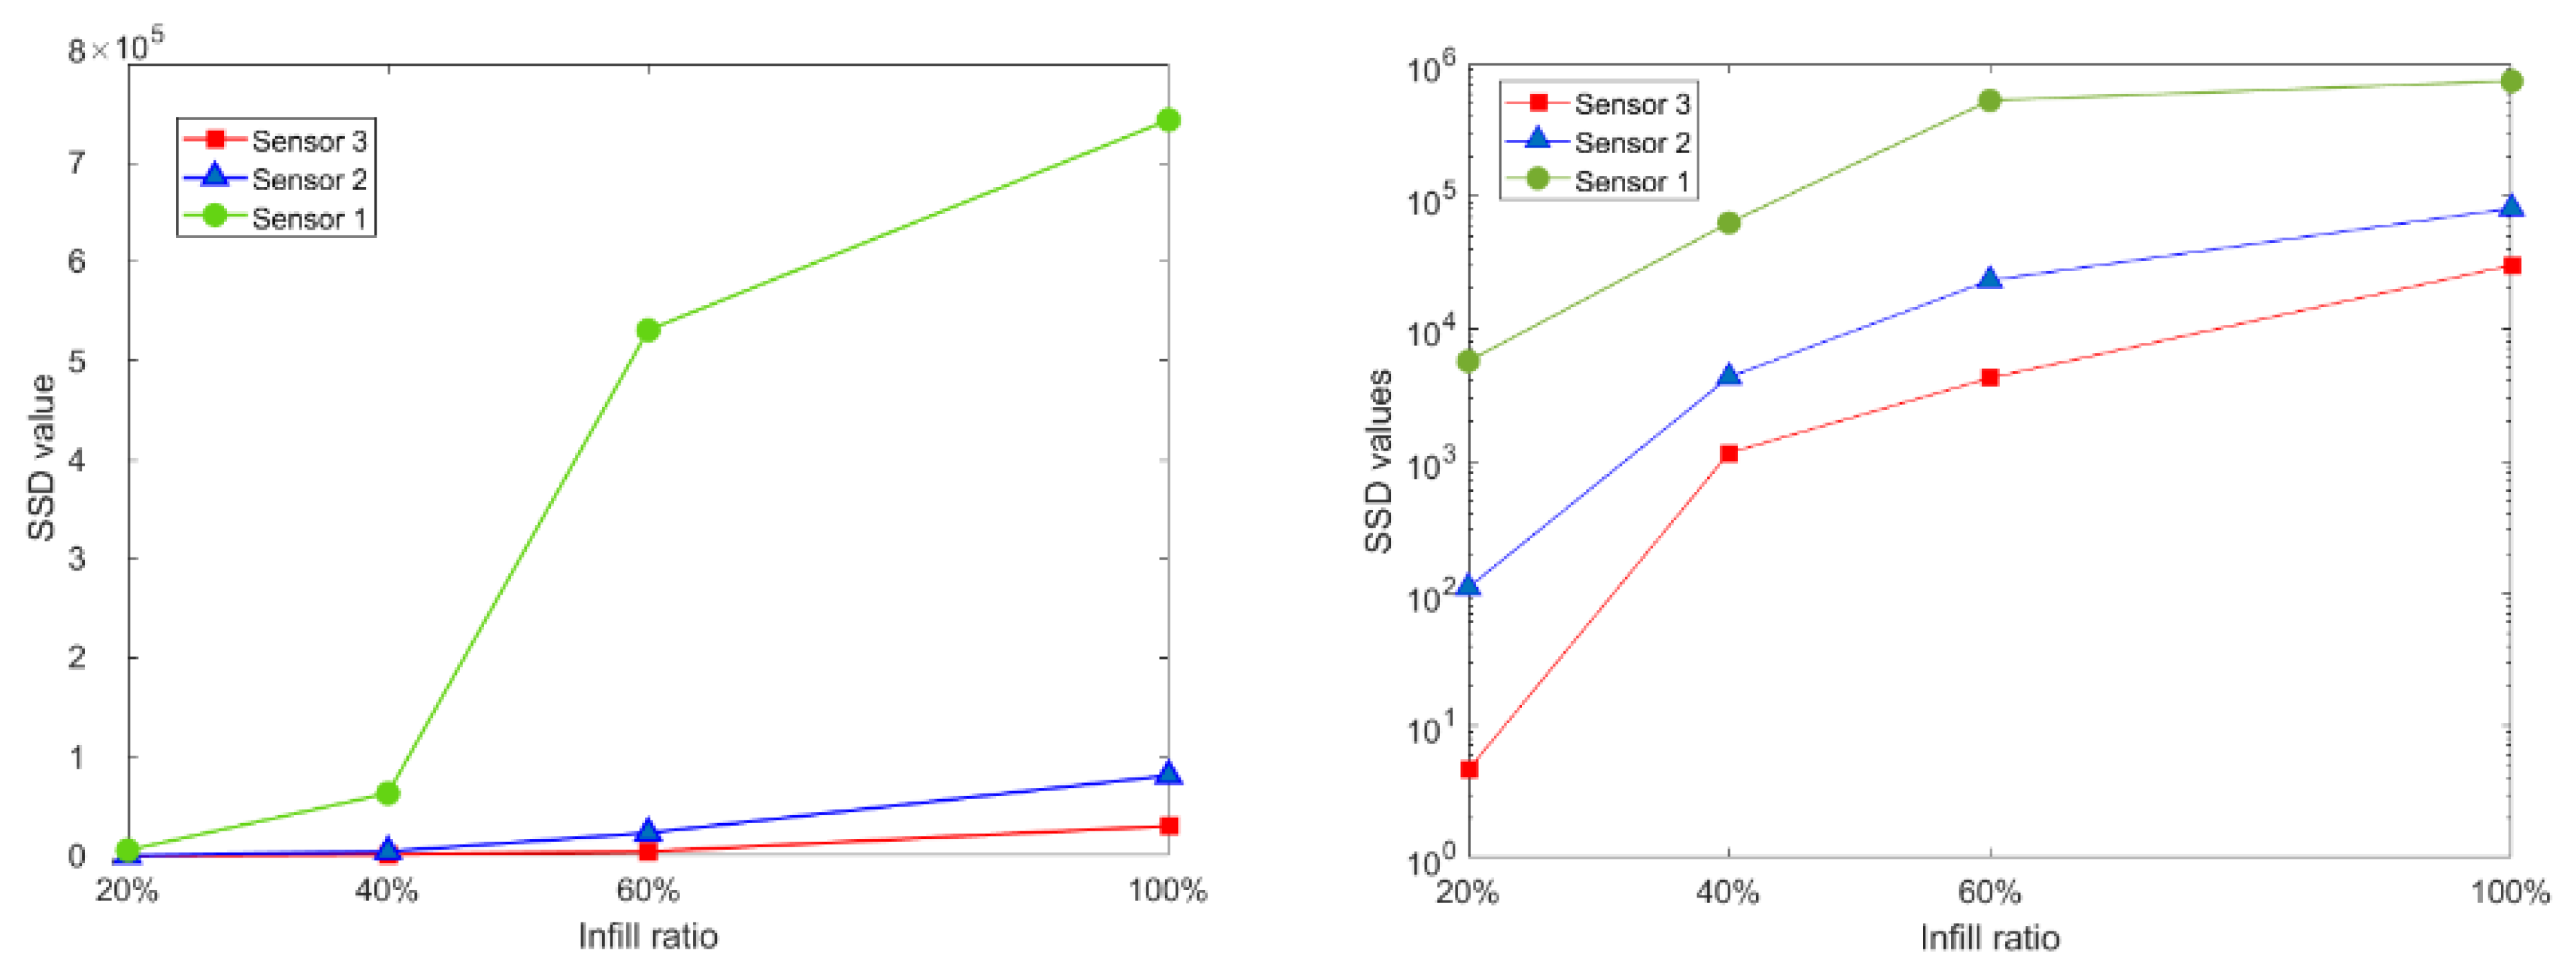
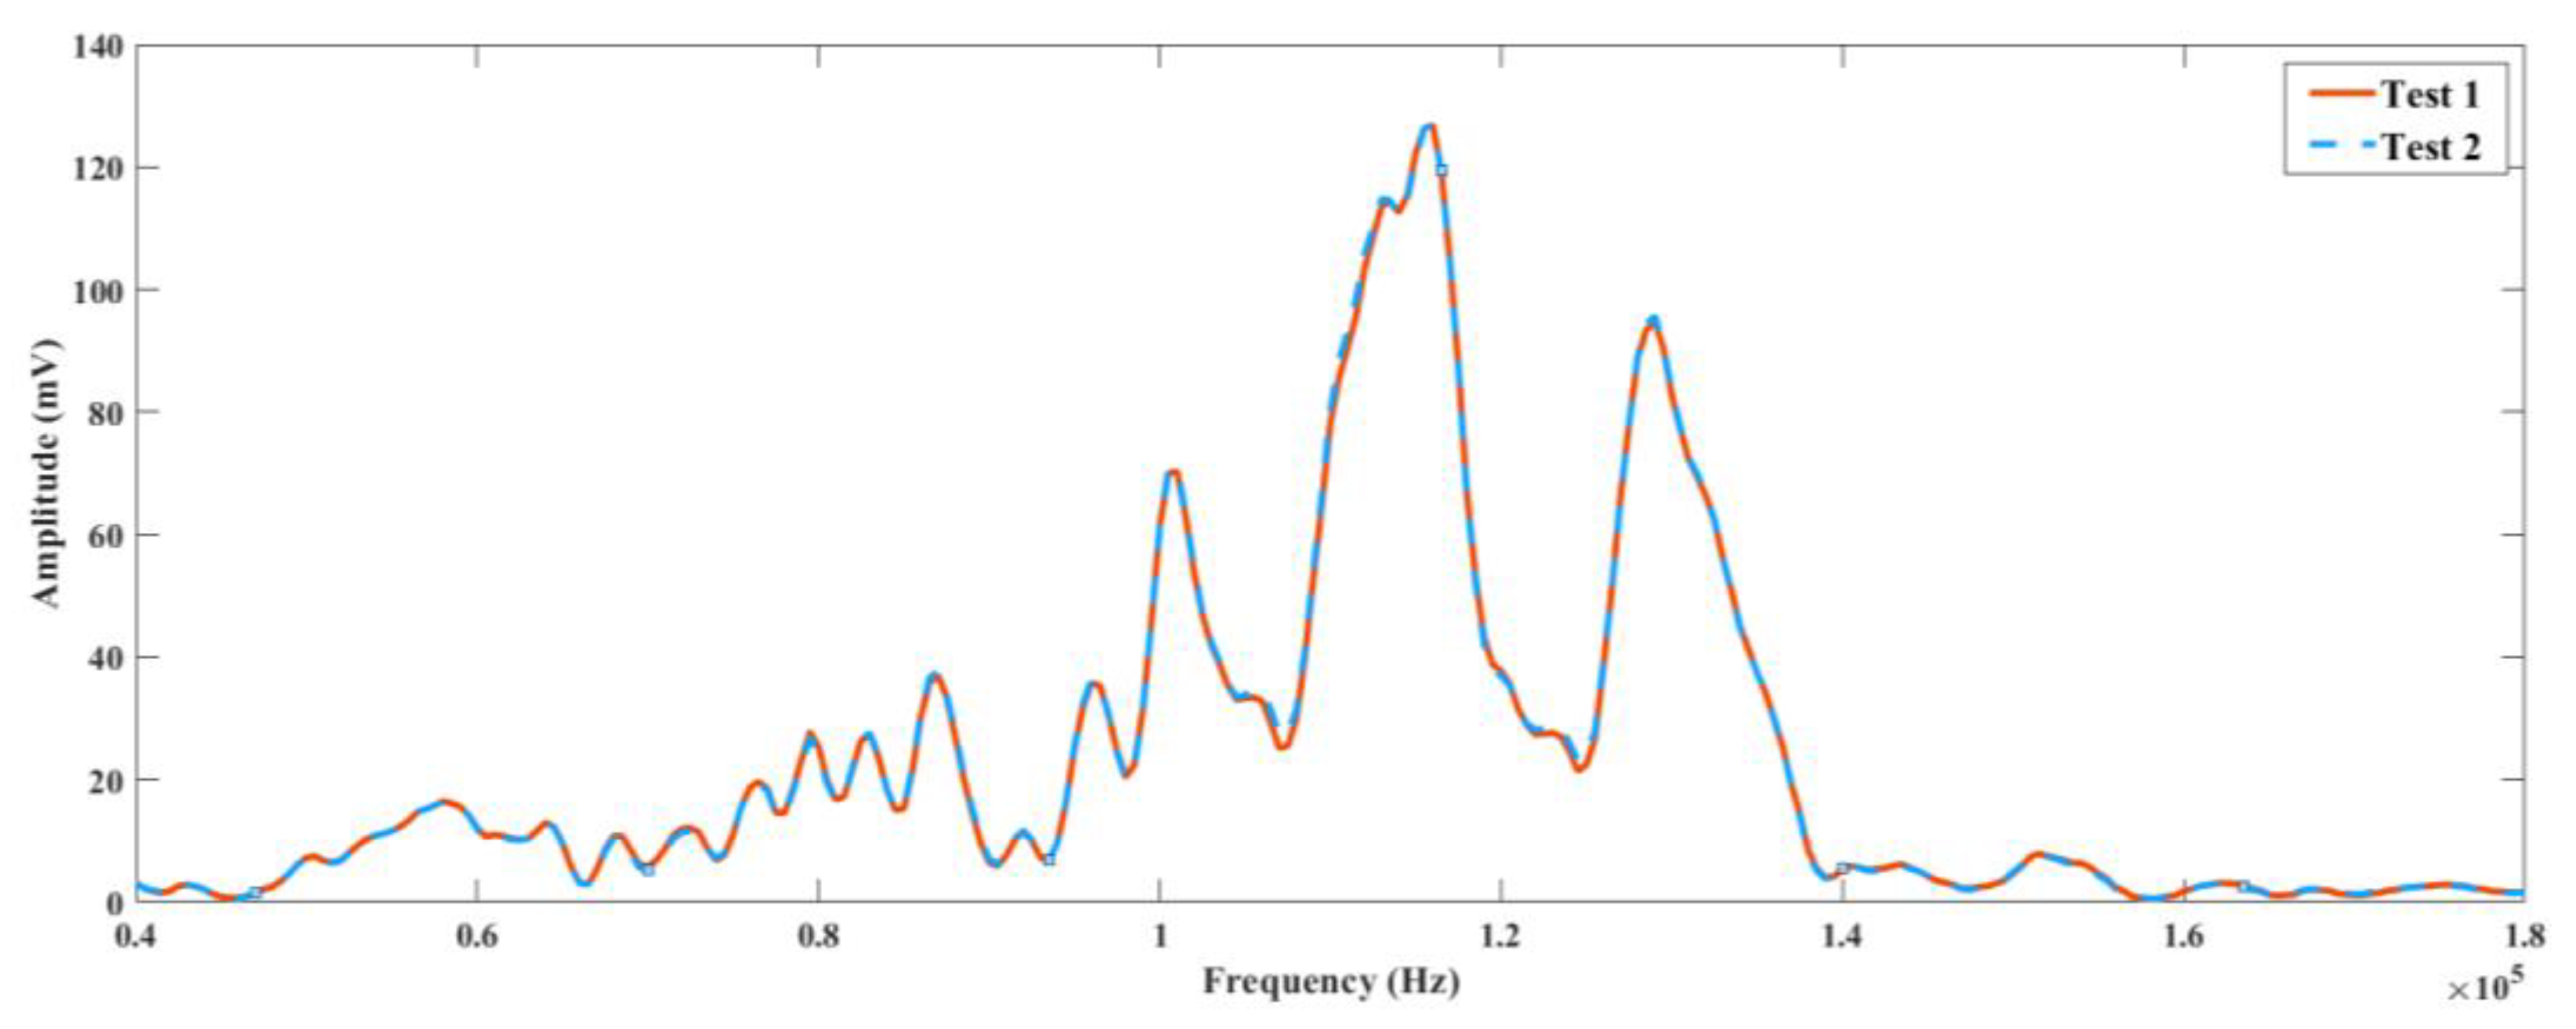
4.2. Frequency Domain
4.3. Estimation of the Wave Travel Speed
5. Conclusions
Author Contributions
Funding
Institutional Review Board Statement
Informed Consent Statement
Conflicts of Interest
References
- Conrad, A.; Isaac, S.; Cochran, R.; Sanchez-Rosales, D.; Wilens, B.; Gutha, A.; Rezaei, T.; Gauthier, D.J.; Kwiat, P. Drone-based quantum key distribution (QKD). Proc. SPIE 2021, 11678. [Google Scholar] [CrossRef]
- Giurgiutiu, V. Structural Health Monitoring: With Piezoelectric Wafer Active Sensors; Elsevier Science: Amsterdam, The Netherlands, 2014. [Google Scholar]
- Sharp, N.; Kuntz, A.; Brubaker, C.; Amos, S.; Gao, W.; Gupta, G.; Mohite, A.; Farrar, C.; Mascareñas, D. A bio-inspired asynchronous skin system for crack detection applications. Smart Mater. Struct. 2014, 23, 055020. [Google Scholar] [CrossRef]
- Salowitz, N.; Guo, Z.; Roy, S.; Nardari, R.; Li, Y.H.; Kim, S.J.; Kopsaftopoulos, F.; Chang, F.K. A vision on stretchable bio-inspired networks for intelligent structures. In Proceedings of the 9th International Workshop on Structural Health Monitoring, Stanford, CA, USA, 10–12 September 2013; pp. 35–44. [Google Scholar]
- Yi, T.H.; Huang, H.B.; Li, H.N. Development of sensor validation methodologies for structural health monitoring: A comprehensive review. Measurement 2017, 109, 200–214. [Google Scholar] [CrossRef]
- Sturm, L.D.; Albakri, M.I.; Tarazaga, P.A.; Williams, C.B. In situ monitoring of material jetting additive manufacturing process via impedance based measurements. Adv. Manuf. 2019, 28, 456463. [Google Scholar] [CrossRef]
- Wang, K.; Zhao, Y.; Chang, Y.; Qian, Z.; Zhang, C.; Wang, B.; Vannan, M.A.; Wang, M.-J. Controlling the mechanical behavior of dual-material 3D printed meta-materials for patient-specific tissue-mimicking phantoms. Mater. Des. 2016, 90, 704–712. [Google Scholar] [CrossRef]
- Mohamed, O.A.; Masood, S.H.; Bhowmik, J.L. Optimization of fused deposition modeling process parameters: A review of current research and future prospects. Adv. Manuf. 2015, 3, 42–53. [Google Scholar] [CrossRef]
- Koskelo, E.C.; Flynn, E.B. Scanning laser ultrasound and wavenumber spectroscopy for in-process inspection of additively manufactured parts. Proc. SPIE 2016, 9804. [Google Scholar] [CrossRef]
- Cummings, I.; Hillstrom, E.; Newton, R.; Flynn, E.; Wachtor, A. In-process ultrasonic inspection of additive manufactured parts. In Topics in Modal Analysis & Testing; Springer: Cham, Switzerland, 2016; Volume 10, pp. 235–247. [Google Scholar]
- Schwerdtfeger, J.; Singer, R.F.; Körner, C. In situ flaw detection by IR-imaging during electron beam melting. Rapid Prototyp. J. 2012, 18, 259–263. [Google Scholar] [CrossRef]
- Dinwiddie, R.B.; Dehoff, R.R.; Lloyd, P.D.; Lowe, L.E.; Ulrich, J.B. Thermographic in-situ process monitoring of the electron-beam melting technology used in additive manufacturing. Proc. SPIE 2013, 8705. [Google Scholar] [CrossRef]
- Jimbo, K.; Tateno, T. Shape contraction in sintering of 3d objects fabricated via metal material extrusion in additive manufacturing. Int. J. Autom. Technol. 2019, 13, 354–360. [Google Scholar] [CrossRef]
- Ait-Mansour, I.; Kretzschmar, N.; Chekurov, S.; Salmi, M.; Rech, J. Design-dependent shrinkage compensation modeling and mechanical property targeting of metal FFF. Prog. Addit. Manuf. 2020, 5, 51–57. [Google Scholar] [CrossRef] [Green Version]
- Tapia, G.; Elwany, A. A review on process monitoring and control in metal-based additive manufacturing. J. Manuf. Sci. Eng. 2014, 136. [Google Scholar] [CrossRef]
- Reutzel, E.W.; Nassar, A.R. A survey of sensing and control systems for machine and process monitoring of directed-energy, metal-based additive manufacturing. Rapid Prototyp. J. 2015, 21, 159–167. [Google Scholar] [CrossRef] [Green Version]
- Chua, Z.Y.; Ahn, I.H.; Moon, S.K. Process monitoring and inspection systems in metal additive manufacturing: Status and applications. Int. J. Precis. Eng. Manuf. Green Technol. 2017, 4, 235–245. [Google Scholar] [CrossRef]
- Caminero, M.A.; García-Moreno, I.; Rodríguez, G.P.; Chacón, J.M. Internal damage evaluation of composite structures using phased array ultrasonic technique: Impact damage assessment in CFRP and 3D printed reinforced composites. Compos. Part B Eng. 2019, 165, 131–142. [Google Scholar] [CrossRef]
- Akmal, J.S.; Salmi, M.; Mäkitie, A.; Björkstrand, R.; Partanen, J. Implementation of industrial additive manufacturing: Intelligent implants and drug delivery systems. J. Funct. Biomater. 2018, 9, 41. [Google Scholar] [CrossRef] [Green Version]
- Sbriglia, L.R.; Baker, A.M.; Thompson, J.M.; Morgan, R.V.; Wachtor, A.J.; Bernardin, J.D. Embedding sensors in FDM plastic parts during additive manufacturing. Top. Modal Anal. Test. 2016, 10, 205–214. [Google Scholar]
- Lee, M.S.; Lee, J.; Sung, H.; Choe, J.; Son, H.J.; Yun, J.; Kim, K.; Kim, M.; Lee, S.W.; Yang, S.; et al. Embedding Sensors using Selective Laser Melting for Self-Cognitive Metal Parts. Addit. Manuf. 2020, 33, 101151. [Google Scholar]
- Rafieipour, H.; Zadeh, A.A.; Mirzaei, M. Distributed Frequent Itemset Mining with Bitwise Method and Using the Gossip-Based Protocol. J. Soft Comput. Decis. Support Syst. 2020, 7, 32–39. [Google Scholar]
- Albakri, M.I.; Sturm, L.D.; Williams, C.B.; Tarazaga, P.A. Impedance-based non-destructive evaluation of additively manufactured parts. Rapid Prototyp. J. 2017, 23, 589–601. [Google Scholar] [CrossRef]
- Na, W.; Baek, J. A review of the piezoelectric electromechanical impedance based structural health monitoring technique for engineering structures. Sensors 2018, 18, 1307. [Google Scholar] [CrossRef] [Green Version]
- Sun, F.P.; Liang, C.; Rogers, C.A. Structural modal analysis using collocated piezoelectric actuator/sensors: An electromechanical approach. Smart Structures and Materials. Smart Struct. Intell. Syst. 1994, 2190, 238–249. [Google Scholar]
- Park, G.; Cudney, H.H.; Inman, D.J. An integrated health monitoring technique using structural impedance sensors. J. Intell. Mater. Syst. Struct. 2000, 11, 448–455. [Google Scholar] [CrossRef]
- Mascarenas, D.L.; Todd, M.D.; Park, G.; Farrar, C.R. Development of an impedance-based wireless sensor node for structural health monitoring. Smart Mater. Struct. 2007, 16, 2137. [Google Scholar] [CrossRef] [Green Version]
- Annamdas, V.G.M.; Soh, C.K. Load monitoring using a calibrated piezo diaphragm based impedance strain sensor and wireless sensor network in real time. Smart Mater. Struct. 2017, 26, 045036. [Google Scholar] [CrossRef]
- Mohamed, A.F.; Shah, K.Y.; Tansel, I.N. Compressive Force Location Estimation with SuRE Method for Additively Manufactured Parts. Procedia Manuf. 2019, 39, 465–473. [Google Scholar] [CrossRef]
- Shah, K.Y.; Mohamed, A.F.; Tansel, I.N. Additively Manufactured Multi-Material Parts with Defect Detection Capabilities. Procedia Manuf. 2019, 39, 493–501. [Google Scholar] [CrossRef]
- Tashakori, S.; Baghalian, A.; Senyurek, V.Y.; Farhangdoust, S.; McDaniel, D.; Tansel, I.N. Composites Bond Inspection Using Heterodyne Effect and SuRE Methods. Shock. Vib. 2018, 2018, 1361932. [Google Scholar] [CrossRef]
- Mohamed, A.F.; Modir, A.; Tansel, I.N.; Uragun, B. Detection of Compressive Forces Applied to Tubes and Estimation of Their Locations with the Surface Response to Excitation (SuRE) Method. In Proceedings of the 2019 9th International Conference on Recent Advances in, Istanbul, Turkey, 11–14 June 2019; pp. 83–88. [Google Scholar]
- Mohamed, A.F.; Modir, A.; Shah, K.Y.; Tansel, I. Control of the Building Parameters of Additively Manufactured Polymer Parts for More Effective Implementation of Structural Health Monitoring (SHM) Methods. Struct. Health Monit. 2019, 2019. [Google Scholar] [CrossRef]
- Ingole, D.S.; Deshmukh, T.R.; Kuthe, A.M.; Ashtankar, K.M. Build orientation analysis for minimum cost determination in FDM. Proc. Inst. Mech. Eng. Part B J. Eng. Manuf. 2011, 225, 1925–1938. [Google Scholar] [CrossRef]
- Tashakori, S.; Baghalian, A.; Unal, M.; Fekrmandi, H.; McDaniel, D.; Tansel, I.N. Contact and non-contact approaches in load monitoring applications using surface response to excitation method. Measurement 2016, 89, 197–203. [Google Scholar] [CrossRef]
- Fekrmandi, H.; Rojas, J.; Campbell, J.; Tansel, I.N.; Kaya, B.; Taskin, S. Inspection of the integrity of a multi-bolt robotic arm using a scanning laser vibrometer and implementing the surface response to excitation method (SuRE). Int. J. Progn. Health Manag. 2014, 5. [Google Scholar] [CrossRef]
- Baghalian, A.; Tahakori, S.; Fekrmandi, H.; Unal, M.; Senyurek, V.Y.; McDaniel, D.; Tansel, I.N. Implementation of the surface response to excitation method for pipes. In Mechanics of Composite and Multi-Functional Materials; Springer: Cham, Switzerland, 2017; Volume 7, pp. 261–266. [Google Scholar]
- Tashakori, S.; Baghalian, A.; Unal, M.; Senyurek, V.Y.; Fekrmandi, H.; McDaniel, D.; Tansel, I.N. Load monitoring using surface response to excitation method. In Mechanics of Composite and Multi-Functional Materials; Springer: Cham, Switzerland, 2017; Volume 7, pp. 209–214. [Google Scholar]
- Luangvilai, K. Attenuation of Ultrasonic Lamb Waves with Applications to Material Characterization and Condition Monitoring. Ph.D. Thesis, Georgia Institute of Technology, Atlanta, GA, USA, August 2007. [Google Scholar]
- Huang, S.; Zhang, Y.; Wang, S.; Zhao, W. Multi-mode electromagnetic ultrasonic lamb wave tomography imaging for variable-depth defects in metal plates. Sensors 2016, 16, 628. [Google Scholar] [CrossRef] [PubMed] [Green Version]
- Lee, B.C.; Staszewski, W.J. Lamb wave propagation modelling for damage detection: I. Two-dimensional analysis. Smart Mater. Struct. 2007, 16, 249. [Google Scholar] [CrossRef]
- Modir, A.; Tansel, I.N. Implementation of the surface thickness on additively manufactured parts for estimation of the loading location. Smart Mater. Struct. 2020, 30, 025032. [Google Scholar] [CrossRef]
- Agu, H.O.; Hameed, A.; Appleby-Thomas, G.J.; Wood, D.C. The dynamic response of dense 3 dimensionally printed polylactic acid. J. Dyn. Behav. Mater. 2016, 5, 377–386. [Google Scholar] [CrossRef] [Green Version]


| Parameter | Value | Unit |
|---|---|---|
| Layer height | 0.1 | mm |
| Printing temperature | 210 | °C |
| Build plate temperature | 60 | °C |
| Print speed | 70 | mm/s |
| Top and bottom solid layers | 3 | -- |
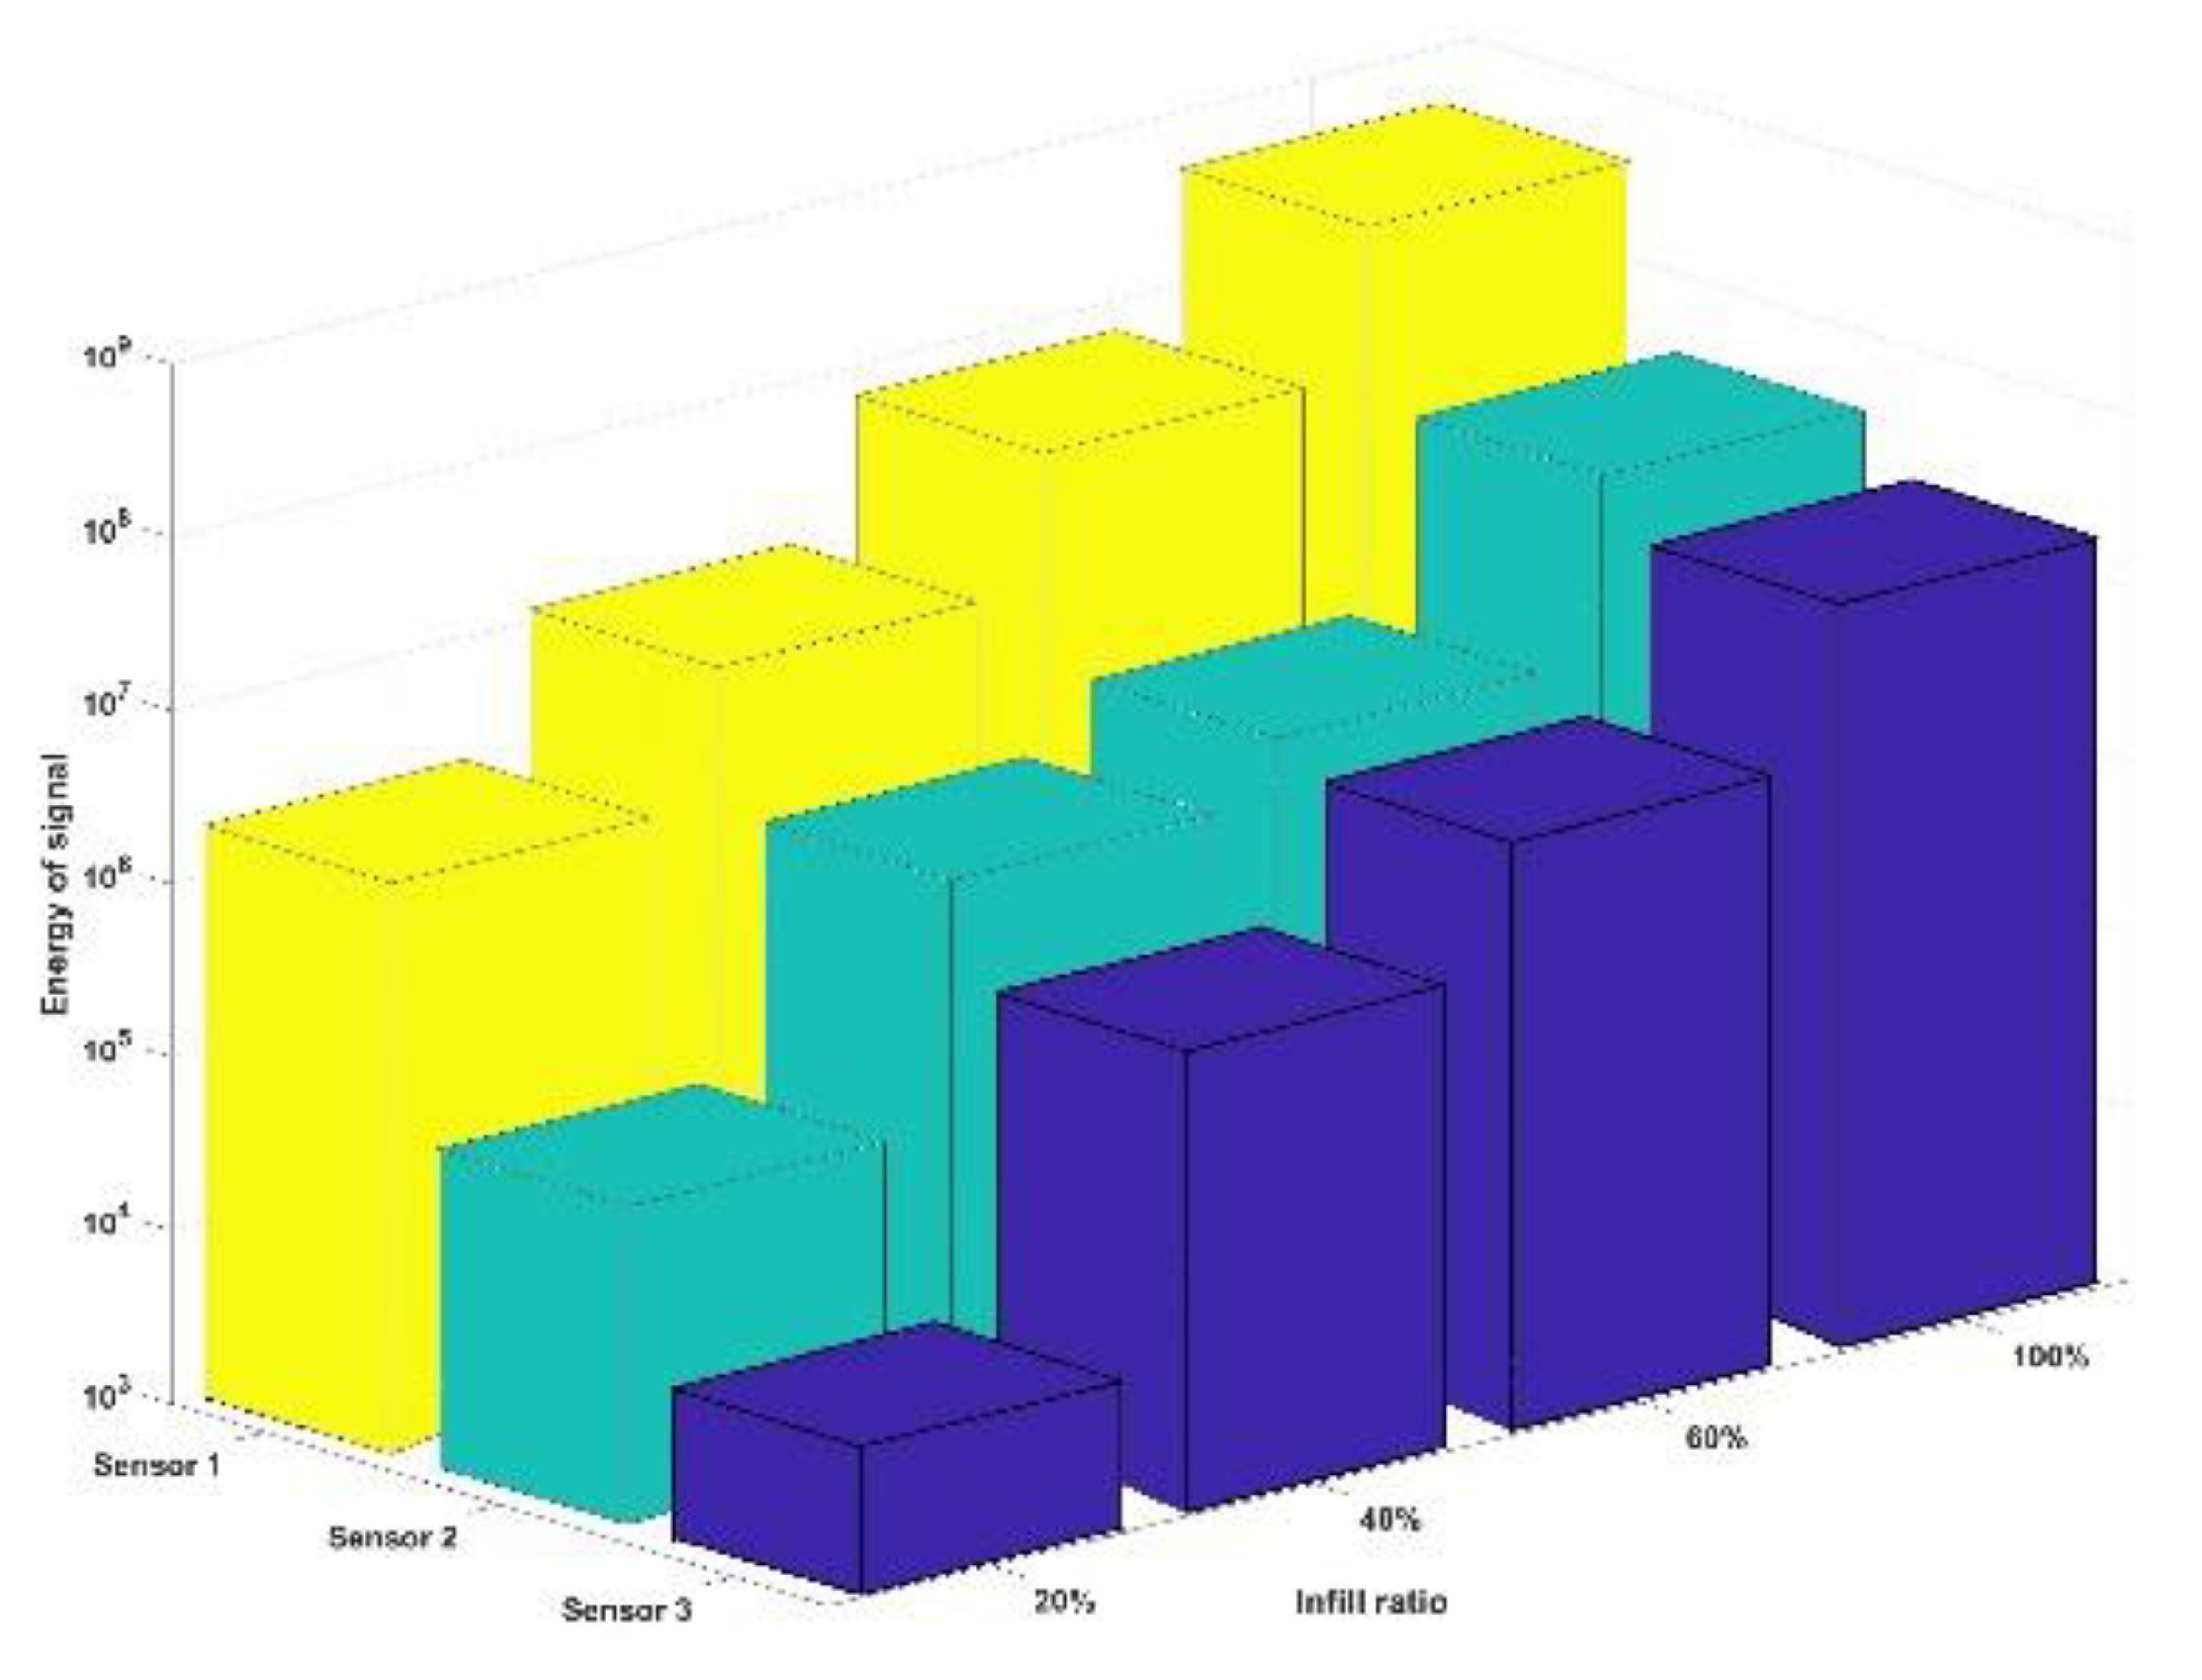
| 20% Infill | 40% Infill | 60% Infill | 100% Infill | |
|---|---|---|---|---|
| Sensor 1 | 6.15 | 35.76 | 125.55 | 207.12 |
| Sensor 2 | 0.51 | 22.57 | 45.43 | 133.91 |
| Sensor 3 | 0.38 | 11.12 | 29.51 | 113.01 |
Publisher’s Note: MDPI stays neutral with regard to jurisdictional claims in published maps and institutional affiliations. |
© 2021 by the authors. Licensee MDPI, Basel, Switzerland. This article is an open access article distributed under the terms and conditions of the Creative Commons Attribution (CC BY) license (https://creativecommons.org/licenses/by/4.0/).
Share and Cite
Modir, A.; Tansel, I. Wave Propagation and Structural Health Monitoring Application on Parts Fabricated by Additive Manufacturing. Automation 2021, 2, 173-186. https://doi.org/10.3390/automation2030011
Modir A, Tansel I. Wave Propagation and Structural Health Monitoring Application on Parts Fabricated by Additive Manufacturing. Automation. 2021; 2(3):173-186. https://doi.org/10.3390/automation2030011
Chicago/Turabian StyleModir, Alireza, and Ibrahim Tansel. 2021. "Wave Propagation and Structural Health Monitoring Application on Parts Fabricated by Additive Manufacturing" Automation 2, no. 3: 173-186. https://doi.org/10.3390/automation2030011
APA StyleModir, A., & Tansel, I. (2021). Wave Propagation and Structural Health Monitoring Application on Parts Fabricated by Additive Manufacturing. Automation, 2(3), 173-186. https://doi.org/10.3390/automation2030011