Article

Wave Propagation and Structural Health Monitoring Application on Parts Fabricated by Additive Manufacturing

Department of Mechanical and Material Engineering, Florida International University, Miami, FL 33174, USA
*
Author to whom correspondence should be addressed.
Automation 2021, 2(3), 173-186; https://doi.org/10.3390/automation2030011
Submission received: 13 July 2021 / Revised: 10 August 2021 / Accepted: 17 August 2021 / Published: 18 August 2021

Abstract

:
Additive manufacturing (AM) applications have been steadily increasing in many industry sectors. AM allows creating complex geometries inside of a part to leave some space empty, called infills. Lighter parts are manufactured in a shorter time with less warpage if the strength of the part meets the design requirements. While the benefits of structural health monitoring (SHM) have been proven in different structures, few studies have investigated SHM methods on AM parts. In this study, the relationship between wave propagation and infill density has been studied for the additively manufactured polymer parts. The propagation of surface waves is monitored by using piezoelectric elements. Four rectangular parts are manufactured by using the material extrusion method with 20%, 40%, 60%, and 100% rectilinear infill densities. Four piezoelectric elements were attached on the surface of each beam, one for excitation and three for monitoring the response of the part at equal distances on each part. The results demonstrated that the surface waves diminish faster at parts with lower densities. The received signal in the part with totally solid infills showed about 10 times higher amplitudes compare with the part with 20% infill. The surface response to excitation (SuRE) method was used for sensing the loading on the part. Also, the wave propagation speed was calculated with exciting parts with a pulse signal with a 10-microsecond duration. The wave propagation speed was almost the same for all infill densities.

1. Introduction

Structural health monitoring (SHM) methods have been used for the estimation of the external force and detection of defects such as crack initiation, delamination, and loose bolts. In recent years, SHM has gained a lot of attention from researchers in different fields including the aerospace, civil, marine, and military fields [1]. Employing SHM has various beneficial aspects including assuring the safe operation of the system, enhancing the life span of the structures, and reducing the maintenance cost [2]. SHM approaches can be divided into two main groups, active and passive SHM. Strain, acoustic emission, temperature, and other similar signals are monitored by the passive SHM and the condition of the structure can be estimated based on the characteristics of the collected data. Although passive SHM is helpful, it does not provide information as effectively as active SHM. On the other hand, active SHM systems generally acquire more reliable information about the structure, independent of the operation of the system, by providing a carefully selected excitation signal in a very consistent manner [2]. The biological nervous system was an inspiration for researchers at the development of the SHM systems [3,4]. However, extensive additional research is needed to improve the capabilities and reduce the cost of the SHM systems to make them usable in consumer products. Each SHM system usually contains three main sections: sensors, data acquisition systems, and a health evaluation unit [5]. Most of the SHM studies have been focused on aerospace and civil engineering structures. In active SHM methods, piezoelectric actuators are usually used to excite the structure and monitor the response of the structure at desired locations. The relationship between the excitation signal and the response signal can be monitored and modeled by different methods [6]. In linear SHM methods, the defects, loading conditions, or loose bolts can be detected by recording a baseline when the structure is in a relaxed condition and comparing the incoming signal characteristics with the baseline.
SHM methods have been used for the evaluation of the condition of the additively manufactured parts. Additive manufacturing (AM) methods were developed to manufacture the prototypes several decades ago. However, recently they have been used to manufacture polymer and metal parts for various aerospace, industrial, and medical applications. Material extrusion, which is also known as fused deposition modeling (FDM), is the most well-known AM method and one of the simplest, cheapest, and widely used methods in AM [7]. Printers operating with the material extrusion method are capable of using filaments in a wide range of materials, such as polylactic acid (PLA), thermoplastic polyurethane (TPU), acrylonitrile butadiene styrene (ABS), polyethylene terephthalate (PET), and acrylonitrile styrene acrylate (ASA) [8]. Many researchers used ultrasonic testing techniques for the detection of defects in parts during FDM manufactured process [9,10]. Surface monitoring with the aid of image-based sensors is one of the common methods of in-situ monitoring for defect detection in additive manufacturing systems [11,12]. Koki and Tateno [13] investigated the effect of metal fillers on the shrinkage of the metal part fabricated with the material extrusion method. Ait-Mansour et al. [14] studied the effect of print parameters on the multidimensional shrinkage and the mechanical properties of the 3D-printed metallic parts. Comprehensive reviews of different approaches in monitoring metal-based additive manufacturing can be found in [15,16,17]. Caminero et al. [18] implemented a non-destructive technique for the evaluation of the 3D printed parts. They used phase array ultrasonic testing for the detection of damages caused by impacts on the specimen. Akmal et al. [19] embedded a transponder inside additive manufactured mandlibs fabricated with four different AM methods. They proved that AM can be used for embedded RFID systems. In another study using embedded sensors in AM parts, Sbriglia et al. [20] inserted a piezoelectric accelerometer inside a PLA part for measuring the response of the part to the excitations from an electrodynamic shaker. Lee et al. [21] embedded sensors in metallic parts fabricated with the selective laser melting (SLM) process in three steps and compared the mechanical properties of it with parts fabricated in a normal SLM process. Rafieipour et al. [22] presented a new method to extract the frequency of sensors in a wireless sensor network that utilizes the distributed sensor environment.
Electromechanical impedance (EMI) and the surface response to the excitation (SuRE) method are two of the known active SHM techniques. Albakri et al. [23] used EMI as a non-destructive evaluation technique for the detection of defects in AM parts. In this method, a single piezoelectric element is attached to the surface of the structure, and changes in the electrical impedance of the piezoelectric are used for the detection of defects in the structure [24]. EMI methods use either expensive impedance analyzers such as HP4194A and Agilent4294A or specially developed circuits such as Analog Devices AD5933. In the last two decades, many researchers have investigated EMI theoretically [25,26] and experimentally [27,28]. The SuRE method uses one exciter and one sensor to evaluate the condition of the structure [29,30]. This method was developed to eliminate the need for the impedance analyzer, lower the cost, and improve flexibility [31]. Mohamed et al. [32,33] used the SuRE method with additive manufactured parts. They improved the capabilities of SHM methods by using different hidden geometries of the infills at different sections of the part. However, the attenuation with the distance and relationship between the amplitude of the created surface waves and the infill ratio were not explored in those studies. Estimation of the location of the defects has always been a challenge in SHM studies. In the SuRE method, generally, one piezoelectric element excites the surface of the structure, and one piezo monitors the response of the structure to the exciting waves. For response monitoring, any sensor which can monitor the surface vibrations may be used (contact or non-contact).
It is common to fabricate hollow parts by using the AM methods to reduce manufacturing time and material cost. Ingole et al. [34] showed that print orientation also can affect the cost of parts manufactured by the material extrusion method. The perimeter layer thickness and the infill type (pattern and density) are two important factors in defining the characteristics of a hollow section. The infill is defined as the quantity of the material that occupies the interior of a 3D printed part, and it is usually expressed as a percentage. In this study, the influence of the infill ratio on the wave propagation in additively manufactured parts is studied. For the sake of this, four rectangular bars with different infill ratios are fabricated. To have a better understanding of the wave travel along the parts, four Lead zirconate titanate piezoelectric ceramics (PZT) are attached to each part to identify the response characteristics of the part at different locations along the wave travel path. Then, the SuRE method is employed for the detection of the external loading on the part.
The SuRE method has previously shown an efficient and reliable performance for metal [35,36] and composite structures [37,38]. However, there has been little discussion on the implementation of this method on additively manufactured structures. In this paper, the influence of infill density on the dynamic response of the 3D printed parts is studied. Observing different response characteristics in parts with different infill ratios can be implemented in designing structures with different internal geometries in each zone for the purpose of detecting the defect location.

2. Materials and Methods

When Lamb waves travel through a medium, their intensity diminishes with distance. The reduction in the amplitude of the wave is known as attenuation which is a combination of scattering and absorption of waves. The wave travel is considered in two directions, longitudinal wave where the wave motion is parallel to the direction of propagation, and transverse wave where the motion of the wave is perpendicular to the direction of propagation [39]. The amplitude change of a plane wave in a homogeneous and isotropic material can be expressed in a simple form as below:
A = A0 e (−αx)
where A0 is the unattenuated amplitude of the wave in a specific location and A is the amplitude after the travel of the wave for a distance of x. Here, α is the attenuation coefficient which depends on the mechanical properties of the material such as the density and elastic constant. Also, it is important to note that the nature of Lamb waves is multi-mode and a combination of several propagating modes is probably unavoidable. For example, the A0-mode Lamb wave is more sensitive to thickness variation when the thickness is small, and the S0-mode Lamb wave is more sensitive when the thickness is relatively large [40]. The multi-mode nature makes the received signals complicated. Comparison of the same guided waves’ characteristics extracted from signals measured at different locations is not a straightforward process [41]. Despite some successful experimental methods for measuring propagation characteristics of guided waves, there is not a standard procedure to obtain attenuation characteristics.
The SuRE method uses one piezoelectric element for exciting the surface of the structure with guided waves, generally, a sweep sine signal over a specific frequency range is used for excitation. One or multiple contact or non-contact sensors at the desired locations of the structure are employed to obtain the response characteristics of the structure [42]. Fast Fourier transformation (FFT) is used to obtain the spectrum of the frequency response for further analysis. The baseline or reference spectrum is obtained when the structure is in a relaxed condition. The calculated spectrum remains consistent until a defect formation or a change in the external loading. For detection of defects or changes of the loading conditions, the sum of the squares of the difference (SSD) between the spectrums of the monitored and the baseline spectrums is calculated by using Equation (2).
SSD = i = 1 m | B m × 1 R m × 1 | 2
Here, m represents the number of the points at the spectrum plot, B is the FFT of the baseline and R is the FFT of the monitored signal. The calculated SSD value in Equation (2) represents the differences at a predefined frequency band.

3. Experimental Setup

The rectangular bar shown in Figure 1 was fabricated additively using PLA filament (HATCHBOX, 1.75 mm) by an X-MAX 3D printer from QIDI TECH. The internal design and slicing process of the model was generated by the PrusaSlicer software. Four different bars were printed with the same geometry (240 mm length, 25 mm width, and 10 mm thickness) and infill patterns (rectilinear), but different infill densities (20%, 40%, 60%, and 100%). The rectilinear infill pattern was selected from the settings in the PrusaSlicer software. The parts were printed without any support or post-processing and the print condition was consistent for all the parts. Figure 1 shows one of the experimental parts plus different infill designs of bars (screenshot from the slicing software). The print parameters are tabulated in Table 1. Four piezoelectric disks were bonded permanently to the surface of each 3D printed part with equal intervals along the length of the part. M-Bond 200 adhesive (a product of Micro-Measurements) was used for bonding the PZTs. One piezoelectric element at one end of the beam was used for exciting the part with the surface waves and the other three piezoelectric elements monitored the wave propagation along the surface of the beam. All of the piezoelectric elements attached to the beam were Steminc (SMD20T07F3000R) with a 20 mm diameter and a 0.7 mm thickness. An arbitrary waveform function generator (DG1022Z a product of Rigol) provided signals to the first piezoelectric element on the beam to generate the surface waves. The Owon XDS3104AE digital oscilloscope was used for monitoring and recording the signal of the sensors along the part. The FFT of the collected data was calculated by a MATLAB program for the calculation of the SSD in each case. The experimental setup is shown in Figure 2.
The excited sweep sine signal had a 20 Volts peak to peak amplitude with a starting frequency of 50 kHz and an ending frequency of 350 kHz with a sweeping time duration of 1 millisecond. Two experiments were conducted for each beam. First, the baseline (reference) spectrum was recorded without any load on the beam. Secondly, a clamp with a constant applied force of 5 kN was applied between the exciter and the first piezoelectric element (sensor). These two-step experiments were repeated for each one of the beams with different infill ratios.
Three studies were performed using the experimental setup. First, the relationship between the infill density and amplitude variation of the propagated waves along the beam length was investigated by comparing the time-domain signals. Then, the SuRE method was implemented for the estimation of the loading location on the part. In the second study, a sweep sine wave signal with a 50–350 kHz range was applied. The wave propagation characteristics at three different spots along the beam were investigated and the sum of the squares of the differences (SSD) was demonstrated. In the third experiment, parts were excited with a pulse signal and the response was monitored at Sensor 2 for calculating the wave travel speed in PLA parts.

4. Results and Discussion

4.1. Time Domain

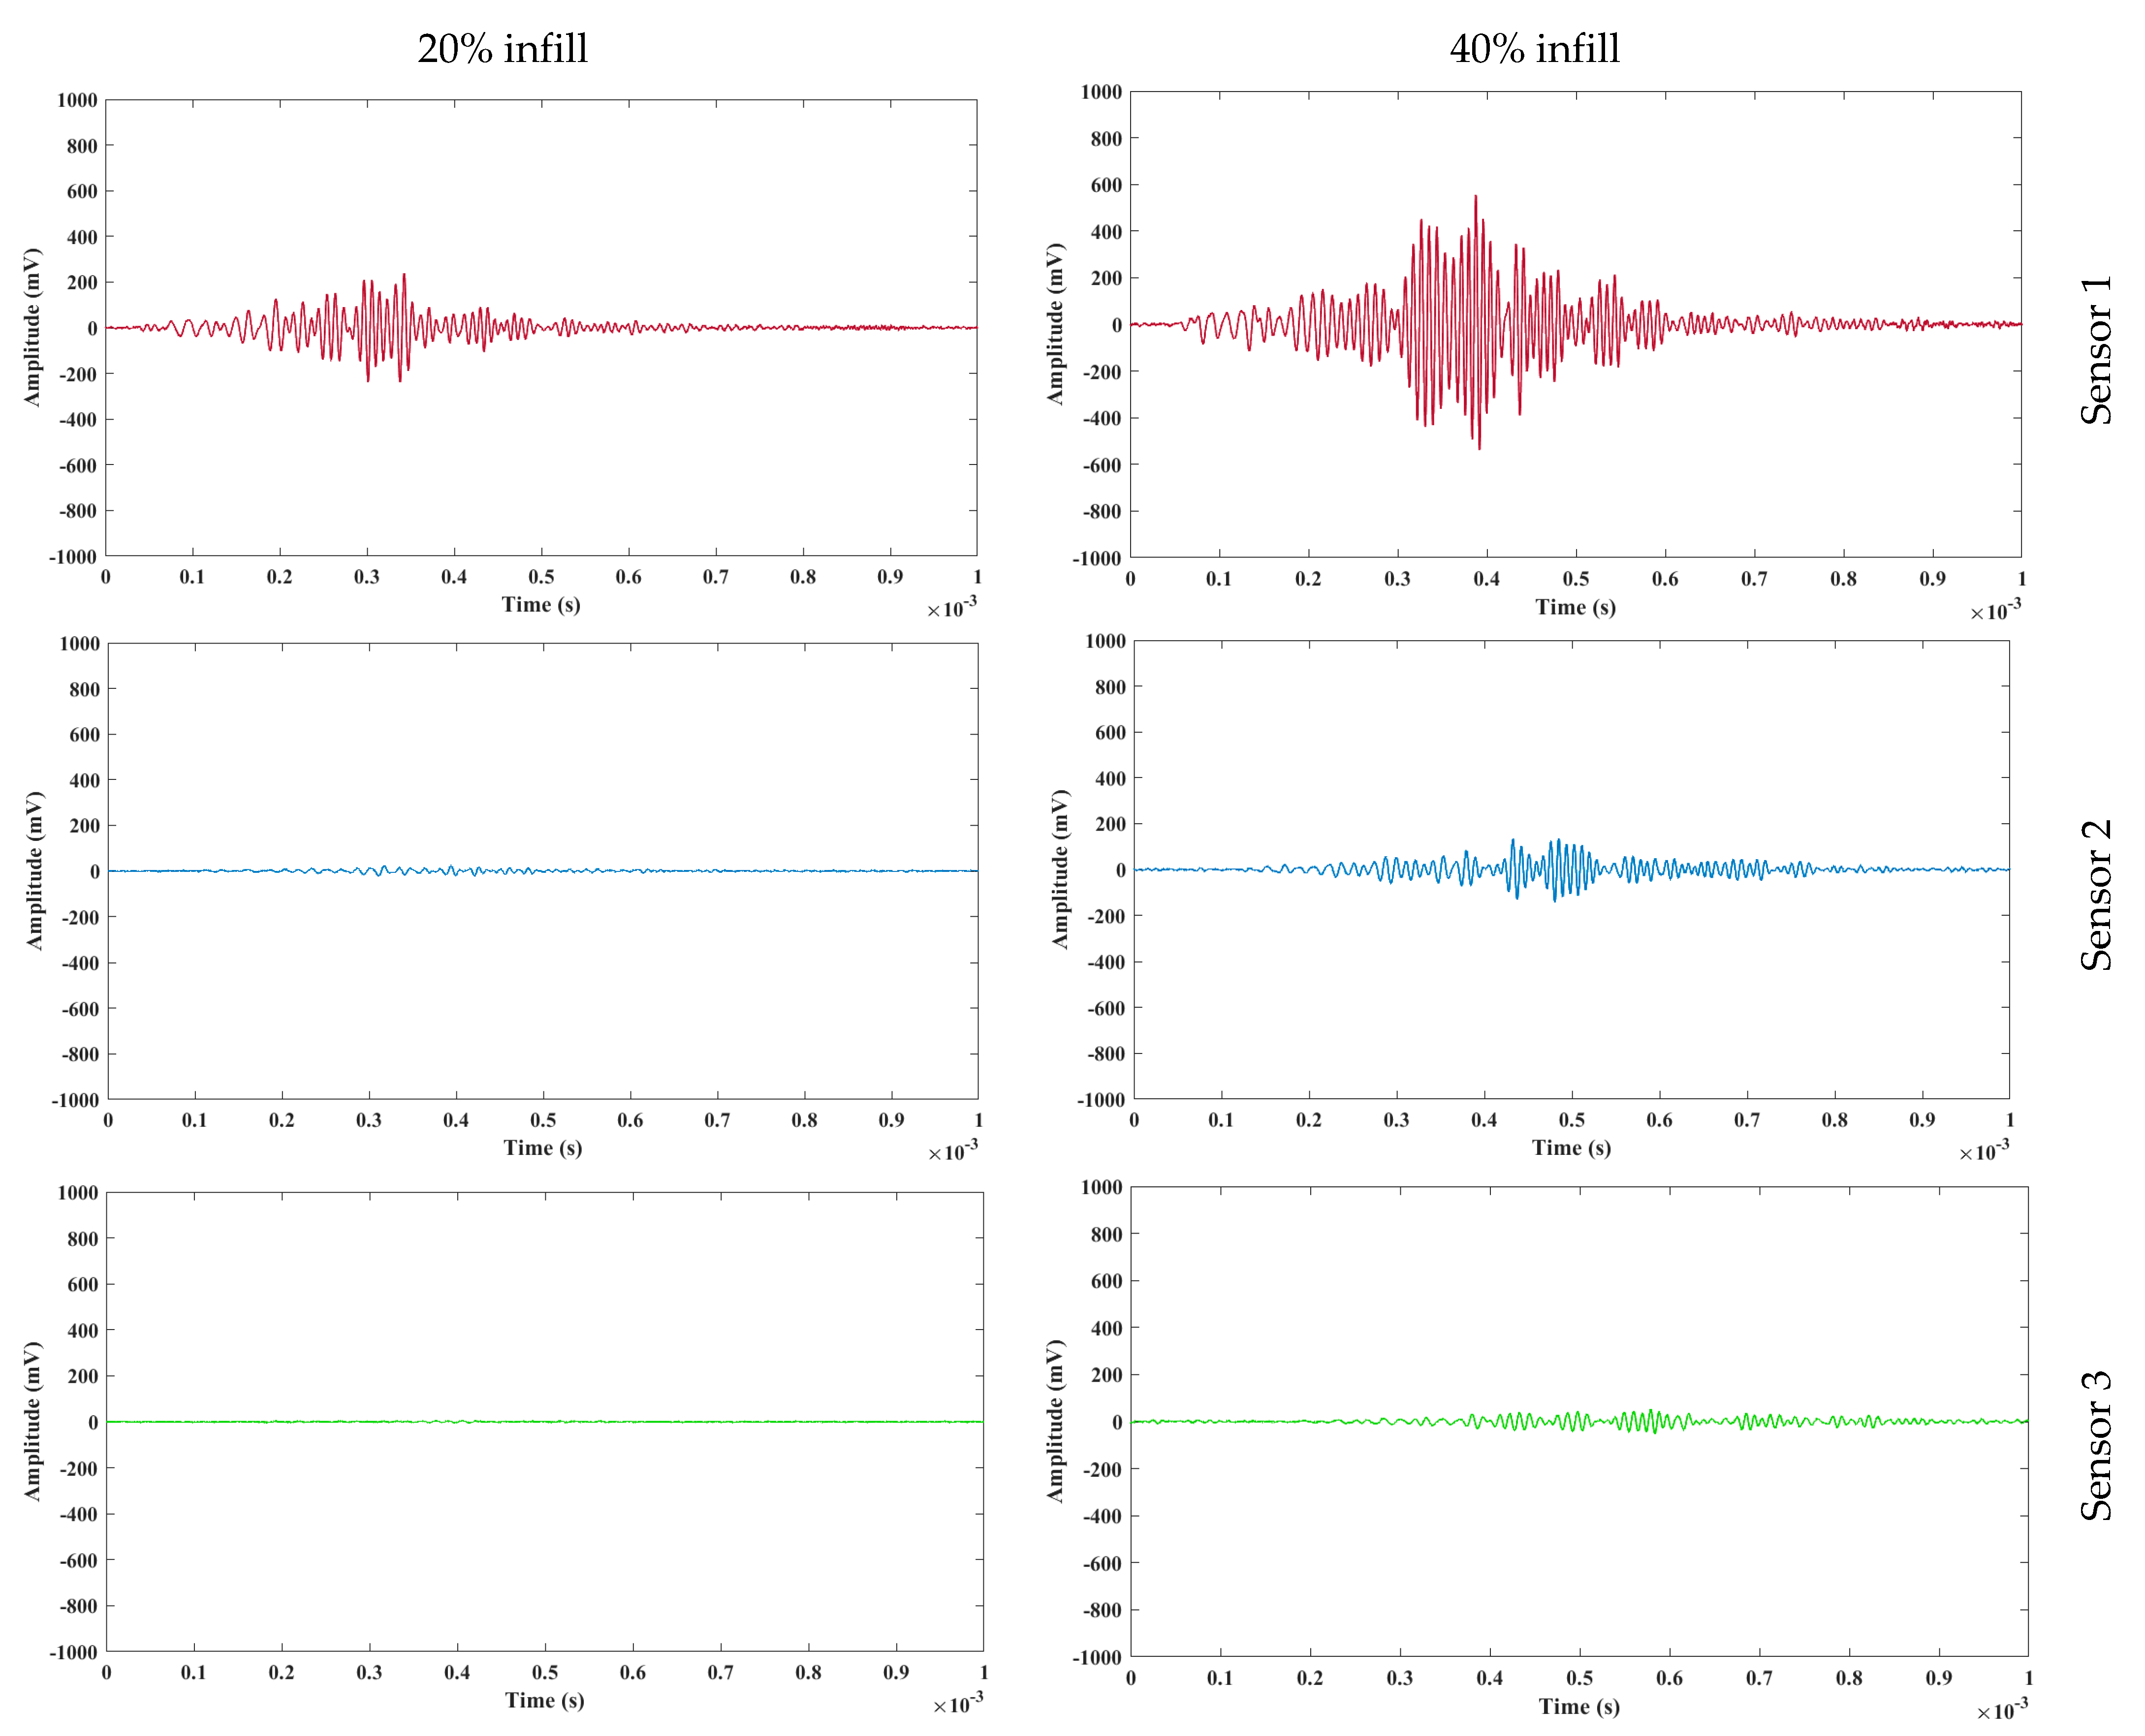
The monitored time-domain signal of the three sensors for parts with 20% and 40% infill are presented in Figure 3. The plots for Sensor 1 demonstrate that the maximum amplitude of the response for the part with 40% infill is about two times higher than the response for the part with 20% infill. In both cases, the maximum amplitude of the signal drops significantly by increasing the distance from the exciter. The signal attenuation has a higher value for the part with lower infill density. Although the distance between the first and the second sensor is not considered high, the magnitude of the maximum amplitude of response dropped more than 70%. For the part with a 20% infill ratio, the signal at the end of the beam (Sensor 3) was almost damped. Figure 4 shows the time-domain response of the three sensors along the parts with 60% and 100% infill densities. A 20 V peak to peak sweep sine wave was used for exciting the structure and Sensor 1 in the solid part (100% infill), recorded signals with amplitudes more than 1.8 V. This is almost two times higher than the monitored signal in the part with 60% infill. It can be concluded that by increasing the infill density, the generated surface waves travel with less energy loss (amplitude reduction) along the beam. The monitored signal at the end of the solid part was two times higher than the sensed signal at the closest sensor in part with 20% infill.
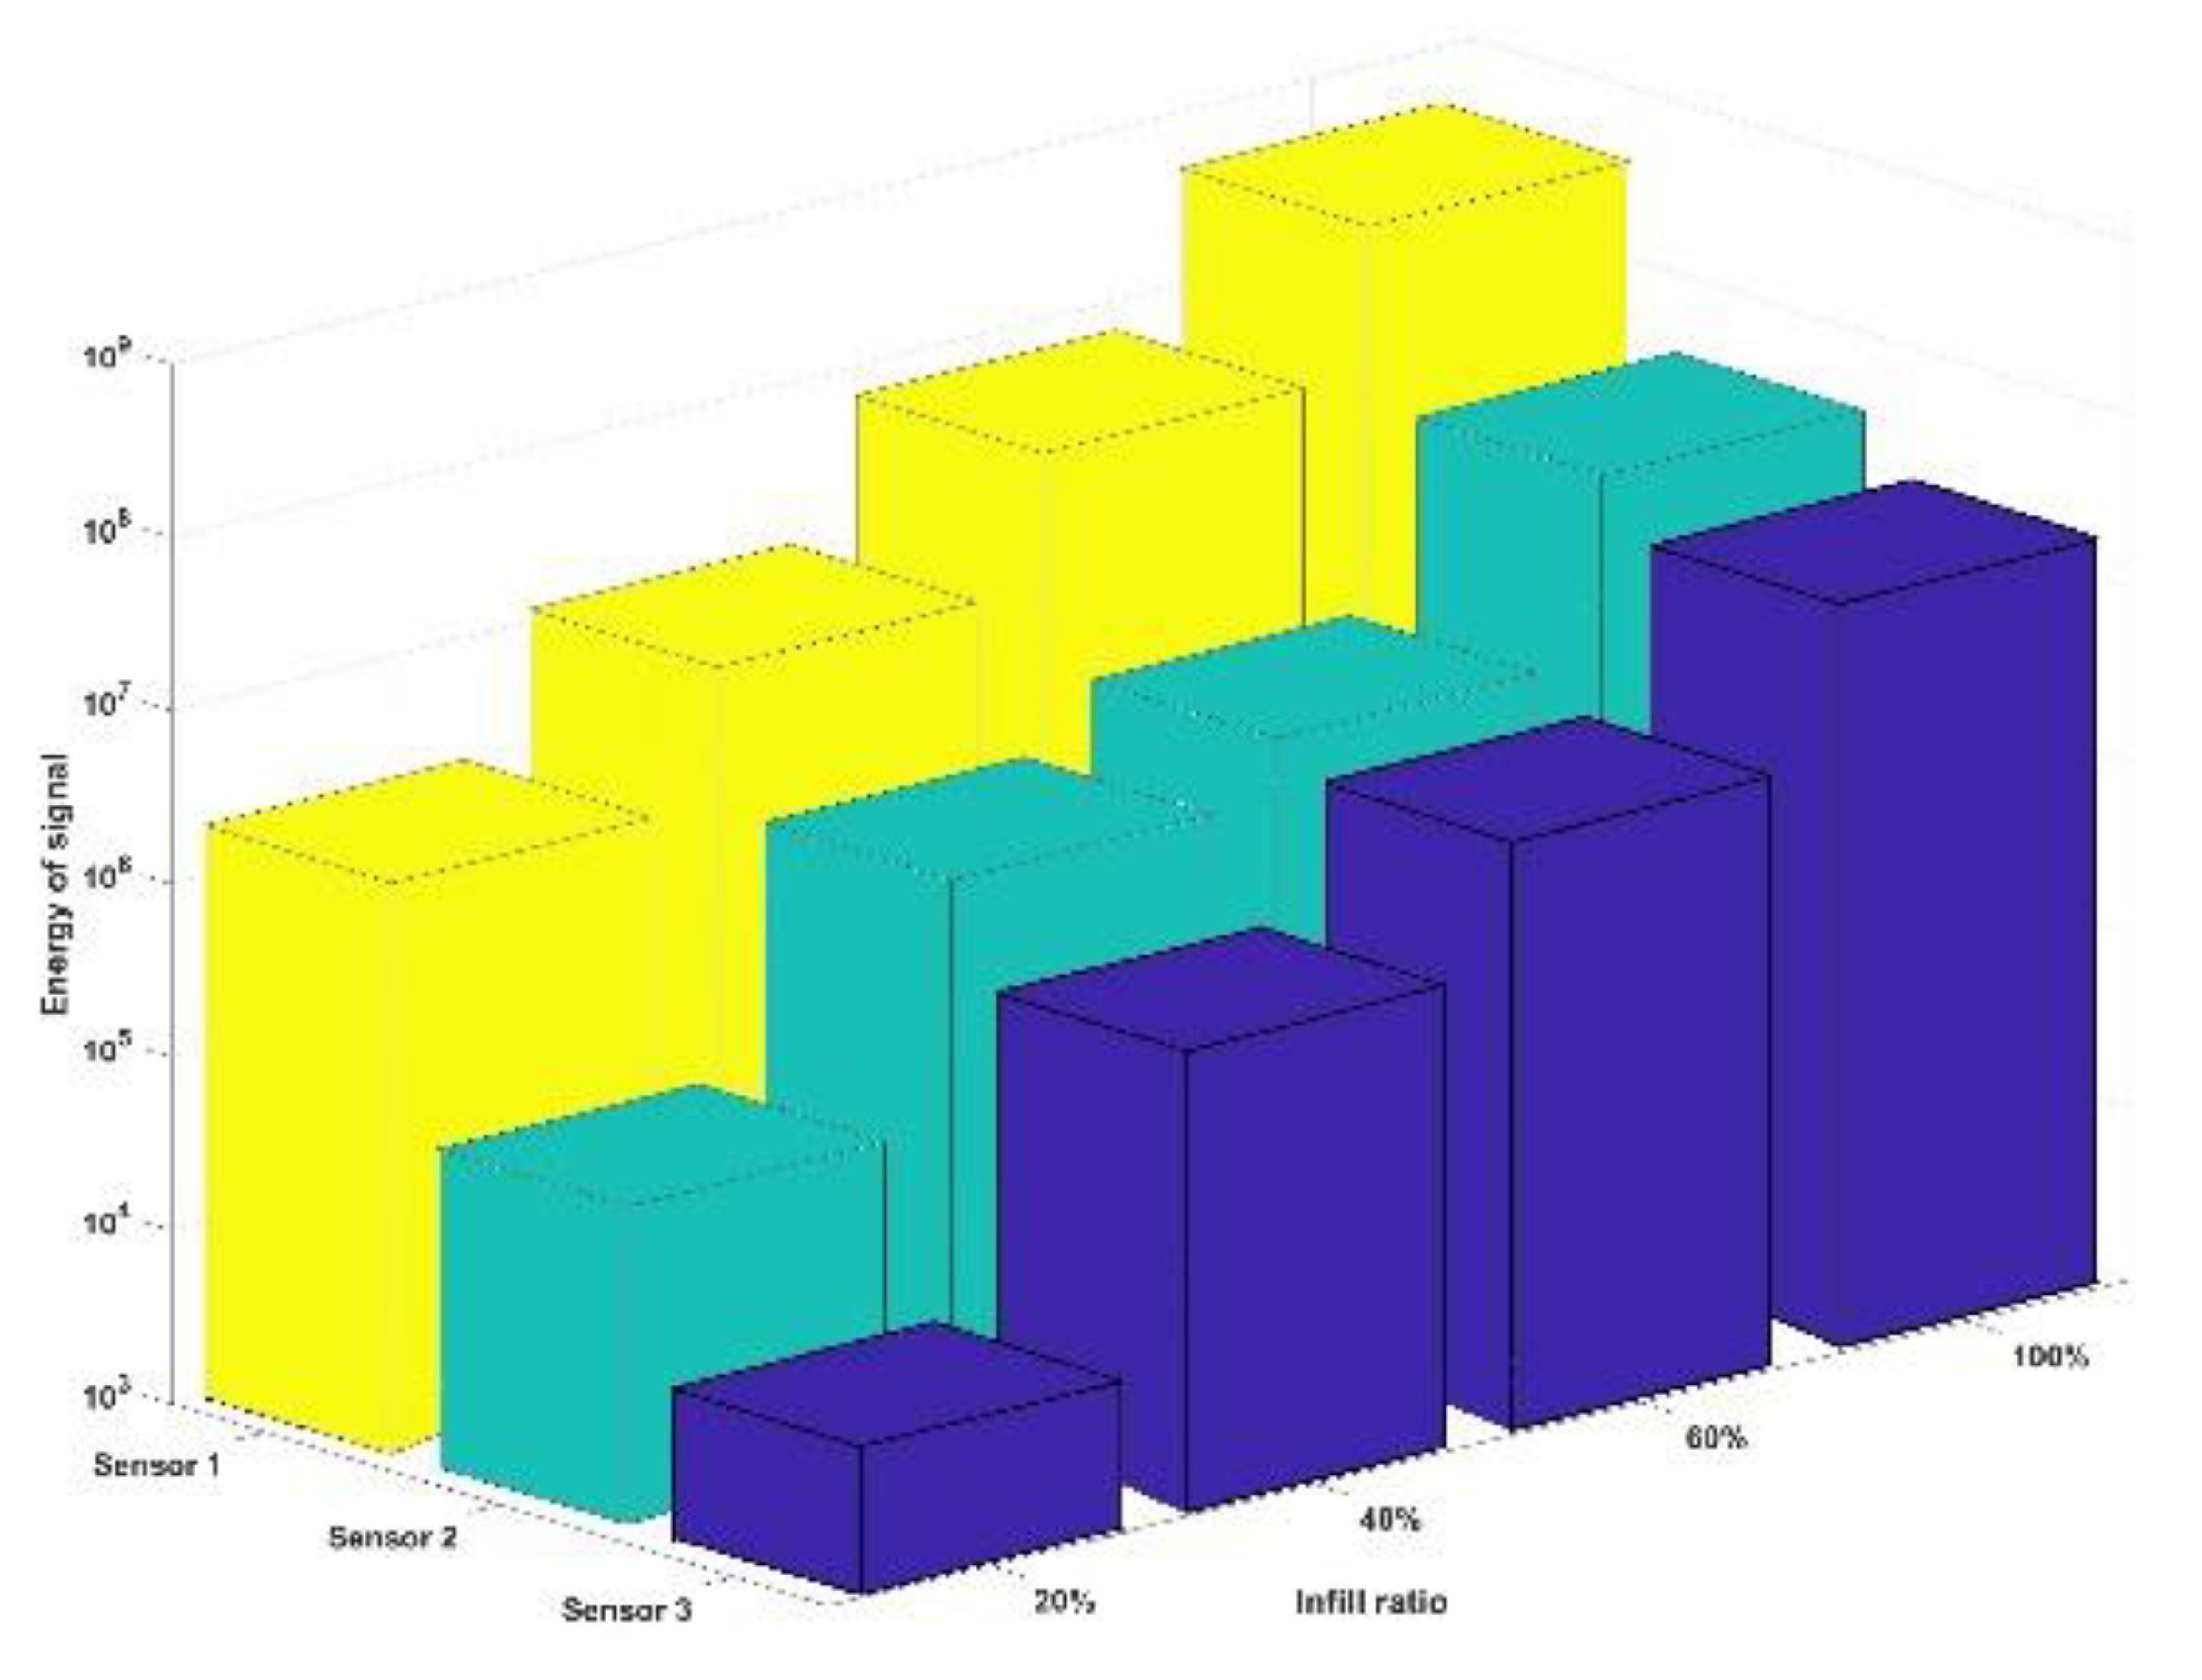
Figure 5 is showing the energy of the received signal for each of the three sensors in all the four parts. The energy of a signal, x(t), can be calculated using Equation (3). It can be seen that how the energy of the propagating waves decreases by distance from exciter. Also, energy loss in higher in parts with lower infills.
E = + | x ( t ) | 2 d t

4.2. Frequency Domain

The second set of experiments were performed to study the spectrum changes in the presence of external compressive loading and evaluation of the SuRE method. The data obtained in the first experiment was considered as the baseline (reference), when no load was applied to the parts. For each part, the experiment was repeated after applying a compressive force between the exciter and Sensor 1. The compressive loading was applied by tightening a clamp with 5 kN.m torque. Figure 6 compares the spectrums of the monitored signals for the parts with 20% and 40% infills before and after applying the load.
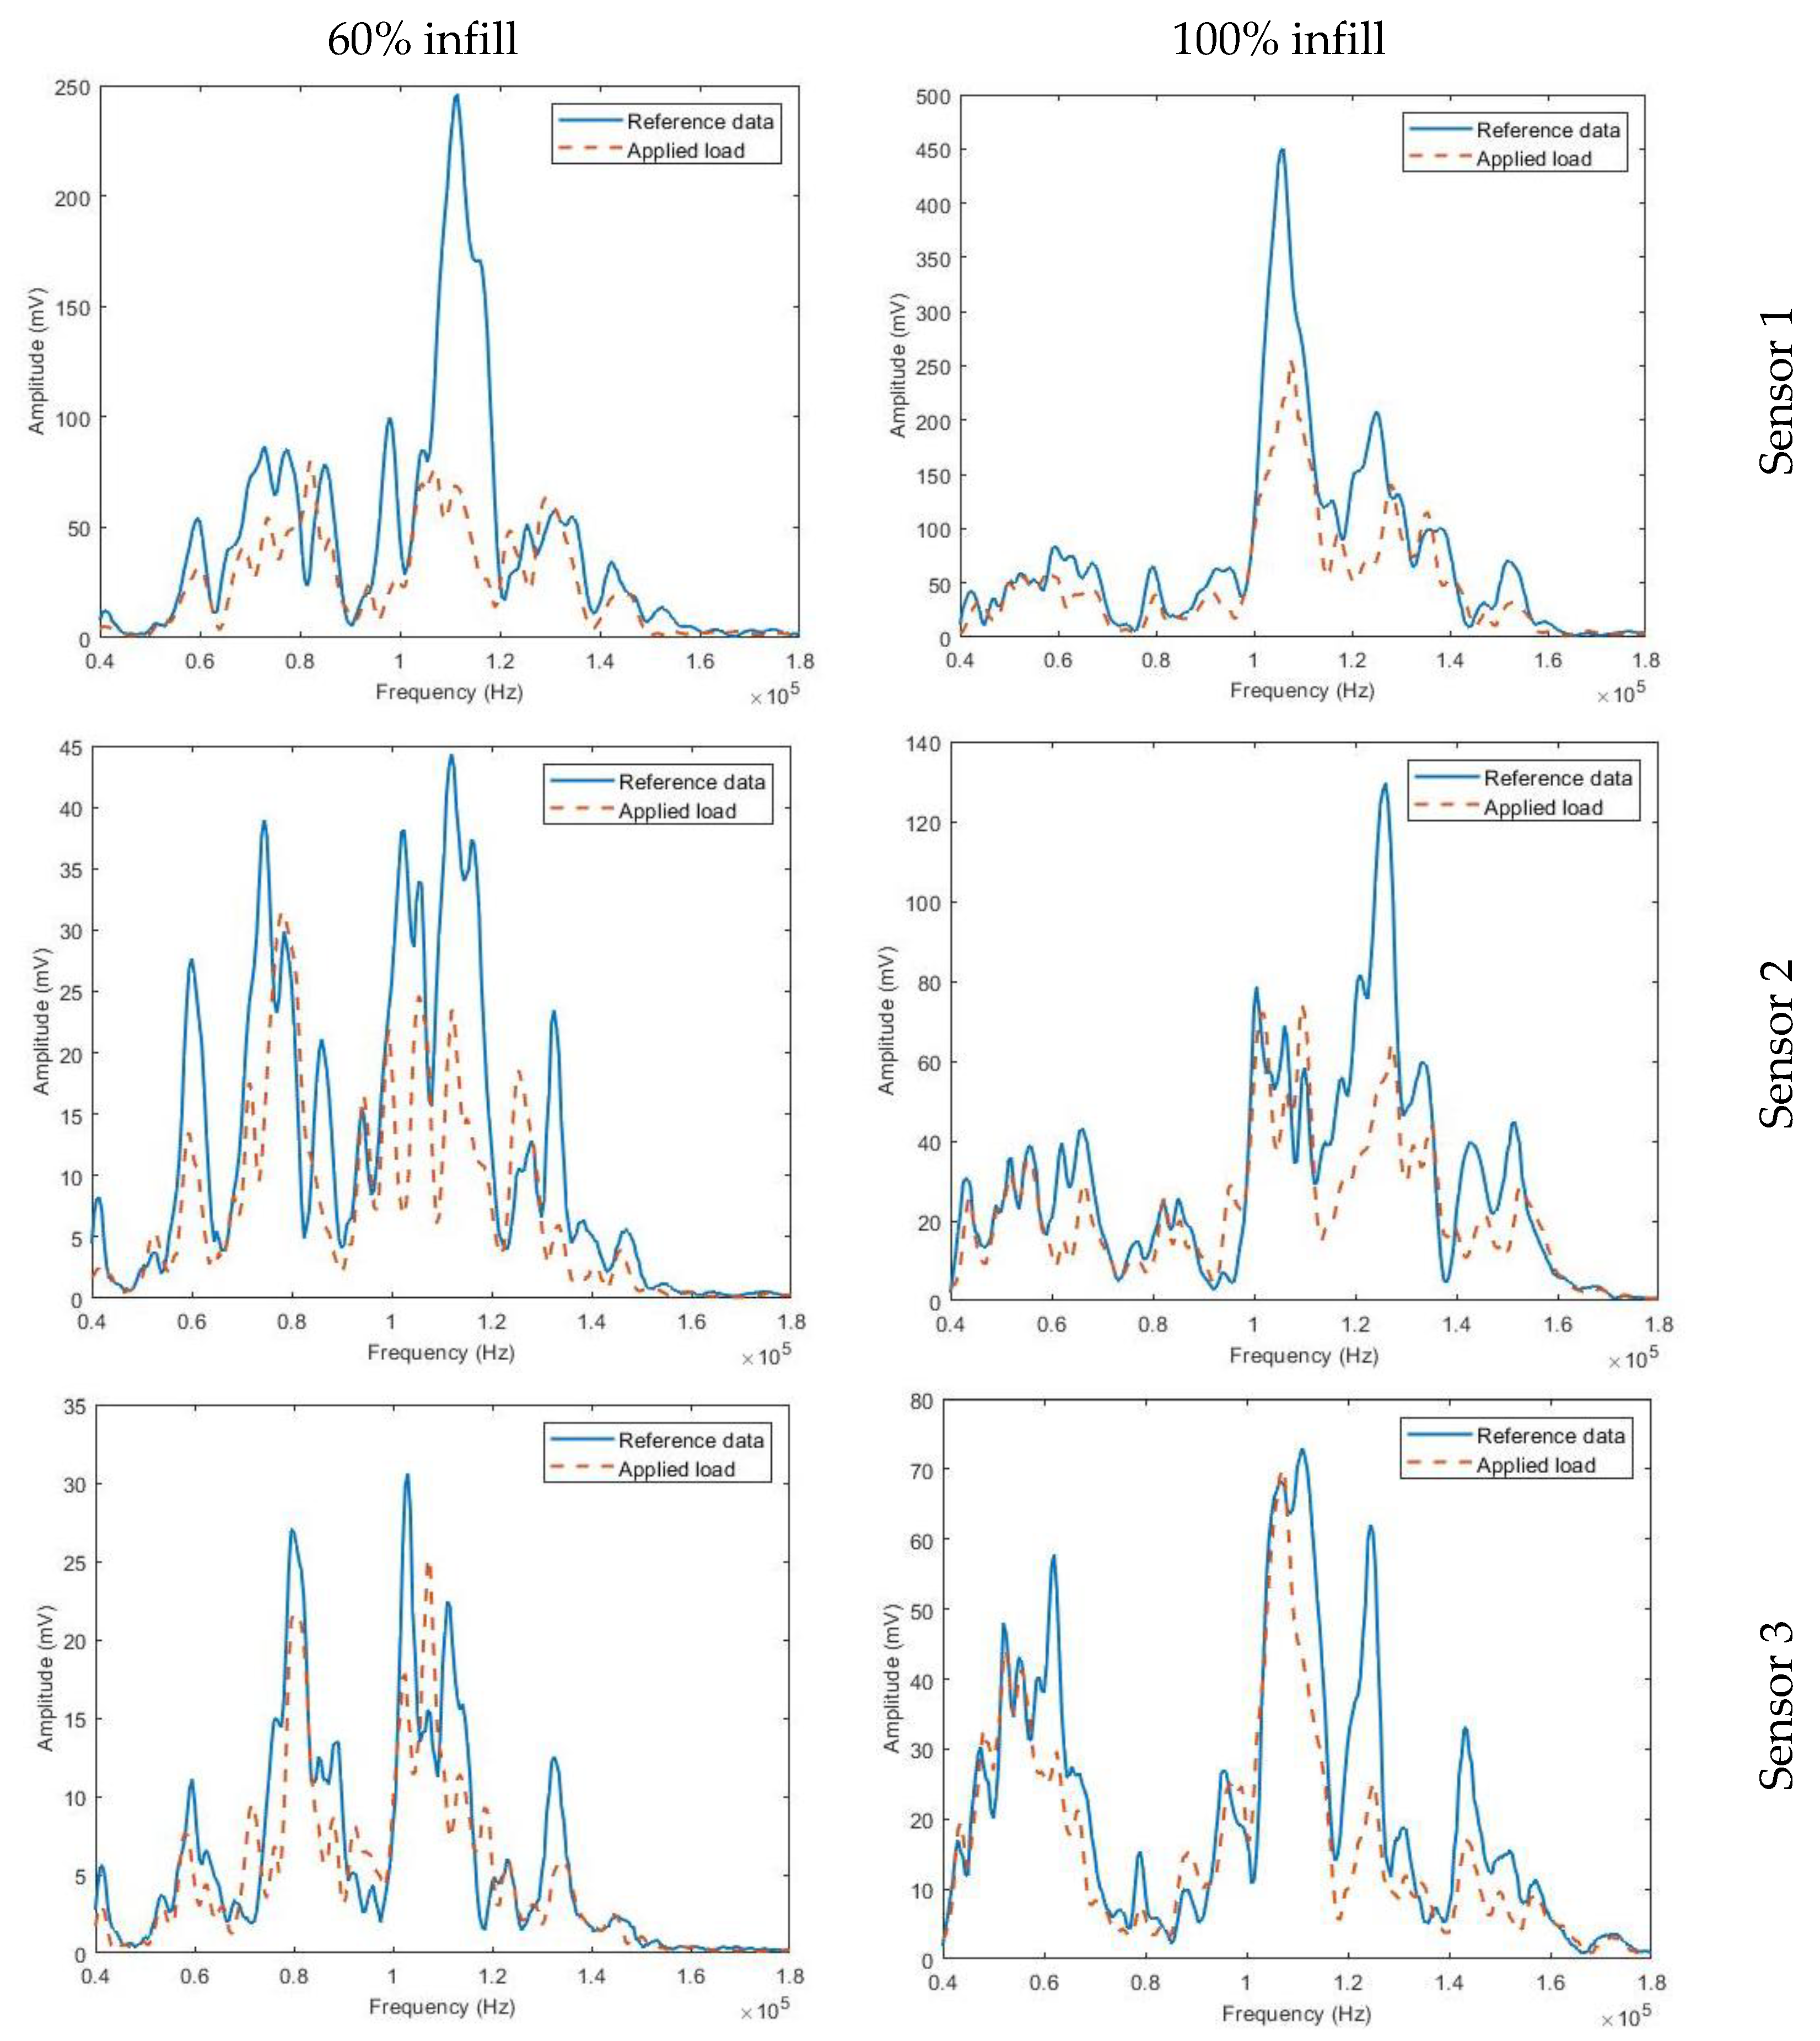
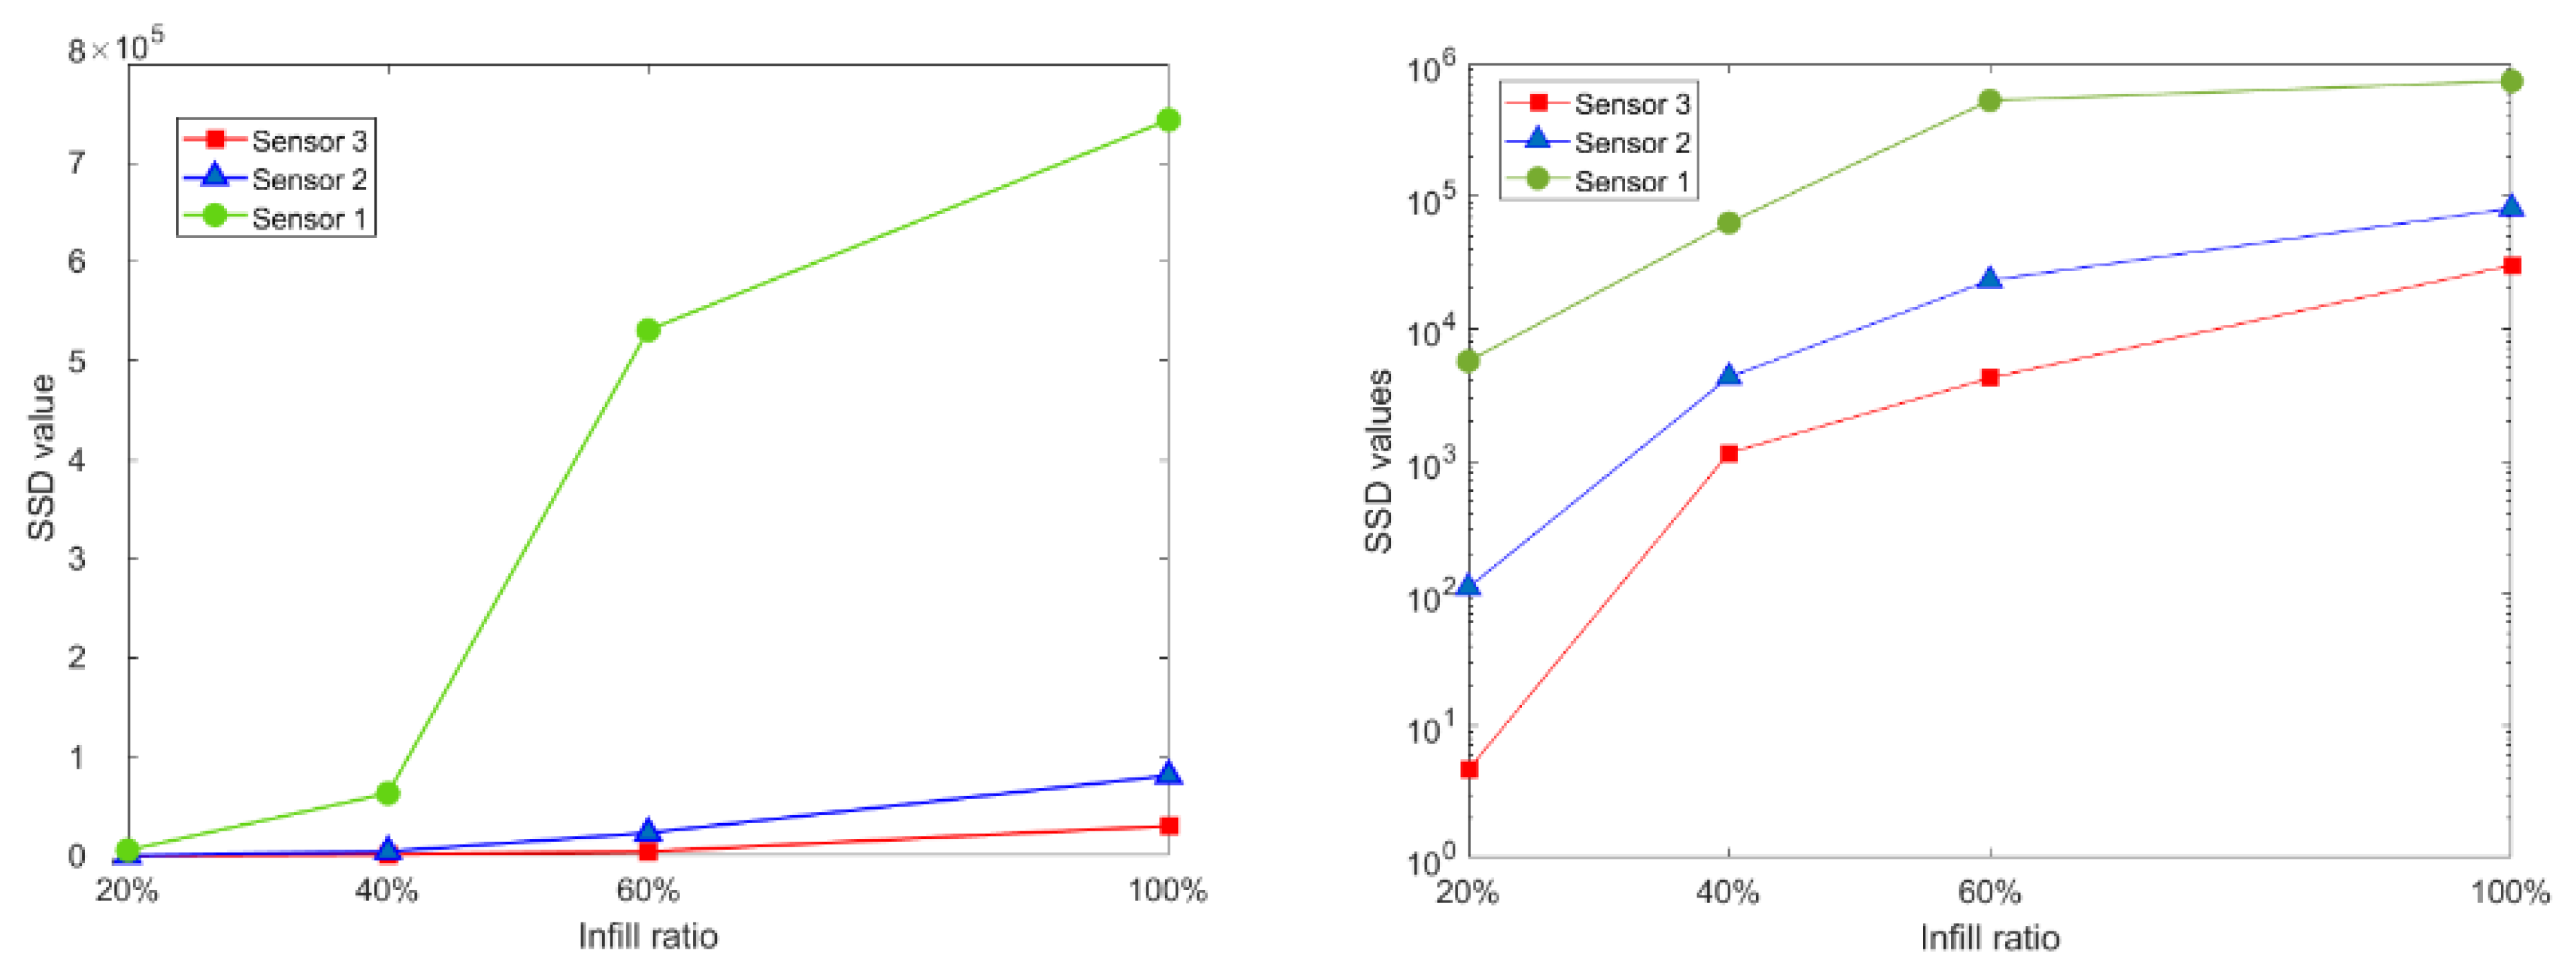
The number of the local peaks in the spectrums increases with distance from the exciter. It can be seen that the changes in the loading condition are evident in the monitored signal of all the sensors. The same experiment was performed for beams with 60%, and 100% infill ratios and results are presented in Figure 7. The changes in the spectrums are generally higher for the part with 60% infill. The sum of squares of the differences (SSD) for all beams with different infill densities are calculated and shown in Figure 8. The generated surface waves traveling along the beam lose more energy when the infill ratio of the part is lower. This can be due to the hollower sections inside the part which damps the wave energy. Since the maximum amplitude of the monitored signals has a direct correlation with the infill ratio, the values of SSD are higher in parts with a higher infill ratio. Also, due to the loss of the energy of the waves along the beam, calculated SSDs have lower values at further sensors. By plotting the SSDs on a semilogarithmic graph, similar behavior of sensors at different parts can be observed. The maximum SSD value is obtained in the closest sensor in the densest part (100% infill ratio), and the lowest SSD value was calculated at the farthest sensor in the part with the lowest density (20% infill ratio). The two above trends were consistent in the middle sensor and beams with 40% and 60% infill ratios.
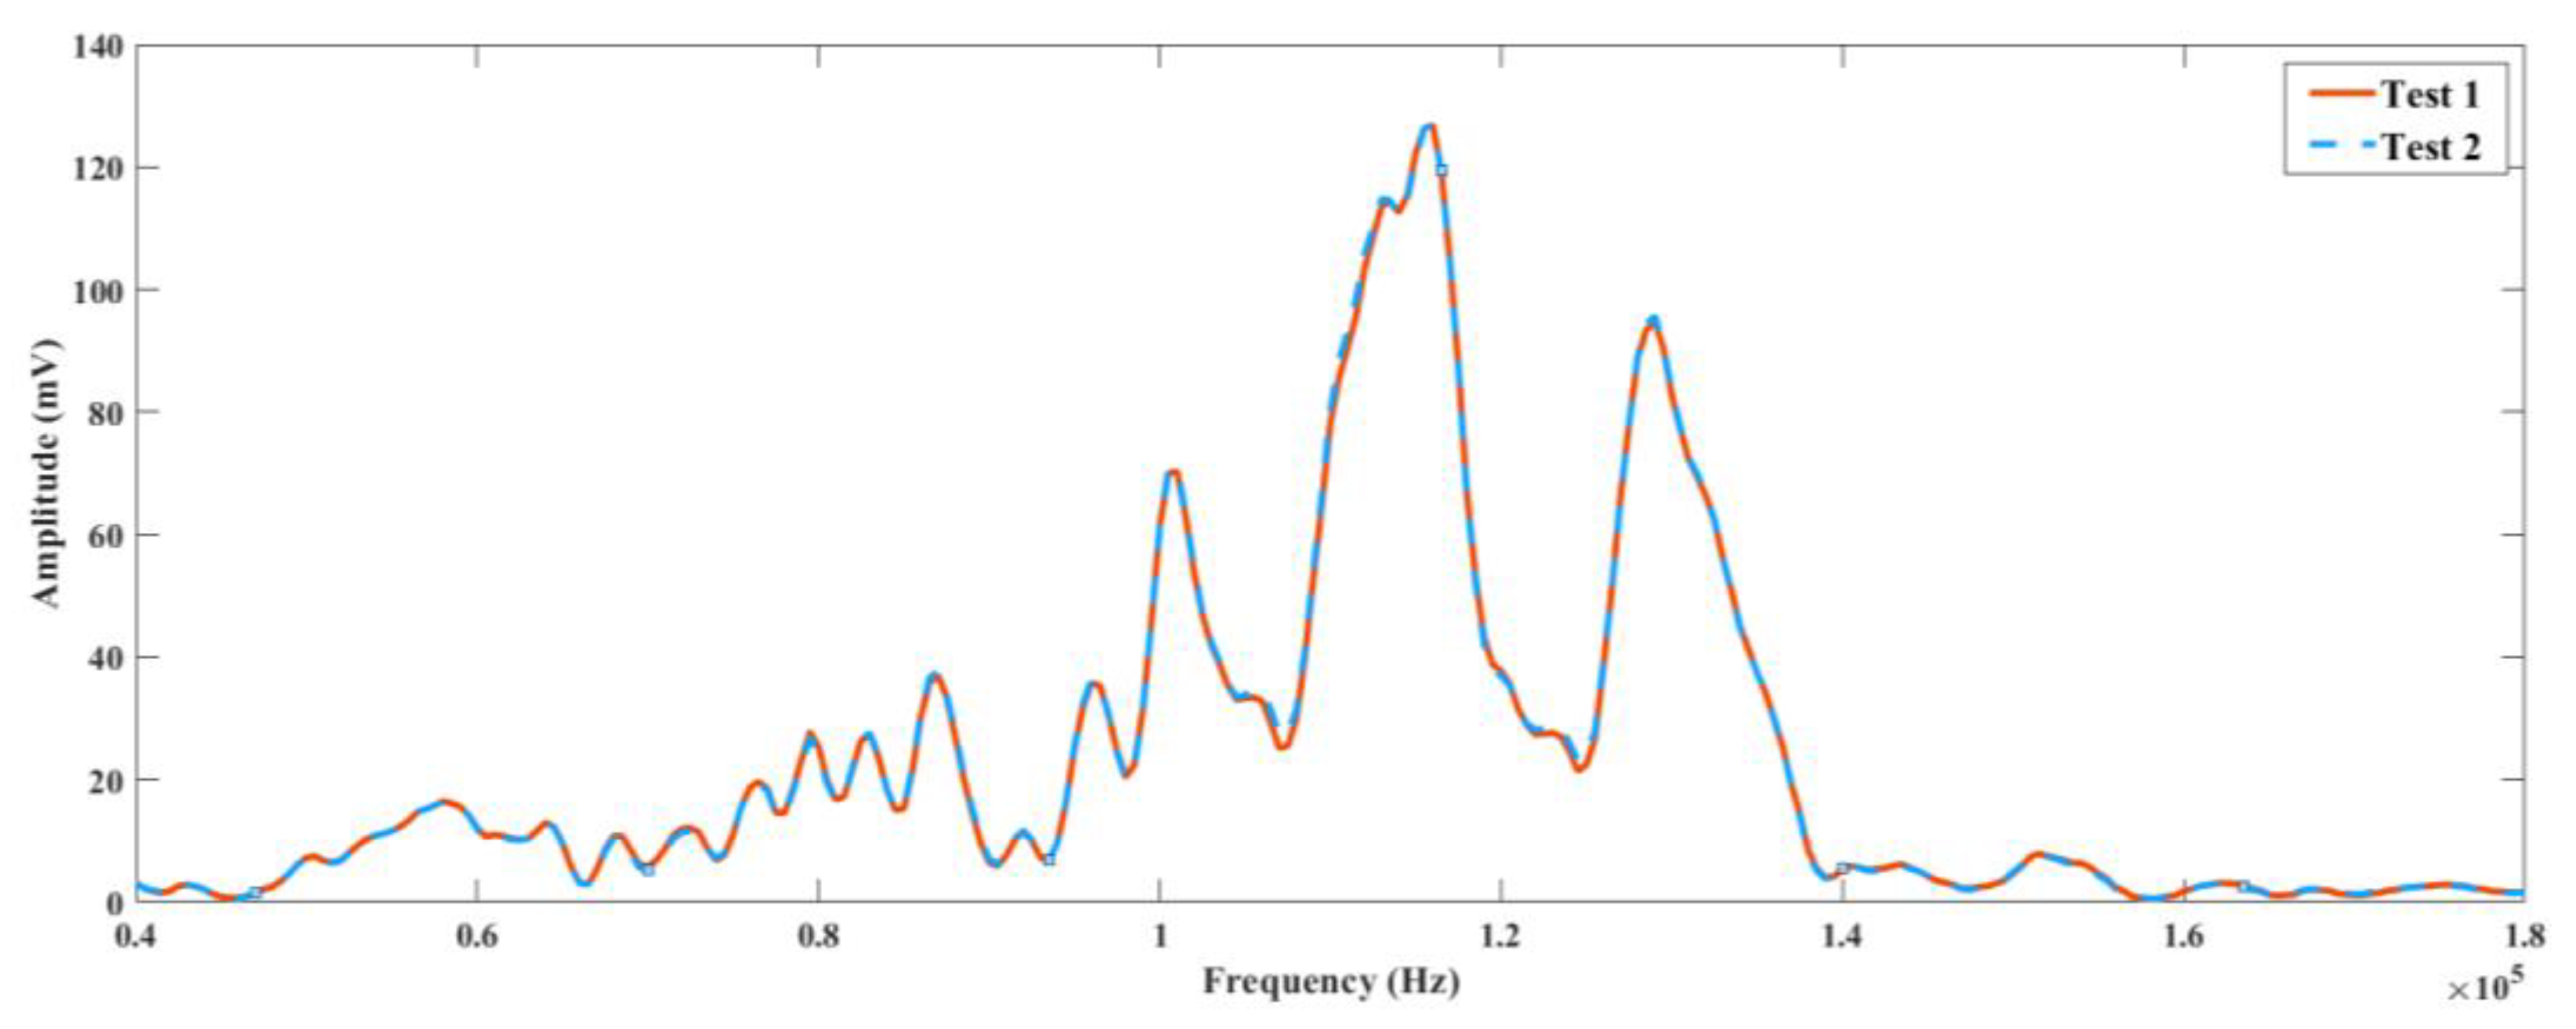
For checking the reproducibility and repeatability of the results, the experiments were repeated at different times and the results are compared for one case. Figure 9 shows the Time-domain response of the sensor of the part with a 40% infill ratio and Figure 10 shows the corresponding spectrums of the test at two different times. As can be observed, the results are so close and both graphs lie on the same line on both time and frequency domains. To evaluate the repeatability of the experiments, SSD was calculated for experiments in two baseline conditions for each of the sensors in all the parts and results are presented in Table 2. It can be seen that the results are negligible compared with the obtained SSD for the baseline and loaded part. As expected, SSD for the parts with higher infill and sensors closer to the exciter has higher values.

4.3. Estimation of the Wave Travel Speed

To calculate the wave speed, each part was excited with a 20 V pulse signal with 10 microsecond durations. The response to the excitation was monitored at Sensor 2 and the results for the first 1.5 ms are presented in Figure 11. For all parts, the created wave was sensed approximately after 100 ms which shows that the speed of the wave was independent of the infill density. Although the travel time of the pulse signal was not influenced by the infill density, the amplitude of the monitored signal had a strong correlation with the infill. The maximum amplitude of the signal for the parts with 100% infill density was more than 10 times higher than the maximum amplitude recorded for the part with 20% infill density. The speed of the wave was found 1400 m/s by dividing the distance between the exciter and the Sensor 2 to the time of travel. In a study performed by Agu et al. [43], the ultrasonic sound speed in 3D printed PLA parts was measured about 1800 m/s. The variation between the measured speed of sound in printed parts can be attributed to the filament quality, 3D printing technique and manufacturing condition.

5. Conclusions

Additive manufacturing is getting popular and adding sensing capabilities to the additively manufactured parts would open many new applications for them. Structural health monitoring methods have been developed for the detection of structural defects and changes in the loading conditions. In this study, an active SHM method (SuRE method) was implemented to AM parts for the detection of loading change. Also, the relationship between the loss of the excitation energy along the beam length and the infill density was studied in this paper. Four rectangular prism-shaped beams were additively manufactured with different infill densities. The beams were manufactured by the material extrusion approach using PLA filaments. Four piezoelectric elements were attached to each beam with equal distances. One of the piezoelectric elements was used for excitation; the other three were used as sensors.
The study indicated that the applied excitation energy decreases quickly with decreasing the internal density. The amplitude of the monitored signals had higher reduction along the beam for parts with lower infill densities. The SuRE method showed satisfactory performance in detecting the applied compressive forces in all the test cases. The calculated SSD values were higher for the sensors closer to the excitation source. Also, the loss of energy was higher for parts with lower infill densities. The propagation speed of the waves was found to be almost the same for all of the beams with different infill densities.
Future studies could investigate the association between the hidden geometries and wave propagation in AM metal parts fabricated by the material extrusion method. As metal additive manufacturing technology continues to advance, further work is certainly required in this field.

Author Contributions

Conceptualization, I.T.; methodology, A.M., I.T.; formal analysis, A.M., I.T.; data curation, A.M.; writing—original draft preparation, A.M.; writing—review and editing, I.T.; supervision, I.T.; All authors have read and agreed to the published version of the manuscript.

Funding

This research received no external funding.

Institutional Review Board Statement

Not applicable.

Informed Consent Statement

Not applicable.

Conflicts of Interest

The authors declare no conflict of interest.

References

  1. Conrad, A.; Isaac, S.; Cochran, R.; Sanchez-Rosales, D.; Wilens, B.; Gutha, A.; Rezaei, T.; Gauthier, D.J.; Kwiat, P. Drone-based quantum key distribution (QKD). Proc. SPIE 2021, 11678. [Google Scholar] [CrossRef]
  2. Giurgiutiu, V. Structural Health Monitoring: With Piezoelectric Wafer Active Sensors; Elsevier Science: Amsterdam, The Netherlands, 2014. [Google Scholar]
  3. Sharp, N.; Kuntz, A.; Brubaker, C.; Amos, S.; Gao, W.; Gupta, G.; Mohite, A.; Farrar, C.; Mascareñas, D. A bio-inspired asynchronous skin system for crack detection applications. Smart Mater. Struct. 2014, 23, 055020. [Google Scholar] [CrossRef]
  4. Salowitz, N.; Guo, Z.; Roy, S.; Nardari, R.; Li, Y.H.; Kim, S.J.; Kopsaftopoulos, F.; Chang, F.K. A vision on stretchable bio-inspired networks for intelligent structures. In Proceedings of the 9th International Workshop on Structural Health Monitoring, Stanford, CA, USA, 10–12 September 2013; pp. 35–44. [Google Scholar]
  5. Yi, T.H.; Huang, H.B.; Li, H.N. Development of sensor validation methodologies for structural health monitoring: A comprehensive review. Measurement 2017, 109, 200–214. [Google Scholar] [CrossRef]
  6. Sturm, L.D.; Albakri, M.I.; Tarazaga, P.A.; Williams, C.B. In situ monitoring of material jetting additive manufacturing process via impedance based measurements. Adv. Manuf. 2019, 28, 456463. [Google Scholar] [CrossRef]
  7. Wang, K.; Zhao, Y.; Chang, Y.; Qian, Z.; Zhang, C.; Wang, B.; Vannan, M.A.; Wang, M.-J. Controlling the mechanical behavior of dual-material 3D printed meta-materials for patient-specific tissue-mimicking phantoms. Mater. Des. 2016, 90, 704–712. [Google Scholar] [CrossRef]
  8. Mohamed, O.A.; Masood, S.H.; Bhowmik, J.L. Optimization of fused deposition modeling process parameters: A review of current research and future prospects. Adv. Manuf. 2015, 3, 42–53. [Google Scholar] [CrossRef]
  9. Koskelo, E.C.; Flynn, E.B. Scanning laser ultrasound and wavenumber spectroscopy for in-process inspection of additively manufactured parts. Proc. SPIE 2016, 9804. [Google Scholar] [CrossRef]
  10. Cummings, I.; Hillstrom, E.; Newton, R.; Flynn, E.; Wachtor, A. In-process ultrasonic inspection of additive manufactured parts. In Topics in Modal Analysis & Testing; Springer: Cham, Switzerland, 2016; Volume 10, pp. 235–247. [Google Scholar]
  11. Schwerdtfeger, J.; Singer, R.F.; Körner, C. In situ flaw detection by IR-imaging during electron beam melting. Rapid Prototyp. J. 2012, 18, 259–263. [Google Scholar] [CrossRef]
  12. Dinwiddie, R.B.; Dehoff, R.R.; Lloyd, P.D.; Lowe, L.E.; Ulrich, J.B. Thermographic in-situ process monitoring of the electron-beam melting technology used in additive manufacturing. Proc. SPIE 2013, 8705. [Google Scholar] [CrossRef]
  13. Jimbo, K.; Tateno, T. Shape contraction in sintering of 3d objects fabricated via metal material extrusion in additive manufacturing. Int. J. Autom. Technol. 2019, 13, 354–360. [Google Scholar] [CrossRef]
  14. Ait-Mansour, I.; Kretzschmar, N.; Chekurov, S.; Salmi, M.; Rech, J. Design-dependent shrinkage compensation modeling and mechanical property targeting of metal FFF. Prog. Addit. Manuf. 2020, 5, 51–57. [Google Scholar] [CrossRef] [Green Version]
  15. Tapia, G.; Elwany, A. A review on process monitoring and control in metal-based additive manufacturing. J. Manuf. Sci. Eng. 2014, 136. [Google Scholar] [CrossRef]
  16. Reutzel, E.W.; Nassar, A.R. A survey of sensing and control systems for machine and process monitoring of directed-energy, metal-based additive manufacturing. Rapid Prototyp. J. 2015, 21, 159–167. [Google Scholar] [CrossRef] [Green Version]
  17. Chua, Z.Y.; Ahn, I.H.; Moon, S.K. Process monitoring and inspection systems in metal additive manufacturing: Status and applications. Int. J. Precis. Eng. Manuf. Green Technol. 2017, 4, 235–245. [Google Scholar] [CrossRef]
  18. Caminero, M.A.; García-Moreno, I.; Rodríguez, G.P.; Chacón, J.M. Internal damage evaluation of composite structures using phased array ultrasonic technique: Impact damage assessment in CFRP and 3D printed reinforced composites. Compos. Part B Eng. 2019, 165, 131–142. [Google Scholar] [CrossRef]
  19. Akmal, J.S.; Salmi, M.; Mäkitie, A.; Björkstrand, R.; Partanen, J. Implementation of industrial additive manufacturing: Intelligent implants and drug delivery systems. J. Funct. Biomater. 2018, 9, 41. [Google Scholar] [CrossRef] [Green Version]
  20. Sbriglia, L.R.; Baker, A.M.; Thompson, J.M.; Morgan, R.V.; Wachtor, A.J.; Bernardin, J.D. Embedding sensors in FDM plastic parts during additive manufacturing. Top. Modal Anal. Test. 2016, 10, 205–214. [Google Scholar]
  21. Lee, M.S.; Lee, J.; Sung, H.; Choe, J.; Son, H.J.; Yun, J.; Kim, K.; Kim, M.; Lee, S.W.; Yang, S.; et al. Embedding Sensors using Selective Laser Melting for Self-Cognitive Metal Parts. Addit. Manuf. 2020, 33, 101151. [Google Scholar]
  22. Rafieipour, H.; Zadeh, A.A.; Mirzaei, M. Distributed Frequent Itemset Mining with Bitwise Method and Using the Gossip-Based Protocol. J. Soft Comput. Decis. Support Syst. 2020, 7, 32–39. [Google Scholar]
  23. Albakri, M.I.; Sturm, L.D.; Williams, C.B.; Tarazaga, P.A. Impedance-based non-destructive evaluation of additively manufactured parts. Rapid Prototyp. J. 2017, 23, 589–601. [Google Scholar] [CrossRef]
  24. Na, W.; Baek, J. A review of the piezoelectric electromechanical impedance based structural health monitoring technique for engineering structures. Sensors 2018, 18, 1307. [Google Scholar] [CrossRef] [Green Version]
  25. Sun, F.P.; Liang, C.; Rogers, C.A. Structural modal analysis using collocated piezoelectric actuator/sensors: An electromechanical approach. Smart Structures and Materials. Smart Struct. Intell. Syst. 1994, 2190, 238–249. [Google Scholar]
  26. Park, G.; Cudney, H.H.; Inman, D.J. An integrated health monitoring technique using structural impedance sensors. J. Intell. Mater. Syst. Struct. 2000, 11, 448–455. [Google Scholar] [CrossRef]
  27. Mascarenas, D.L.; Todd, M.D.; Park, G.; Farrar, C.R. Development of an impedance-based wireless sensor node for structural health monitoring. Smart Mater. Struct. 2007, 16, 2137. [Google Scholar] [CrossRef] [Green Version]
  28. Annamdas, V.G.M.; Soh, C.K. Load monitoring using a calibrated piezo diaphragm based impedance strain sensor and wireless sensor network in real time. Smart Mater. Struct. 2017, 26, 045036. [Google Scholar] [CrossRef]
  29. Mohamed, A.F.; Shah, K.Y.; Tansel, I.N. Compressive Force Location Estimation with SuRE Method for Additively Manufactured Parts. Procedia Manuf. 2019, 39, 465–473. [Google Scholar] [CrossRef]
  30. Shah, K.Y.; Mohamed, A.F.; Tansel, I.N. Additively Manufactured Multi-Material Parts with Defect Detection Capabilities. Procedia Manuf. 2019, 39, 493–501. [Google Scholar] [CrossRef]
  31. Tashakori, S.; Baghalian, A.; Senyurek, V.Y.; Farhangdoust, S.; McDaniel, D.; Tansel, I.N. Composites Bond Inspection Using Heterodyne Effect and SuRE Methods. Shock. Vib. 2018, 2018, 1361932. [Google Scholar] [CrossRef]
  32. Mohamed, A.F.; Modir, A.; Tansel, I.N.; Uragun, B. Detection of Compressive Forces Applied to Tubes and Estimation of Their Locations with the Surface Response to Excitation (SuRE) Method. In Proceedings of the 2019 9th International Conference on Recent Advances in, Istanbul, Turkey, 11–14 June 2019; pp. 83–88. [Google Scholar]
  33. Mohamed, A.F.; Modir, A.; Shah, K.Y.; Tansel, I. Control of the Building Parameters of Additively Manufactured Polymer Parts for More Effective Implementation of Structural Health Monitoring (SHM) Methods. Struct. Health Monit. 2019, 2019. [Google Scholar] [CrossRef]
  34. Ingole, D.S.; Deshmukh, T.R.; Kuthe, A.M.; Ashtankar, K.M. Build orientation analysis for minimum cost determination in FDM. Proc. Inst. Mech. Eng. Part B J. Eng. Manuf. 2011, 225, 1925–1938. [Google Scholar] [CrossRef]
  35. Tashakori, S.; Baghalian, A.; Unal, M.; Fekrmandi, H.; McDaniel, D.; Tansel, I.N. Contact and non-contact approaches in load monitoring applications using surface response to excitation method. Measurement 2016, 89, 197–203. [Google Scholar] [CrossRef]
  36. Fekrmandi, H.; Rojas, J.; Campbell, J.; Tansel, I.N.; Kaya, B.; Taskin, S. Inspection of the integrity of a multi-bolt robotic arm using a scanning laser vibrometer and implementing the surface response to excitation method (SuRE). Int. J. Progn. Health Manag. 2014, 5. [Google Scholar] [CrossRef]
  37. Baghalian, A.; Tahakori, S.; Fekrmandi, H.; Unal, M.; Senyurek, V.Y.; McDaniel, D.; Tansel, I.N. Implementation of the surface response to excitation method for pipes. In Mechanics of Composite and Multi-Functional Materials; Springer: Cham, Switzerland, 2017; Volume 7, pp. 261–266. [Google Scholar]
  38. Tashakori, S.; Baghalian, A.; Unal, M.; Senyurek, V.Y.; Fekrmandi, H.; McDaniel, D.; Tansel, I.N. Load monitoring using surface response to excitation method. In Mechanics of Composite and Multi-Functional Materials; Springer: Cham, Switzerland, 2017; Volume 7, pp. 209–214. [Google Scholar]
  39. Luangvilai, K. Attenuation of Ultrasonic Lamb Waves with Applications to Material Characterization and Condition Monitoring. Ph.D. Thesis, Georgia Institute of Technology, Atlanta, GA, USA, August 2007. [Google Scholar]
  40. Huang, S.; Zhang, Y.; Wang, S.; Zhao, W. Multi-mode electromagnetic ultrasonic lamb wave tomography imaging for variable-depth defects in metal plates. Sensors 2016, 16, 628. [Google Scholar] [CrossRef] [PubMed] [Green Version]
  41. Lee, B.C.; Staszewski, W.J. Lamb wave propagation modelling for damage detection: I. Two-dimensional analysis. Smart Mater. Struct. 2007, 16, 249. [Google Scholar] [CrossRef]
  42. Modir, A.; Tansel, I.N. Implementation of the surface thickness on additively manufactured parts for estimation of the loading location. Smart Mater. Struct. 2020, 30, 025032. [Google Scholar] [CrossRef]
  43. Agu, H.O.; Hameed, A.; Appleby-Thomas, G.J.; Wood, D.C. The dynamic response of dense 3 dimensionally printed polylactic acid. J. Dyn. Behav. Mater. 2016, 5, 377–386. [Google Scholar] [CrossRef] [Green Version]
Figure 1. 3D printed part (left), and infill density of different parts (right).
Automation 02 00011 g001
Figure 2. Experimental setup (left), and geometry of test specimens (right).
Automation 02 00011 g002
Figure 3. Time domain response graphs for parts with 20% and 40% infill.
Automation 02 00011 g003
Figure 4. Time domain response graphs for parts with 60% and 100% infill.
Automation 02 00011 g004aAutomation 02 00011 g004b
Figure 5. Energy of signal at different locations in parts with different infills.
Automation 02 00011 g005
Figure 6. Spectrums of the sensors for baseline and loaded cases when the beams had low infill density.
Automation 02 00011 g006
Figure 7. Spectrums of the sensors for baseline and loaded cases when the beams had higher infill density.
Automation 02 00011 g007
Figure 8. SSD values for the baseline and loaded condition in normal (left) and semi-log scale (right).
Automation 02 00011 g008
Figure 9. Time-domain response of Sensor 1 of the part with 40% infill at two different times.
Automation 02 00011 g009
Figure 10. Spectrum of Sensor 1 of the part with 40% infill at two different times.
Automation 02 00011 g010
Figure 11. Response to the pulse excitation at Sensor 2 in all the specimen.
Automation 02 00011 g011
Table 1. Print parameters.
ParameterValueUnit
Layer height0.1mm
Printing temperature210°C
Build plate temperature60°C
Print speed70mm/s
Top and bottom solid layers3--
Table 2. Calculated SSD for baseline conditions at two different times.
20% Infill40% Infill60% Infill100% Infill
Sensor 16.1535.76125.55207.12
Sensor 20.5122.5745.43133.91
Sensor 30.3811.1229.51113.01
Publisher’s Note: MDPI stays neutral with regard to jurisdictional claims in published maps and institutional affiliations.