
Pre-Operative Adiposity and Synovial Fluid Inflammatory Biomarkers Provide a Predictive Model for Post-Operative Outcomes Following Total Joint Replacement Surgery in Osteoarthritis Patients


Abstract
1. Introduction
2. Materials and Methods
2.1. Patients
2.2. Quantification of Serum and Synovial Fluid Cytokines by Multiplex Bead Assay
2.3. Statistical Analysis
3. Results
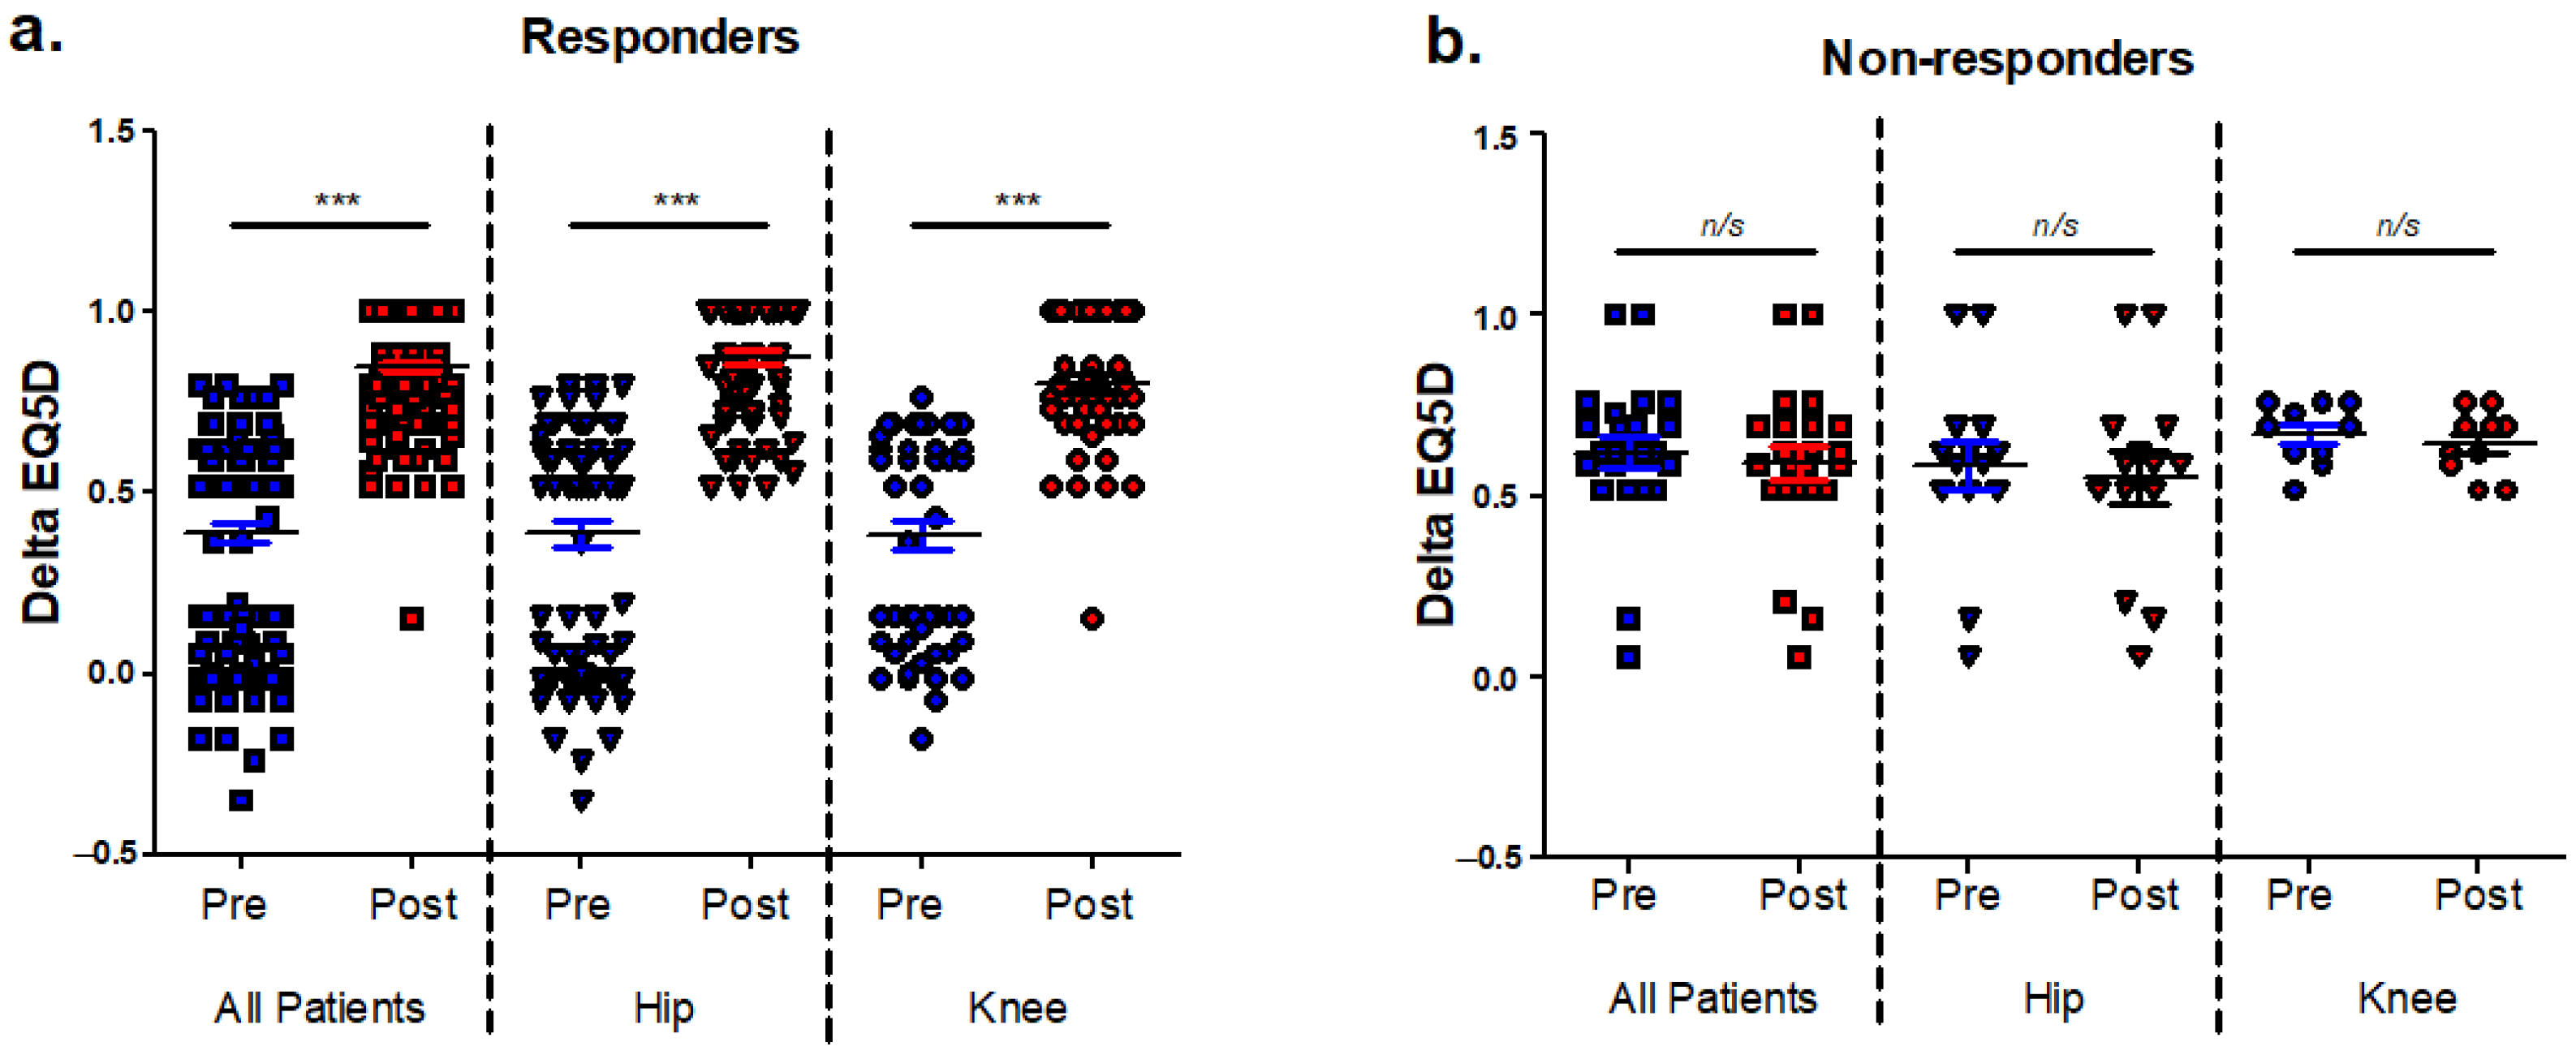
3.1. Identification of Patients with Poor Post-Operative Outcomes and Analysis of EQ5D Index Components
3.2. EQ5D Non-Responders Exhibited Greater Pre-Operative Adiposity and Differential Concentrations of Peri-Operative Synovial Fluid Resistin and Leptin
3.3. The Relationship between Pre-Operative Anthropometric Data and Post-Operative Change in EQ5D
3.4. The Relationship between Pre-Operative Serum and Synovial Fluid Cytokines and Post-Operative Change in EQ5D
4. Discussion
5. Conclusions
Author Contributions
Funding
Institutional Review Board Statement
Informed Consent Statement
Data Availability Statement
Acknowledgments
Conflicts of Interest
References
- Matharu, G.S.; Culliford, D.J.; Blom, A.W.; Judge, A. Projections for primary hip and knee replacement surgery up to the year 2060: An analysis based on data from The National Joint Registry for England, Wales, Northern Ireland and the Isle of Man. Ann. R Coll. Surg. Engl. 2022, 104, 443–448. [Google Scholar] [CrossRef] [PubMed]
- Verhaar, J. Patient satisfaction after total knee replacement-still a challenge. Acta Orthop. 2020, 91, 241–242. [Google Scholar] [CrossRef] [PubMed]
- Choi, Y.J.; Ra, H.J. Patient Satisfaction after Total Knee Arthroplasty. Knee Surg. Relat. Res. 2016, 28, 1–15. [Google Scholar] [CrossRef] [PubMed]
- Kim, M.S.; Koh, I.J.; Choi, Y.J.; Lee, J.Y.; In, Y. Differences in Patient-Reported Outcomes Between Unicompartmental and Total Knee Arthroplasties: A Propensity Score-Matched Analysis. J. Arthroplast. 2017, 32, 1453–1459. [Google Scholar] [CrossRef] [PubMed]
- Kahlenberg, C.A.; Nwachukwu, B.U.; McLawhorn, A.S.; Cross, M.B.; Cornell, C.N.; Padgett, D.E. Patient Satisfaction After Total Knee Replacement: A Systematic Review. HSS J. 2018, 14, 192–201. [Google Scholar] [CrossRef] [PubMed]
- Thudium, C.S.; Lofvall, H.; Karsdal, M.A.; Bay-Jensen, A.C.; Bihlet, A.R. Protein biomarkers associated with pain mechanisms in osteoarthritis. J. Proteom. 2019, 190, 55–66. [Google Scholar] [CrossRef] [PubMed]
- Bas, S.; Finckh, A.; Puskas, G.J.; Suva, D.; Hoffmeyer, P.; Gabay, C.; Lubbeke, A. Adipokines correlate with pain in lower limb osteoarthritis: Different associations in hip and knee. Int. Orthop. 2014, 38, 2577–2583. [Google Scholar] [CrossRef] [PubMed]
- Miller, R.E.; Miller, R.J.; Malfait, A.M. Osteoarthritis joint pain: The cytokine connection. Cytokine 2014, 70, 185–193. [Google Scholar] [CrossRef]
- Orita, S.; Koshi, T.; Mitsuka, T.; Miyagi, M.; Inoue, G.; Arai, G.; Ishikawa, T.; Hanaoka, E.; Yamashita, K.; Yamashita, M.; et al. Associations between proinflammatory cytokines in the synovial fluid and radiographic grading and pain-related scores in 47 consecutive patients with osteoarthritis of the knee. BMC Musculoskelet. Disord. 2011, 12, 144. [Google Scholar] [CrossRef] [PubMed]
- Schafers, M.; Lee, D.H.; Brors, D.; Yaksh, T.L.; Sorkin, L.S. Increased sensitivity of injured and adjacent uninjured rat primary sensory neurons to exogenous tumor necrosis factor-alpha after spinal nerve ligation. J. Neurosci. 2003, 23, 3028–3038. [Google Scholar] [CrossRef] [PubMed]
- Richter, F.; Natura, G.; Loser, S.; Schmidt, K.; Viisanen, H.; Schaible, H.G. Tumor necrosis factor causes persistent sensitization of joint nociceptors to mechanical stimuli in rats. Arthritis Rheum. 2010, 62, 3806–3814. [Google Scholar] [CrossRef] [PubMed]
- Qin, X.; Wan, Y.; Wang, X. CCL2 and CXCL1 trigger calcitonin gene-related peptide release by exciting primary nociceptive neurons. J. Neurosci. Res. 2005, 82, 51–62. [Google Scholar] [CrossRef] [PubMed]
- Kao, D.J.; Li, A.H.; Chen, J.C.; Luo, R.S.; Chen, Y.L.; Lu, J.C.; Wang, H.L. CC chemokine ligand 2 upregulates the current density and expression of TRPV1 channels and Nav1.8 sodium channels in dorsal root ganglion neurons. J. Neuroinflamm. 2012, 9, 189. [Google Scholar] [CrossRef] [PubMed]
- Opree, A.; Kress, M. Involvement of the proinflammatory cytokines tumor necrosis factor-alpha, IL-1 beta, and IL-6 but not IL-8 in the development of heat hyperalgesia: Effects on heat-evoked calcitonin gene-related peptide release from rat skin. J. Neurosci. 2000, 20, 6289–6293. [Google Scholar] [CrossRef] [PubMed]
- Stemkowski, P.L.; Smith, P.A. Long-term IL-1beta exposure causes subpopulation-dependent alterations in rat dorsal root ganglion neuron excitability. J. Neurophysiol. 2012, 107, 1586–1597. [Google Scholar] [CrossRef] [PubMed]
- Brenn, D.; Richter, F.; Schaible, H.G. Sensitization of unmyelinated sensory fibers of the joint nerve to mechanical stimuli by interleukin-6 in the rat: An inflammatory mechanism of joint pain. Arthritis Rheum. 2007, 56, 351–359. [Google Scholar] [CrossRef] [PubMed]
- Obreja, O.; Biasio, W.; Andratsch, M.; Lips, K.S.; Rathee, P.K.; Ludwig, A.; Rose-John, S.; Kress, M. Fast modulation of heat-activated ionic current by proinflammatory interleukin 6 in rat sensory neurons. Brain 2005, 128 Pt 7, 1634–1641. [Google Scholar] [CrossRef] [PubMed]
- de Lange-Brokaar, B.J.; Ioan-Facsinay, A.; Yusuf, E.; Visser, A.W.; Kroon, H.M.; van Osch, G.J.; Zuurmond, A.M.; Stojanovic-Susulic, V.; Bloem, J.L.; Nelissen, R.G.; et al. Association of pain in knee osteoarthritis with distinct patterns of synovitis. Arthritis Rheumatol. 2015, 67, 733–740. [Google Scholar] [CrossRef] [PubMed]
- Guermazi, A.; Roemer, F.W.; Hayashi, D.; Crema, M.D.; Niu, J.; Zhang, Y.; Marra, M.D.; Katur, A.; Lynch, J.A.; El-Khoury, G.Y.; et al. Assessment of synovitis with contrast-enhanced MRI using a whole-joint semiquantitative scoring system in people with, or at high risk of, knee osteoarthritis: The MOST study. Ann. Rheum. Dis. 2011, 70, 805–811. [Google Scholar] [CrossRef] [PubMed]
- Nanus, D.E.; Badoume, A.; Wijesinghe, S.N.; Halsey, A.M.; Hurley, P.; Ahmed, Z.; Botchu, R.; Davis, E.T.; Lindsay, M.A.; Jones, S.W. Synovial tissue from sites of joint pain in knee osteoarthritis patients exhibits a differential phenotype with distinct fibroblast subsets. EBioMedicine 2021, 72, 103618. [Google Scholar] [CrossRef]
- Gandhi, R.; Santone, D.; Takahashi, M.; Dessouki, O.; Mahomed, N.N. Inflammatory predictors of ongoing pain 2 years following knee replacement surgery. Knee 2013, 20, 316–318. [Google Scholar] [CrossRef] [PubMed]
- Hall, G.M.; Peerbhoy, D.; Shenkin, A.; Parker, C.J.; Salmon, P. Hip and knee arthroplasty: A comparison and the endocrine, metabolic and inflammatory responses. Clin. Sci. 2000, 98, 71–79. [Google Scholar] [CrossRef]
- Fernandez-de-Las-Penas, C.; Florencio, L.L.; de-la-Llave-Rincon, A.I.; Ortega-Santiago, R.; Cigaran-Mendez, M.; Fuensalida-Novo, S.; Plaza-Manzano, G.; Arendt-Nielsen, L.; Valera-Calero, J.A.; Navarro-Santana, M.J. Prognostic Factors for Postoperative Chronic Pain after Knee or Hip Replacement in Patients with Knee or Hip Osteoarthritis: An Umbrella Review. J. Clin. Med. 2023, 12, 6624. [Google Scholar] [CrossRef] [PubMed]
- Kellgren, J.H.; Lawrence, J.S. Radiological assessment of osteo-arthrosis. Ann. Rheum. Dis. 1957, 16, 494–502. [Google Scholar] [CrossRef] [PubMed]
- Wailoo, A.; Hernandez Alava, M.; Escobar Martinez, A. Modelling the relationship between the WOMAC Osteoarthritis Index and EQ-5D. Health Qual. Life Outcomes 2014, 12, 37. [Google Scholar] [CrossRef] [PubMed]
- Jayadev, C.; Rout, R.; Price, A.; Hulley, P.; Mahoney, D. Hyaluronidase treatment of synovial fluid to improve assay precision for biomarker research using multiplex immunoassay platforms. J. Immunol. Methods 2012, 386, 22–30. [Google Scholar] [CrossRef] [PubMed]
- Nanus, D.E.; Wijesinghe, S.N.; Pearson, M.J.; Hadjicharalambous, M.R.; Rosser, A.; Davis, E.T.; Lindsay, M.A.; Jones, S.W. Regulation of the Inflammatory Synovial Fibroblast Phenotype by Metastasis-Associated Lung Adenocarcinoma Transcript 1 Long Noncoding RNA in Obese Patients With Osteoarthritis. Arthritis Rheumatol. 2020, 72, 609–619. [Google Scholar] [CrossRef] [PubMed]
- Pearson, M.J.; Herndler-Brandstetter, D.; Tariq, M.A.; Nicholson, T.A.; Philp, A.M.; Smith, H.L.; Davis, E.T.; Jones, S.W.; Lord, J.M. IL-6 secretion in osteoarthritis patients is mediated by chondrocyte-synovial fibroblast cross-talk and is enhanced by obesity. Sci. Rep. 2017, 7, 3451. [Google Scholar] [CrossRef] [PubMed]
- Sohn, D.H.; Sokolove, J.; Sharpe, O.; Erhart, J.C.; Chandra, P.E.; Lahey, L.J.; Lindstrom, T.M.; Hwang, I.; Boyer, K.A.; Andriacchi, T.P.; et al. Plasma proteins present in osteoarthritic synovial fluid can stimulate cytokine production via Toll-like receptor 4. Arthritis Res. Ther. 2012, 14, R7. [Google Scholar] [CrossRef] [PubMed]
- Cicuttini, F.M.; Baker, J.R.; Spector, T.D. The association of obesity with osteoarthritis of the hand and knee in women: A twin study. J. Rheumatol. 1996, 23, 1221–1226. [Google Scholar] [PubMed]
- Holliday, K.L.; McWilliams, D.F.; Maciewicz, R.A.; Muir, K.R.; Zhang, W.; Doherty, M. Lifetime body mass index, other anthropometric measures of obesity and risk of knee or hip osteoarthritis in the GOAL case-control study. Osteoarthr. Cartil. 2011, 19, 37–43. [Google Scholar] [CrossRef] [PubMed]
- Reyes, C.; Leyland, K.M.; Peat, G.; Cooper, C.; Arden, N.K.; Prieto-Alhambra, D. Association Between Overweight and Obesity and Risk of Clinically Diagnosed Knee, Hip, and Hand Osteoarthritis: A Population-Based Cohort Study. Arthritis Rheumatol. 2016, 68, 1869–1875. [Google Scholar] [CrossRef] [PubMed]
- Park, D.; Park, Y.M.; Ko, S.H.; Hyun, K.S.; Choi, Y.H.; Min, D.U.; Han, K.; Koh, H.S. Association of general and central obesity, and their changes with risk of knee osteoarthritis: A nationwide population-based cohort study. Sci. Rep. 2023, 13, 3796. [Google Scholar] [CrossRef] [PubMed]
- Wijesinghe, S.N.; Badoume, A.; Nanus, D.E.; Sharma-Oates, A.; Farah, H.; Certo, M.; Alnajjar, F.; Davis, E.T.; Mauro, C.; Lindsay, M.A.; et al. Obesity defined molecular endotypes in the synovium of patients with osteoarthritis provides a rationale for therapeutic targeting of fibroblast subsets. Clin. Transl. Med. 2023, 13, e1232. [Google Scholar] [CrossRef] [PubMed]
- Philp, A.M.; Butterworth, S.; Davis, E.T.; Jones, S.W. eNAMPT Is Localised to Areas of Cartilage Damage in Patients with Hip Osteoarthritis and Promotes Cartilage Catabolism and Inflammation. Int. J. Mol. Sci. 2021, 22, 6719. [Google Scholar] [CrossRef] [PubMed]
- Philp, A.M.; Collier, R.L.; Grover, L.M.; Davis, E.T.; Jones, S.W. Resistin promotes the abnormal Type I collagen phenotype of subchondral bone in obese patients with end stage hip osteoarthritis. Sci. Rep. 2017, 7, 4042. [Google Scholar] [CrossRef] [PubMed]
- Nicholson, T.; Church, C.; Tsintzas, K.; Jones, R.; Breen, L.; Davis, E.T.; Baker, D.J.; Jones, S.W. Vaspin promotes insulin sensitivity of elderly muscle and is upregulated in obesity. J. Endocrinol. 2019, 241, 31–43. [Google Scholar] [CrossRef] [PubMed]
- Wilhelmsen, A.; Tsintzas, K.; Jones, S.W. Recent advances and future avenues in understanding the role of adipose tissue cross talk in mediating skeletal muscle mass and function with ageing. Geroscience 2021, 43, 85–110. [Google Scholar] [CrossRef] [PubMed]
- Pozzobon, D.; Ferreira, P.H.; Blyth, F.M.; Machado, G.C.; Ferreira, M.L. Can obesity and physical activity predict outcomes of elective knee or hip surgery due to osteoarthritis? A meta-analysis of cohort studies. BMJ Open 2018, 8, e017689. [Google Scholar] [CrossRef]
- Silha, J.V.; Krsek, M.; Skrha, J.V.; Sucharda, P.; Nyomba, B.L.; Murphy, L.J. Plasma resistin, adiponectin and leptin levels in lean and obese subjects: Correlations with insulin resistance. Eur. J. Endocrinol. 2003, 149, 331–335. [Google Scholar] [CrossRef]
- Lee, J.H.; Chan, J.L.; Yiannakouris, N.; Kontogianni, M.; Estrada, E.; Seip, R.; Orlova, C.; Mantzoros, C.S. Circulating resistin levels are not associated with obesity or insulin resistance in humans and are not regulated by fasting or leptin administration: Cross-sectional and interventional studies in normal, insulin-resistant, and diabetic subjects. J. Clin. Endocrinol. Metab. 2003, 88, 4848–4856. [Google Scholar] [CrossRef] [PubMed]
- Wiegertjes, R.; van de Loo, F.A.J.; Blaney Davidson, E.N. A roadmap to target interleukin-6 in osteoarthritis. Rheumatology 2020, 59, 2681–2694. [Google Scholar] [CrossRef]
- Chen, Y.T.; Hou, C.H.; Hou, S.M.; Liu, J.F. The effects of amphiregulin induced MMP-13 production in human osteoarthritis synovial fibroblast. Mediat. Inflamm. 2014, 2014, 759028. [Google Scholar] [CrossRef] [PubMed]
- Bachmeier, C.J.; March, L.M.; Cross, M.J.; Lapsley, H.M.; Tribe, K.L.; Courtenay, B.G.; Brooks, P.M.; Arthritis, C.; Outcome Project, G. A comparison of outcomes in osteoarthritis patients undergoing total hip and knee replacement surgery. Osteoarthr. Cartil. 2001, 9, 137–146. [Google Scholar] [CrossRef] [PubMed]
- O‘Brien, S.; Bennett, D.; Doran, E.; Beverland, D.E. Comparison of hip and knee arthroplasty outcomes at early and intermediate follow-up. Orthopedics 2009, 32, 168. [Google Scholar] [PubMed]
- Choi, J.K.; Geller, J.A.; Yoon, R.S.; Wang, W.; Macaulay, W. Comparison of total hip and knee arthroplasty cohorts and short-term outcomes from a single-center joint registry. J. Arthroplast. 2012, 27, 837–841. [Google Scholar] [CrossRef] [PubMed]

| Non-Responders | Mobility | Self-Care | Usual Activities | Pain/Discomfort | Anxiety/Depression | |||||
|---|---|---|---|---|---|---|---|---|---|---|
| All | Pre | Post | Pre | Post | Pre | Post | Pre | Post | Pre | Post |
| L1 | 19%(14) | 18%(13) | 80%(91) | 75%(86) | 17%(12) | 13%(9) | 4%(2) | 4%(2) | 80%(95) | 77%(92) |
| L2 | 81%(60) | 82%(61) | 20%(23) | 24%(27) | 80%(57) | 83%(59) | 89%(41) | 89%(41) | 19%(23) | 22%(26) |
| L3 | 0%(0) | 0%(0) | 0%(0) | 1%(1) | 3%(2) | 4%(3) | 7(3) | 7(3) | 1%(1) | 1%(1) |
| Hips | Pre | Post | Pre | Post | Pre | Post | Pre | Post | Pre | Post |
| L1 | 23%(9) | 23%(9) | 75%(45) | 70%(42) | 23%(9) | 21%(8) | 10%(2) | 10%(2) | 79%(54) | 79%(53) |
| L2 | 78%(31) | 78%(31) | 25%(15) | 30%(18) | 74%(29) | 74%(29) | 76%(16) | 76%(16) | 19%(13) | 21%(14) |
| L3 | 0%(0) | 0%(0) | 0%(0) | 0%(0) | 3%(1) | 5%(2) | 14%(3) | 14%(3) | 2%(1) | 2%(1) |
| Knees | Pre | Post | Pre | Post | Pre | Post | Pre | Post | Pre | Post |
| L1 | 15%(5) | 12%(4) | 85%(46) | 82%(44) | 9%(3) | 3%(1) | 0%(0) | 0%(0) | 80%(41) | 77%(39) |
| L2 | 85%(29) | 88%(30) | 15%(8) | 17%(9) | 88%(28) | 94%(30) | 100%(25) | 100%(25) | 20%(10) | 24%(12) |
| L3 | 0%(0) | 0%(0) | 0%(0) | 2%(1) | 3%(1) | 3%(1) | 0%(0) | 0%(0) | 0%(0) | 0%(0) |
| Responders | Mobility | Self-Care | Usual Activities | Pain/Discomfort | Anxiety/Depression | |||||
| All | Pre | Post ‡ | Pre | Post ‡ | Pre | Post ‡ | Pre | Post ‡ | Pre | Post ‡ |
| L1 | 0%(0) | 100%(91) | 0%(0) | 96%(48) | 0%(0) | 90%(86) | 0%(0) | 76%(93) | 0%(0) | 92%(44) |
| L2 | 100%(91) | 0%(0) | 96%(48) | 4%(2) | 87%(83) | 10%(100 | 54%(66) | 24%(30) | 88(42) | 8%(4) |
| L3 | 0%(0) | 0%(0) | 4%(2) | 0%(0) | 14%(13) | 0%(0) | 46%(57) | 0%(0) | 13%(6) | 0%(0) |
| Hips | Pre | Post ‡ | Pre | Post ‡ | Pre | Post ‡ | Pre | Post ‡ | Pre | Post ‡ |
| L1 | 0%(0) | 100%(59) | 0%(0) | 95%(37) | 0%(0) | 89%(55) | 0%(0) | 85%(69) | 0%(0) | 91%(30) |
| L2 | 100%(59) | 0%(0) | 95%(37) | 5%(2) | 86%(53) | 11%(7) | 61%(49) | 15%(12) | 85%(28) | 9%(3) |
| L3 | 0%(0) | 0%(0) | 5%(2) | 0%(0) | 15%(9) | 0%(0) | 40%(32) | 0%(0) | 15%(5) | 0%(0) |
| Knees | Pre | Post ‡ | Pre | Post ‡ | Pre | Post ‡ | Pre | Post ‡ | Pre | Post ‡ |
| L1 | 0%(0) | 100%(32) | 0%(0) | 100%(11) | 0%(0) | 91%(31) | 0%(0) | 57%(24) | 0%(0) | 93%(14) |
| L2 | 100%(32) | 0%(0) | 100%(11) | 0%(0) | 88%(30) | 9%(3) | 41%(17) | 43%(18) | 93%(14) | 7%(1) |
| L3 | 0%(0) | 0%(0) | 0%(0) | 0%(0) | 12%(4) | 0%(0) | 60%(25) | 0%(0) | 7%(1) | 0%(0) |
| All Patients | Responders | Non-Responders | ||||
|---|---|---|---|---|---|---|
| Age (years) | 70 (62,75) | 70 (62, 75) | 72.5 (63.5, 76.5) | |||
| Height (cm) | 166 (160, 175) | 167 (160, 175) | 163 (160, 173) | |||
| Weight (kg) | 75.7 (67.4, 91.7) | 75.3 (66, 89.9) | 81.4 (73, 93.7) | |||
| BMI (kg/m2) | 27.3 (24.8, 30.7) | 26.8 (24.6, 30,4) * | 29.9 (27.5, 33.6) * | |||
| WC (cm) | 96.3 (85.3, 107) | 96 (84, 105) * | 108 (91, 112) * | |||
| HC (cm) | 107 (99, 113) | 106 (99, 112) * | 113 (104, 121) * | |||
| WHR | 0.91 (0.84, 0.96) | 0.91 (0.84, 0.95) | 0.92 (0.88, 0.98) | |||
| Joint Space (mm) | 0 (0, 1) | 0 (0, 1) | 0 (0, 3.3) | |||
| K/L Grade | 4 (3, 4) | 4 (3, 4) | 4 (2.8, 4) | |||
| Serum | Synovial Fluid | Serum | Synovial Fluid | Serum | Synovial Fluid | |
| TNFα (pg/mL) | 5.1 (4.2, 5.6) | 5.1 (2.8, 9.5) | 5.1 (4.2, 5.6) | 5.1 (2.8, 9.5) | 5.2 (4, 5.6) | 5.1 (1.4, 14.0) |
| Visfatin (ng/mL) | 2.6 (1.8, 3.3) | 0 (0, 32) | 2.6 (1.8, 3.3) | 0 (0, 36) | 2.6 (1.8, 3.3) | 0 (0, 0) |
| IL10 (pg/mL) | 4.81 (4.46, 4.99) | 17.3 (12.2, 22.6) | 4.8 (4.46,4.99) | 17.3 (11.5, 21.6) | 4.7 (4.46, 5.05) | 21.6 (16.1, 31.3) |
| IL1B (pg/mL) | 15.9 (13.7, 17.8) | 25.1 (9.6, 31.6) | 15.9 (13.3, 17.8) | 28.4 (9.0, 31.6) | 16.1 (14.5, 18.2) | 16.3 (7.2, 36.3) |
| DKK1 (ng/mL) | 3.3 (2.3, 4.7) | 0.50 (0.35, 0.71) | 3.3 (2.3, 4.7) | 0.48 (0.35, 0.72) | 3.6 (2.2, 4.7) | 0.53 (0.41, 0.84) |
| MIP1α (ng/mL) | 0.42 (0.03, 0.54) | 0.34 (0.24, 0.39) | 0.42 (0.03, 0.53) | 0.34 (0.24, 0.39) | 0.46 (0.02, 0.60) | 0.43 (0.16, 0.46) |
| gal1 (ng/mL) | 43.9 (31.1, 58.0) | 110 (87, 126) | 40.7 (29.9, 57.7) | 109 (86, 127) | 53.4 (43.2, 67.8) | 111 (90, 125) |
| Chemerin (ng/mL) | 5.6 (3.4, 7.9) | 3.0 (2.4, 3.6) | 5.6 (3.5, 8.0) | 3.0 (2.4, 3.6) | 4.8 (2.7, 6.8) | 3.3 (3.1, 4.0) |
| Eotaxin (pg/mL) | 125 (61, 228) | 28.9 (9.5, 42.6) | 125 (62, 228) | 28.9 (9.5, 42.6) | 82 (61, 214) | 28.9 (9.5, 42.6) |
| gp130 (ng/mL) | 93 (69, 105) | 71.4 (61.6 76.8) | 93 (69, 104) | 71.4 (61.5, 77.2) | 102 (56, 108) | 67.6 (58.9, 76.8) |
| ip10 (pg/mL) | 23.4 (18.4, 32.4) | 104.4 (70.7, 151.4 | 23.9 (18.4, 36.7) | 106.3 (70.4, 152.9) | 22.8 (17.4, 26.6) | 98.9 (73.2, 265.1) |
| MCP1 (ng/mL) | 0.35 (0.25, 0.46) | 0.30 (0.15, 0.61) | 0.35 (0.25, 0.47) | 0.29 (0.15, 0.64) | 0.35 (0.27, 0.41) | 0.30 (0.18, 0.42) |
| IL7 (pg/mL) | 2.7 (1.8, 3.9) | 4.0 (2.8, 5.2) | 2.7 (1.8, 3.4) | 4.0 (2.8, 5.2) | 2.9 (2.2, 4.4) | 4.6 (4.0, 6.3) |
| MIP3α (pg/mL) | 34.4 (8.8, 59.9) | 22.7 (13.1, 42.6) | 33.5 (8.8, 54.7) | 22.9 (13.8, 43.7) | 62.8 (7.1, 71.2) | 9.4 (7.3, 42.1) |
| Amph (ng/mL) | 0.59 (0.59, 0.59) | 1.36 (0.55, 1.36) | 0.59 (0.48, 0.59) | 1.36 (0.55, 1.36) | 0.59 (0.59, 0.59) | 1.36 (0.78, 1.65) |
| IL15 (pg/mL) | 4.0 (3.0, 4.7) | 31.1 (20.9, 35.2) | 4.0 (3.0, 4.9) | 31.1 (18.8, 34.9) | 3.4 (3.1, 3.8) | 34.9 (27.0, 37.3) |
| Aggrecan (pg/mL) | 163 (116, 217) | 0 (0, 114) | 163 (116, 217) | 0 (0, 114) | 116 (116, 204) | 0 (0, 244) |
| Resistin (ng/mL) | 14.5 (11.2, 18.3) | 2.90 (1.72, 5.19) | 14.5 (11.2, 19.0) | 2.96 (1.99, 5.70) | 14.9 (8.7, 16.2) | 0.97 (0.53, 2.65)* |
| Serpin E1 (ng/mL) | 135 (100, 167) | 15.6 (8.5, 42.7) | 137 (105, 167) | 16.2 (8.4, 49.4) | 113 (19, 165) | 11.0 (6.6, 18.3) |
| Adpn (µg/mL) | 9.9 (6.34, 13.5) | 2.7 (2.0, 4.6) | 9.9 (6.8, 14.2) | 2.8 (2.0, 5.3) | 8.5 (1.4, 11.5) | 2.5 (1.6, 3.2) |
| IL6 (pg/mL) | 2.1 (0.0, 2.7) | 132 (57, 453) | 2.1 (0, 2.8) | 175 (64, 577) | 0 (0, 2.0) | 69 (8, 222) |
| Leptin (ng/mL) | 13.1 (6.7, 26.1) | 17.3 (7.1, 54.6) | 12.6 (6.3, 26.1) | 16.3 (6.5, 48.1) | 23.3 (12.7, 27.6) | 54.5 (40.3, 67.9) * |
| FABP4 (ng/mL) | 18.0 (12.6, 28.2) | 16.7 (8.2, 81.4) | 17.9 (11.8, 27.2) | 16.1 (7.7, 66.0) | 18.8 (15.6, 41.0) | 60.1 (11.7, 159.6) |
| MIP1β (ng/mL) | 152 (105, 184) | 55.9 (0, 105.3) | 150 (101, 187) | 55.9 (0, 105.3) | 128 (85, 165) | 0 (0, 80.6) |
| Linear REGRESSION Coefficient (95% CI) † | r | p-Value | |
|---|---|---|---|
| AGE | −0.003 (−0.012, 0.006) | 0.065 | 0.564 |
| Height (cm) | −0.005 (−0.013, 0.003) | 0.137 | 0.228 |
| Weight (kg) | −0.005 (−0.009, −0.00002) | 0.222 | 0.049 |
| BMI | −0.012 (−0.026, 0.003) | 0.181 | 0.108 |
| Waist circumference (cm) | −0.003 (−0.007, 0.0007) | 0.193 | 0.104 |
| Hip circumference (cm) | −0.003 (−0.007, 0.002) | 0.145 | 0.225 |
| WHR | −0.456 (−1.35, 0.440) | 0.121 | 0.313 |
| Joint Space (mm) | −0.023 (−0.075, 0.029) | 0.103 | 0.376 |
| K and L grade | 0.015 (−0.077, 0.106) | 0.037 | 0.751 |
| Linear Regression Coefficient (95% CI) † | r | p-Value | Multiple Linear Regression Coefficient (95% CI) ‡ | r | p-Value | |
|---|---|---|---|---|---|---|
| TNF-α | −0.006 (−0.04, 0.028) | 0.046 | 0.715 | −0.004 (−0.054, 0.046) | 0.293 | 0.872 |
| Visfatin | 0.001 (−0.006, 0.07) | 0.023 | 0.856 | 0.001 (−0.007, 0.008) | 0.291 | 0.836 |
| IL-10 | −0.0003 (−0.005, 0.005) | 0.013 | 0.92 | −0.001 (−0.006, 0.005) | 0.291 | 0.824 |
| IL-1β | 0.002 (−0.001, 0.006) | 0.174 | 0.165 | 0.003 (−0.001, 0.007) | 0.346 | 0.175 |
| DKK1 | −0.024 (−0.065, 0.017) | 0.147 | 0.243 | −0.031 (−0.082, 0.021) | 0.344 | 0.239 |
| MIP1α | 0.042 (−0.223, 0.306) | 0.04 | 0.754 | 0.014 (−0.307, 0.336) | 0.292 | 0.928 |
| Galectin1 | −0.0008 (−0.003, 0.001) | 0.097 | 0.442 | −0.0001 (−0.003, 0.002) | 0.292 | 0.932 |
| Chemerin | −0.006 (−0.026, 0.013) | 0.079 | 0.531 | −0.007 (−0.032, 0.018) | 0.301 | 0.586 |
| Eotaxin | 0.00014 (−0.00028, 0.00055) | 0.082 | 0.519 | 0.00013 (−0.001, 0.001) | 0.284 | 0.968 |
| gp130 | −0.0014 (−0.004, 0.001) | 0.170 | 0.175 | −0.002 (−0.004, 0.001) | 0.336 | 0.230 |
| IP10 | 0.00046 (−0.003, 0.004) | 0.034 | 0.786 | 0.001 (−0.003, 0.005) | 0.297 | 0.679 |
| MCP1 | 0.004 (−0.059, 0.067) | 0.017 | 0.895 | 0.028 (−0.049, 0.104) | 0.308 | 0.472 |
| IL-7 | −0.018 (−0.076, 0.04) | 0.079 | 0.531 | −0.007 (−0.092, 0.078) | 0.293 | 0.872 |
| MIP3α | 6.8 × 10⁻⁶ (−0.00013, 0.00014) | 0.013 | 0.919 | 6.02 × 10⁻⁶ (−0.00016, 0.00014) | 0.292 | 0.936 |
| Amphiregulin | 0.091 (−0.340, 0.522) | 0.054 | 0.674 | 0.240 (−0.301, 0.780) | 0.315 | 0.377 |
| IL-15 | 0.002 (−0.012, 0.016) | 0.034 | 0.788 | 0.001 (−0.016, 0.018) | 0.290 | 0.920 |
| Aggrecan | 7.5 × 10⁻⁵ (−0.00014, 0.00029) | 0.088 | 0.487 | 0.0004 (−0.0001, 0.001) | 0.365 | 0.106 |
| Resistin | 0.007 (−0.001, 0.016) | 0.219 | 0.085 | 0.006 (−0.005, 0.016) | 0.329 | 0.288 |
| Serpin E1 | 0.0005 (−0.0006, 0.0016) | 0.110 | 0.383 | 0.001 (−0.001, 0.002) | 0.318 | 0.361 |
| Adiponectin | 0.008 (−0.004, 0.020) | 0.165 | 0.193 | 0.006 (−0.01, 0.022) | 0.310 | 0.467 |
| IL-6 | 1.9 × 10⁻⁵ (−0.001, 0.009) | 0.005 | 0.970 | −8.3 × 10⁻⁵ (−0.001, 0.001) | 0.293 | 0.881 |
| Leptin | 0.00019 (−0.004, 0.004) | 0.012 | 0.925 | 0.00014 (−0.007, 0.007) | 0.279 | 0.967 |
| FABP4 | 0.001 (−0.001, 0.004) | 0.145 | 0.252 | 0.001 (−0.002, 0.004) | 0.308 | 0.494 |
| MIP1β | 0.0006 (−0.0004, 0.0016) | 0.209 | 0.102 | 0.001 (−0.001, 0.002) | 0.312 | 0.430 |
| Linear Regression Coefficient (95% CI) † | r | p-Value | Multiple Linear Regression Coefficient (95% CI) ‡ | r | p-Value | |
|---|---|---|---|---|---|---|
| TNF-α | 0.001 (−0.018, 0.020) | 0.016 | 0.921 | 0.008 (−0.022, 0.037) | 0.544 | 0.584 |
| Visfatin | 0.001 (−0.001, 0.003) | 0.195 | 0.222 | 0.001 (−0.001, 0.004) | 0.560 | 0.352 |
| IL-10 | −0.0004 (−0.010, 0.009) | 0.012 | 0.940 | −0.001 (−0.016, 0.013) | 0.537 | 0.843 |
| IL-1β | 0.0005 (−0.006, 0.007) | 0.024 | 0.881 | 0.002 (−0.006, 0.011) | 0.544 | 0.589 |
| DKK1 | −0.073 (−0.225, 0.08) | 0.153 | 0.339 | −0.120 (−0.543, 0.302) | 0.545 | 0.562 |
| MIP1α | −0.284 (−0.882, 0.313) | 0.152 | 0.342 | −0.633 (−0.155, 0.283) | 0.587 | 0.166 |
| Galectin1 | 0.0018 (−0.0019, 0.0056) | 0.156 | 0.329 | 0.0003 (−0.006, 0.005) | 0.536 | 0.906 |
| Chemerin | −0.023 (−0.099, 0.052) | 0.100 | 0.534 | 0.004 (−0.117, 0.126) | 0.536 | 0.940 |
| Eotaxin | −0.0007 (−0.002, 0.001) | 0.146 | 0.362 | −0.001 (−0.002, 0.001) | 0.545 | 0.559 |
| gp130 | −0.001 (−0.008, 0.006) | 0.054 | 0.738 | −0.003 (−0.013, 0.007) | 0.545 | 0.565 |
| IP10 | 0.00013 (−0.0005, 0.0007) | 0.069 | 0.670 | 0.000019 (−0.001, 0.001) | 0.535 | 0.960 |
| MCP1 | 0.026 (−0.052, 0.105) | 0.109 | 0.497 | 0.06 (−0.03, 0.155) | 0.582 | 0.193 |
| IL-7 | −0.033 (−0.093, 0.028) | 0.172 | 0.283 | −0.031 (−0.112, 0.05) | 0.533 | 0.438 |
| MIP3α | 0.002 (−0.002, 0.006) | 0.164 | 0.307 | 0.001 (−0.005, 0.007) | 0.541 | 0.654 |
| Amphiregulin | −0.158 (−0.343, 0.026) | 0.268 | 0.09 | −0.24 (−0.5, 0.021) | 0.619 | 0.07 |
| IL-15 | −0.001 (−0.009, 0.008) | 0.020 | 0.90 | −0.003 (−0.016, 0.010) | 0.543 | 0.615 |
| Aggrecan | −0.0005 (−0.0015, 0.0005) | 0.169 | 0.29 | −0.0004 (−0.002, 0.001) | 0.538 | 0.773 |
| Resistin | 0.0011 (−0.008, 0.010) | 0.041 | 0.801 | −0.002 (−0.016, 0.012) | 0.538 | 0.777 |
| Serpin E1 | 0.0018 (−0.0019, 0.0054) | 0.154 | 0.338 | 0.001 (−0.006, 0.007) | 0.537 | 0.808 |
| Adiponectin | 0.032 (−0.004, 0.069) | 0.274 | 0.083 | 0.022 (−0.055, 0.098) | 0.545 | 0.560 |
| IL-6 | 0.0013 (−0.00001, 0.00028) | 0.288 | 0.072 | 0.0001 (−0.00008, 0.0003) | 0.569 | 0.223 |
| Leptin | 0.0002 (−0.0024, 0.0029) | 0.028 | 0.868 | 0.0002 (−0.006, 0.006) | 0.560 | 0.950 |
| FABP4 | 0.00004 (−0.00009, 0.00018) | 0.104 | 0.521 | −0.001 (−0.003, 0.001) | 0.552 | 0.348 |
| MIP1β | 0.00044 (−0.0012, 0.0021) | 0.089 | 0.585 | −0.001 (−0.003, 0.001) | 0.566 | 0.239 |
| R | p-Value | Unstandardized Coefficients (B) | ||||
|---|---|---|---|---|---|---|
| Cytokine | BW | Constant | Equation | |||
| Amph, BW | 0.434 | 0.023 | −0.108 | −0.0006 | 1.052 | ΔEQ5D = −0.108 [Amph ng/mL] – 0.0006 [BW kg] + 1.053 |
| IL-6, BW | 0.418 | 0.035 | 7.4 × 10⁻⁵ | −0.006 | 0.871 | ΔEQ5D = 7.4 × 10⁻⁵ [IL-6 ng/mL] – 0.006 [BW kg] + 0.871 |
| Amph, IL-6, BW | 0.470 | 0.035 | −0.142 (Amph) 8.3 × 10⁻⁵ (IL-6) | −0.005 | 0.919 | ΔEQ5D = −0.142 [Amph ng/mL] +8.3 × 10⁻⁵ [IL-6 ng/mL] −0.005 [BW kg] + 0.919 |
Disclaimer/Publisher’s Note: The statements, opinions and data contained in all publications are solely those of the individual author(s) and contributor(s) and not of MDPI and/or the editor(s). MDPI and/or the editor(s) disclaim responsibility for any injury to people or property resulting from any ideas, methods, instructions or products referred to in the content. |
© 2024 by the authors. Licensee MDPI, Basel, Switzerland. This article is an open access article distributed under the terms and conditions of the Creative Commons Attribution (CC BY) license (https://creativecommons.org/licenses/by/4.0/).
Share and Cite
Nanus, D.E.; Davis, E.T.; Jones, S.W. Pre-Operative Adiposity and Synovial Fluid Inflammatory Biomarkers Provide a Predictive Model for Post-Operative Outcomes Following Total Joint Replacement Surgery in Osteoarthritis Patients. Osteology 2024, 4, 53-63. https://doi.org/10.3390/osteology4020005
Nanus DE, Davis ET, Jones SW. Pre-Operative Adiposity and Synovial Fluid Inflammatory Biomarkers Provide a Predictive Model for Post-Operative Outcomes Following Total Joint Replacement Surgery in Osteoarthritis Patients. Osteology. 2024; 4(2):53-63. https://doi.org/10.3390/osteology4020005
Chicago/Turabian StyleNanus, Dominika E., Edward T. Davis, and Simon W. Jones. 2024. "Pre-Operative Adiposity and Synovial Fluid Inflammatory Biomarkers Provide a Predictive Model for Post-Operative Outcomes Following Total Joint Replacement Surgery in Osteoarthritis Patients" Osteology 4, no. 2: 53-63. https://doi.org/10.3390/osteology4020005
APA StyleNanus, D. E., Davis, E. T., & Jones, S. W. (2024). Pre-Operative Adiposity and Synovial Fluid Inflammatory Biomarkers Provide a Predictive Model for Post-Operative Outcomes Following Total Joint Replacement Surgery in Osteoarthritis Patients. Osteology, 4(2), 53-63. https://doi.org/10.3390/osteology4020005