Article

ScionPathML: Enabling an Empirical Measurement Dataset and Benchmarks for Path-Aware Networking

1
Computer Science Department, CESI Engineering School, 31670 Labège, France
2
Department of Software Engineering, Thompson Rivers University, Kamloops, BC V2C 0C8, Canada
3
Engineering and Applied Science, University of Regina, Regina, SK S4S 0A2, Canada
*
Author to whom correspondence should be addressed.
Telecom 2026, 7(4), 81; https://doi.org/10.3390/telecom7040081
Submission received: 9 May 2026 / Revised: 9 June 2026 / Accepted: 15 June 2026 / Published: 2 July 2026

Abstract

Path-aware networking architectures, such as SCION, give endpoints explicit visibility into multiple inter-domain paths, opening new opportunities for data-driven path selection, reliability prediction, and automated diagnosis. However, the lack of standardized, machine learning-ready datasets collected from live path-aware deployments has slowed progress in this domain. We present ScionPathML, an open-source measurement and data-standardization pipeline that abstracts the complexity of SCION’s tooling to continuously collect longitudinal performance measurements (RTT, packet loss, jitter, bandwidth, and per-hop latency) in formats directly usable by ML pipelines. Using a four-week, multi-region campaign across four vantage points on the SCIONLab testbed, we release a public dataset capturing path availability, churn, lifetimes, and end-to-end performance across concurrently available paths. To demonstrate its application, we define four reproducible benchmark tasks, including short-horizon performance forecasting, path failure prediction, anomaly detection, and multi-objective path recommendation, each accompanied by baseline models and evaluation protocols. Our results show that live SCION path performance exhibits an exploitable temporal structure, enabling accurate short-term predictions and early detection of availability drops. Together, the dataset, benchmarks, and open tooling substantially lower the barrier for ML researchers and provide a reproducible foundation for accelerating innovation in path-aware networking.

1. Introduction

The inter-domain routing system of today’s Internet is predominantly governed by the Border Gateway Protocol (BGP), in which routing decisions emerge from policy negotiations and control-plane interactions among autonomous systems (ASs) rather than from explicit choices made by endpoints [1,2]. As a result, the specific sequence of ASs and links that a packet traverses between two communicating endpoints remains largely opaque to the applications themselves, which have minimal visibility into path properties and almost no ability to influence or select among alternative routes [2,3]. This architectural opacity creates persistent difficulties for applications that aim to optimize end-to-end performance, improve reliability through concurrent use of multiple paths, or enforce security and policy constraints.
In response, path-aware networking has emerged as an architectural paradigm in which endpoints can discover the set of available inter-domain paths and actively incorporate path properties, such as latency, packet loss, available bandwidth, or security and policy constraints, into their path selection decisions [2,3,4]. This represents a fundamental shift from conventional destination-based routing, where the route taken by traffic is treated as an unobserved latent variable determined solely by upstream control-plane interactions. In path-aware networking, the relevant object of observation and control becomes the dynamic set of concurrently available paths whose membership, lifetimes, and performance characteristics evolve over time due to control-plane churn and varying network conditions. These capabilities open new opportunities for multipath transport protocols and for policy- and security-driven delivery.
However, path-aware networking also introduces new operational challenges. Because path quality varies continuously due to control-plane churn, traffic fluctuations, and link dynamics—and because multiple paths to the same destination are typically available concurrently—the path that best satisfies an application’s requirements depends on the specific objective, whether minimizing latency, maximizing throughput, reducing loss, or satisfying a combination of constraints. Consequently, endpoints require timely and comparable measurements across the set of currently available paths if they are to make informed selection decisions. Without such measurements, the potential benefits of path-aware networking remain difficult to realize in practice.
Despite growing interest in applying machine learning and data-driven techniques to networking problems such as performance forecasting, anomaly detection, fault prediction, and adaptive routing [5], progress in path-aware environments has been constrained by the scarcity of public, longitudinal datasets suitable for machine learning research. Existing large-scale measurement infrastructures, such as RIPE Atlas, have enabled valuable empirical studies of Internet reachability and performance at global scale. However, they do not expose the set of concurrently available inter-domain path alternatives, nor do they capture the control-plane events that cause paths to appear, disappear, or change their properties over time [6,7]. Consequently, researchers lack the standardized, path-level, time-series data needed to develop and evaluate learning-based methods that can exploit the explicit path diversity and dynamics offered by architectures such as SCION [8].
SCION (Scalability, Control, and Isolation on Next-generation Networks) constitutes one of the most mature and widely studied realizations of path-aware networking [9,10]. In SCION, autonomous systems are organized into Isolation Domains (ISDs) that provide scoped trust and limit the propagation of routing failures, while endpoints obtain and select among multiple cryptographically protected, AS-level paths to a given destination rather than relying exclusively on hop-by-hop forwarding decisions made by intermediate routers [4,9,10]. These architectural properties enable researchers to directly observe and analyze, from the endpoint, central phenomena of path-aware networking, including the simultaneous availability of multiple inter-domain paths, the temporal dynamics that govern path lifetimes and churn, and the performance differences among concurrently available alternatives [11]. To conduct such a study under realistic conditions, we employ SCIONLab, a globally distributed research testbed that enables researchers to operate full-fledged SCION autonomous systems and to perform experiments over live inter-domain SCION paths [12].
Although SCIONLab provides a realistic path-aware environment, collecting data suitable for machine learning presents distinct practical challenges. It requires specialized expertise in path-aware architectures together with a different networking toolset than the one used for conventional Internet measurement platforms. Furthermore, the raw data obtained from SCION paths are not immediately amenable to ML pipelines and requires systematic processing, standardization, and structuring into time-series formats that consistently capture path availability, churn events, and performance metrics. The resulting lack of readily available, ML-ready datasets from path-aware testbeds has hindered the application of modern data-driven methods to this domain.
To address this gap, we present ScionPathML, a reproducible measurement and data-standardization pipeline that automates the discovery of SCION paths, the collection of longitudinal performance measurements, and the export of analysis- and machine learning-ready datasets. Using ScionPathML, we conducted a four-week measurement campaign across four vantage points deployed in distinct geographic regions on the SCIONLab testbed. The resulting public dataset captures path availability, churn, lifetimes, and end-to-end performance metric including round-trip time, packet loss, jitter, and available bandwidth across multiple concurrently available paths.
In addition, to demonstrate the utility of the released dataset for machine learning research in path-aware networks, we define four benchmark tasks that reflect core decision problems faced by endpoints: short-horizon performance forecasting, path failure prediction, anomaly detection, and multi-objective path recommendation. For each task, we provide reproducible baseline models together with evaluation protocols and metrics to establish standardized reference points against which future, more advanced approaches can be compared. These benchmarks illustrate that the longitudinal path-level measurements collected by ScionPathML contain exploitable temporal structure and statistical signals that can support proactive path selection, reliability improvement, and automated diagnosis in SCION and similar path-aware architectures.
Our primary contributions are as follows.
  • We design and release ScionPathML, an open-source measurement pipeline that automates SCION path discovery and probing while producing standardized, analysis-ready outputs, thereby lowering the barrier for researchers to collect longitudinal path-performance data in SCIONLab and similar environments.
  • We conduct a four-week, multi-region measurement campaign on SCIONLab and release the resulting public dataset, accompanied by a statistical characterization of path availability, churn, lifetimes, and performance variability.
  • We define four reproducible benchmark tasks (performance forecasting, failure prediction, anomaly detection, and multi-objective path recommendation), each accompanied by baseline models and evaluation protocols, to facilitate systematic and comparable research on learning-based methods for path-aware networking.
The remainder of this paper is organized as follows. Section 2 describes the measurement methodology, including the SCIONLab deployment, the metrics and tools employed, the experimental conditions, and the procedures used to ensure data quality and reliability. Section 3 presents the released dataset together with a statistical characterization of path churn, lifetimes, and performance variability. Section 4 defines the four benchmark tasks and reports baseline results for performance forecasting, failure prediction, anomaly detection, and multi-objective path recommendation. Section 5 discusses the limitations of the present study and outlines directions for future work, and Section 6 concludes the paper.

2. Measurement Methodology

To enable systematic, longitudinal measurement of path dynamics in SCION, we developed ScionPathML, a reproducible measurement and data-standardization pipeline. The pipeline automates SCION path discovery, performance probing across concurrently available paths, and the export of structured, analysis- and machine learning-ready datasets. Using this pipeline, we conducted a four-week campaign across four vantage points on the SCIONLab testbed. The campaign was designed to investigate three core aspects of path-aware networking: (i) the composition of the set of concurrently available paths at any given time, (ii) the manner in which both individual paths and the overall path set evolve over time due to control-plane churn, and (iii) the degree to which path performance exhibits temporal structure that can be leveraged for proactive decision-making. This section describes the measurement infrastructure, the metrics and tools employed, the experimental conditions under which the campaign was executed, and the procedures adopted to ensure data quality, reliability, and reproducibility.

2.1. Measurement Infrastructure and Setting

We conducted the campaign on SCIONLab [12,13], a globally distributed research testbed that supports full-fledged SCION autonomous systems and live inter-domain experiments. Because SCIONLab exposes multiple cryptographically protected AS-level paths between any pair of vantage points, it provides a realistic environment for observing the exact multipath diversity and control-plane churn that endpoints experience in path-aware networks.
Four vantage points (VPs) were deployed as virtual machines in distinct geographic regions: Europe, North America, Switzerland, and Taiwan. Each VP was provisioned on Google Cloud Compute Engine using the e2-medium instance type (2 vCPUs, 4 GB RAM, Debian-based Linux). We note that the e2-medium configuration uses a shared-core vCPU model, which can introduce additional timing variability for short network probes. We mitigated this through repeated sampling (multiple probes per path), averaging, conservative probe rates, and explicit outlier handling. The observed end-to-end jitter across the campaign was 184.6 ± 36.3  ms.
One limitation is our use of shared-core Google Cloud e2-medium instances, which can introduce timing variability. We mitigated this through repeated sampling, averaging, and outlier handling. The observed end-to-end jitter was nevertheless 184.6 ± 36.3 ms.
Each vantage point runs the standard SCION end-host stack and follows identical measurement schedules. Because SCIONLab exposes multiple concurrent AS-level paths between any pair of vantage points, the measurements naturally capture the multipath diversity and temporal dynamics that endpoints actually observe in this path-aware environment [10].

2.2. Metrics, Tools, and Path Definitions

ScionPathML collects three complementary categories of data at each measurement cycle: (a) path-set information describing which paths are available at a given time, (b) end-to-end performance metrics including round-trip time, packet loss, jitter, and available bandwidth, and (c) per-hop structure obtained via traceroute. All measurements are performed using SCION’s standard host-stack tooling, together with the SCIONLab bandwidth tester application [14,15]. Table 1 provides an overview of the metrics collected, the tools used, and the primary outputs recorded for each metric.
At each measurement cycle, every vantage point performs path discovery toward each destination using scion showpaths. Each discovered path is assigned a stable path fingerprint computed deterministically from its AS-level hop sequence and interface identifiers. We define the path set  P s , d ( t ) as the collection of fingerprints observed between source s and destination d at time t.
We distinguish control-plane availability (a path’s fingerprint appears in P s , d ( t ) ) from data-plane reachability (probes on that path receive replies within the timeout). A path change event occurs on any set difference between consecutive path sets. We record both churn and reachability because endpoints must reason about both the existence of alternatives and their actual usability [2,3].
Round-trip time and packet loss are measured using scion ping pinned to a specific path fingerprint. For each path, we transmit k ICMP-equivalent SCION echo probes and record the minimum, mean, and maximum RTT, the standard deviation (used as a jitter proxy), and the loss rate defined as the fraction of probes that receive no reply.
Available throughput is measured using scion-bwtestclient against dedicated SCIONLab bandwidth test servers. The bwtester application limits each test to a maximum of 10 s and supports parameterization of test duration, packet size, packet count, and target sending rate [14,15]. We probe three load regimes using tiered target rates of 10, 50, and 100 Mbps, while respecting server-side client serialization policies. For each test, we record the achieved throughput reported by the tool together with the configured parameters and server identity.
Hop-by-hop latency is obtained with scion traceroute along selected paths. For each traceroute, we record the ordered hop list, the per-hop RTT estimates returned by the tool, and any missing hops or timeouts. These measurements support diagnosis of whether observed end-to-end changes originate from localized bottlenecks or from distributed delay increases along the path.
The principal experimental parameters are summarized in Table 2.

2.3. Campaign Execution and Experimental Conditions

The measurement campaign was conducted over four consecutive weeks (11 July–11 August 2025). Each vantage point executed a complete measurement cycle every 30 min according to a cron schedule. This interval was chosen to provide sufficient temporal resolution for observing diurnal patterns and short-term predictability, while remaining within acceptable limits of probe intrusiveness and platform stability. All measurement schedules and timestamps were recorded in UTC to ensure consistency across the geographically distributed vantage points.
At each 30 min interval, every vantage point executes an identical three-stage cycle: (i) path discovery via scion showpaths, (ii) single-path measurements (ping, bandwidth, traceroute), and (iii) concurrent multipath probes. All clocks are NTP-synchronized to UTC boundaries. Every command produces structured JSON plus execution logs. Raw records are processed by a deterministic pipeline (publicly available) that extracts stable path fingerprints, normalizes timestamps, flags missing data with explicit reasons, and builds sliding windows, with no imputation applied [16].
Because path-aware networks expose multiple paths simultaneously, we distinguish between two experimental conditions. In the single-path condition, each vantage point probes one path at a time. These measurements reflect per-path performance under normal background traffic. In the concurrent condition, multiple paths to the same destination are probed simultaneously. This condition introduces potential interference and resource contention, which can alter the observed performance of individual paths. Concurrent bandwidth tests were configured to respect server-side client serialization policies, and any server-busy responses were recorded explicitly as part of the measurement outcomes.

2.4. Data Quality, Reliability, and Ethics

Because active measurement in wide-area networks is inherently subject to transient failures, we adopted a conservative failure-handling policy. Every measurement action is attempted up to a maximum number of times with exponential backoff upon encountering a transient error, such as a timeout or temporary server unavailability. If all attempts fail, the action is recorded as failed together with a standardized error code rather than being silently discarded. The specific retry parameters used in the campaign are listed in Table 2.
A measurement cycle is considered complete only when all scheduled actions—path discovery, single-path probes, and multipath probes—successfully produce a record for that interval. When any action fails to complete, we record an explicit missingness reason (for example, no paths available, timeout, server busy, or local execution error). For each tool, we define precise failure conditions: a showpaths failure occurs on command error or empty output; a ping failure occurs when zero replies are received or the command times out; a bwtest failure occurs on tool error, server-busy response without successful completion, or timeout; and a traceroute failure occurs when no hop replies are received or the command times out. Every failure is logged together with the number of retries attempted. This explicit recording of missing data and its causes follows established principles in network measurement research, ensuring that downstream analyses can distinguish between fundamentally different sources of data absence.
Active network measurement can affect both the target networks and other users. We therefore adopted several mitigations consistent with community guidelines for responsible measurement. All probes were rate-limited: latency and path discovery measurements used low probe rates, while bandwidth tests were strictly bounded in duration and target rate, following the built-in constraints of the bwtester application. To reduce the risk of introducing bias from cloud-based vantage points, we deployed measurement nodes across four geographically diverse regions and provide full methodological documentation to support replication and extension in other environments. We also separated single-path and concurrent multipath measurement conditions to avoid conflating self-induced interference with intrinsic path performance. The complete measurement pipeline, raw and processed datasets, and analysis code are publicly available, as described in Section 7.

3. Dataset Release and Statistical Characterization

3.1. Campaign Scope and Data Products

The ScionPathML dataset is derived from a four-week longitudinal measurement campaign conducted on the SCIONLab testbed between 11 July and 11 August 2025. Three vantage points were deployed as virtual machines in geographically distinct regions, each operating as a full SCION autonomous system in Isolation Domains 17 (Switzerland), 18 (United States), 19 (Europe), and 22 (Taiwan). These vantage points formed a complete bidirectional measurement mesh to enable detailed observation of path dynamics under realistic inter-domain conditions. All quantitative analyses are restricted to the stable 27-day observation window from 16 July to 11 August 2025, following an initial stabilization period.
Two complementary data products are released alongside this paper to support both reproducibility and machine learning research. The first product consists of the complete collection of raw JSON records generated by every invocation of the measurement tools (scion showpaths, scion ping, scion traceroute, and scion-bwtestclient). Each record contains the full tool output, UTC-normalized timestamps, source and destination ISD-AS identifiers, stable path fingerprints, and explicit status or error codes. These raw logs serve as the authoritative source for independent verification or custom re-processing. The second product comprises a set of analysis-ready tabular datasets in CSV format, derived deterministically from the raw records. Separate tables are provided for path discovery snapshots (containing the full set of available path fingerprints at each timestamp), single-path and concurrent-multipath latency/loss/jitter measurements, bandwidth test results across multiple load tiers, and per-hop traceroute records. Every row in the processed tables is linked to its originating raw JSON record through unique identifiers.
The processed CSV tables are organized to facilitate direct use in statistical analysis and machine learning pipelines. The path discovery table records the complete set of available path fingerprints observed at each 30 min timestamp, together with metadata such as MTU and policy constraints. The single-path performance table contains round-trip time (minimum, mean, maximum, and standard deviation), packet loss ratio, and jitter measurements for individually probed paths. A corresponding multipath performance table stores the same metrics collected, while up to three disjoint paths were used concurrently to enable direct comparison of per-path degradation under contention. Bandwidth test results are provided for multiple target rates (10, 50, and 100 Mbps), with achieved throughput and loss recorded separately for single-path and concurrent-multipath conditions. Finally, the traceroute table captures per-hop round-trip times along selected paths. All tables share a common stable path fingerprint (computed from the ordered sequence of ISD-AS-hop identifiers and interface numbers). This identifier enables reliable longitudinal tracking of the same physical path across measurement cycles despite control-plane churn and links every processed record to its originating raw JSON file.
All measurement and analysis code, together with the complete raw JSON archives and derived CSV tables, are publicly available in the project repository [16].

3.2. Scale of the Measurement Campaign

The campaign produced a dense longitudinal record of path availability and performance across the vantage-point mesh. In total, 11,529 path-set comparisons were performed over the 1281 consecutive 30 min intervals in the stable analysis window. These comparisons identified 1130 path change events, corresponding to an overall churn rate of 9.8% of measurement intervals. The 95% Wilson score confidence interval for this proportion is [ 9.27 % , 10.36 % ] . The narrow width of the interval reflects the large sample size and indicates that control-plane churn is a persistent and well-estimated characteristic of the observed SCIONLab environment.
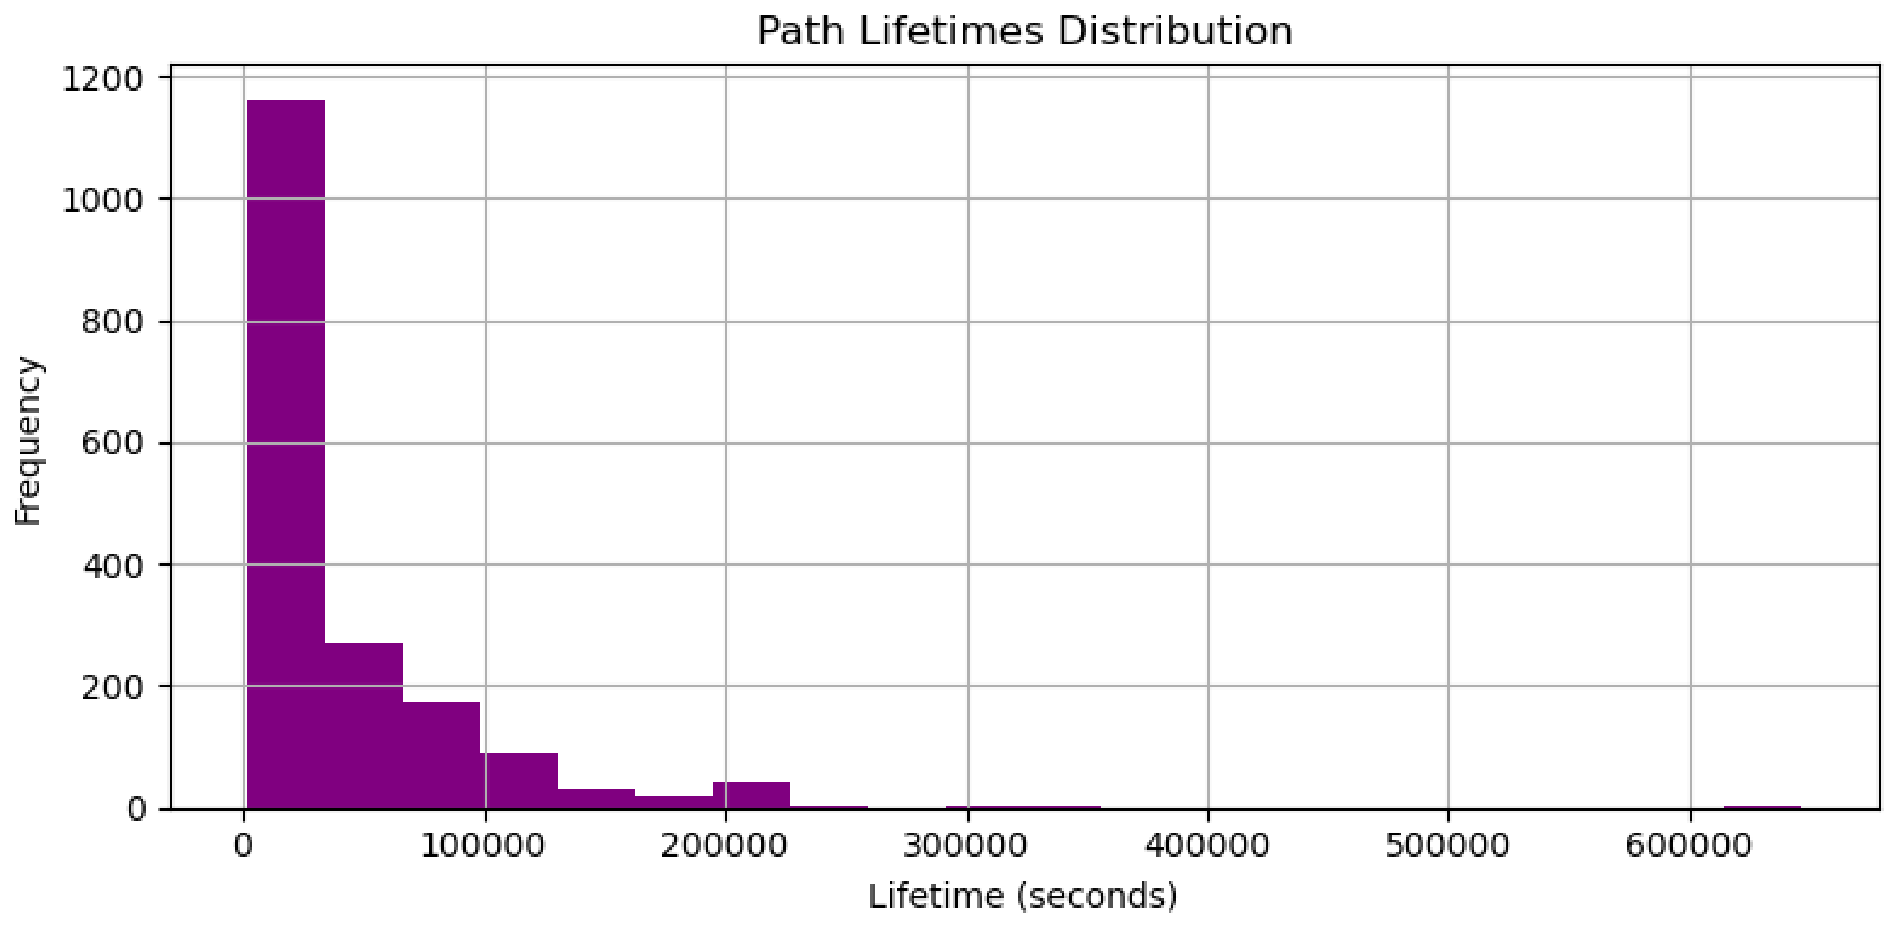
Path lifetimes were derived from the birth and death timestamps of each unique path fingerprint observed during the campaign. Lifetimes varied between directed source–destination pairs, ranging from approximately 12 to 33 h, with a median lifetime of roughly 17 h. The distribution is right-skewed: the majority of paths persisted for less than one day, while a smaller number of longer-lived paths extended the upper tail. Because of this skewness, the median provides a more robust summary statistic than the mean for many modeling purposes. The complete set of per-path lifetime observations is included in the released dataset.
End-to-end performance metrics collected across the campaign also exhibited substantial variability. Aggregated over all measurements, mean jitter was 184.6 ± 36.3  ms, corresponding to a coefficient of variation of approximately 19.7%. Packet loss rates typically fell in the range of 0.3–0.53%, depending on the destination. These dispersion statistics indicate that path quality is not static even within short time windows.

3.3. Path Availability and Churn Dynamics

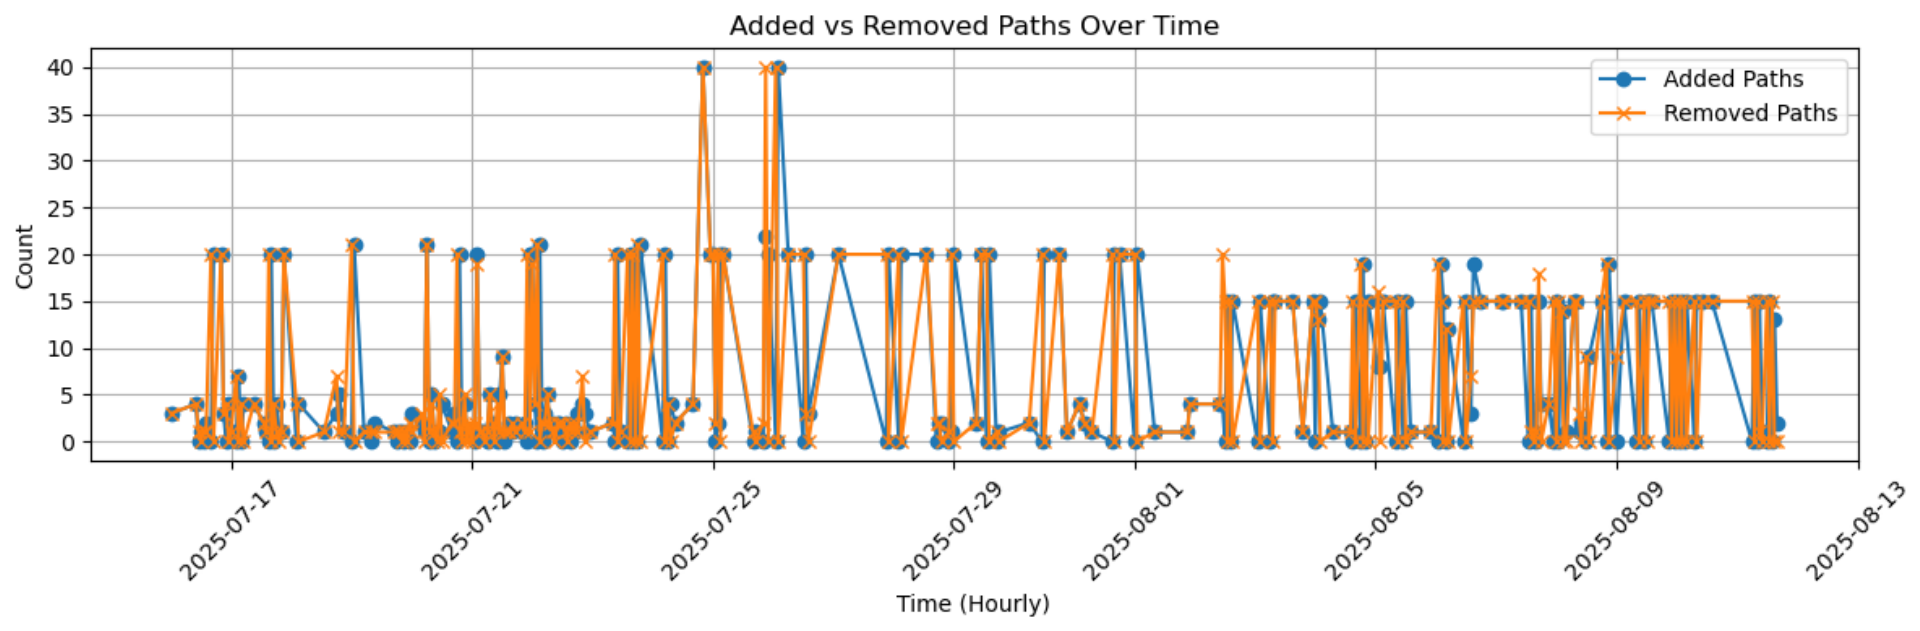
Control-plane churn was continuous and substantial. Pairwise set comparisons across the 1281 intervals revealed markedly different dynamics toward the two destinations: one experienced 161 change events (mean path lifetime 15.7 h), while the other saw 301 events (mean lifetime 8.6 h). These patterns are visualized in Figure 1.
The resulting distribution of individual path lifetimes across the entire campaign is shown in Figure 2.

3.4. End-to-End Performance Variability

Data-plane performance measurements revealed distinct profiles across the two primary destinations in the measurement mesh. Paths toward one destination exhibited a higher mean round-trip time of 470.96 ms but lower packet loss of 0.36%. In contrast, paths toward the second destination offered a lower mean RTT of 404.97 ms at the cost of higher packet loss (0.53%). These differences highlight the heterogeneity of path quality even within the same SCIONLab deployment and underscore the value of multi-objective optimization in path recommendation benchmarks, where no single path is optimal across all metrics simultaneously.
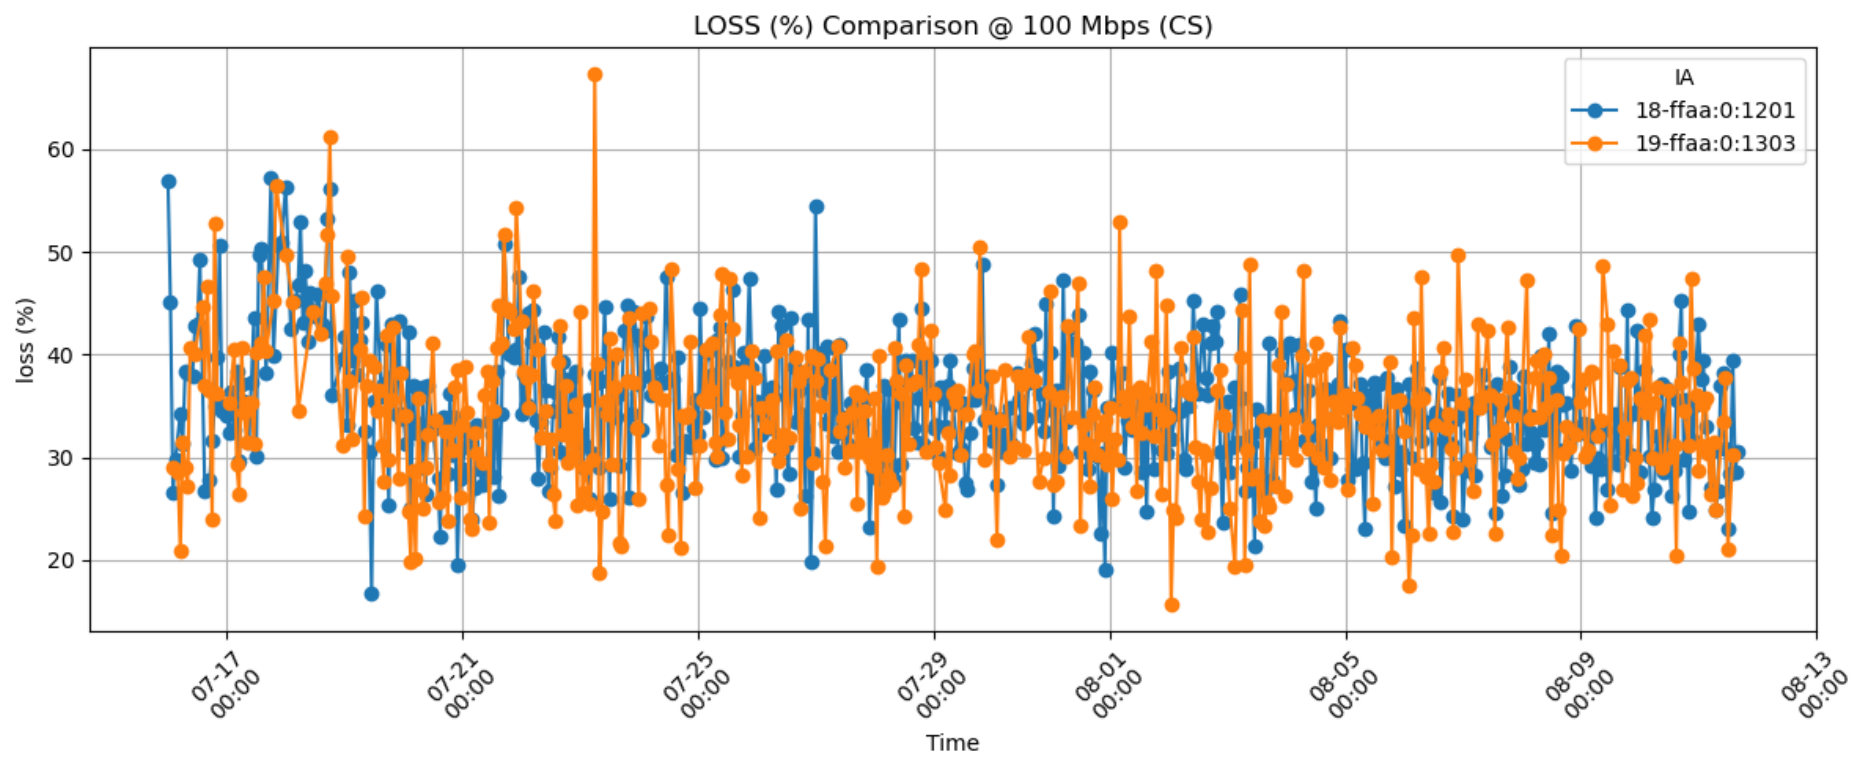
Active bandwidth measurements using the scion bwtestclient tool at the 100 Mbps tier exposed a persistent directional asymmetry in throughput and reliability. Downstream (server-to-client) traffic achieved consistently high utilization, with an average achieved throughput of 87.09 Mbps and negligible loss. In contrast, upstream (client-to-server) traffic was severely constrained, with average throughput dropping to 65.4 Mbps and extremely high, volatile packet loss averaging 34.6%. This directional bottleneck, visible across multiple load tiers, points to systemic constraints or restrictive forwarding policies within the testbed infrastructure during the measurement period. The upstream loss behavior is further detailed in Figure 3.

4. Benchmark Applications: ML Tasks and Baselines

Path-aware networking introduces new opportunities for data-driven decision making at the endpoints, including performance prediction, proactive rerouting, and path selection under application-specific objectives. However, the lack of publicly available longitudinal datasets capturing path-level dynamics in live path-aware networks has hindered the development and evaluation of machine learning methods in this domain. Using the ScionPathML dataset, this section demonstrates the utility of such measurements by defining four benchmark tasks that reflect core operational problems in path-aware networking. We establish reproducible baselines using lightweight methods to show that the collected data contains exploitable temporal and structural patterns suitable for learning-based control. These baselines also provide a standardized reference point for future research. We operationalize the dataset for tasks spanning performance prediction, failure anticipation, multi-objective path recommendation, and anomaly detection. More expressive approaches, including deep learning and reinforcement learning methods, are left as directions for subsequent work.

4.1. Data Preprocessing and Evaluation Protocol

This subsection describes the data preparation, feature engineering, temporal splitting strategy, and leakage-prevention measures used to produce the reported baseline results. The full measurement dataset and all benchmark code are publicly released to support reproducibility (see Section 7).
Records from the released CSV tables are joined using a stable path_fingerprint (a deterministic hash of the AS-level hop sequence and SCION interface identifiers) together with the UTC timestamp. No statistical imputation is performed. Explicit status flags for missing measurements, timeouts, and failed probes are retained as distinct categories. For supervised tasks, only intervals containing both complete path discovery and valid probe results are used.
Feature construction follows standard causal time-series practices. For performance forecasting and failure prediction, each feature vector includes lagged values, first-order differences, and rolling statistics computed over multiple historical window sizes. All temporal features are generated using exclusively past observations. For anomaly detection, we use rolling statistics of end-to-end performance metrics combined with summarized per-hop latency vectors derived from traceroute. When normalization is applied, the scaling parameters are fitted exclusively on the training data.
Because the measurements form a temporal sequence, dataset partitioning is performed chronologically. The first 70% of intervals are used for training, the following 15% for validation, and the final 15% as a held-out test set. Results for stochastic models are averaged over five random seeds. In addition, robustness across different split points is assessed using five-fold purged time-series cross-validation with an embargo period.
Several measures are taken to prevent data leakage. All features are computed using only information available up to the current time step. Target values are always strictly future relative to the feature window. Validation and test data are never used during feature engineering, normalization, or model training. For the unsupervised anomaly detection task, synthetic anomalies are injected only after the train/validation split has been fixed.
This preprocessing and evaluation protocol is applied uniformly across all benchmark tasks.

4.2. Task 1: Path Performance Prediction

The objective of this task is to predict near-future end-to-end performance metrics (RTT and bandwidth) from recent history to support proactive path selection and optimization. We employ time-series forecasting using a sliding window of N = 12 timesteps to predict the metric at T + 1 . For evaluation, we use Mean Absolute Error (MAE), reported in the original units (ms for RTT, Mbps for bandwidth).
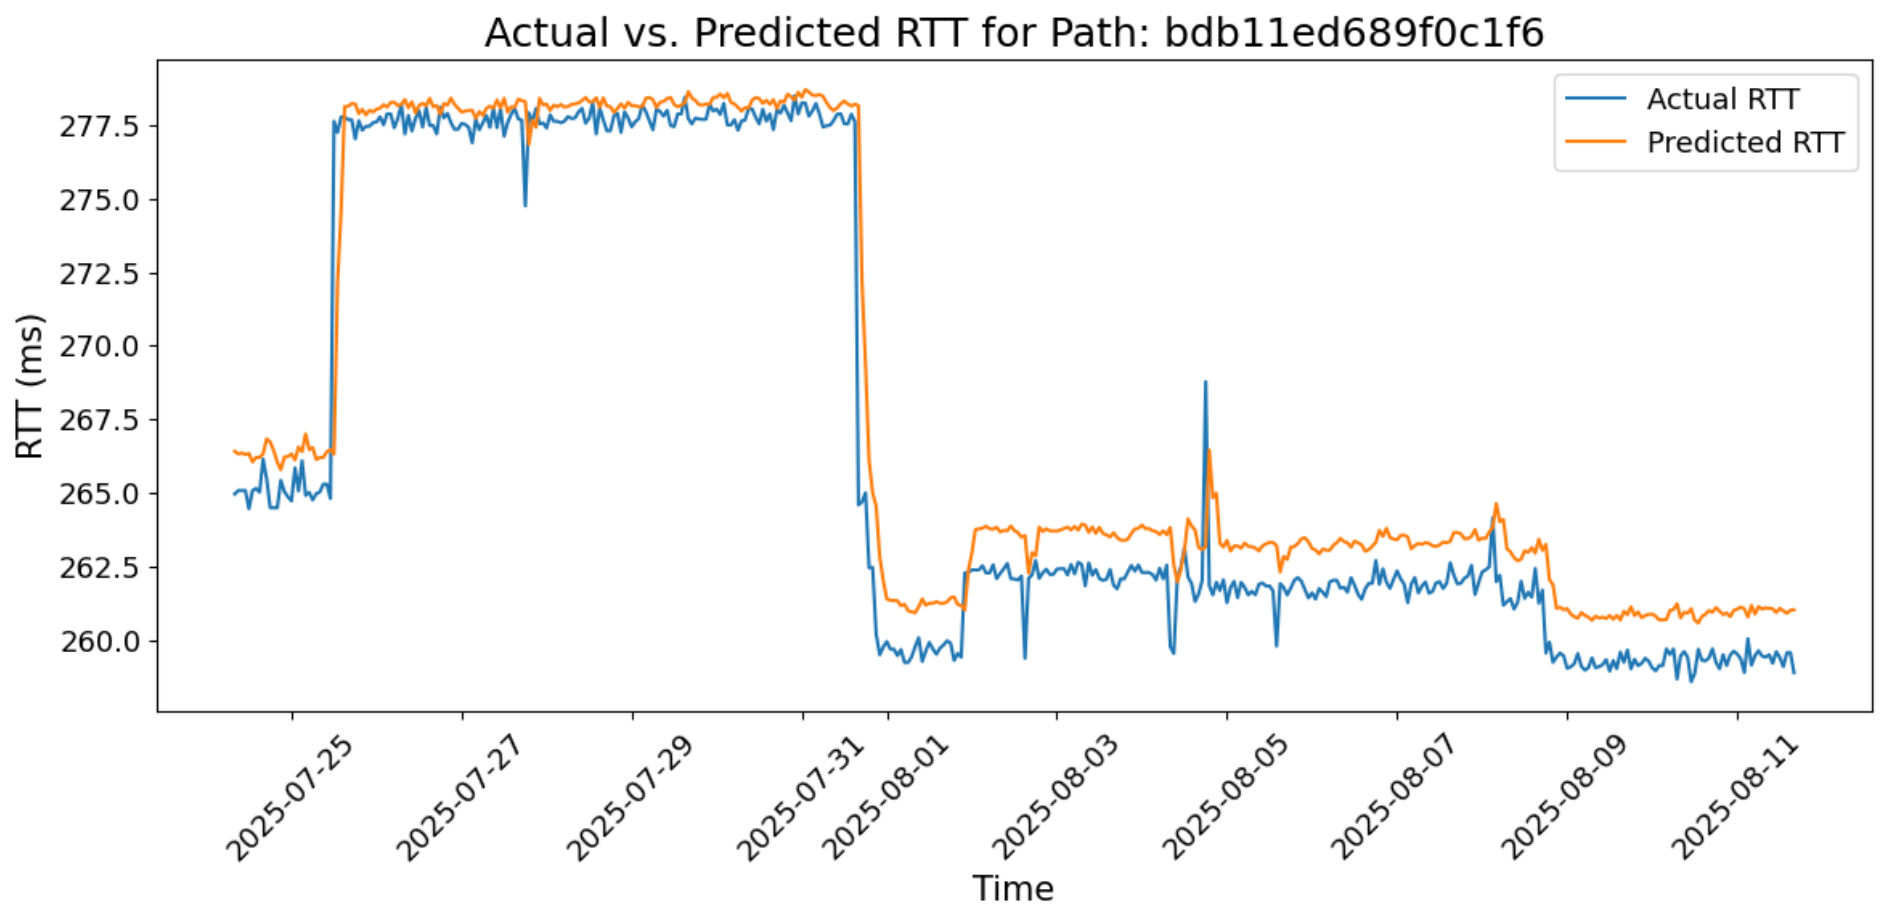
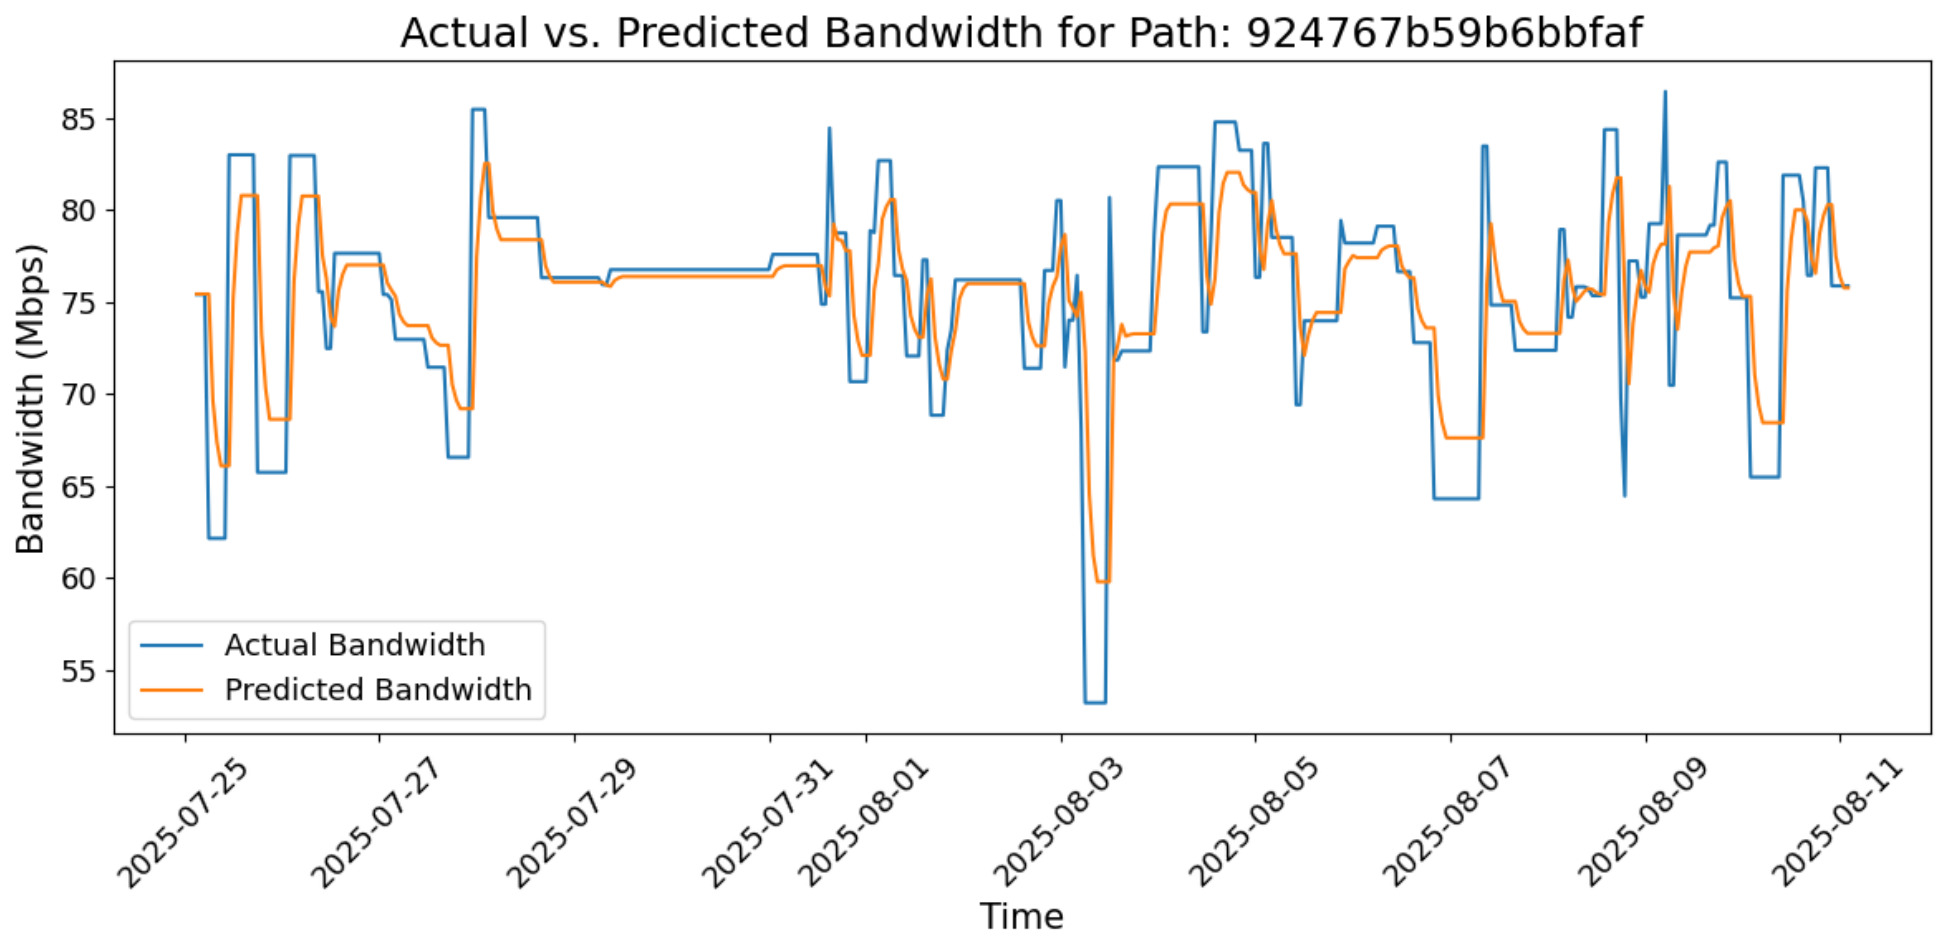
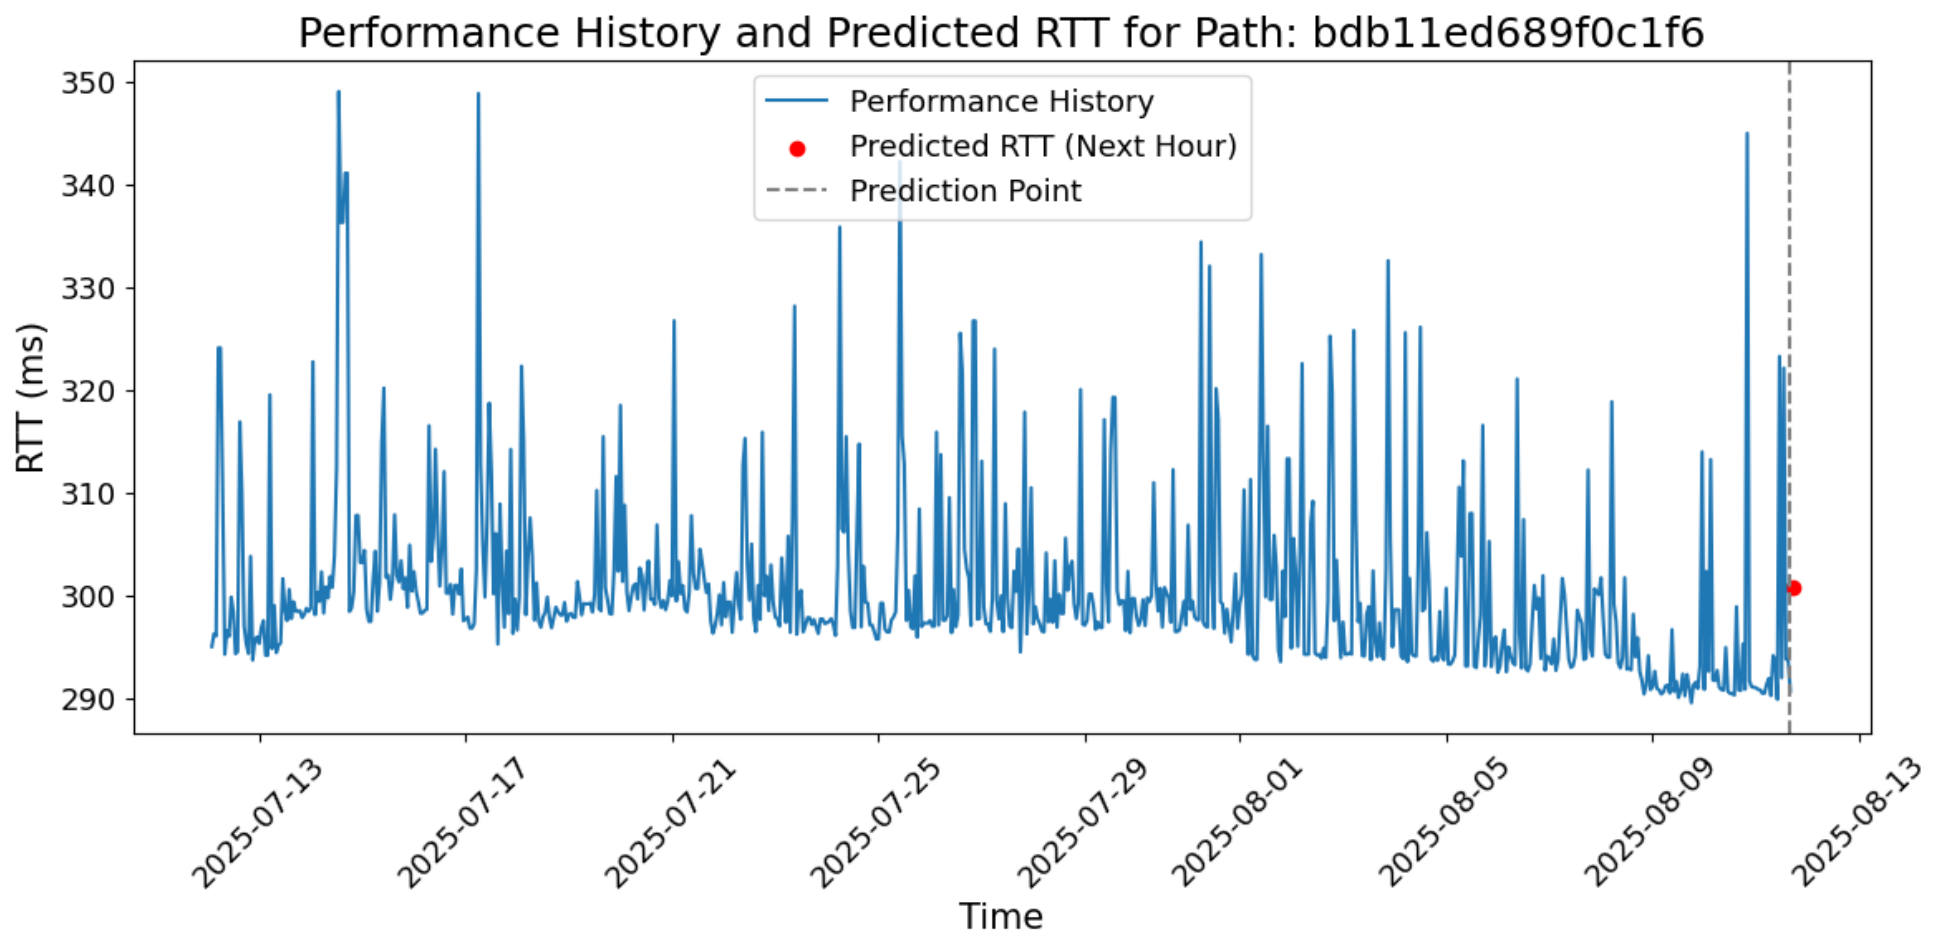
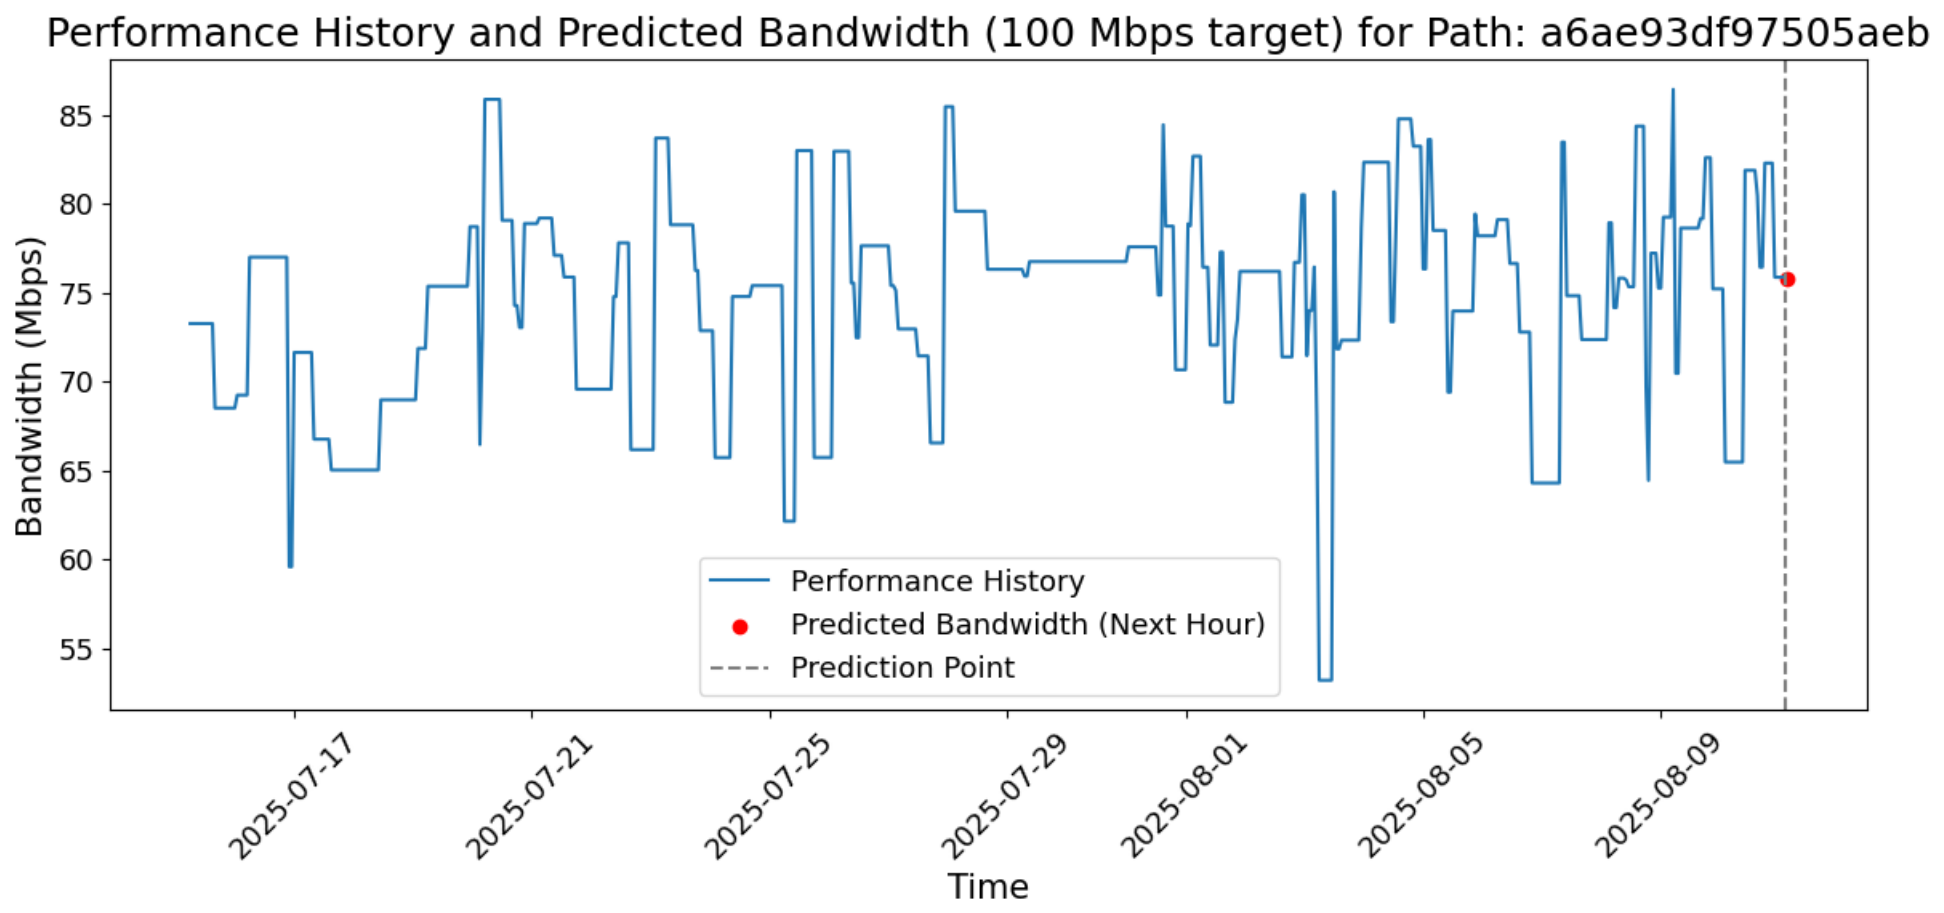
As shown in Table 3, a linear regression baseline achieved an MAE of 1.30 ms for RTT and 2.43 Mbps for bandwidth. These results indicate that short-horizon latency and throughput exhibit measurable predictability in this SCIONLab setting. Figure 4 and Figure 5 provide examples of current predictions for RTT and bandwidth, respectively. We also generate next-hour forecasts (Figure 6 and Figure 7) to illustrate how short-term prediction can support proactive monitoring and planning.
To assess the robustness of the Task 1 results, we re-evaluated the Linear Regression models under all combinations of temporal train/test splits (70/30, 75/25, and 80/20) and history window sizes (N = 6, N = 12, and N = 24). The test-set MAE values for each configuration are reported in Table 4. For RTT prediction, the MAE remained in the narrow range 3.24–3.36 ms. For bandwidth prediction on 100 Mbps targets, the MAE remained in the range 37.73–37.99 Mbps. In both cases, the maximum deviation across the nine configurations was smaller than 4% relative to the median, indicating that the reported baseline performance is insensitive to the precise choice of temporal split ratio or history length within the tested ranges.
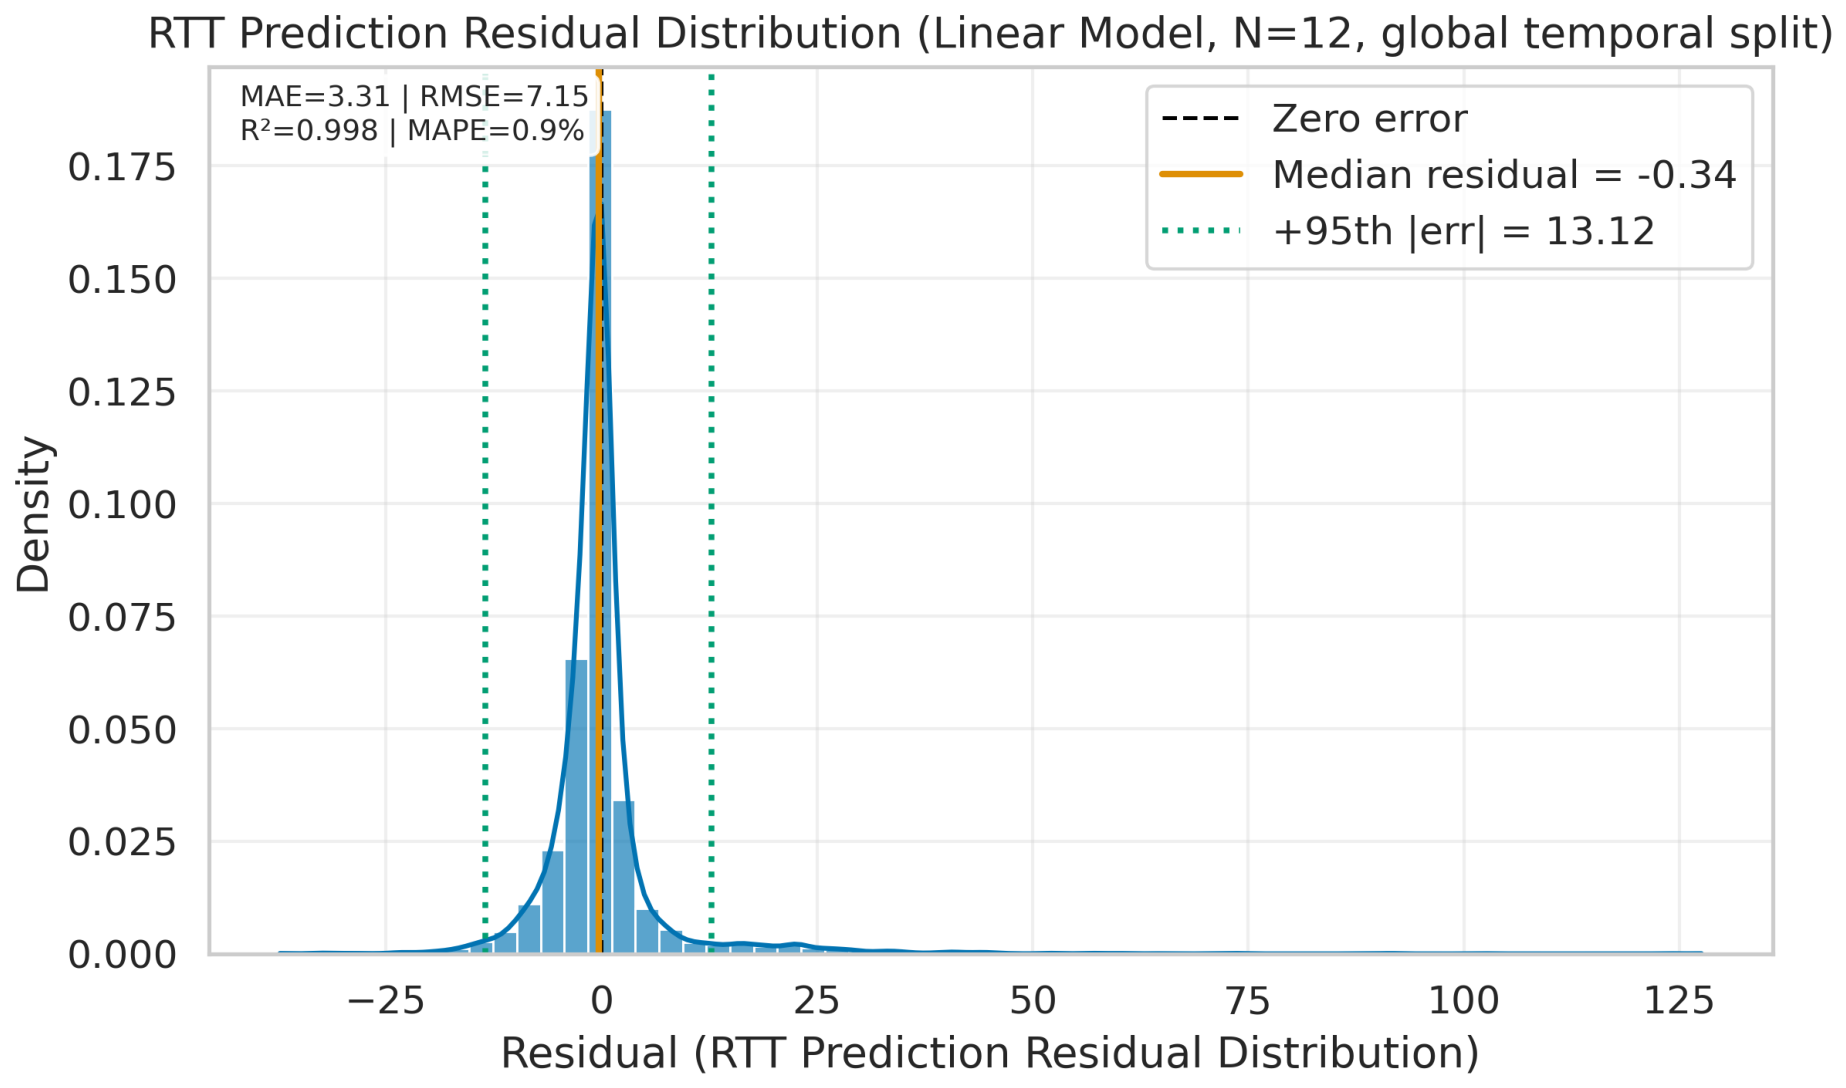
To better understand model behavior, we analyze the distribution of prediction errors and variability across individual paths. Figure 8 shows the residual distribution for RTT predictions on the full test set. The linear regression baseline achieves a strong fit overall ( R 2 = 0.998 , MAPE = 0.9%), with the majority of residuals tightly concentrated around zero. However, the distribution exhibits a noticeable right tail, indicating that while most predictions are accurate, occasional larger under-predictions occur.
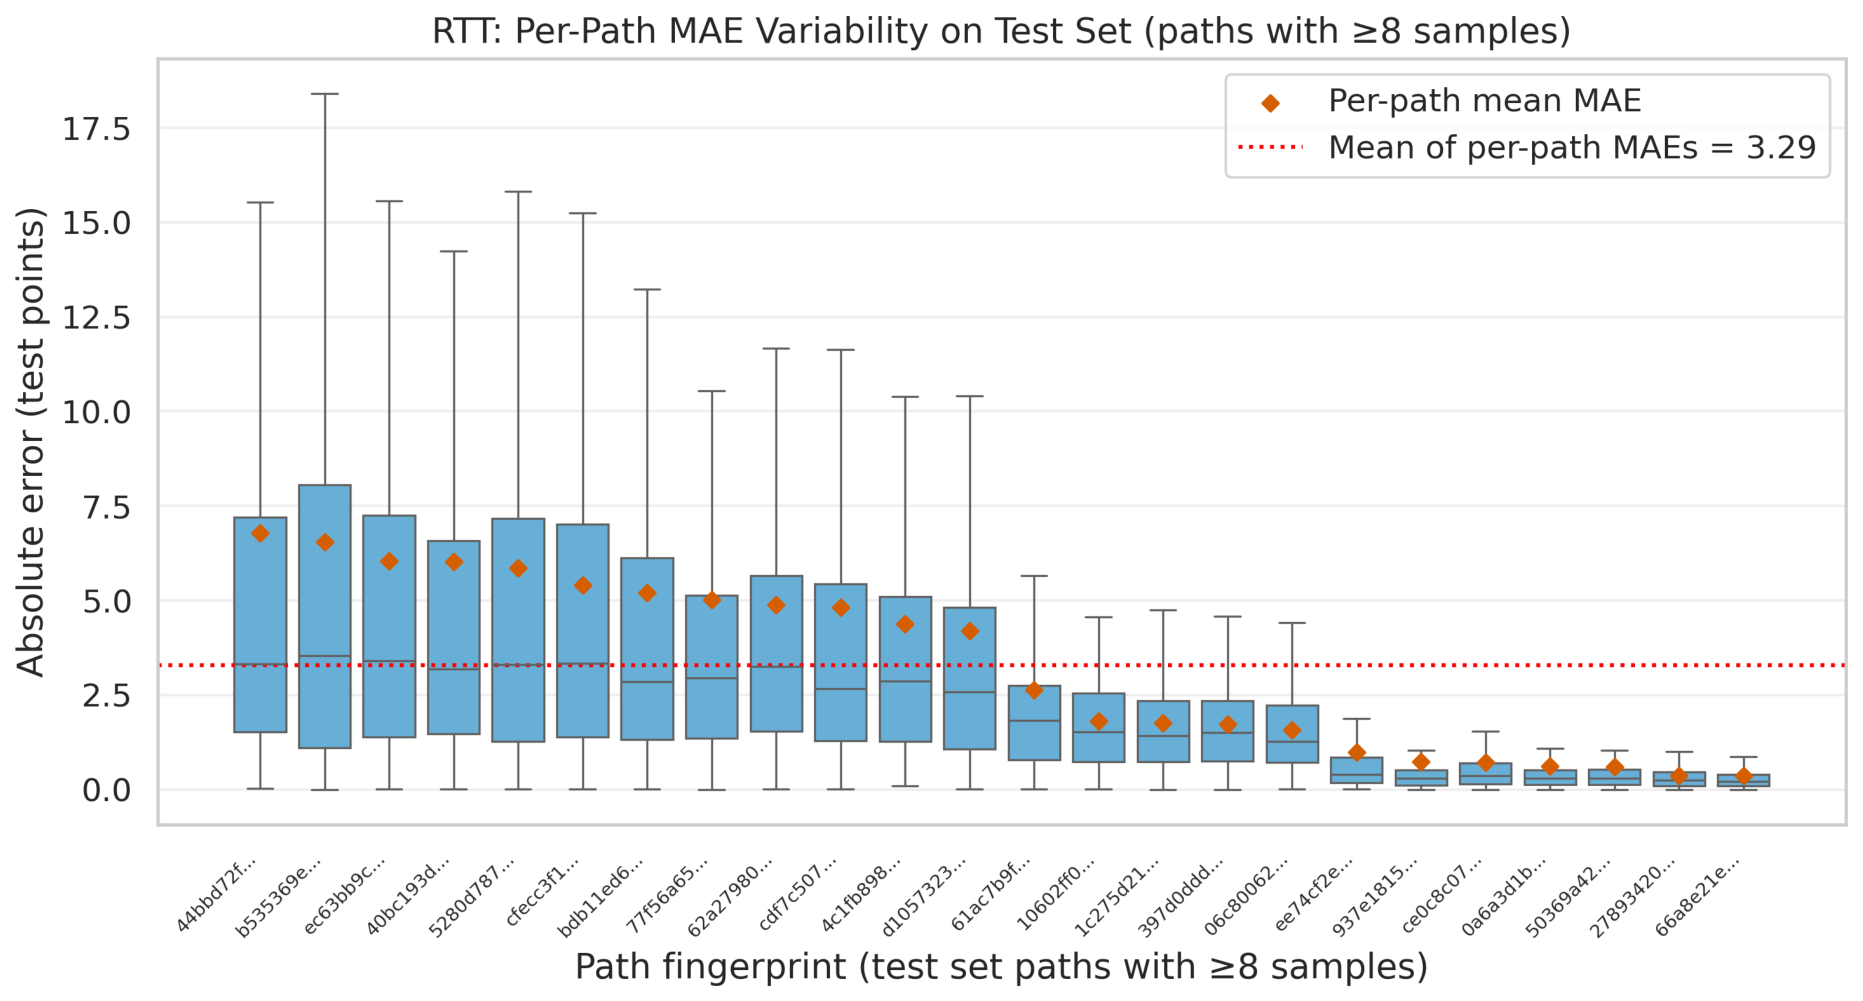
Figure 9 further reveals substantial heterogeneity in predictability across different paths. Some paths are highly forecastable (median per-path MAE below 1 ms), while others exhibit significantly higher error and variance. This path-dependent predictability suggests that future work could benefit from path-specific or context-aware models rather than a single global predictor.

4.3. Task 2: Path Failure Prediction

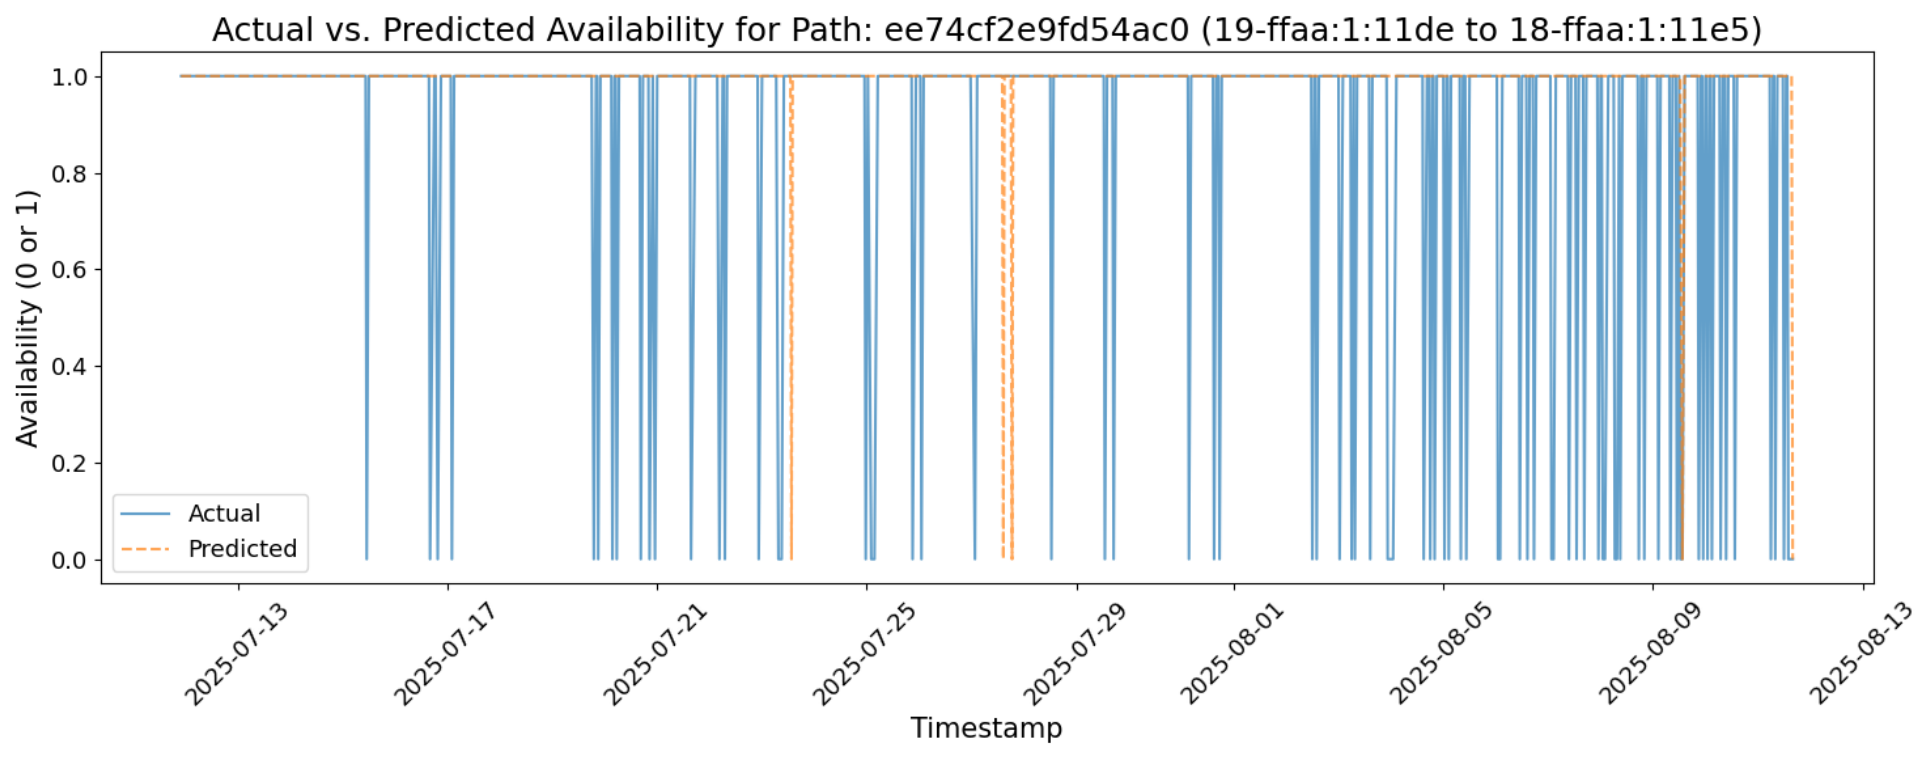
This task forecasts whether a path will become unavailable in the next interval to enable proactive rerouting and improve reliability in path-aware networks. We formulate the problem as a binary classification task using the last 12 timesteps of RTT, jitter, loss, and bandwidth, augmented with lagged and delta features, to predict path availability at T + 1 . Due to the natural imbalance between available and unavailable paths, we adopt ROC-AUC as the primary evaluation metric.
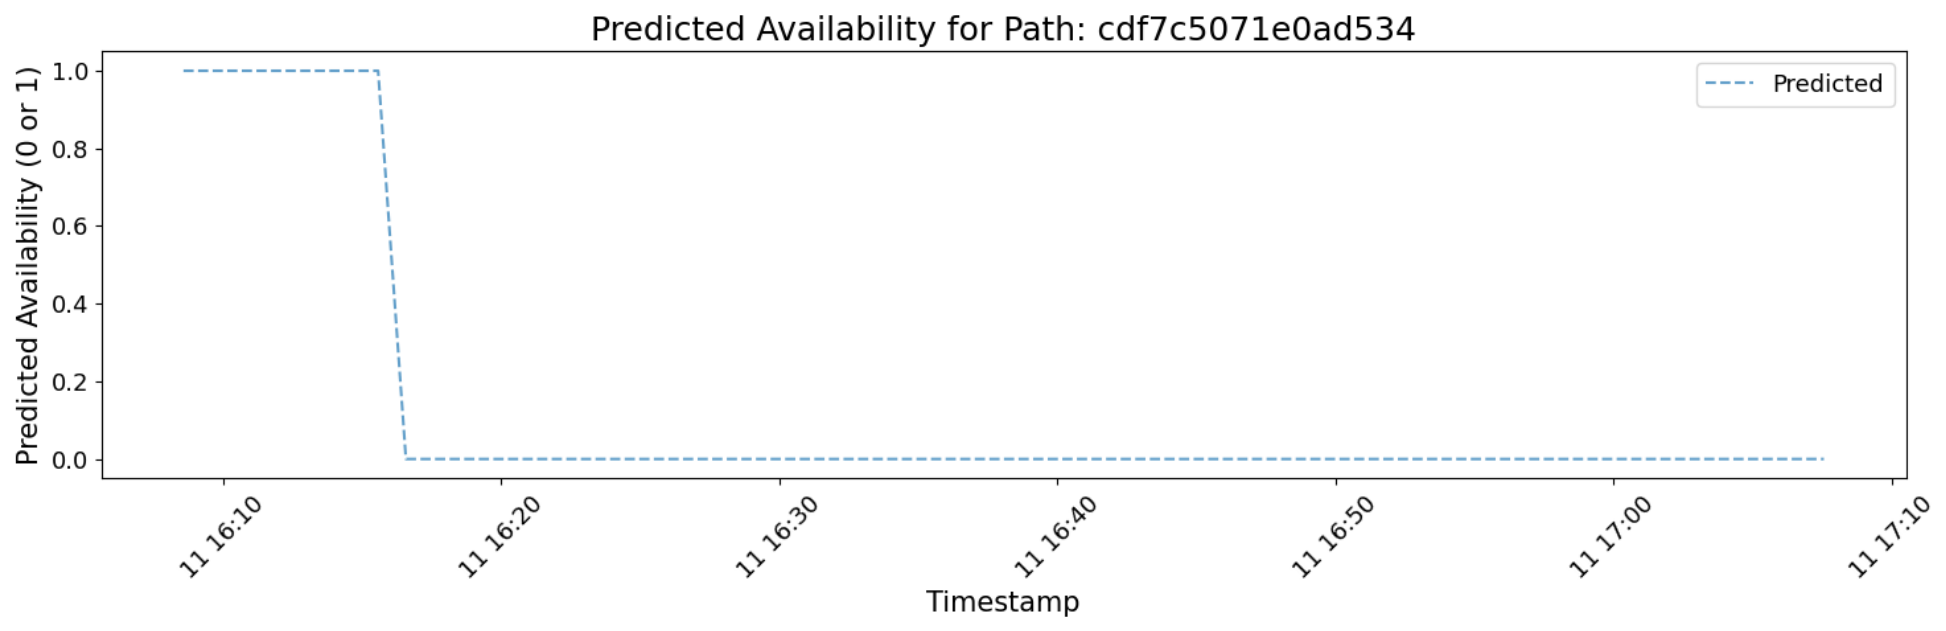
Our Random Forest baseline achieved an ROC-AUC of 0.94 (Table 5), indicating a strong discriminative ability for anticipating near-term unavailability in this dataset. Visual examples of current and next-hour availability forecasts are provided in Figure 10 and Figure 11.

4.4. Task 3: Malicious Path/Anomaly Detection

The objective of this task is to identify paths exhibiting statistically unusual behavior that may indicate operational anomalies, misconfigurations, or potential security-relevant deviations in a path-aware network. We apply unsupervised anomaly detection using an Isolation Forest trained on a rich set of features derived from the longitudinal measurements. These features include rolling-window averages of round-trip time, packet loss, and bandwidth, as well as per-hop latency vectors obtained from traceroute data. To enable quantitative evaluation, synthetic anomalies are injected into the test set (approximately 5% of samples) to create ground-truth labels. The Isolation Forest is trained exclusively on normal data and then used to score the anomalous test set. Performance is measured using the area under the ROC curve (AUC-ROC).
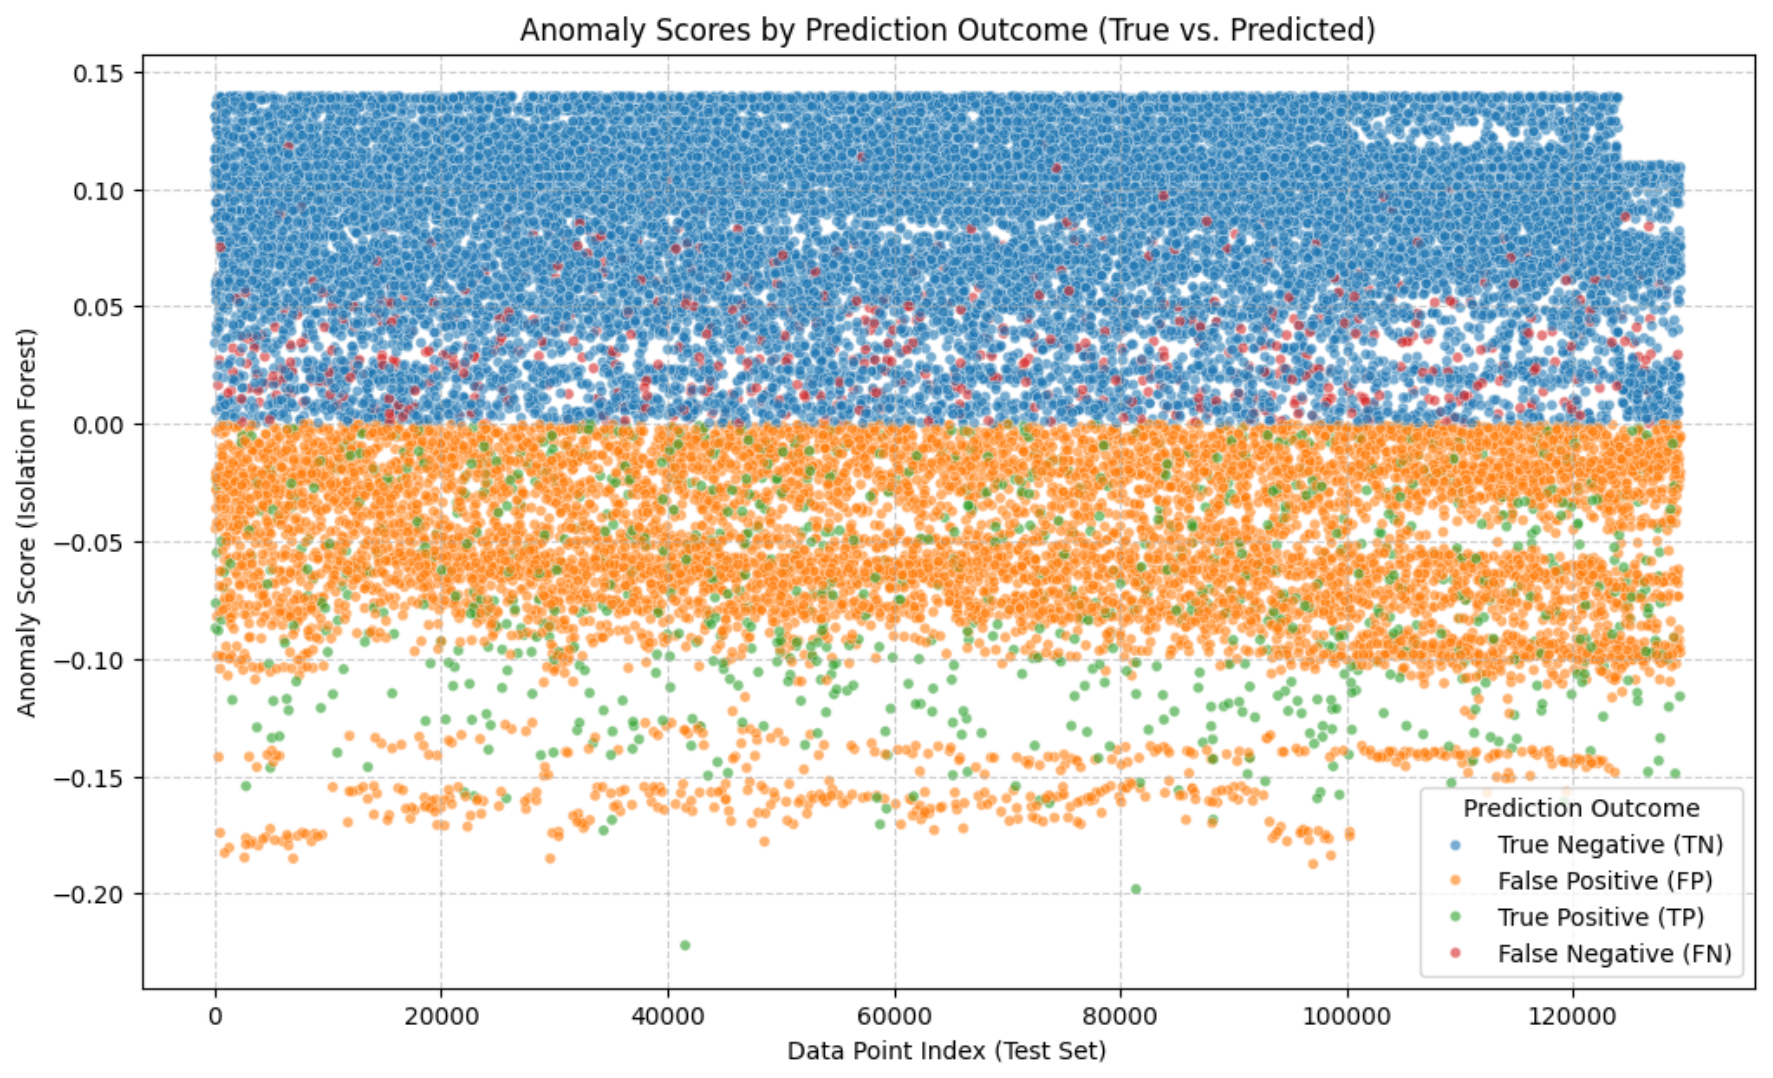
The Isolation Forest baseline achieves an AUC-ROC of 0.77 (Table 6), indicating a moderate but meaningful capability to separate injected anomalies from typical path variability. Figure 12 shows the distribution of anomaly scores along with a breakdown of prediction outcomes (True Positives, True Negatives, False Positives, and False Negatives). While many anomalies are correctly flagged, some overlap between anomalous and normal score distributions remains, reflecting the inherent variability of live SCION paths.

4.5. Task 4: Multi-Objective Path Recommendation

This task evaluates how effectively a multi-criteria heuristic can recommend paths that satisfy heterogeneous application Quality-of-Experience (QoE) requirements in a live path-aware network. Using the single-path performance and bandwidth-test tables from the released ScionPathML dataset, we merge records on stable path fingerprints and timestamps, then min–max normalize loss and bandwidth values (along with RTT where available) to the [0, 1] range. We treat path recommendation as a multi-criteria decision-making problem in which these normalized metrics are combined using a weighted scoring function to rank candidate paths. A recommendation is considered successful if the top-ranked path satisfies all three QoE thresholds defined for a given profile in Table 7.
The primary evaluation metric is the QoE Satisfaction Rate, defined as the fraction of measurement intervals in which the top-ranked path meets all three constraints of the target profile. Composite scores are computed using min–max-normalized metrics combined via weighted summation. We explore three weighting schemes—balanced (equal weights), speed-sensitive, and loss-tolerant—but report main results using the balanced profile, as it provides a representative baseline. The path with the highest composite score is selected as the recommendation and checked against the QoE thresholds in Table 7.
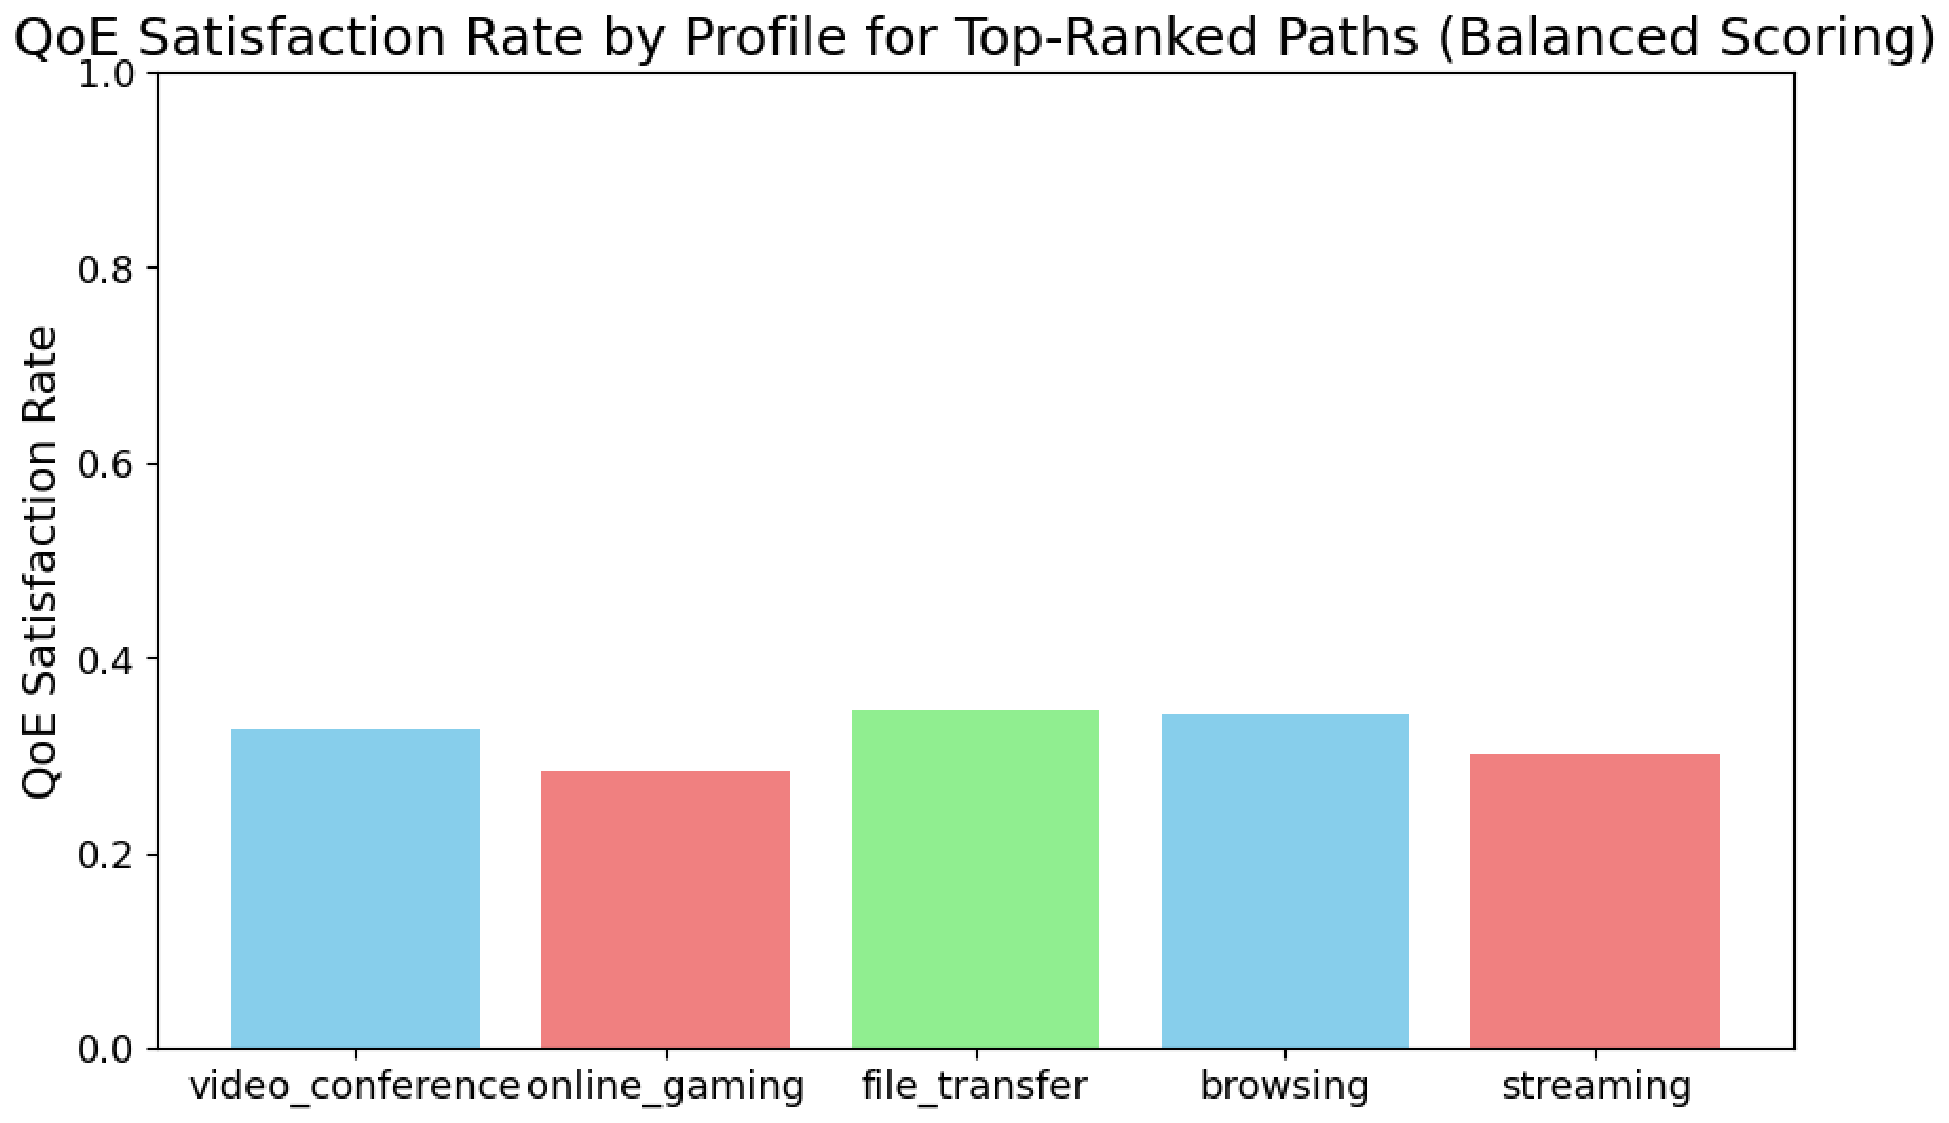
As shown in Table 8 and Figure 13, the static weighted-scoring baseline achieves satisfaction rates between 28% and 35% across the five profiles. These modest rates are a direct consequence of the path dynamics quantified in Section 3.3: a 9.8% churn rate, median path lifetimes of only 17 h, and substantial jitter (184.6 ± 36.3 ms). Moreover, the single-path versus concurrent-multipath measurements reveal that the very act of probing or using multiple paths can degrade the loss and jitter values that several QoE profiles attempt to optimize. Consequently, any static weighting quickly becomes outdated. The results therefore highlight the necessity of coupling path recommendation to the predictive models developed in Tasks 1–2 and of moving from static heuristics to adaptive, uncertainty-aware policies.
Analysis of the composite scores shows strong correlation across the different weighting schemes, confirming that the ranking is relatively robust to moderate changes in user preferences. Data quality flags (good vs. degraded) have a measurable impact on final scores, underscoring the value of the explicit missingness handling in the released dataset. Full preprocessing steps, weighting definitions, and additional visualizations are provided in the accompanying benchmark notebook.

5. Discussion, Limitations, and Future Work

The benchmark applications demonstrate that the longitudinal path-level measurements collected by ScionPathML provide a viable and exploitable signal for data-driven endpoint decision-making in path-aware networks. While the models we report are intentionally simple baselines, the results yield two primary insights. First, core operational questions, such as short-horizon performance forecasting and path failure prediction, exhibit measurable temporal structure: a linear regression baseline achieves a mean absolute error of only 1.31 ms for RTT and 2.47 Mbps for bandwidth, while a Random Forest classifier reaches an ROC-AUC of 0.938 for anticipating near-term unavailability. Second, more complex tasks such as multi-objective path recommendation remain substantially harder, with static weighted-scoring heuristics satisfying heterogeneous QoE profiles in only 28–35% of measurement intervals.
These results can be understood by examining each benchmark task in turn. In Task 1, the low MAE values indicate that both RTT and bandwidth exhibit clear short-term autocorrelation at the 30 min granularity of our measurements, making lightweight time-series forecasting practical for proactive path selection and optimization. Task 2 further demonstrates that degradations in latency, jitter, loss, and throughput frequently precede control-plane path disappearance, enabling early-warning rerouting mechanisms with strong discriminative power (ROC-AUC 0.938). In contrast, Task 3 yields only moderate performance because the natural heavy-tailed variability of live SCION paths produces transient spikes that overlap with synthetically injected anomalies, underscoring the inherent difficulty of unsupervised detection without additional topological or cross-path context. Finally, Task 4 shows that static weighted-scoring heuristics are rapidly outdated by the quantified control-plane churn (9.8% rate) and by the performance degradation introduced when multiple paths are probed concurrently, confirming that effective multi-objective recommendation must be tightly coupled to the predictive models developed in Tasks 1 and 2.
While these results establish a solid baseline for SCION-based machine learning, several limitations of the present study must be acknowledged. First, the measurement campaign was conducted exclusively on the SCIONLab research testbed using four vantage points over a 27-day stable window and Google Cloud e2-medium shared-core virtual machines. Consequently, some observed phenomena, most notably the persistent directional upstream/downstream bandwidth asymmetry and the precise churn statistics, may be specific to the testbed infrastructure or transient conditions rather than general properties of the SCION architecture. Second, host-level timing variability inherent to shared-core instances could have contributed to the measured end-to-end jitter and short-term predictability. Although we applied repeated sampling, averaging, and conservative probe rates, we did not conduct a dedicated sensitivity analysis quantifying the impact of this noise on forecasting accuracy. Third, while our current baseline benchmarks are validated using multi-seed averaging and purged time-series cross-validation to ensure local statistical stability, the evaluation is bounded by a four-week trace. Future work will expand this to evaluate long-term macro-level network concept drift over several months. Fourth, the anomaly detection task relies on synthetically injected anomalies (approximately 5% of samples), which tend to create cleaner decision boundaries than the subtle or distributed anomalies that occur in operational networks. Finally, our evaluation is restricted to lightweight baseline models. The effectiveness of more expressive approaches, such as deep time-series architectures, graph neural networks, or reinforcement-learning controllers on the released dataset, remains an open question.
Future work can proceed along several concrete directions. From a measurement standpoint, extending campaigns to longer time horizons, larger numbers of vantage points (including production SCION autonomous systems), and dedicated-core instances would enhance representativeness and enable richer analyses of cross-path correlations, diurnal patterns, and rare events. From a modeling perspective, the released dataset and benchmark code are specifically designed to support more expressive approaches, including transformer-based time-series models, graph neural networks that leverage stable path topology, and reinforcement learning agents capable of uncertainty-aware, multi-objective path selection, particularly to improve upon the modest satisfaction rates observed in Task 4. Additional high-value extensions include replacing synthetic anomaly injections with real operational labels, developing online and concept-drift-aware predictors, integrating path-performance signals with transport-layer protocols such as MPQUIC over SCION, and investigating security implications of ML-driven path selection under adversarial conditions.


6. Conclusions

Path-aware architectures such as SCION expose multiple explicit inter-domain paths to endpoints, creating new opportunities for performance-aware and policy-aware communication, but also raising practical questions about how path availability and quality evolve over time and how endpoints should make decisions under uncertainty. In this paper, we presented ScionPathML, a reproducible measurement pipeline that automates SCION path discovery and probing and exports longitudinal path-performance measurements in analysis- and ML-ready formats. Using ScionPathML, we conducted a four-week, multi-region SCIONLab measurement campaign and released the resulting dataset to support empirical study of path dynamics and reproducible evaluation.
To demonstrate how such longitudinal measurements can be used in practice, we defined a suite of benchmark applications that reflect common decision problems in path-aware networking. Across four tasks (short-horizon performance prediction, failure prediction, anomaly detection, and multi-objective path recommendation), we reported simple baseline models and the corresponding results. These baselines serve as reference points and a standardized starting line for future work.
It is important to note that these results were obtained on the SCIONLab research testbed using four vantage points over a 27-day stable observation window (following an initial stabilization period). As discussed in Section 5, the observed churn rates, performance variability, directional bandwidth asymmetry, and baseline model accuracies reflect the specific conditions of this deployment, including the use of shared-core Google Cloud e2-medium instances. While the benchmarks demonstrate that longitudinal path-level measurements from SCION contain exploitable temporal structure for tasks, such as short-term forecasting and failure prediction, the findings should be interpreted within the scope of this relatively small-scale and limited-duration study. Broader validation on larger deployments, longer time horizons, and diverse traffic conditions remains necessary.
Together, the dataset, benchmark definitions, and baseline implementations provide a reproducible foundation and lower the barrier to entry for researchers working on machine learning for path-aware networking. We hope the public release of the ScionPathML tooling, the curated dataset, and the benchmark code will enable the community to extend this initial study, develop more advanced models, and conduct larger-scale investigations.
7. Tool and Dataset Availability

The instrumentation, ScionPathML, is an open-source Python (≥ 3.8) library designed to help researchers collect longitudinal path-performance data from SCIONLab. It automates SCION path discovery and probing, standardizes measurement metadata (e.g., timestamps, source/destination identifiers, and path fingerprints), and exports results in analysis- and ML-ready formats (JSON and CSV), thereby reducing the engineering overhead required to run consistent measurement campaigns.
The dataset collected with ScionPathML during our four-week SCIONLab campaign is also publicly available. It contains time-indexed path discovery snapshots and per-path performance measurements (e.g., RTT, loss, bandwidth, and traceroute-derived hop information), along with the standardized metadata needed to reproduce preprocessing and downstream analyses. Finally, we provide the scripts used to instantiate the benchmark applications and baseline models reported in this paper.
The following resources are available online:

Author Contributions

Conceptualization, S.K.; Methodology, S.K.; Software, D.R.; Validation, S.K. and Y.S.; Formal analysis, S.K. and Y.S.; Investigation, D.R. and S.K.; Resources, S.K.; Data curation, D.R. and S.K.; Writing—original draft, S.K.; Writing—review and editing, S.K. and Y.S.; Visualization, D.R.; Supervision, S.K.; Project administration, S.K.; Funding acquisition, S.K. and Y.S. All authors have read and agreed to the published version of the manuscript.

Funding

This work was supported by the Natural Sciences and Engineering Research Council of Canada (NSERC) under grant number RGPIN-2023-05343. The student was also supported through the Mitacs Globalink Research Internship (GRI) program.

Data Availability Statement

All data and code supporting the results of this study are publicly available at https://github.com/Keshvadi/mpquic-on-scion-ipc/tree/ScionPathML (accessed on 11 February 2026).

Conflicts of Interest

The authors declare no conflicts of interest.

References

  1. Butler, K.; Farley, T.R.; McDaniel, P.; Rexford, J. A Survey of BGP Security Issues and Solutions. Proc. IEEE 2010, 98, 100–122. [Google Scholar] [CrossRef]
  2. Trammell, B. Current Open Questions in Path-Aware Networking. In RFC 9217; IRTF: Zurich, Switzerland, 2022. [Google Scholar] [CrossRef]
  3. Trammell, B.; Smith, J.P.; Perrig, A. Adding Path Awareness to the Internet Architecture. IEEE Internet Comput. 2018, 22, 96–102. [Google Scholar] [CrossRef]
  4. Krähenbühl, C.; Tabaeiaghdaei, S.; Gloor, C.; Kwon, J.; Perrig, A.; Hausheer, D.; Roos, D. Deployment and Scalability of an Inter-Domain Multi-Path Routing Infrastructure. In Proceedings of the 17th International Conference on Emerging Networking EXperiments and Technologies (CoNEXT ’21), Virtual, 7–10 December 2021; pp. 1–15. [Google Scholar] [CrossRef]
  5. Boutaba, R.; Salahuddin, M.A.; Limam, N.; Ayoubi, S.; Shahriar, N.; Estrada-Solano, F.; Caicedo, O.M. A comprehensive survey on machine learning for networking: Evolution, applications and research opportunities. J. Internet Serv. Appl. 2018, 9, 16. [Google Scholar] [CrossRef]
  6. Bajpai, V.; Eravuchira, S.J.; Schönwälder, J. Lessons Learned from Using the RIPE Atlas Platform for Measurement Research. ACM SIGCOMM Comput. Commun. Rev. 2015, 45, 35–42. [Google Scholar] [CrossRef]
  7. Holterbach, T.; Pelsser, C.; Bush, R.; Vanbever, L. Quantifying Interference between Measurements on the RIPE Atlas Platform. In Proceedings of the 2015 Internet Measurement Conference (IMC), Tokyo, Japan, 28–30 October 2015; ACM: New York, NY, USA, 2015; pp. 437–443. [Google Scholar] [CrossRef]
  8. Alfroy, T.; Holterbach, T.; Krenc, T.; Claffy, K.; Pelsser, C. The Next Generation of BGP Data Collection Platforms. In Proceedings of the ACM SIGCOMM 2024 Conference, Sydney, Australia, 4–8 August 2024. [Google Scholar] [CrossRef]
  9. Zhang, X.; Hsiao, H.C.; Hasker, G.; Chan, H.; Perrig, A.; Andersen, D.G. SCION: Scalability, Control, and Isolation on Next-Generation Networks. In Proceedings of the IEEE Symposium on Security and Privacy (SP), Oakland, CA, USA, 22–25 May 2011; pp. 212–227. [Google Scholar] [CrossRef]
  10. Barrera, D.; Chuat, L.; Perrig, A.; Reischuk, R.M.; Szalachowski, P. The SCION Internet Architecture. Commun. ACM 2017, 60, 56–65. [Google Scholar] [CrossRef]
  11. Wirz, F.; Gartner, M.; van Bommel, J.; Moghadam, E.E.; Cimaszewski, G.H.; He, A.; Zhang, Y.; Birge-Lee, H.; Kottmann, F.; Krähenbühl, C.; et al. Scaling SCIERA: A Journey Through the Deployment of a Next-Generation Network. In Proceedings of the ACM SIGCOMM 2025 Conference (SIGCOMM ’25), Coimbra, Portugal, 8–11 September 2025; pp. 720–741. [Google Scholar] [CrossRef]
  12. Kwon, J.; García-Pardo, J.A.; Legner, M.; Wirz, F.; Frei, M.; Hausheer, D.; Perrig, A. SCIONLAB: A Next-Generation Internet Testbed. In Proceedings of the 2020 IEEE 28th International Conference on Network Protocols (ICNP), Madrid, Spain, 13–16 October 2020; IEEE: Piscataway, NJ, USA, 2020. [Google Scholar] [CrossRef]
  13. SCIONLab Documentation Team. SCIONLab Tutorials and Documentation. 2026. Available online: https://docs.scionlab.org/ (accessed on 11 February 2026).
  14. SCIONLab Documentation Team. Bandwidth Tester Application; SCIONLab Documentation. 2023. Available online: https://docs.scionlab.org/content/apps/bwtester.html (accessed on 11 February 2026).
  15. netsec-ethz/scion-apps. Bwtester README (Protocol, Parameters, and Server Behavior). 2026. Available online: https://github.com/netsec-ethz/scion-apps/blob/master/bwtester/README.md (accessed on 11 February 2026).
  16. Rossi, D.; Keshvadi, S. ScionPathML. 2025. Available online: https://github.com/keshvadi/ScionPathML/tree/ScionPathML (accessed on 11 February 2026).
Figure 1. Path churn observed during the ScionPathML data collection campaign. The plot shows the number of paths added (positive) and removed (negative) between a representative vantage point and its two target destinations in each 30 min interval.
Telecom 07 00081 g001
Figure 2. Distribution of path lifetimes (right-skewed, median ≈ 17 h).
Telecom 07 00081 g002
Figure 3. Upstream packet loss at 100 Mbps tier (persistent directional bottleneck).
Telecom 07 00081 g003
Figure 4. Current RTT prediction example for path fingerprint bdb11ed689f0c1f6.
Telecom 07 00081 g004
Figure 5. Current bandwidth prediction example for path fingerprint 924767b59b6bbfaf.
Telecom 07 00081 g005
Figure 6. Next-hour RTT forecast example for path fingerprint bdb11ed689f0c1f6.
Telecom 07 00081 g006
Figure 7. Next-hour bandwidth forecast example for path fingerprint 924767b59b6bbfaf.
Telecom 07 00081 g007
Figure 8. Distribution of RTT prediction residuals on the held-out test set using the linear regression baseline with a history window of N = 12 .
Telecom 07 00081 g008
Figure 9. Per-path RTT prediction error variability across paths with at least 8 test samples. While many paths exhibit low and stable prediction error, a subset of paths shows substantially higher variability and mean absolute error. This heterogeneity highlights that short-term RTT predictability is path-dependent even within the same SCIONLab deployment.
Telecom 07 00081 g009
Figure 10. Predicted availability example for path fingerprint cdf7c5071e0ad534.
Telecom 07 00081 g010
Figure 11. Next-hour availability forecast example for path fingerprint cdf7c5071e0ad534.
Telecom 07 00081 g011
Figure 12. Anomaly detection scores by prediction outcome (injected anomalies).
Telecom 07 00081 g012
Figure 13. QoE satisfaction rates across the five profiles.
Telecom 07 00081 g013
Table 1. Metrics, tools, and recorded outputs.
MetricToolRecorded Outputs (Examples)
Path setscion showpathsPath fingerprints; hop sequence; timestamp
AvailabilityDerivedPresence in P s , d ( t ) ; churn events
RTT/loss/jitterscion pingRTT stats; loss rate; probe params
Bandwidthscion-bwtestclientAchieved throughput; tier; duration; server
Per-hop delayscion tracerouteHop list; per-hop RTT; timeouts
Table 2. Experimental parameters and measurement settings.
ParameterValue
Campaign DurationFour weeks (11 July–11 August 2025)
Measurement Interval30 min (via cron schedule)
Vantage Points (VPs)Four (EU, NA, CH, TW)
Ping Sample SizeUp to 15 paths per target
Multipath Set SizeThree paths (Primary, Secondary, Tertiary)
Bandwidth PathsMax 2 paths per destination
Retry Policy (r)Bounded with Exponential Backoff
Table 3. Baseline results for Task 1: Path performance prediction.
ModelMetricMeanStd. Dev.95% CI
Linear RegressionRTT (MAE, ms)1.310.04[1.24, 1.38]
Linear RegressionBandwidth (MAE, Mbps)2.470.06[2.35, 2.59]
Table 4. Robustness of Task 1 under different temporal splits and history window sizes (Linear Regression).
SplitN = 6N = 12N = 24
RTT MAE (ms)
70/303.293.253.24
75/253.363.323.28
80/203.353.313.31
Bandwidth MAE (Mbps) @ 100 Mbps target
70/3037.9637.8937.99
75/2537.9337.8537.91
80/2037.8737.7337.79
Table 5. Baseline results for Task 2: Path failure prediction.
ModelMean ROC-AUCStd. Dev.95% CI
Random Forest Classifier0.9380.009[0.921, 0.955]
Table 6. Baseline results for Task 3: Malicious Path/Anomaly Detection.
ModelAUC-ROC
Isolation Forest0.774846939561274
Table 7. QoE profiles used for path recommendation.
ProfileMax RTT (ms)Max Loss (%)Min Bandwidth (Mbps)
Video conference25070.3
Online gaming12040.1
File transfer800124
Browsing500100.03
Streaming40052
Table 8. Baseline results for Task 4: Multi-Objective Path Recommendation.
QoE ProfileQoE Satisfaction (%)
Video conference33
Online gaming28
File transfer35
Browsing34
Streaming30
Disclaimer/Publisher’s Note: The statements, opinions and data contained in all publications are solely those of the individual author(s) and contributor(s) and not of MDPI and/or the editor(s). MDPI and/or the editor(s) disclaim responsibility for any injury to people or property resulting from any ideas, methods, instructions or products referred to in the content.