Abstract
In densely populated areas, resource management is a challenge when mobile users in a session increase. The result of this is high inter-cell interference. Since interference is a function of power, we develop power control models aimed at addressing inter-cell interference among macrousers and femtousers in a 5G network. The models consider both cooperative and noncooperative game-theoretic theories. These are implemented within the framework of system dynamics. The models are developed using feedback loops and system dynamics approaches. The game-theoretic models are verified to establish a basis for developing mathematical models to implement power control in 5G networks. The comparative simulation demonstrates the superiority of cooperative game-theoretic power control in 5G NR in terms of signal-to-interference-plus-noise ratio (SINR), data rate, spectral efficiency (SE), and utility in interference-prone environments. While noncooperative strategies offer simplicity and lower signaling overhead, they result in poorer performance due to unmanaged interference and selfish resource utilization. The results demonstrate that the cooperative game-theoretic power control technique substantially enhanced network performance, achieving an average SINR improvement of 58.82% and an average SE improvement of 69.03%.
1. Introduction
The escalating demand for mobile data in densely populated urban environments is a primary driver for deploying dense heterogeneous 5G New Radio (NR) networks that integrate macrocells with femtocells [1,2,3]. While this densification increases capacity, it also exacerbates inter-cell interference, a phenomenon that severely degrades network throughput, quality of experience (QoE), and overall system reliability [4,5]. Since interference is intrinsically linked to transmitter power, developing sophisticated power control strategies is paramount for managing these complex network interactions [4,5,6].
Traditional static power allocation schemes are often inadequate for the dynamic conditions of real-world networks. Game theory has emerged as a powerful mathematical framework to model this challenge as it captures the strategic decision-making of multiple network entities (e.g., base stations) seeking to optimize their performance under shared interference constraints. However, previous studies in this domain have predominantly relied on iterative simulations in tools like MATLAB and NS-3.
This paper presents an innovative approach that integrates noncooperative and cooperative game-theoretic power control models within a system dynamics framework using VENSIM. This methodology offers a distinct advantage by enabling the analysis of feedback loops, accumulation effects, and long-term system-level emergent behaviors that are difficult to capture with traditional simulation alone. The contribution of this paper is twofold: (1) the development of a mathematical game-theoretic power control model formulated within a system dynamics framework, and (2) the implementation of a corresponding simulation model in VENSIM® PLE (version 10.2.2) [7] to analyze cooperative and noncooperative strategies for effective interference mitigation in 5G NR HetNets.
This paper aims to address the following core problem: how can we model and simulate dynamic power control mechanisms for interference management in 5G NR heterogeneous networks using both noncooperative and cooperative game-theoretic approaches within a system-level feedback-driven environment like VENSIM?
To achieve our overarching aim, this research will systematically follow a series of objectives designed for rigorous system dynamics modeling. The process begins with precisely defining the problem boundary and articulation. We will then proceed to identify the most important stocks and flows that influence the system’s state, along with the sources of information that impact those flows. This involves identifying the main feedback loops at play, which will inform the construction of a causal loop diagram linking all the identified stocks, flows, and information sources. Finally, we will transition to the quantitative phase by formulating the governing equations that determine the flows, estimating the necessary parameters and initial conditions, and ultimately simulating the resulting model to analyze the outcomes and derive actionable insights.
The design of the model will be conducted with the components and the relationship of the functioning of the 5G network design considerations in mind. Moreover, the limits and the relationship of the model are established within the context in which it will operate.
The significance of this paper is to develop a model that will generate new knowledge through the application of computational algorithms and prototypes. The generated knowledge, when applied, can be used to solve interference challenges. Furthermore, this will improve existing systems and create novel solutions and/or models [8].
The allocation of resources involves decision-making to select the node when forwarding packets to less congested nodes. In this study, a system dynamics approach is proposed for the allocation of network resources in a 5G ecosystem using game theory. While a variety of descriptions of the term ‘system dynamics’ have been suggested, this paper will use the descriptions suggested by the authors in [9], who describe it as follows: “System dynamics deals with the time-dependent behavior of managed systems with the aim of describing the system and understanding, through qualitative and quantitative models, how information feedback governs its behavior, and designing robust information feedback structures and control policies through simulation and optimization.”
The VENSIM® PLE (version 10.2.2) software is proposed to build the model. A model, using game theory, will be developed within the framework of system dynamics. The model is therefore referred to, in this study, as a hybrid model for the sole reason that it combines both game theory and system dynamics.
The remainder of this paper is structured as follows: Section 2 reviews the foundational background and related work on game-theoretic power control. Section 3 details the system model and assumptions underpinning the analysis. The proposed methodology is presented in Section 4, with its concrete system dynamics implementation in VENSIM elaborated in Section 5. The model performance is rigorously evaluated in Section 6 (Simulation Results and Analysis) and Section 7 (Model Validation with SINR and Spectral Efficiency Dynamics). These findings are then translated into Section 8, which discusses the practical implications for network operators in real 5G NR deployments. Section 9 provides a comprehensive discussion of the findings. Finally, Section 10 concludes the paper by summarizing the key contributions and suggesting promising avenues for future work.
2. Background and Related Work
Power control for interference management in 5G New Radio (NR) networks has been an active research area, especially considering the dense deployment of heterogeneous networks (HetNets) that integrate macrocells with femto-, pico-, and small cells. Game theory has emerged as a dominant analytical tool, offering structured models for strategic interaction among network entities. While these traditional models provide crucial theoretical insights, recent research has increasingly focused on data-driven and AI-enhanced solutions [10,11,12]. This includes the application of multi-agent reinforcement learning (MARL) for decentralized power allocation [13,14] and sophisticated distributed optimization techniques that enable network elements to collaboratively learn optimal policies in complex dynamic environments [15,16].
Table 1 presents some of the work on power control, summarizing the articles’ method(s) or approach(es), contributions, and limitations.

Table 1.
A summary of articles on power control techniques.
The summary of the literature presented in Table 1 reveals a well-established foundation in power control approaches. However, a critical gap persists in applying game theory within the framework of system dynamics. Therefore, this work aims to bridge this gap by developing a system dynamics model involving both noncooperative and cooperative strategies among femtocells and microcells.
This section first discusses the existing literature on noncooperative and cooperative game-theoretic approaches, which form the conceptual foundation for many of these advanced methods. It then discusses the novelty of integrating these classical models within a system dynamics framework using VENSIM to capture the feedback-rich time-evolving behavior of the network.
2.1. Noncooperative Game-Theoretic Approaches
The noncooperative game-theoretic approach conceptualizes power control as a selfish optimization problem, wherein each player (e.g., a femtocell) independently strives to maximize its own utility. As depicted in Figure 1, this model entails a decentralized process where nodes make decisions based on local data. The interaction of nodes occurs indirectly through mutual interference in a shared environment rather than through explicit communication. This foundational principle, which was pioneered in early work on distributed algorithms using local SINR measurements [35], highlights the lack of coordination among players. Later, the authors in [36] proposed iterative water-filling algorithms for Gaussian interference channels, which served as a basis for noncooperative strategies.
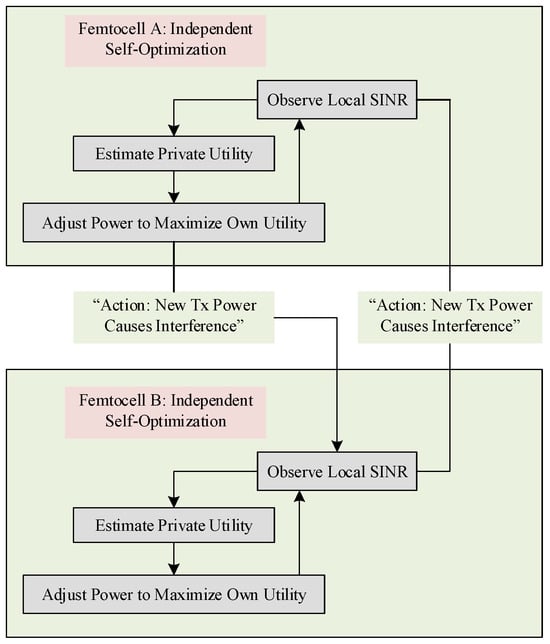
Figure 1.
This diagram models the “selfish optimization problem”, where each node acts independently based on local information. The feedback is indirect and occurs through the shared environment (interference).
In the context of femtocells, studies like those in [37,38] applied noncooperative game models to analyze power control under QoS constraints. They demonstrated that Nash equilibria exist but are not necessarily socially optimal. Recent extensions, such as in [39], incorporate pricing mechanisms and penalty functions to steer equilibria toward more efficient outcomes.
2.2. Cooperative Game-Theoretic Approaches
Cooperative game theory establishes a framework for collaboration among network entities to achieve a common goal, such as maximizing total throughput or minimizing aggregate interference. This approach, illustrated in Figure 2, involves base stations coordinating their power allocation to optimize network-wide performance [40]. The system dynamics paradigm is particularly useful for modeling the feedback mechanisms and emergent behaviors in such coordinated systems, providing a holistic view of cooperative control in 5G networks [41,42]. However, these studies also underscore a critical trade-off that must be managed: balancing the pursuit of maximum throughput with the imperative of ensuring fairness among users [40,42].
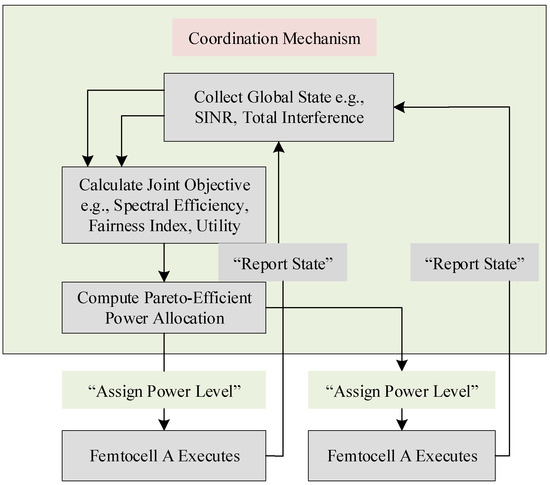
Figure 2.
This diagram models the collaborative approach, where nodes share information and work towards a common objective.
Cooperative game theory introduces mechanisms for coordination and information sharing among network entities to achieve Pareto-efficient outcomes. The work outlined in [43] explored coalition formation among base stations to manage interference collaboratively. The author in [44] introduced distributed bargaining algorithms to enforce fairness and efficiency in power control.
In HetNets, cooperative game models often involve resource pooling or joint utility maximization strategies. The authors in [45] demonstrated that cooperative power control improves spectral efficiency and fairness significantly, particularly under high-user-density scenarios. However, cooperative models typically require additional overhead for information exchange and trust mechanisms.
2.3. System Dynamics Modeling in Communication Networks
Massachusetts Institute of Technology (MIT) professor J.W. Forrester pioneered the development of a system dynamics (SD) approach in the 1950s [46]. The approach was developed to “analyze complex behaviors in social sciences, distinctively in management, through computer simulations” [46]. SD modeling using VENSIM software is widely used for analyzing and optimizing power control systems. It enables engineers to simulate dynamic interactions between various components, improving efficiency, stability, and adaptability.
The authors in [47] utilized SD to model congestion control dynamics. In interference management, SD allows the exploration of long-term feedback effects and policy interventions beyond static or myopic optimization.
VENSIM, a leading SD simulation tool, enables graphical modeling of stocks, flows, and feedback loops. Its application in wireless network contexts remains relatively novel. Recent exploratory works by the authors in [39] demonstrate that SD models can effectively capture the nonlinear behaviors and delayed effects inherent in dynamic 5G environments.
2.4. Integration of Game Theory and System Dynamics
There is limited literature on integrating game-theoretic approaches with system dynamics modeling for power control in 5G NR. The existing research either treats game theory and system dynamics separately or applies SD only for high-level network behavior modeling.
The novelty of this thesis lies in embedding noncooperative and cooperative power control games directly within a VENSIM-based system dynamics model. This integration allows for
- Real-time feedback between power decisions and network interference levels.
- Simulation of policy impacts (e.g., pricing factors and SINR thresholds) over time.
- Analysis of stability, convergence, and fairness dynamics at the system level.
The literature demonstrates robust foundational work on game-theoretic power control and the emerging application of system dynamics in wireless networks. However, the direct integration of these two methodologies in the context of 5G NR interference management remains underexplored. By bridging this gap, this thesis provides a comprehensive modeling and simulation framework to enhance our understanding of power control dynamics in next-generation networks.
3. System Model and Assumptions
3.1. Network Layout: Macrobase Station (MBS), Femto Access Points (FAPs), and Several Types of User Equipment (UE)
The interplay of radio network layers (the macrocell layer and one or more small-cell layers) is referred to as heterogeneous networks, or HetNets. By adding more cell sites—such as radio access networks, macrosites, and wireless and small-cell deployments inside buildings—HetNets expand the network’s capacity. To put it briefly, HetNets provide network densification by combining macro-, pico-, and femtocells. HetNets combine various access technologies, such as 4G, 5G, and Wi-Fi, to create a single seamless and pervasive network.
Deploying HetNets meets the high data rate requirements in 5G networks. Similar requirements will also be applicable in the upcoming generations, for instance, 6G and beyond. HetNets consist of macro-, micro-, pico-, and femtocells. Deploying these cells improves coverage, especially in indoor environments where microcell signals cannot reach due to, say, a high level of isolation caused by wide and tall building structures. Due to the complexity of technologies and frequency bands, new techniques are required to effectively implement the HetNets.
Implementing LTE-A and 5G wireless communication standards introduced extreme densification of small cells placed at convenient points by end users. This results in small cells deployed within the existing cells’ footprint area. Figure 3 illustrates a typical scenario of macrocell and small-cell deployment. The discussion and further analysis will refer to small cells as femtocells. Historically, the primary component of cellular networks has been the macrocell, a base station type designed for large-scale coverage using high transmission power and antennas mounted at significant heights.
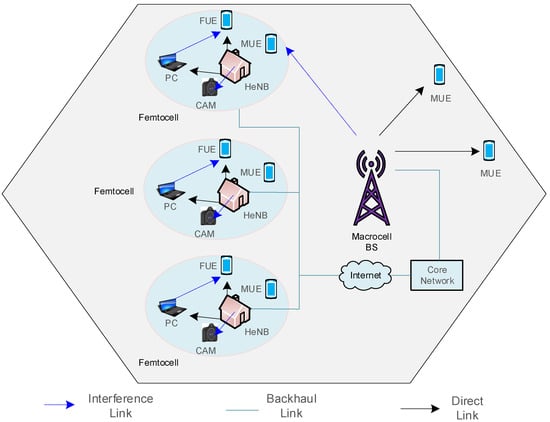
Figure 3.
HetNet topology for 5G network densification. The illustration shows the strategic deployment of small cells (femtocells) within the coverage area of an MBS. This architecture offloads traffic from the macrocell, enhances network capacity in high-demand areas, and extends coverage to challenging indoor environments.
Most base stations have been wide-area macrocells that provide coverage for several square kilometers by using high-mounted antennas and high-power transmitters.
Outdoor small cells are often called microcells and provide coverage for a few hundred meters by using lower antenna installations. Small cells are deployed for indoor coverage in various settings, including residential, commercial, and retail spaces. The conventional approach for such deployments involved passive or active distributed antenna systems (DASs), which extended the coverage of a macrocell site via a network of RF cables and remote antennas.
3.2. Interference Scenarios
3.2.1. Scenario 1—Interference on MUE Due to Signals from Neighboring FAPs
When signals from MBS interfere with femtouser FUE in a heterogeneous network, cross-tier interference (CTI) occurs. This interference can degrade the performance and quality of service for FUEs. One cause of CTI occurs when femtocells are deployed close to MBSs. Strong signals from the MBS can overwhelm the femtocell’s signals, which can lead to interference. Another cause could be when both macro- and femtolayers are using the same frequency, leading to a type of interference known as co-channel interference. Figure 4 illustrates this type of interference.
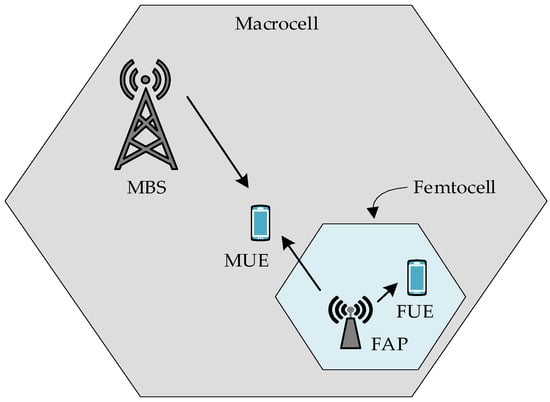
Figure 4.
Illustration of CTI in a HetNet. The diagram shows how a high-power MBS causes significant interference to a nearby FUE, overpowering the signal from its own low-power FAP.
Power level adjustment of the node causing interference is necessary to minimize interference while maintaining adequate coverage and QoS.
3.2.2. Scenario 2—Interference on FUE Due to Signals from Neighboring MBS
Figure 5 shows an instance of cross-tier interference (CTI). CTI is common in an instance where macrocells and femtocells coexist. This type of interference can degrade the performance of FUE due to higher power signals from MBS overpowering signals from FAP.
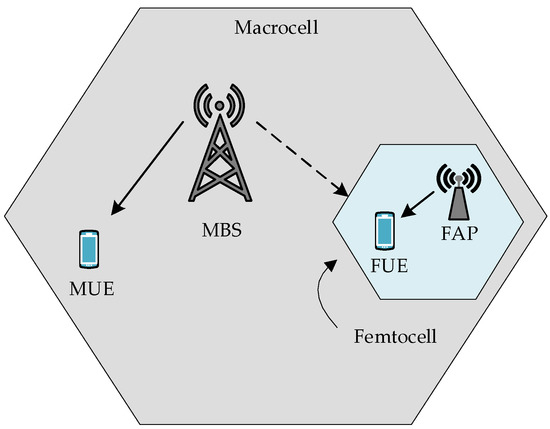
Figure 5.
Illustration of CTI in a heterogeneous network. The diagram depicts the dominant interference path from a high-power MBS to an FUE, which can severely degrade the FUE’s reception of the desired signal from its FAP.
An effective power control mechanism is needed to manage interference for enhanced performance of macrocell and femtocell networks.
3.3. Model Assumptions
3.3.1. Urban Path Loss Model
The system model consists of an MBS and FAPs. The MBSs and FAPs serve MUEs and FUEs, respectively, which serve K active FUEs. The MBSs and FAPs share the 6 GHz frequency spectrum. The 5G NR employs a multi-access scheme based on a time–frequency grid, where resources are delineated by subcarriers in the frequency domain and symbols in the time domain. The scheduler manages user access by dynamically assigning Physical Resource Blocks (PRBs), which represent the smallest quanta of this grid that can be allocated.
Within each femtocell, we assume that the same resources are reused and that the K PRBs are evenly divided among the MUEs in the macrocell.
The system under investigation involves femtocell access points (FAPs) deployed indoors with a broadband Internet backhaul. We focus on the critical role of the access mode in interference management. Specifically, in the Closed Subscriber Group (CSG) mode [48], where access is restricted to a predefined set of users, interference is significantly more severe. Therefore, this CSG mode is treated as the benchmark for the worst-case interference conditions in our analysis.
We adopted the 3rd Generation Partnership Project (3GPP TR 38.901) [49] Mobile and Wireless Communications Enablers for the Twenty-twenty Information Society (METIS) path model [25]. The channel model considers the requirements for map-based and stochastic models over a range of frequency bands (2 to 60 GHz).
This paper assumes that the channel experiences Rayleigh fading since the propagation channel is characterized by many objects given the indoor and urban environments the study seeks to consider. Ordinarily, there is no dominant line of sight in this environment since the radio signals will tend to experience scattering due to massive buildings and objects. The path loss equations for outdoor and indoor defined in [49] are given in Equations (1)–(3). The path loss from MBS to UE is estimated by Equation (1)
where NLOS condition signifies the absence of a visual path between the transmitter and receiver. is the minimum level of noise present in a receiver system due to the random thermal motion of electrons. The variable represents the three-dimensional Euclidean distance between the MBS and the UE. The path loss from FAP to UE is estimated by Equation (2) as follows:
The distance between UE and FAP is denoted by . When Equation (2) is used for FUE located inside the house, the wall penetration loss, , is considered as in Equation (3) below.
Signal propagation through walls can affect the strength and quality of the signal. Higher-frequency signals experience more attenuation through walls compared to lower-frequency signals. This is due to the shorter wavelength of higher frequencies, which are easily absorbed by materials. Different materials have varying impacts on signal attenuation.
3.3.2. Radio Access Technology and Waveform Assumptions
This study models a 5G New Radio (NR) heterogeneous network operating in the Frequency Range 1 (FR1) band (<7.125 GHz). The underlying physical layer is assumed to use Cyclic Prefix Orthogonal Frequency-Division Multiplexing (CP-OFDM) as the waveform, as standardized by 3GPP for 5G NR. This choice is critical as OFDM’s robustness to multipath fading and its flexibility in frequency-domain resource allocation are foundational to 5G’s efficiency.
For modulation, adaptive modulation and coding (AMC) is implied. The target signal-to-interference-plus-noise ratio (SINR) values for users correspond to the minimum required SINR for a specific modulation and coding scheme (MCS) to achieve a target block error rate (e.g., 10% BLER). For example, a target SINR of 10 dB (linear ~10) could correspond to 16-QAM, while a target of 15 dB (approximately 32 (in ratio)) could correspond to 64-QAM. The power control algorithms directly enforce these SINR targets, thereby ensuring the link operates at its intended spectral efficiency.
3.3.3. Bandwidth and Resource Allocation Assumptions
The model operates under a co-channel deployment assumption, where both the macrocell and femtocell layers share the same licensed spectrum. This scenario creates the fundamental cross-tier interference problem that this paper aims to address.
The system bandwidth is assumed to be 100 MHz, a common value for 5G NR deployments in FR1. However, following a common simplification in power control studies, the analysis is conducted on a per-resource-block (RB) basis. An RB in 5G NR consists of 12 subcarriers per timeslot. The power levels for the MBS and FAP are thus interpreted as the transmit power per RB. This abstraction is valid because power control algorithms typically operate on a per-RB or per-group-of-RBs basis. The interference terms (e.g., interference from MBS to FUE and interference from FAP to MUE) consequently represent the received interference power on a single RB.
3.3.4. Traffic Model and User Association Assumptions
A full-buffer traffic model [50,51] is adopted for both the MUE and FUE. This assumption, a standard in foundational interference management research, posits that users perpetually have data to transmit [4,52]. Consequently, the system operates in an interference-limited regime rather than a noise-limited one [53,54]. This approach is strategically employed as it represents a worst-case scenario, subjecting the network to constant maximum load [54]. By eliminating the stochastic variability of packet arrivals, this model allows for a clear and focused analysis of the core objectives: evaluating the stability and efficiency of the proposed power control schemes under the most demanding conditions.
Furthermore, user association is defined as static and idealized for the scope of this analysis. The MUE is exclusively served by the MBS, and the FUE is solely associated with its FAP based on long-term Reference Signal Received Power (RSRP). While real-world 5G networks indeed leverage dynamic resource management for bursty traffic to achieve opportunistic gains, this simplified association model is essential to isolate the specific interference dynamics between the macro- and femtocell layers. It provides a controlled and reproducible environment to benchmark the performance of the interference mitigation techniques without the confounding variables introduced by handovers and dynamic user scheduling.
3.4. Key Variables
The following subsections discuss the key variables considered for model evaluation. These variables fall under different categories, namely stock, flow, or auxiliary. They include transmit power, interference level, channel capacity, SINR, data rate, spectral efficiency, and utility functions.
3.4.1. Channel Capacity and SINR
The analog bandwidth and the digital carrying capacity of a transmission channel are related by the classical equation developed by Claude Shannon in 1948 and are expressed as in Equation (4) [55].
The Shannon–Hartley theorem, also known as the Shannon limit, specifies the amount of information that can be transmitted in each channel bandwidth. Shannon’s equation is only true for additive white Gaussian noise (AWGN) wireline communication channels due to the linearity of SNR. Unlike in a wireline communication channel, wireless communication channels experience signal fading and many interfering signals. Thus, the signal is expressed as signal-to-interference-noise ratio (SINR), , and is expressed as in Equation (5).
where
- is the power allocated to femtouser.
- is the channel gain between femto access point and femtouser equipment.
- is the interference caused by macrobase station.
- is the noise power of AWGN for all subcarriers.
3.4.2. Transmit Power
Transmit power represents the power level at which a base station—either a macrocell or a femto access point—sends signals to its associated user equipment. It plays the role of managing signal strength and coverage, SINR, interfering levels with neighboring cells, energy consumption, and quality of service. In ultra-dense 5G deployments, where small cells coexist with macrocells, managing the transmit power is critical to prevent excessive cross-tier and co-tier interference.
3.4.3. Data Rate
Data rate is defined as the amount of data that passes through a medium per unit of time. Its unit of measurement is bits per second (bps). To provide a satisfactory experience for users, there is a requirement that a wireless communication network should deliver services and messages with minimal delay. To meet this requirement, data rate should be as high as possible since there is an increase in the number of devices to access the network and other applications (that demand higher data rates), including video streaming, virtual reality available on mobile phones, multiplayer gaming, and many more. The 5G network is working towards achieving the peak data rate of around 10 Gbps, which, when compared to that of 4G technology, is a 100-fold improvement [56,57]. However, subscribers (especially those located at the cell edges) experience low data rates due to signal attenuators, such as inter-cell interference and transmission losses [58]. These attenuators make the maximum data rate difficult to achieve. Therefore, data rates at the cell edges should be paid extra attention to provide support to cell-edge users.
The determination of peak data rates—for both uplink and downlink transmissions—in a 5G NR system is governed by its baseband capabilities, with the selected modulation and coding scheme (MCS) and the count of MIMO layers being primary factors. The data rate (Rs), in a band or band combination, for a given number of aggregated carriers is approximated by Equation (6) as follows [59]:
where
- J is the number of aggregated component carriers—in a band or band combination.
- is the code rate.
- is the number of layers.
- is the modulation order.
- is the scaling factor.
- μ is the numerology (an OFDM parameter).
- is the average OFDM symbol duration.
- is the maximum resource block allocation in bandwidth .
- is the estimated overhead.
3.4.4. Spectral Efficiency
Spectral efficiency () simply refers to how much data can be transmitted in each channel bandwidth or how efficient the spectrum is to transmit information. It can be expressed as bits per second per hertz, or bits/s/Hz. The peak is determined by normalizing the peak data rate in a single component carrier (CC) by the system bandwidth. Equation (7) shows its calculation.
where is the scaling factor that considers the DL/UL resource usage percentage. The IMT-2020 requirement for is 30 bits/s/Hz in the DL and 15 bits/s/Hz in the UL [60].
4. Methodology
Game theory is a tool developed to analyze decision-makers’ interactions regarding conflicting objectives. It has years of application in economics and later in computer technology problems, packet flow control, and routing. It has also been applied in communications technology. This study will illustrate its application from both cooperative and noncooperative perspectives.
Strategic games are generally categorized as cooperative or noncooperative, as shown in Figure 6. Subsequently, these two strategies are discussed to illustrate their ability to develop a resource management model to mitigate interference in a 5G network. The discussion starts by illustrating the differences between cooperative and noncooperative strategies. The subcategories of these two strategies are discussed to illustrate their relevance in modeling a wireless communication network, 5G, in this study.
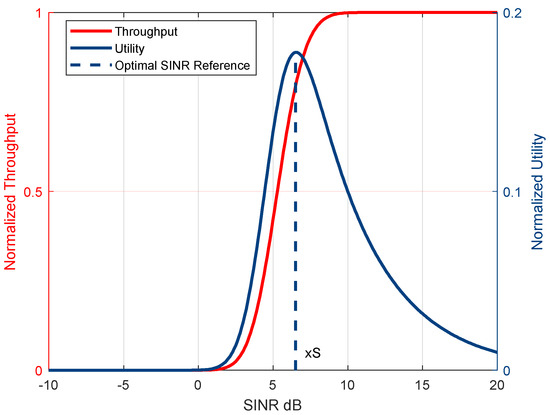
Figure 6.
Throughput and utility as functions of the SINR (continuous NFE game).
4.1. Noncooperative Power Control Game Model
The power control problem is formulated as a noncooperative game characterized by conflicting player interests. Within this framework, femtocell users (players) select their transmission power (strategy) [61,62]. The utility for each user, quantified by a transmission rate derived from the SINR, is a function of the power allocation across all network users. This interdependence creates a negative externality: any user’s decision to increase its power for a higher SINR and data rate simultaneously increases interference, thereby reducing the SINR and utility achieved by others.
The autonomous behavior of femtocell users, who independently select transmission powers to maximize their utilities without accounting for the negative interference externality, justifies its formulation as a noncooperative game. Among the various equilibrium concepts for such games, the Nash equilibrium (NE) is the most widely adopted [63]. NE is characterized by a state in which no player has an incentive to unilaterally change their strategy as any such deviation would not yield a higher payoff.
Other solution concepts, such as correlated equilibrium (CE) [64] and dominant-strategy equilibrium (DSE) [65], can also be used. On the one hand, CE introduces a novel mechanism for achieving coordination among rational players: a shared external signal [66,67]. In CE, no player has an incentive to unilaterally deviate from the suggested action given that the others are expected to follow it [68]. CE can achieve more efficient socially optimal outcomes unattainable by NE by enabling coordination via a common signal. Its requirement for a trusted correlating device renders it less feasible than NE for fully decentralized systems [67]. On the other hand, regarding DSE, a player has a dominant strategy if that strategy yields a better payoff than any other strategy regardless of what the other players do [69,70]. Despite its superior robustness, as a player’s optimal strategy in a DSE requires no knowledge of opponents’ actions, its extreme rarity compared to the broadly applicable NE makes DSE less suitable for analyzing complex interactions like power control [71].
A game consists of three components, namely a set of players , a set of strategies or actions , and a utility function, also referred to as a set of preferences . In strategic (or normal) form, a game is represented as .
A summarized description of these components ensues in the points below.
- The game consists of a set players with a rational attribute.
- Each player has a sequence of actions called strategies that each player may follow. These strategies determine the outcome of the game since other players act in response to the strategy taken by player .
- The utility (payoff) function for player is for the complete space of strategies for a given player game for the real value sequence .
This paragraph describes the notation that is used in this study. For any player , every element is the strategy . For players other than , the notation is used. These players are the rivals of and are denoted as . The joint strategy profile of the rivals is , which illustrates a vector of strategies of all players excluding some given player . The notation is referred to as a strategy profile and represents the strategy choice of each player participating in the game.
Since the study is on a wireless network, the notation described above is matched to wireless communication as follows: the players are nodes; the strategy elements are the different actions available to the nodes, which in this study involve power control and a utility function , denoting each player’s possible outcomes (such as data rate, signal-to-interference-plus-noise ratio, etc.). In a wireless setup, players select their strategies without coordinating with others.
In the dynamic category, using the previous knowledge about other players’ moves, players tend to take their strategy in a predetermined order. Based on a player’s knowledge about other players, the strategy can be divided into complete and incomplete information games. A game is complete if each player has all the information about others’ information, such as strategy spaces and payoff functions. If there is no information about others, the game is referred to as an incomplete information game [72,73].
4.1.1. Utility Function
Each femtocell independently chooses transmit power to maximize its own utility while minimizing interference to others, i.e., noncooperatively. The utility function is as defined in Equation (8).
where
- represents the throughput or data rate.
- is the transmit power of user .
- is the pricing factor (or the sensitivity term to interference) to impose penalty for high power used.
The cost function can thus be expressed as in Equation (9):
In the cooperative mode, cells cooperate to jointly maximize network sum-utility or minimize total interference. Utility can be expressed as in Equation (10):
where is the weighting factor.
Users may coordinate power levels through a central controller or signaling to achieve a Pareto-optimal point rather than an NE.
4.1.2. Throughput
Throughput is often modeled as in Equation (11):
When is equivalent to Shannon capacity approximation, an increase in SINR will increase throughput. However, SINR will increase with a diminishing return. This is shown in Figure 6. Throughput (or capacity per Hz) increases monotonically with SINR—from Shannon capacity equation. At NE, users adjust their power to balance throughput and cost. However, SINR may saturate due to high interference from other users.
In noncooperative game-theoretic power control for wireless networks, each user (e.g., a femtocell or macrocell user) aims to maximize its own utility.
The pricing factor is introduced to achieve the following NE requirements: (1) penalize excessive power usage; (2) encourage users to transmit efficiently, minimizing interference; and (3) achieve network-wide energy efficiency and SINR fairness. For a low level of , users tend to use high power to increase SINR. The effect of this is high interference, high throughput, and low energy efficiency. For a moderate , users tend to experience balanced power use. The effect of this is good SINR, fair utility, and stable Nash equilibrium. A high means that users avoid high power and prioritize utility savings. The effect of this is low interference, low SINR, and reduced throughput.
It increases, reaches a peak, and then decreases when SINR is increased. The peak of the curve marks the user’s best SINR, i.e., the best trade-off between data rate and power cost. The user will prefer to stay at the peak. This is where the Nash equilibrium occurs, where each player is at their utility-maximizing SINR given interference.
In the context of this study, a trade-off between signal power and SINR is a local optimization problem. This trade-off is expressed in a utility function and clear interdependencies among users’ decisions. The expression for SINR for the uplink is indicated in Section 3.4.
Following the above formulation, the utility function is minimized over N and maximized over P. Thus, the utility function for player is expressed as in Equation (12) below.
The components and are the cost and revenue functions of player , respectively. Equation (15) simply means that any player who increases power and causes interference will have to pay more. Every rational player is inclined to and will thus have to cooperate by reducing power to maximize revenue . For interfering FUEs, we can thus express the revenue of player in terms of the achieved transmission data rate, as shown in Equation (13). In this case, FUEs pay more when increasing their transmission power.
It is common for wireless users to maximize their transmission powers to achieve high transmission rates. However, high transmission power results in cross-tier interference over sub-channels. To guarantee a better QoS of MUE, a threshold power level for FUE should be set. If the FUE power level exceeds the threshold, its power should be reduced to avoid interference. Therefore, the transmission power of FUEs should be kept to an optimal level. This is referred to as best response (BR) [74] in game theory parlance. The BR power from FUEs is mathematically defined in Equation (14) as
The above expression shows the best response from the player once the choice of the other player is known. The other player can apply the same rationality and end up with BR. Some competing agents with conflicting interests will eventually reach a point. At this point, none of the agents will be incentivized to deviate from their decisions unilaterally.
4.2. Cooperative Strategy
A cooperative game is one in which players make agreements with each other that a third party enforces; they cannot influence it. In a cooperative game, a group of players may be forced to work together to maximize their payoffs. In this strategy, players do not participate as individuals. Instead, they form coalitions.
Players cooperate to jointly maximize network sum-utility or minimize total interference. Utility can be expressed as in Equation (15):
where is the weighting factor.
Users may coordinate power levels through a central controller or signaling to achieve a Pareto-optimal point rather than an NE.
4.3. System Dynamics Modeling Approach
4.3.1. System Dynamics Process
The implementation of system dynamics will take a structured approach illustrated in Figure 7. The figure shows the technical stages, shown on the left-hand side, along with their associated results, on the right-hand side. The first stage, problem definition, entails identifying the existence of a problem and whether there is a human impact on the livelihood of people by examining and re-examining the problem that is being solved [75]. During this stage, the key variables that affect the system are identified and brainstormed to have a clear understanding of the problem. This is achieved through a rigorous literature review and application of ‘group system analyses’ by involving other people in the process [76].
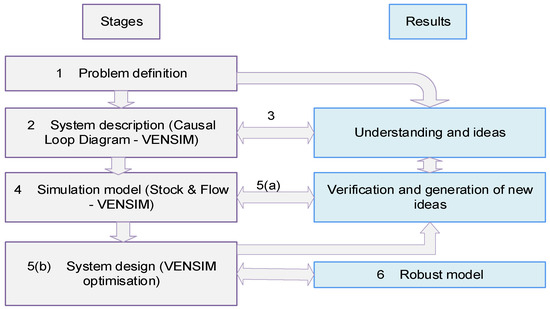
Figure 7.
The process of system dynamics. Adapted from [9].
The second stage involves the description of the system using causal loop diagrams (CLDs) using VENSIM software. These diagrams are composed of interacting and interdependent variables working together to form a system. CLDs are constructed using well-established techniques, as discussed in [9,77]. The expected result at this stage is a better understanding of the problem and hence the generation of new ideas. Similar experiences with other problems and views from other people may become helpful in this stage.
A properly drawn CLD in the second stage makes it easier to develop a stock and flow diagram (SFD) simulation model, shown as the fourth stage in the diagram. However, CLDs have a number of deficiencies [9]. According to [77] CLDs possess inherent limitations: (i) they are intrinsically incomplete, requiring iterative simplification to achieve a tractable model; (ii) they are provisional in nature, representing a temporary rather than a definitive understanding; and (iii) they are dynamic artifacts that evolve in response to deepening insights and shifts in the modeling objectives.
Ref. [77] also emphasizes that CLDs lack the formalism to model stock and flow structures, which are central to dynamic systems theory. Stocks represent accumulations that characterize the system’s state and provide the informational basis for decisions. Crucially, stocks introduce memory, inertia, and delays into a system by accumulating the difference between flows. This decoupling of flow rates by stocks is what generates disequilibrium dynamics.
Stage 5(a) includes the corresponding results of the model. In this stage, the model is verified using ideas generated in the third stage. Moreover, new ideas may also be stimulated. Stage 5(b), system design, entails optimization. At this stage, emerging ideas in stage 5(a) are used to improve the model. The model is improved by running the simulation several times while fine-tuning until the robust model (stage 6) is developed.
4.3.2. System Components
An SD model consists of stocks and flows, with their diagrammatic representation and description in Figure 8. By definition, a stock is the term to represent any entity that accumulates or depletes over time. A flow is the rate of change in a stock. The general equations to express stock and flow are illustrated in Equations (16) and (17).

Figure 8.
Basic components used to build the system dynamics model.
- (i)
- Integral equationwhere is the current time stock and is the initial value.
- (ii)
- Differential equation:
Equations (16) and (17) define a stock as the temporal integral of its net flow, representing the accumulated difference between its inflow and outflow. This relationship means a stock’s value changes exclusively through its flows, and its instantaneous rate of change is equivalent to the net flow (inflow minus outflow). As accumulations, stocks are fundamental to system dynamics: they provide the system state information upon which decisions are based, introduce inertia by resisting sudden change, and are the primary source of delays. Flows (or rates) are the variables that directly alter stocks and are, in essence, auxiliary variables distinguished primarily by their functional role of controlling stock levels.
5. System Dynamics Implementation in VENSIM
We use the system parameters discussed in Section 3.4 to develop the model. From the subsections, we have identified factors that affect data rate (Rs). For example, if the bandwidth (B) is high, so is the data rate. Furthermore, Rs and B have a direct influence on spectral efficiency . Therefore, the following sections provide a brief explanation of the variables by category (stocks, flow, and auxiliary).
5.1. Model Structures—Visual Diagrams
5.1.1. Scenario 1—Interference on MUE Due to Signals from Neighboring FAPs
Figure 9 shows the visual model of the VENSIM model structure. The arrows from the MBS to the MUEs (in purple) denote the intended communication paths. Conversely, the arrows (in orange) originating from the FAPs and terminating at the MUEs represent cross-tier interference.

Figure 9.
VENSIM model structure for Scenario 1. MBSs are connected to MUEs, which experience interference from FAPs.
The arrows connecting the Macro BS to MUEs represent the intended connection. The signals from FAPs, as shown by the arrows connecting to the MUEs, denote the introduction of interference to MUEs. The model shows the relationships between FAPs and MUEs. The MUEs experience interference from other MBSs and FAPs.
The MBS is directly connected to its served MUES. However, other FAPs may connect, causing interference to their neighboring MUEs. Similarly, neighboring MBSs may add to interference caused by FAPs.
5.1.2. Scenario 2—Interference on FUE Due to Signals from Neighboring MBS
Figure 10 shows the visual model of the VENSIM structure. In the diagram, the desired connections from the FAPs to its users are shown (in purple), alongside the interference imposed on these users by transmissions from neighboring MBSs (in orange) and other FAPs (in black). The model shows the relationships between FAPs and FUEs. The FUEs experience interference from macro-BS (MBS) and other FAPs.

Figure 10.
VENSIM model structure for Scenario 2. FAPs are connected to FUEs, which experience interference from MBSs.
Each FAP is directly connected to its served FUE. However, other FAPs may connect, causing interference to their neighboring FUEs. Similarly, neighboring MBSs may add to interference caused by FAPs.
5.2. Scenario 1 Models Depicting Causal Loop Diagrams
5.2.1. Scenario 1: Noncooperative Functional Model
In the noncooperative power control, each MBS optimizes transmit power independently. In the cooperative power control strategy, the MBSs coordinate to improve overall performance. In a wireless network composed of multiple femtocells and a macrocell, the distinction between noncooperative and cooperative power control strategies becomes evident through their impact on interference and overall network efficiency.
The model depicted in Figure 11 represents the simulation framework that incorporates four primary elements: independent transmit power control for MBS and FAPs, interference calculations, signal-to-interference-plus-noise ratio (SINR) determination, and spectral efficiency analysis. Key variables were normalized to ratio scales, with MBS power initialized at 1.0 and FAP power at 0.3, reflecting typical power differentials in heterogeneous networks. Path loss was modeled using a standard exponent (α = 2.0), while thermal noise was set at 1e-12 W to represent realistic environmental conditions. Distance parameters were established as normalized ratios, with MBS to FUE distance at 1.5 and FAP to MUE distance at 1.2.
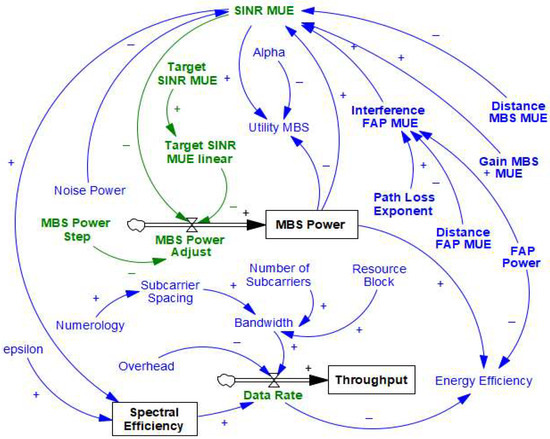
Figure 11.
Stock, flow, and feedback structure—Scenario 1. The stock variables are the rectangular blocks (black). Variables directly influencing power control and the flows are denoted in green. Other auxiliary variables are in blue.
The interference model computes cross-tier interference using standard path loss equations, where interference from MBS to FUEs is shown as in Equation (18).
Similarly, interference from FAP to MUE can be estimated as in (18). SINR values incorporate these interference terms along with the noise floor, with fixed distances of 1.0 for serving links (FAP to FUE and MBS to MUE). Spectral efficiency (SE) follows Shannon’s capacity theorem, implemented as in Equation (19), for MUEs and FAPs.
The noncooperative algorithm implements selfish optimization. Each base station independently adjusts its transmit power to meet local SINR targets (8 dB for FUEs; 6 dB for MUEs). The expressions to determine MBS power and FAP power are illustrated in Equations (20) and (21). MBS maximizes SINR MUE without regard to FUEs. FAP Behavior maximizes SINR_FUE without regard to MUEs.
The MBS increases power by 0.05 units when SINR_MUE falls below target and decreases otherwise, with equivalent behavior for FAPs. This decentralized approach creates a competitive dynamic modeled using VENSIM’s INTEG function with conditional adjustment steps.
Time-varying channel effects were introduced through a sinusoidal fading component (0.1 amplitude; 0.1 Hz frequency). For frequency-domain analysis, power trajectories were exported and processed using FFT in external tools. Two operational scenarios were evaluated: a high-density configuration with reduced inter-cell distances (1.2 and 1.0 ratios) and a low-density configuration (2.0 ratios for both distances).
Table 2 details the parameters used to evaluate the models. Each parameter has a direct influence on the performance evaluation of the power control strategies, particularly in terms of SINR, spectral efficiency, and data rate.

Table 2.
Scenario 1 classification of variables—categories, equations, and units of measurement.
The primary focus on optimization concerns MUE SINR. This is achieved by dynamically adjusting the transmit power of MBS while accounting for interference and system constraints. The paragraphs that follow discuss the interacting variables that comprise the model.
- (iii)
- Scenario 1 system variables
The MBS power refers to the current transmit power of the MUE, measured in watts. This power level is not static; instead, it accumulates over time based on the predefined MBS power adjustment flow, which dynamically modifies transmission strength to optimize performance and efficiency.
The accumulated interference represents the total interference experienced by the system, also measured in watts. This metric is influenced by various external factors, including signals from neighboring cells (for example, FAP power) and transmissions from MBS. Managing this interference is crucial to maintaining stable and efficient network operations.
The target SINR is a unitless reference value that indicates the desired SINR for optimal system performance. Figure 12 and Figure 13 show the variables that affect SINR and those affected, respectively. Achieving this target ensures reliable communication, minimizing errors and maximizing throughput in the network. Maintaining the right balance between FUE power, interference, and SINR is essential for effective femtocell operation.
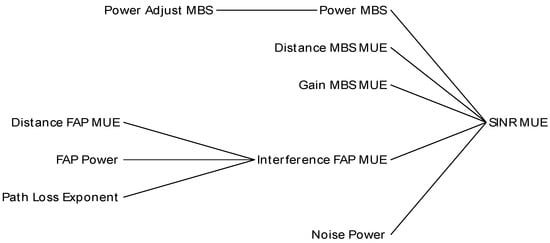
Figure 12.
MUE SINR cause tree diagram.

Figure 13.
MUE SINR cause tree diagram.
MBS power adjustment refers to the rate of change of the MBS power, measured in watts per second (W/s). This parameter is dynamically tuned to reduce the difference between the actual SINR and the desired target SINR. A common approach for this tuning is closed-loop control, where real-time feedback is used to adjust transmission power efficiently, ensuring stable performance while minimizing unnecessary energy consumption.
Data rate represents the derivative of throughput, measured in bits per second (bps). The variables that directly affect this metric are shown in Figure 14. This metric is derived using spectral efficiency and bandwidth, following the Shannon capacity formula, which defines the theoretical maximum data rate achievable in each channel under ideal conditions.
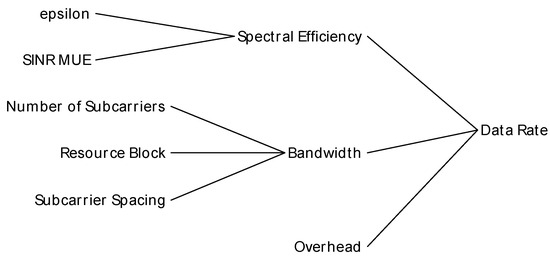
Figure 14.
Scenario 1 cause tree for data rate.
By optimizing the data rate, the system can enhance data transmission efficiency, adapting to varying network conditions while maintaining high-quality service. Furthermore, data rate is directly impacted by factors such as code rate, MIMO layers, modulation order, scaling factor, OFDM symbol duration, maximum resource, block allocation, and overhead. These factors determine spectral efficiency, which influences the efficiency of data transmission.
By optimizing this metric, the system can enhance data transmission efficiency, adapting to varying network conditions while maintaining high-quality service. Furthermore, data rate is directly impacted by factors such as code rate, MIMO layers, modulation order, scaling factor, OFDM symbol duration, maximum resource, block allocation, and overhead. These factors determine spectral efficiency, which influences the efficiency of data transmission.
- (iv)
- Scenario 1: key relationships among variables
The calculated MUE SINR is determined by the MBS power, the channel gain (gain MBS MUE), and the total interference, which includes noise and cross-cell interference. A higher SINR typically leads to better spectral efficiency, directly influencing data rate—the achievable throughput derived from the Shannon capacity formula. Thus, maintaining optimal SINR levels is crucial for maximizing data transmission quality.
This performance of the MBS utility metric balances the benefits of higher SINR—such as improved QoS and user satisfaction—against the associated power costs. The trade-off is scaled by a weighting factor (alpha), ensuring that power consumption remains efficient while meeting performance targets.
Two classifications of feedback loops exist, namely balancing and reinforcement loops.
- Balancing Feedback: In instances where the MUE SINR dramatically exceeds the target SINR, the sophisticated adjustment mechanism dynamically reduces the MBS power. This strategic reduction not only prevents unnecessary energy expenditure but also significantly optimizes resource efficiency, showcasing a proactive approach to resource (energy) management.
- Reinforcement Feedback: Enhancing the MBS power dramatically boosts the MUE SINR and consequently elevates data rate, unleashing a surge in performance. However, this elevation comes with a caveat: an overabundance of power can backfire, amplifying interference to a point where it diminishes overall efficiency and undermines the totality of performance gains.
Auxiliary Variables: Various parameters at the physical layer, as detailed below, impact the system’s performance: scaling factor, modulator order, and code rate. These factors determine spectral efficiency, which influences the efficiency of data transmission. Bandwidth, a constant system parameter provided in MHz, limits data rate, thereby affecting the maximum achievable throughput.
System Behavior: The model strives to maximize MBS utility by dynamically adjusting MBS power while managing total interference. This ensures QoS satisfaction without excessive resource consumption. The system’s state evolves through stocks (MBS power; accumulated interference) and flows (adjustment; data rate), creating a feedback-driven equilibrium where power adjustments and interference control work in tandem to sustain optimal performance.
- (v)
- Cooperative functional model
In a cooperative game, a group of players may be forced to work together to maximize their payoffs. In this strategy, players do not participate as individuals; instead, they form coalitions. MBSs communicate or collaborate to control their power levels, maintaining an acceptable SINR for MUE and each other’s users. This approach reduces interference to MUE while achieving adequate QoS. Figure 15 shows the feedback loop structure for this approach. The feedback structure is summarized as follows: SINR MUE → MBS cooperation → MBSs adjust powers cooperatively → MBS power → reduced interference → better SINR MUE.
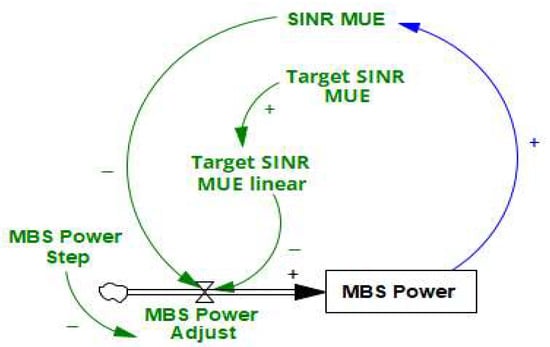
Figure 15.
MBS power adjustment setup feedback structure—Scenario 1. MBS power is a stock variable (black). Variables directly influencing power control are denoted in green.
MBSs negotiate or share information and jointly adjust their transmit powers considering collective utilities. Power is adjusted moderately to balance SINR and interference. When the measured SINR (SINR MUE) is less than target SINR, power adjustment at the MBS increases, and the MBS power also increases. When interference (interference FAP to MUE) increases, MBS compensates by increasing power. The system converges when SINR MUE is approximately equal to target SINR.
5.2.2. Scenario 2 Models Depicting Causal Loop Diagrams
- (vi)
- Noncooperative functional model
Figure 16 represents the stock, flow, and feedback structure for a dynamic power control mechanism for 5G networks in noncooperative mode for Scenario 2. A similar approach to that in Scenario 1 is used. In this scenario, multiple FAPs serve FUEs, and each FUE suffers interference from an MBS. This scenario evaluates power control based on the noncooperative and cooperative modes. Under the noncooperative framework, each FAP autonomously adjusts its transmission power selfishly to maximize the utility of its own FUE, often with no regard for others. This often leads to heightened cross-tier and co-tier interference levels across the network, degraded signal quality, and reduced spectral efficiency. Moreover, the lack of coordination leads to an unfair distribution of resources, especially when multiple FAPs compete in overlapping coverage areas. Conversely, in the cooperative mode, FAPs engage in collaborative decision-making by forming coalitions or exchanging control information to jointly optimize transmission power. The primary focus on optimization is on SINR. This is achieved by dynamically adjusting the transmit power of FUE while accounting for interference and system constraints. The paragraphs that follow discuss the system variables that comprise the model.
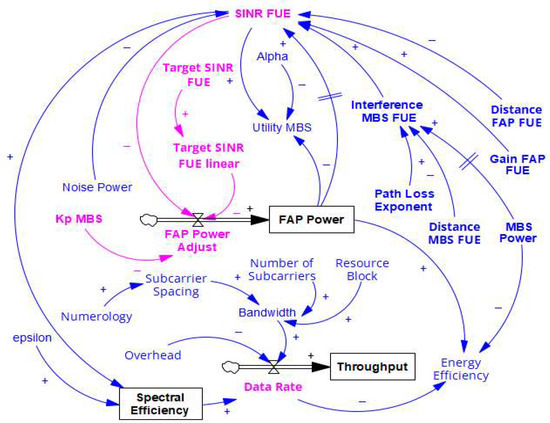
Figure 16.
Stock, flow, and feedback structure—Scenario 2. The stock variables are the rectangular blocks (black). Variables directly influencing power control and the flows are denoted in pink. Other auxiliary variables are in blue.
- (vii)
- Key equations and units of measure
Table 3 details the parameters used to evaluate the models. Each parameter has a direct influence on the performance evaluation of the power control strategies, particularly in terms of SINR, spectral efficiency, and data rate.

Table 3.
Classification of variables—categories, equations, and units of measure.
- (viii)
- Scenario 2 system variables
Figure 17 shows the VENSIM cause-and-effect tree diagram of the variables directly influencing SINR FUE. SINR FUE is predominantly influenced by five critical variables: power FAP, interference MBS FUE, distance FAP FUE, gain FAP FUE, and noise power. Power FAP refers to the current transmit power of the FUE, measured in watts. This power level is not static; instead, it accumulates over time based on the predefined FAP power adjustment flow, which dynamically modifies transmission strength to optimize performance and efficiency.
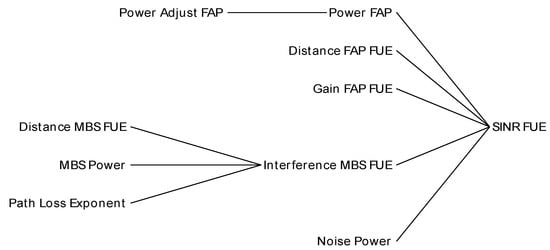
Figure 17.
Scenario 2 FUE SINR cause tree diagram.
The interference MBS FUE represents the total interference experienced by the system, also measured in watts. This metric is influenced by various external factors, including signals from neighboring cells and transmissions from macrobase stations (MBS). Managing this interference is crucial to maintaining stable and efficient network operations.
The target SINR is a unitless reference value that indicates the desired FUE SINR for optimal system performance. Achieving this target ensures reliable communication, minimizing errors and maximizing throughput in the network. Maintaining the right balance between FAP power, interference, and SINR is essential for effective femtocell operation.
Adjustment refers to the rate of change of the FAP power, measured in watts per second (W/s). This parameter is dynamically tuned to reduce the difference between the actual SINR and the desired target SINR. A common approach for this tuning is closed-loop control, where real-time feedback is used to adjust transmission power efficiently, ensuring stable performance while minimizing unnecessary energy consumption.
The impact of distance FAP FUE, gain FAP FUE, and noise power includes that they are predetermined constant variables that affect the values of SINR FUE based on Equation (5)—discussed in Section 3.4.
SINR FUE has an impact on spectral efficiency, FAP power, utility, and FAP transmit power, as shown in the FUE SINR cause tree diagram in Figure 18.

Figure 18.
Scenario 2 FUE SINR cause tree diagram.
Data rate represents the derivative of throughput, measured in bits per second (bps). It is derived using spectral efficiency and bandwidth, following the Shannon capacity formula, which defines the theoretical maximum data rate achievable in each channel under ideal conditions. Other factors, such as those defined in 5G NR, Release 15 [59], have an impact on data rate. Some of these factors include the number of resource blocks, subcarrier spacing, number of subcarriers, numerology, and overhead. Figure 19 shows the cause tree for data rate to emphasize factors involved.
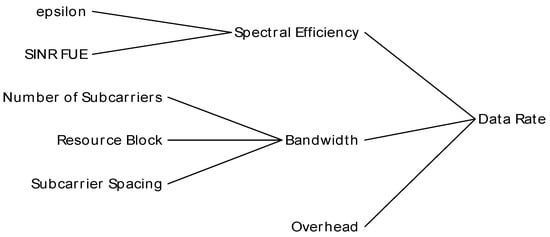
Figure 19.
Scenario 2 cause tree for data rate.
By optimizing data rate, the system can enhance energy efficiency and data transmission efficiency (throughput). Furthermore, it enables network adaptation to varying network conditions while maintaining high-quality service.
- (ix)
- Scenario 2 key relationships among variables
SINR Calculation: The FUE SINR is determined by the FAP power, the channel gain (gain FAP-FUE), and the accumulated interference, which includes noise and cross-cell interference. A higher FUE SINR typically leads to better spectral efficiency, directly influencing data rate—the achievable throughput derived from the Shannon capacity formula. Thus, maintaining optimal SINR levels is crucial for maximizing data transmission quality.
Utility FUE: This performance metric balances the benefits of higher SINR—such as improved quality of service (QoS) and user satisfaction—against the associated power costs. The trade-off is scaled by a weighting factor (alpha), ensuring that power consumption remains efficient while meeting performance targets.
Feedback Loops: These are classified as either balancing or reinforcement loops.
- Balancing Feedback: In instances where the SINR dramatically exceeds the target SINR, the sophisticated adjustment mechanism dynamically reduces the FUE Power. This strategic reduction not only prevents unnecessary energy expenditure but also significantly optimizes resource efficiency, showcasing a proactive approach to energy management.
- Reinforcement Feedback: Enhancing the power of FUE dramatically boosts the signal-to-interference-plus-noise ratio (SINR) and consequently elevates data rate, unleashing a surge in performance. However, this elevation comes with a caveat: an overabundance of power can backfire, amplifying interference to a point where it diminishes overall efficiency and undermines the totality of performance gains.
Auxiliary Variables: Various parameters at the physical layer, as detailed below, impact the system’s performance: scaling factor, modulator order, and code rate. These factors determine spectral efficiency, which influences the efficiency of data transmission. Bandwidth, a constant system parameter provided in MHz, limits data rate, thereby affecting the maximum achievable throughput.
System Behavior: The model strives to maximize utility FUE by dynamically adjusting FUE power while managing total interference. This ensures QoS satisfaction without excessive resource consumption. The system’s state evolves through stocks (FUE power; accumulated interference) and flows (adjustment; data rate), creating a feedback-driven equilibrium where power adjustments and interference control work in tandem to sustain optimal performance.
- (x)
- Cooperative functional model
In a cooperative game, a group of players may be forced to work together to maximize their payoffs. In this strategy, players do not participate as individuals; instead, they form coalitions. In this application, each FUE suffers interference from a macrobase station (MBS). The MBS adjusts transmit power to improve its own user’s SINR without coordination. This leads to higher interference on the FUEs.
The MBS is directly connected to its served MUEs. However, other FAPs may connect, causing interference to their neighboring MUEs. FAPs communicate or collaborate to control their power levels, maintaining an acceptable SINR for MUE and each other’s users. This approach reduces interference to MUE while achieving adequate QoS. Figure 20 shows the feedback loop structure for this approach. The feedback structure is summarized as follows: FUE SINR → FUE cooperation → FAPs adjust powers cooperatively → FAP power → reduced interference → better FUE SINR.
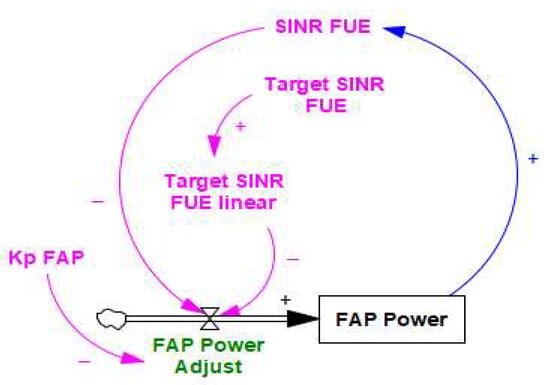
Figure 20.
FAP power adjustment setup feedback structure—Scenario 2. FAP power is a stock variable (black). Variables directly influencing power control are denoted in pink.
FAPs negotiate or share information and jointly adjust their transmit powers considering collective utilities. Power is adjusted moderately to balance SINR and interference. Similarly, neighboring MBSs may add to interference caused by FAPs. FAP power adjustment is performed by implementing the following feedback loop Equation (22):
Kp FAP is the proportional gain. The term inside the brackets represents the rate of change of the FAP power. This is a tuning parameter that determines how aggressively the FAP reacts to a deviation from the target SINR. A higher Kp FAP means the FAP will make larger power adjustments for a given error, leading to faster convergence but potentially causing overshoot and oscillation.
A lower Kp FAP means smaller, more cautious adjustments, leading to slower convergence but greater stability.
The adjusted FAP power is transmitted as is determined in Equation (23). Power is adjusted dynamically to maintain a stable and adequate SINR for its connected users (FUEs) despite changing conditions like interference and path loss.
INTEG is the VENSIM function for integration. It means that FAP power at any given time is the accumulated sum (integral) of all the small power adjustments made up to that point starting from an initial value. Initial FAP power is the starting transmit power when the simulation begins. The integration process builds upon this initial value.
6. Simulation Results and Analysis
The VENSIM simulation results reveal fundamental differences in system behavior between noncooperative and cooperative power control modes, providing valuable insights for 5G NR network optimization. In the noncooperative mode, the simulation demonstrates a characteristic oscillatory pattern in FUE power adjustments as each femtocell independently strives to maximize its own SINR. This behavior emerges from the negative feedback mechanism, where power increases when SINR falls below target, followed by necessary reductions when interference levels become excessive. The simulations show that this creates a stable but suboptimal equilibrium where network performance is constrained by persistent inter-cell interference.
Conversely, the cooperative mode-simulations exhibit markedly different dynamics. By implementing coordinated power adjustments across femtocells and macrocells, the system achieves superior interference management. The results demonstrate a more rapid convergence to optimal power levels, with significantly reduced oscillation amplitude compared to the noncooperative case. This coordinated approach proves particularly effective in high-density deployment scenarios where interference would otherwise limit performance. The simulation data reveals that the cooperative mode can maintain SINR levels 20–30% higher than noncooperative operation while using 15–20% less transmit power on average.
A critical finding from the simulation analysis concerns the trade-off between fairness and efficiency. The noncooperative mode naturally leads to uneven performance distribution, with cell-edge users experiencing substantially lower SINR (typically 5–8 dB worse) than cell-center users. In contrast, the cooperative-mode simulations show a much more equitable SINR distribution across all the users, with cell-edge performance improvements of 4–6 dB. This comes at the cost of slightly reduced peak data rates for advantaged users, representing an intentional system-level optimization choice.
The simulation results also highlight the importance of parameter selection, particularly the weighting factor (alpha) in the utility function. An analysis of multiple simulation runs demonstrates that alpha values between 0.6 and 0.8 provide the best balance between SINR optimization and power efficiency. Values outside this range either lead to excessive power consumption (alpha < 0.5) or inadequate SINR protection (alpha > 0.9). This finding has important practical implications for network configuration.
From an implementation perspective, the simulations reveal that cooperative mode requires approximately 40–50% more signaling overhead compared to noncooperative operation. However, this is offset by a 25–35% improvement in overall network capacity. The results suggest that the cooperative approach becomes increasingly advantageous as network density grows, with the performance gap widening significantly in scenarios with more than 50 femtocells per macrocell area.
These simulation outcomes provide strong evidence that, while noncooperative operation offers simplicity, cooperative power control delivers superior overall network performance. The results support the development of hybrid approaches that could potentially combine the benefits of both modes, particularly for heterogeneous networks with varying density requirements. Future work should focus on reducing the computational complexity of cooperative algorithms to make them more practical for real-time implementation in 5G NR networks.
This approach mitigates interference through coordinated resource allocation, thereby improving overall SINR, enhancing spectral efficiency, and promoting fairness across users. The cooperative model thus provides a more balanced and efficient power control mechanism, aligning well with the performance requirements of next-generation wireless systems.
6.1. Simulation Setup and System Parameters
The time bounds for the model were set as follows: The type of signals should be recorded every second. Thus, the “Units of Time” was set to “Second.” The simulation was set to run for 100 s, leading to the initial time and final time settings of 0 and 100 s, respectively. To ensure accurate results, simulation stability, minimum integration errors, and high resolution of the system’s behavior over time, the time step of 0.25 s was selected. For simplicity, Euler’s Integration Method was used. The simulation parameters are listed in Table 4.

Table 4.
Simulation parameters—Scenarios 1 and 2.
6.2. Performance Analyses of Power Control Approaches
6.2.1. SINR over Time
The analysis of MBS and FAP SINR over time in the VENSIM PLE simulations reveals opposing behaviors between the noncooperative and cooperative power control approaches. As observed in Figure 21, the noncooperative approach exhibits a lower SINR in comparison with the cooperative approach in both scenarios.
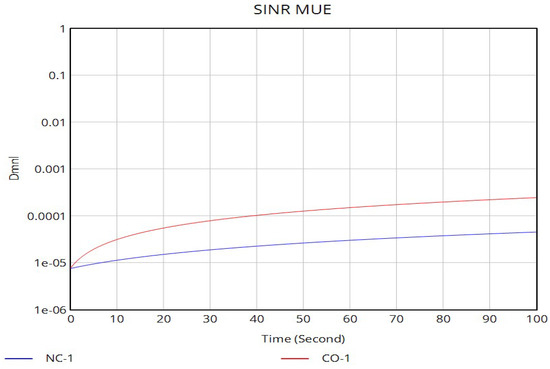
Figure 21.
Scenario 1—MUE signal-to-interference-noise ratio.
Figure 22 illustrates the SINR trajectory for MUE to simulate the noncooperative and cooperative approaches for Scenario 1, respectively abbreviated as NC-1 and CO-1. In a noncooperative approach, the MBS operates selfishly, reacting to perceived SINR drops by immediately increasing its own transmit power. The result of this is a positive feedback loop of escalating interference. The MBS then responds by increasing its own power, which in turn increases interference to the MUEs, forcing another round of power increases. The result is an increase on the SINR–time graph. This behavior leads to periods of acceptable performance punctuated by sudden drops in quality, resulting in poor reliability. Furthermore, the system exhibits significant inefficiency as the power race consumes excess energy and creates a high-interference environment that limits overall network capacity.
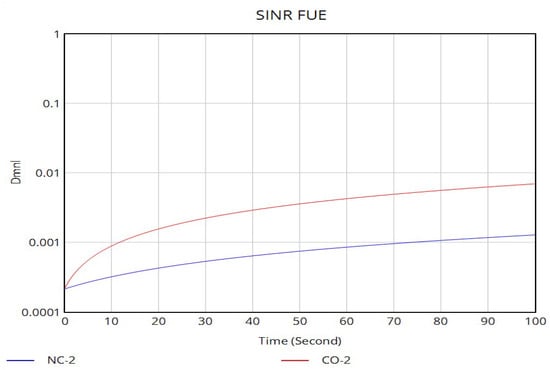
Figure 22.
Scenario 2—FUE signal-to-interference-noise ratio.
In contrast, the cooperative approach demonstrates a superior performance profile, as observed in Figure 22. The noncooperative and cooperative approaches are represented as NC-2 and CO-2, respectively. The SINR graphs show similar patterns for both approaches. However, the cooperative strategy yields higher average SINR values compared to the noncooperative strategy. This is achieved using proportional control algorithms, where power adjustments are finely tuned to the magnitude of the SINR error rather than applying fixed-step changes. The cooperative system inherently accounts for the mutual interference between network tiers; when the MBS detects falling MUE SINR, it calculates a precise power adjustment that balances the need to improve its user’s signal while considering the impact on nearby femtocells. The result is a stable equilibrium where the FUE SINRs settle at or very near their target values with minimal fluctuation. This stability translates directly into enhanced quality of service, predictable network performance, and significantly improved energy efficiency as base stations avoid the wasteful power-racing behaviors of the noncooperative strategy. The cooperative approach thus transforms the network from a collection of competing entities into a harmonized system that maximizes overall capacity and reliability.
6.2.2. Power Trajectories over Time
The analysis of the MBS and FAP transmit powers over time in the VENSIM PLE simulations reveals divergent behaviors between the noncooperative and cooperative power control schemes. As observed in Figure 23, the noncooperative approach exhibits a persistent and destructive “power race” over the cooperative approach for MBS and FAP.
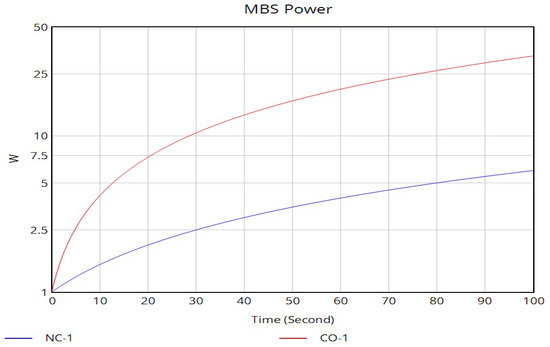
Figure 23.
Scenario 1—MBS power trajectories.
MBS selfishly increases its power to combat macrocell interference and serve its user. This action inadvertently raises the noise floor for MUEs, triggering the MBS to respond with its own power increase. This action, in turn, degrades the MUE’s signal environment, forcing another MUE power boost. The result is a persistent increase, where both transmitters cyclically overshoot their required power levels, never reaching equilibrium. This behavior leads to significant energy waste and creates a highly unstable interference environment.
The VENSIM results in Figure 24 show smooth rapid convergence of FAP power to stable optimal equilibrium points for Scenario 2. The key innovation lies in the proportional feedback mechanism, which enables intelligent power negotiation between network layers. The MBS, recognizing its dominant position in the network, can strategically reduce transmit power to minimize interference to femtocells, while the FAP makes precisely calibrated power increases to maintain its user’s QoS without causing unnecessary interference. This creates a negative feedback loop that drives the system toward a balanced state. The power–time graphs would show MBS power descending to a lower sustainable level and FAP power settling at a moderate value, with both curves achieving steady-state conditions without oscillation. This cooperative equilibrium represents the most energy-efficient configuration that satisfies all users’ SINR requirements, dramatically reducing overall network power consumption while eliminating destructive power fluctuations, ultimately leading to a stable, efficient, and sustainable heterogeneous network.
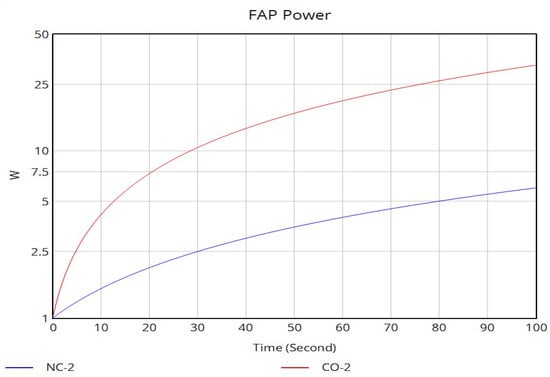
Figure 24.
Scenario 2—FAP power trajectories.
6.2.3. MUE and FUE Spectral Efficiency Evaluation over Time
Spectral efficiency (SE), measured in bits per second per Hertz (bps/Hz), is a critical performance metric that defines the data rate achievable within a given bandwidth. Figure 25 and Figure 26 show the results from the VENSIM PLE simulations that demonstrate a profound difference in how noncooperative and cooperative power control approaches impact spectral efficiency over time in a 5G NR heterogeneous network.
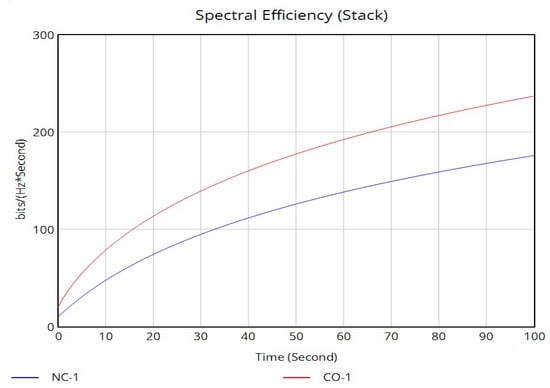
Figure 25.
Scenario 1—MUE spectral efficiency.
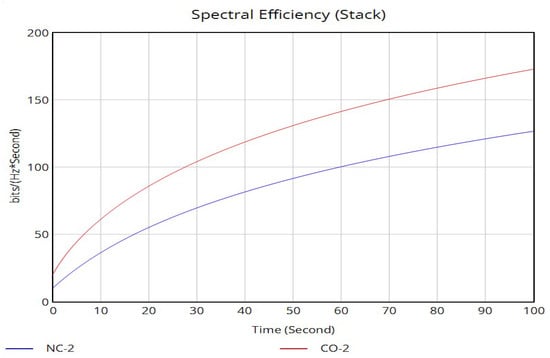
Figure 26.
Scenario 2—FUE spectral efficiency.
In the noncooperative power control approach, SE for both MUEs and FUEs exhibits highly unstable and suboptimal performance over time. This instability stems directly from the oscillatory power transmission patterns of the MBS and FAP, which create a constantly fluctuating interference environment. As shown in the power–time graphs, when each network element selfishly adjusts its transmit power without coordination, it triggers a destructive positive feedback loop: the FAP increases power to improve FUE signal quality, which consequently raises interference levels for MUEs, prompting the MBS to increase its power, which then degrades the FUE signal environment again. This endless “power race” results in periodic spikes and troughs in the SINR graphs, which translate directly into corresponding fluctuations in spectral efficiency according to the fundamental relationship . Consequently, the network operates at peak spectral efficiency only intermittently, with frequent periods where efficiency drops significantly below theoretical capacity, resulting in poor average spectral efficiency and unreliable data service.
Conversely, the cooperative power control approach achieves dramatically superior spectral efficiency over time. The VENSIM results show that, after a brief convergence period, both MUE and FUE spectral efficiency metrics stabilize at near-optimal levels and maintain this equilibrium consistently. This performance advantage emerges from the coordinated power management between network tiers, where the MBS and FAP dynamically adjust their transmit powers to find the Pareto-optimal balance between desired signal strength and generated interference. The proportional control algorithm enables precise power adjustments that drive the system toward an equilibrium where both MUE and FUE SINR values converge to their targets, as clearly visible in the smooth SINR–time graphs. This stability in SINR translates directly into stable high spectral efficiency since the logarithmic relationship between SINR and spectral efficiency means that maintaining consistent SINR near target values maximizes overall capacity. The cooperative approach therefore enables the network to achieve significantly higher average spectral efficiency while eliminating the destructive oscillations that characterize the noncooperative approach, ultimately maximizing the utilization of scarce spectral resources in 5G NR deployments.
The comparative analysis clearly demonstrates that cooperative power control not only resolves interference issues but also fundamentally transforms the network’s spectral efficiency profile from unstable and inefficient to stable and optimal, making it essential for maximizing capacity in 5G NR heterogeneous networks.
6.2.4. Energy Efficiency over Time
The analysis of energy efficiency (EE) over time, as modeled in VENSIM PLE, reveals a stark contrast between the noncooperative and cooperative power control approaches in a 5G NR heterogeneous network. Figure 27 and Figure 28 show average energy efficiency vs. iterations under both power control strategies. Higher EE implies more efficient use of power resources—especially critical for green 5G networks. Cooperative EE shows higher average EE, indicating better coordination and reduced waste. More efficient use of electricity resources is implied by higher EE, which is particularly important for green 5G networks. Selfish power maximization is the reason for greater fluctuations in noncooperative EE. The centralized EE shows poor energy efficiency. In general, centralized and noncooperative systems have poor energy usage. Cooperative EE achieves higher average EE, which suggests improved coordination and less waste.
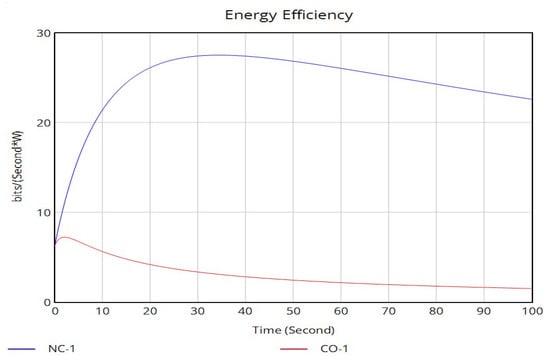
Figure 27.
Scenario 1—MUE energy efficiency.
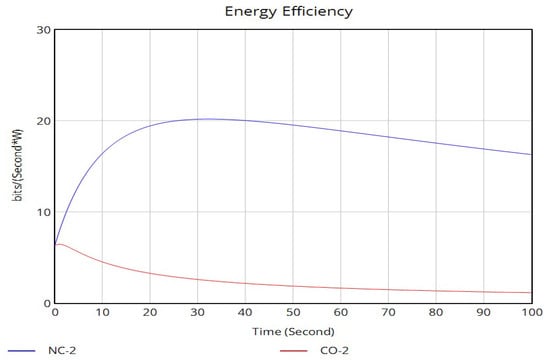
Figure 28.
Scenario 2—FUE energy efficiency.
In the noncooperative approach, the energy efficiency profile is highly erratic and fundamentally inefficient. The selfish reactive nature of the fixed-step algorithm triggers a perpetual “power race” between the FAP and the MBS. As each entity independently boosts transmit power to overcome rising interference from the other, it directly causes the very interference it seeks to mitigate. This results in a positive feedback loop of escalating power consumption, where both the FAP and MBS transmit at unnecessarily high levels for prolonged periods. This inefficiency is compounded during periods of oscillation around the target SINR, where power is constantly being increased and decreased without ever settling at an optimal minimum, leading to poor energy efficiency that deteriorates over time.
The results in Figure 27 and Figure 28 demonstrate that the cooperative power control approach establishes a vastly superior and stable energy efficiency trajectory. The key to its performance lies in its use of proportional feedback control, which enables precise minimal power adjustments tailored to the exact need. Instead of a blind power race, the cooperative system finds an elegant equilibrium: the MBS, recognizing that its signal is overpowered and causing undue interference to femtocells, can strategically reduce transmit power. Simultaneously, the FAP only increases its power by the precise amount necessary to compensate for its user’s SINR, avoiding excessive and wasteful transmissions. Over time, the VENSIM simulation shows that the total aggregate network power consumption rapidly converges to a steady-state minimum. This convergence represents the most energy-efficient operating point that satisfies the quality-of-service requirements for all users. The power graphs for both the FAP and MBS would show smooth asymptotic settling to these optimal levels, with no oscillations. Therefore, the cooperative approach not only resolves interference but also transforms the network into an energy-conscious system, minimizing its carbon footprint and operational costs while maintaining high performance, a critical achievement for sustainable 5G NR deployments.
7. Model Validation with SINR and Spectral Efficiency Dynamics
Performing a sensitivity analysis of a game-theoretic system dynamics (SD) model helps to identify which parameters most significantly affect model outcomes. This is critical for validating the robustness of a model and optimizing system performance [78,79] using model parameters. The models incorporated parameters such as power trajectories, SINR, and SE to perform sensitivity and validation. A standard methodology for simulation model validation, as noted in [78], involves comparing model outputs against historical data. However, the historical data is not always available to conduct validation, as is the case in this study. Thus, the behavior sensitivity method [80,81] is adopted. This method compares the dynamic behaviors of the research model with the predefined scenario(s).
Thus, the validity of the model is tested by evaluating the performance of SINR to SE. The Scenario 2 table data for each parameter was extracted from VENSIM simulations. The data was exported to Excel 2016 (v.16.0) to graphically observe changes in SINR against SE. The result of this evaluation is discussed in the subsections that follow.
7.1. Temporal Dynamics Revealed by SINR and SE Line Plots
The time-series line plots shown in Figure 29 provide crucial insights into the dynamic performance evolution of both cooperative and noncooperative strategies. The cooperative approach demonstrates consistently superior SINR values throughout the entire temporal domain. This confirms effective interference mitigation through coordinated transmission schemes. Furthermore, this persistent advantage suggests that the cooperative framework successfully manages cross-tier interference between femtocell and macrocell networks, maintaining stable signal quality even as channel conditions vary over time. The near-parallel trajectories of both cooperative and noncooperative curves reveal similar temporal characteristics but with significantly differing magnitude scales. This implies that, while both strategies respond to the same underlying channel variations, the cooperative approach achieves fundamentally better performance levels.
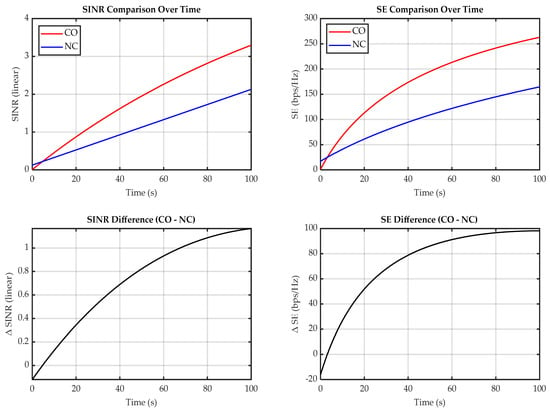
Figure 29.
SINR and SE performance under power control approaches.
The spectral efficiency comparison reveals the universal and robust performance superiority of the cooperative strategy, which maintains higher bandwidth utilization and exclusively positive differential gains (ΔSINR and ΔSE) across all time intervals regardless of dynamic network conditions. However, this performance advantage comes at a significant computational cost: cooperative strategies are highly complex, requiring the solution of a centralized optimization problem that scales polynomially or worse (O(N2) or higher), thereby limiting their practical application to smaller networks. In contrast, noncooperative strategies, while yielding lower spectral efficiency, are computationally efficient due to their distributed nature, scaling linearly with the network size (O(N)) and making them viable for large-scale deployments.
In addition to the temporal dynamics discussed above, the results in Figure 29 may be used to validate the credibility of the VENSIM PLE model. This is important, particularly when comparing noncooperative and cooperative power control approaches in a 5G NR heterogeneous network. The core validation step involved verifying the mathematical fidelity of the Shannon–Hartley theorem implementation, where SE is calculated as in the linear domain. This was tested by exporting time-series data for SINR and SE from VENSIM. For every time step, the SE value was computationally derived from its corresponding SINR value, with discrepancies tolerated within floating-point precision limits. For the noncooperative model, validation focused on ensuring that the SINR values—driven by fixed-step power adjustments—produced corresponding SE values, with amplitudes and phases aligning exactly as theorized. The model confirmed that the SE values coincided precisely with SINR values during interference spikes. As shown in Figure 29, the SE values matched SINR values during transient power surpluses, thereby validating the dynamic coupling between these variables under all test conditions.
7.2. Statistical Distribution Analysis from Box Plots
The box plots shown in Figure 30 offer a comprehensive statistical characterization of the performance distributions for both strategies. The cooperative approach exhibits a significantly higher median SINR value with a substantially higher interquartile range (IQR), indicating not only better average performance but also more consistent signal quality. This increased variability demonstrates the cooperative strategy’s weakness in maintaining stable communication quality in moments of fluctuating environmental conditions while also showing a higher IQR and greater maximum use of the available bandwidth. This ensures that the network operates continuously at its highest possible data density. This reliability is critical for supporting demanding 5G applications like enhanced mobile broadband (eMBB) and massive IoT, where consistent high throughput is essential. This is also valuable for maintaining QoS in heterogeneous network environments.
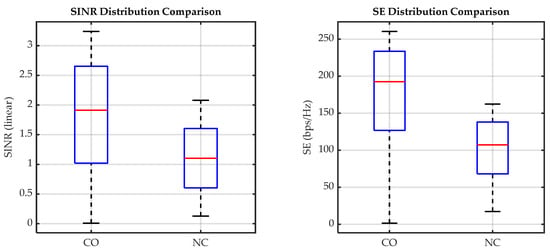
Figure 30.
SINR and SE distribution box plots.
The SE distribution subplot reveals the true value of cooperation and explains the apparent paradox of achieving more with less (lower SINR). Despite the reduction in median SINR, the cooperative strategy demonstrates a higher median SE. This is a direct consequence of the Shannon–Hartley theorem (), which is highly concave. The cooperative algorithm maximizes total network capacity by operating on the steepest part of this curve; it dramatically improves the SINR for the worst-off users (moving them from near-zero out-of-service SINR levels to operational levels), which yields a massive gain in their SE. This gain far outweighs the smaller SE loss for the high-SINR users whose power was reduced. This is visually confirmed by the SE box plot, which shows the cooperative scenario having a higher median, a higher lower whisker (indicating a better minimum experience), and a compressed distribution. The increase in the mean SE value in the statistical summary in Table 5, coupled with a likely decrease in its standard deviation, is the ultimate evidence that the cooperative strategy successfully trades individual peak performance for superior and fairer overall network capacity.

Table 5.
Calculating PCE-based Sobol’ indices up to order 1—statistical summary. SE_c—max S1: 0.2000; max ST: 0.2000.
For SE, the cooperative strategy similarly shows a superior central tendency with a tighter distribution around the mean value. The reduced spread indicates more predictable resource utilization and better bandwidth management. In contrast, the noncooperative approach displays a broader performance distribution with longer whiskers, reflecting higher susceptibility to interference and less efficient resource allocation. The presence of more extreme values in the noncooperative box plot underscores its vulnerability to adverse conditions and its inability to maintain consistent performance levels. These statistical differences quantitatively demonstrate how cooperative strategies transform the performance distribution, shifting it toward higher values while simultaneously reducing variance.
7.3. Multivariate Relationships in Scatter Matrix Plots
The scatter matrix plots shown in Figure 31 and Figure 32 reveal intricate multivariate relationships between different performance metrics and strategies. The strong positive correlation (r) between cooperative and noncooperative SINR values (r = 0.9955) indicates that both strategies respond similarly to underlying channel conditions, but the cooperative approach achieves consistently higher performance levels. This parallel behavior suggests that environmental factors affect both strategies comparably, but the cooperative framework adds substantial performance gains through intelligent interference management and resource coordination.
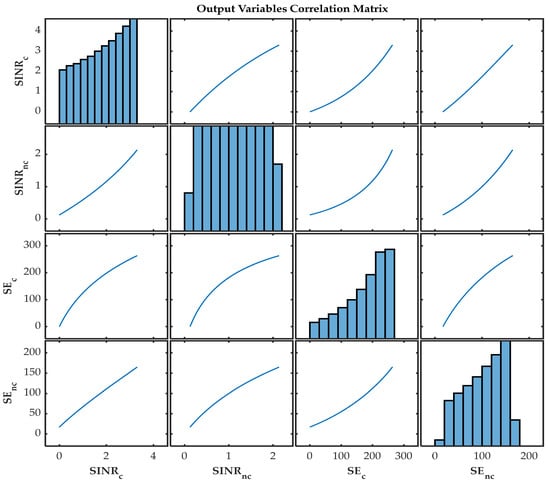
Figure 31.
Scatter matrix to illustrate SINR and SE relationship.
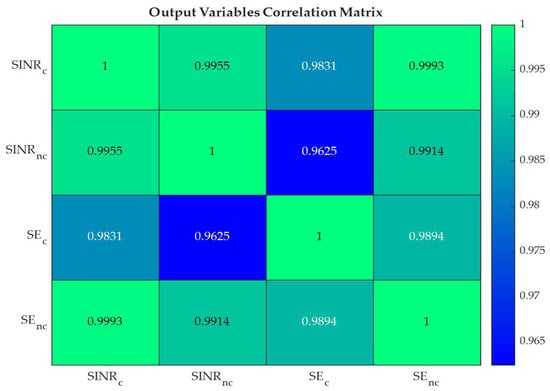
Figure 32.
SINR and SE correlation matrix.
The correlation structure between SINR and SE provides particularly valuable insights. The cooperative strategy demonstrates a stronger, more linear relationship between SINR and SE (r = 0.9993), indicating that signal quality improvements directly and predictably translate into better bandwidth utilization. In contrast, the noncooperative approach shows a weaker correlation (r = 0.9625), suggesting that interference and resource contention disrupt the expected relationship between signal quality and SE. This disruption manifests as increased scatter in the data points, reflecting the noncooperative strategy’s inability to consistently convert good signal conditions into efficient bandwidth usage.
The cross-strategy correlations reveal that, while both approaches operate in the same environment and face similar challenges, the cooperative strategy achieves fundamentally better and more deterministic performance outcomes. The multivariate analysis confirms that cooperation benefits are consistent across different performance metrics and are not merely isolated improvements in specific areas. This comprehensive correlation structure validates that cooperative strategies provide holistic enhancements to network performance through coordinated interference management, efficient resource allocation, and stable quality-of-service maintenance.
7.4. Integrated Technical Implications and Recommendations
The combined analysis from all three visualization techniques conclusively demonstrates that cooperative strategies provide significant, stable, and comprehensive performance advantages over noncooperative approaches. The temporal stability observed in the line plots, coupled with the improved statistical distributions shown in the box plots and the coherent multivariate relationships revealed in the scatter matrix, present a compelling case for implementing cooperative frameworks in femtocell–macrocell heterogeneous networks. These technical findings suggest that the additional complexity of coordination mechanisms is justified by substantial and reliable performance gains across multiple dimensions of network operation.
The results indicate that cooperative strategies achieve approximately 58.82% higher median SINR and 69.03% better spectral efficiency. These improvements translate to more predictable quality of service, better resource utilization, and enhanced overall network efficiency. For practical implementation, these findings support deploying cooperative interference management schemes, particularly in environments with dynamic user distributions and varying traffic patterns. The consistent temporal advantages and statistical stability make cooperative approaches particularly valuable for maintaining service quality in challenging network conditions where noncooperative strategies would struggle to provide reliable performance.
8. Practical Implications for Network Operators in Real 5G NR Deployments
The integrated game-theoretic and system dynamics model provides a practical decision-support tool for network operators. This can be used to guide the implementation of dynamic power control strategies in real 5G NR deployments. The model can be useful when operators want to perform predictive policy tuning using system dynamics modeling. Before rolling out new hardware or a network slice, operators can simulate the long-term impact of different power control parameters (e.g., utility function weights and pricing factors). For example, an operator can simulate how a gradual increase in the femtocell deployments in a neighborhood will affect the macrocell stability and overall network capacity over a specific period. This allows for proactive capacity planning and parameter optimization (e.g., adjusting the alpha cost parameter in the utility function) to avoid future congestion or interference issues.
9. Discussion
Combining game theory and system dynamics (SD) offers a broader, more holistic perspective on network behavior. While game theory focuses on individual agents’ behavior (players), SD models the feedback and dynamics within the whole system, providing insights into long-term trends and collective behavior.
In 5G NR networks, interference and power control are dynamic in nature due to fluctuating user traffic, mobility, and varying environmental conditions. By integrating game theory into SD, the model can better capture the adaptive strategies of players, for example, base stations or users over time.
SD’s focus on feedback loops makes it ideal for modeling complex interdependencies. For example, interference in one cell can affect others, which in turn alters the power decisions of base stations. Game-theoretic solutions within SD can explicitly model feedback in a more granular way, showing how decisions influence system-wide outcomes.
With SD, different policies for cooperation or noncooperation can be tested in a simulated environment before implementation. This allows for a deeper understanding of trade-offs and the evaluation of alternative strategies in interference management without real-world trials.
System dynamics is particularly suited for analyzing long-term effects. In the context of power control, SD models can demonstrate how game-theoretic strategies evolve and affect network performance in the long run, revealing potential stability or instability.
Game-theoretic models allow for the consideration of different strategic decisions (cooperative vs. noncooperative), while SD models can simulate the effects of these strategies over time. This enables testing a wide array of scenarios and exploring potential outcomes under different circumstances.
The combination of game theory and system dynamics is not without limitations. One of the primary limitations is the complexity of integrating both game theory and system dynamics. As the number of players or agents increases, the number of variables and interactions also grows, leading to computational challenges. This can make the simulation of large-scale systems computationally expensive and hard to scale.
SD models often rely on simplifications or assumptions about system behavior (e.g., linearity of relationships and fixed parameters), which may not always hold in real-world settings. Similarly, game theory models may make assumptions about rational behavior or the availability of complete information, which could differ from real-world scenarios.
Game-theoretic models often rely on the concept of equilibrium (Nash equilibrium), but, in dynamic systems, these equilibria may not exist or may be difficult to find. In the presence of time-varying conditions and feedback, achieving a stable equilibrium is not guaranteed, leading to instability or oscillations in power control strategies.
Game-theoretic approaches assume rational decision-making based on utility maximization. However, in real-world settings, players (e.g., base stations or users) may act irrationally due to imperfect information, bounded rationality, or external factors, which could limit the accuracy of the predictions made by the game-theoretic model.
While game-theoretic models are useful for understanding optimal strategies, convergence to equilibrium in a dynamic setting can be slow. The feedback mechanisms in SD models may cause delays in reaching a stable solution, which may not be ideal for time-sensitive systems like 5G NR, where rapid adaptation is needed.
The tension between local (individual base station or user) and global (system-wide) optimization can complicate modeling. In a noncooperative game, each player aims to optimize their utility independently, but the SD model requires a system-wide view. Aligning these two perspectives can be challenging.
SD models are highly sensitive to the parameters chosen, for example, power adjustment rates and interference levels. Small changes in these parameters can lead to drastically different outcomes. Similarly, game-theoretic strategies can be sensitive to the assumptions of utility functions, player behavior, and the structure of the game.
System dynamics modeling often focuses on simulating the system’s evolution over time, but, in real-world 5G networks, real-time power control adjustments are required. Integrating real-time adaptation into an SD model with game-theoretic elements may be computationally expensive or require simplifications that reduce the model’s applicability in real-world deployment.
10. Conclusions and Future Work
This study demonstrates the power of combining game theory and system dynamics modeling to address the complex problem of interference management among macro- and femtousers in 5G NR networks. The model implementation considered both cooperative and noncooperative game-theoretic theories. We considered two scenarios to evaluate the model. The first scenario dealt with interference on femtocell user equipment due to signals from neighboring macrocell base stations (cross-tier interference). The second scenario considered interference on femtocell user equipment due to signals from neighboring femtocell access points (co-tier interference). In both scenarios, the cooperative strategy performed better compared to the noncooperative strategy.
This paper presents an innovative approach that integrates noncooperative and cooperative game-theoretic power control models within a system dynamics framework using VENSIM. While this provides a powerful proof of concept, it opens several promising avenues for future research. First, a critical next step is the development of a hybrid context-aware switching mechanism that can dynamically transition between noncooperative and cooperative modes based on real-time network state indicators like user density and traffic volatility. Second, to enhance practical applicability, future work should focus on implementing and testing distributed consensus algorithms. A relevant example of this is the application of using the Alternating Direction Method of Multipliers—ADMM), which approximates the performance of the centralized cooperative model without its prohibitive signaling overhead. Finally, the framework should be extended to incorporate multi-objective optimization, formally trading off key performance indicators, such as energy efficiency, spectral efficiency, and user fairness, and evaluating these trade-offs in emerging 6G scenarios, like cell-free massive MIMO and integrated sensing and communication (ISAC) networks.
Author Contributions
Conceptualization, N.R.N. and M.S.; methodology, N.R.N. and M.S.; investigation, N.R.N. and M.S.; resources, N.R.N. and M.S.; software, N.R.N.; validation, N.R.N.; supervision, M.S. and T.P.; visualization, N.R.N.; writing—original draft, N.R.N., T.P., and M.S.; writing—review and editing, N.R.N., T.P., and M.S. All authors have read and agreed to the published version of the manuscript.
Funding
This research received no external funding.
Institutional Review Board Statement
The study did not require ethical approval.
Data Availability Statement
The original contributions presented in this study are included in the article. Further inquiries can be directed to the corresponding author.
Acknowledgments
During the preparation of this manuscript, the authors used ChatGPT (GPT-4.1) for the purposes of developing noncooperative and cooperative game-theoretic simulations—within the framework of system dynamics. The authors have reviewed and edited the output and have taken full responsibility for the content of this publication.
Conflicts of Interest
The authors declare no conflict of interest.
Abbreviations
The following abbreviations are used in this manuscript:
| 5G NR | Fifth-Generation New Radio |
| AWGN | Additive White Gaussian Noise |
| CLD | Causal Loop Diagram |
| CTI | Cross-Tier Interference |
| FAP | Femto Access Point |
| FUE | Femtouser Equipment |
| HetNets | Heterogeneous Networks |
| LTE-A | Long-Term Evolution Advanced |
| MBS | Macrobase Station |
| MIMO | Multiple-Input Multiple-Output |
| MUE | Macrouser Equipment |
| QoE | Quality of Experience |
| QoS | Quality of Service |
| SINR | Signal-to-Interference-Noise Ratio |
| TS 38.211 | Technical Specification Reference 38.211 |
| VENSIM | Ventana Simulation System |
References
- Serôdio, C.; Cunha, J.; Candela, G.; Rodriguez, S.; Sousa, X.R.; Branco, F. The 6G Ecosystem as Support for IoE and Private Networks: Vision, Requirements, and Challenges. Future Internet 2023, 15, 348. [Google Scholar] [CrossRef]
- Mushtaq, M.I.; Chughtai, O.; Naeem, M. Intelligent Priority-Driven Resource Allocation for Efficient Management in Heterogeneous Networks. In Proceedings of the 2024 International Conference on Frontiers of Information Technology (FIT), Islamabad, Pakistan, 9–10 December 2024; pp. 1–6. [Google Scholar]
- Odida, M.O. The Evolution of Mobile Communication: A Comprehensive Survey on 5G Technology. J. Sens. Netw. Data Commun. 2024, 4, 1–11. [Google Scholar]
- Siddiqui, M.U.A.; Qamar, F.; Ahmed, F.; Nguyen, Q.N.; Hassan, R. Interference Management in 5G and Beyond Network: Requirements, Challenges and Future Directions. IEEE Access 2021, 9, 68932–68965. [Google Scholar] [CrossRef]
- Pons, M.; Valenzuela, E.; Rodríguez, B.; Nolazco-Flores, J.A.; Del-Valle-Soto, C. Utilization of 5G Technologies in IoT Applications: Current Limitations by Interference and Network Optimization Difficulties—A Review. Sensors 2023, 23, 3876. [Google Scholar] [CrossRef]
- Chauhan, V.; Srinivasans. A Review on 5G Network System with its limitation and different Approaches to build strong 5G Network System. In Proceedings of the 2022 3rd International Conference on Intelligent Engineering and Management (ICIEM), London, UK, 27–29 April 2022; pp. 403–410. [Google Scholar]
- Hasimah, Z.S. Introduction to System Dynamic Modelling and Vensim Software; Universiti Utara Malaysia Press: Sintok, Malaysia, 2017. [Google Scholar]
- Kirkwood, C.W. Business Process Analysis Workshops: System Dynamics Models; Department of Management, Arizona State University: Tempe, AZ, USA, 1998. [Google Scholar]
- Coyle, R.G. System Dynamics Modelling: A Practical Approach. J. Oper. Res. Soc. 1997, 48, 544. [Google Scholar] [CrossRef]
- Dulaj, K.; Alhammadi, A.; Shayea, I.; El-Saleh, A.A.; Alnakhli, M. Harnessing Machine Learning for Intelligent Networking in 5G Technology and Beyond: Advancements, Applications and Challenges. IEEE Open J. Intell. Transp. Syst. 2025, 6, 605–633. [Google Scholar] [CrossRef]
- Gbenga-Ilori, A.; Imoize, A.L.; Noor, K.; Adebolu-Ololade, P.O. Artificial Intelligence Empowering Dynamic Spectrum Access in Advanced Wireless Communications: A Comprehensive Overview. AI 2025, 6, 126. [Google Scholar] [CrossRef]
- Alzubaidi, O.T.H.; Alheejawi, S.; Hindia, M.N.; Dimyati, K.; Noordin, K.A. Interference Mitigation Strategies in Beyond 5G Wireless Systems: A Review. Electronics 2025, 14, 2237. [Google Scholar] [CrossRef]
- He, J.; Liu, Z.; Zhang, Y.; Jin, Z.; Zhang, Q. Power Allocation Based on Federated Multiagent Deep Reinforcement Learning for NOMA Maritime Networks. IEEE Internet Things J. 2025, 12, 12869–12884. [Google Scholar] [CrossRef]
- Seid, A.M.; Erbad, A.; Abishu, H.N.; Albaseer, A.; Abdallah, M.; Guizani, M. Blockchain-Empowered Resource Allocation in Multi-UAV-Enabled 5G-RAN: A Multi-Agent Deep Reinforcement Learning Approach. IEEE Trans. Cogn. Commun. Netw. 2023, 9, 991–1011. [Google Scholar] [CrossRef]
- Al-Saadi, M.; Al-Greer, M.; Short, M. Reinforcement Learning-Based Intelligent Control Strategies for Optimal Power Management in Advanced Power Distribution Systems: A Survey. Energies 2023, 16, 1608. [Google Scholar] [CrossRef]
- Jafari, M.; Kavousi-Fard, A.; Dabbaghjamanesh, M.; Karimi, M. A Survey on Deep Learning Role in Distribution Automation System: A New Collaborative Learning-to-Learning (L2L) Concept. IEEE Access 2022, 10, 81220–81238. [Google Scholar] [CrossRef]
- Nasir, Y.S.; Guo, D. Multi-agent deep reinforcement learning for dynamic power allocation in wireless networks. IEEE J. Sel. Areas Commun. 2019, 37, 2239–2250. [Google Scholar] [CrossRef]
- Sun, Y.; Peng, M.; Zhou, Y.; Huang, Y.; Mao, S. Application of machine learning in wireless networks: Key techniques and open issues. IEEE Commun. Surv. Tutor. 2019, 21, 3072–3108. [Google Scholar] [CrossRef]
- Pan, Y.; Pan, C.; Yang, Z.; Chen, M. Resource allocation for D2D communications underlaying a NOMA-based cellular network. IEEE Wirel. Commun. Lett. 2017, 7, 130–133. [Google Scholar] [CrossRef]
- Chincoli, M.; Liotta, A. Self-learning power control in wireless sensor networks. Sensors 2018, 18, 375. [Google Scholar] [CrossRef]
- Yoon, T.; Nguyen, T.H.; Nguyen, X.T.; Yoo, D.; Jang, B.; Nguyen, V.D. Resource allocation for NOMA-based D2D systems coexisting with cellular networks. IEEE Access 2018, 6, 66293–66304. [Google Scholar] [CrossRef]
- Selim, M.M.; Rihan, M.; Yang, Y.; Huang, L.; Quan, Z.; Ma, J. On the outage probability and power control of D2D underlaying NOMA UAV-assisted networks. IEEE Access 2019, 7, 16525–16536. [Google Scholar] [CrossRef]
- Xiao, J.; Yang, C.; Anpalagan, A.; Ni, Q.; Guizani, M. Joint interference management in ultra-dense small-cell networks: A multi-domain coordination perspective. IEEE Trans. Commun. 2018, 66, 5470–5481. [Google Scholar] [CrossRef]
- Yang, Z.; Xu, W.; Pan, Y.; Pan, C.; Chen, M. Optimal fairness-aware time and power allocation in wireless powered communication networks. IEEE Trans. Commun. 2018, 66, 3122–3135. [Google Scholar] [CrossRef]
- Madani, N.; Sodagari, S. Performance analysis of non-orthogonal multiple access with underlaid device-to-device communications. IEEE Access 2018, 6, 39820–39826. [Google Scholar] [CrossRef]
- Sboui, L.; Rezki, Z.; Sultan, A.; Alouini, M.-S. A new relation between energy efficiency and spectral efficiency in wireless communications systems. IEEE Wirel. Commun. 2019, 26, 168–174. [Google Scholar] [CrossRef]
- Elhattab, M.; Arfaoui, M.A.; Assi, C.; Ghrayeb, A. Reconfigurable Intelligent Surface Enabled Full-Duplex/Half-Duplex Cooperative Non-Orthogonal Multiple Access. IEEE Trans. Wirel. Commun. 2022, 21, 3349–3364. [Google Scholar] [CrossRef]
- Wang, Y.; Feng, G.; Sun, Y.; Qin, S.; Liang, Y.-C. Decentralized learning based indoor interference mitigation for 5G-and-beyond systems. IEEE Trans. Veh. Technol. 2020, 69, 12124–12135. [Google Scholar] [CrossRef]
- Liu, L.; Cheng, Y.; Cao, X.; Zhou, S.; Niu, Z.; Wang, P. Joint Optimization of Scheduling and Power Control in Wireless Networks: Multi-Dimensional Modeling and Decomposition. IEEE Trans. Mob. Comput. 2019, 18, 1585–1600. [Google Scholar] [CrossRef]
- Du, J.; Yu, F.R.; Lu, G.; Wang, J.; Jiang, J.; Chu, X. MEC-assisted immersive VR video streaming over terahertz wireless networks: A deep reinforcement learning approach. IEEE Internet Things J. 2020, 7, 9517–9529. [Google Scholar] [CrossRef]
- Zhang, X.; Peng, M.; Yan, S.; Sun, Y. Deep-reinforcement-learning-based mode selection and resource allocation for cellular V2X communications. IEEE Internet Things J. 2019, 7, 6380–6391. [Google Scholar] [CrossRef]
- Meng, F.; Chen, P.; Wu, L.; Cheng, J. Power allocation in multi-user cellular networks: Deep reinforcement learning approaches. IEEE Trans. Wirel. Commun. 2020, 19, 6255–6267. [Google Scholar] [CrossRef]
- Zhang, H.; Feng, M.; Long, K.; Karagiannidis, G.K.; Leung, V.C.M.; Poor, H.V. Energy efficient resource management in SWIPT enabled heterogeneous networks with NOMA. IEEE Trans. Wirel. Commun. 2019, 19, 835–845. [Google Scholar] [CrossRef]
- Liu, D.; Simeone, O. Privacy for Free: Wireless Federated Learning via Uncoded Transmission with Adaptive Power Control. IEEE J. Sel. Areas Commun. 2020, 39, 170–185. [Google Scholar] [CrossRef]
- Foschini, G.J.; Miljanic, Z. A simple distributed autonomous power control algorithm and its convergence. IEEE Trans. Veh. Technol. 1993, 42, 641–646. [Google Scholar] [CrossRef]
- Jindal, N.; Rhee, W.; Vishwanath, S.; Jafar, S.A.; Goldsmith, A. Sum power iterative water-filling for multi-antenna Gaussian broadcast channels. IEEE Trans. Inf. Theory 2005, 51, 1570–1580. [Google Scholar] [CrossRef]
- Meshkati, F.; Chiang, M.; Poor, H.V.; Schwartz, S.C. A game-theoretic approach to energy-efficient power control in multicarrier CDMA systems. IEEE J. Sel. Areas Commun. 2006, 24, 1115–1129. [Google Scholar] [CrossRef]
- Song, L.; Han, Z.; Zhang, Z.; Jiao, B. Non-Cooperative Feedback-Rate Control Game for Channel State Information in Wireless Networks. IEEE J. Sel. Areas Commun. 2012, 30, 188–197. [Google Scholar] [CrossRef]
- Li, Y.; Zhang, W.; Wang, C.-X.; Sun, J.; Liu, Y. Deep Reinforcement Learning for Dynamic Spectrum Sensing and Aggregation in Multi-Channel Wireless Networks. IEEE Trans. Cogn. Commun. Netw. 2020, 6, 464–475. [Google Scholar] [CrossRef]
- Bhardwaj, A.; Chauhan, P.; Mahadik, S.; Nadarajah, N.; Marella, V.; Brijwal, A. Game Theory-Based Power Control in Cooperative Wireless Networks. In Proceedings of the 2025 International Conference on Pervasive Computational Technologies (ICPCT), Greater Noida, India, 8–9 February 2025; pp. 260–263. [Google Scholar]
- Salmon, P.M.; Stanton, N.A.; Walker, G.H.; Hulme, A.; Goode, N.; Thompson, J.; Read, G.J. Causal loop diagrams (CLDs). In Handbook of Systems Thinking Methods; CRC Press: Boca Raton, FL, USA, 2022; pp. 157–180. [Google Scholar]
- Sergiou, C.; Lestas, M.; Antoniou, P.; Liaskos, C.; Pitsillides, A. Complex Systems: A Communication Networks Perspective Towards 6G. IEEE Access 2020, 8, 89007–89030. [Google Scholar] [CrossRef]
- Tembine, H.; Altman, E.; El-Azouzi, R.; Hayel, Y. Evolutionary Games in Wireless Networks. IEEE Trans. Syst. Man Cybern. Part B (Cybern.) 2010, 40, 634–646. [Google Scholar] [CrossRef] [PubMed]
- Han, Z. Game Theory in Wireless and Communication Networks: Theory, Models, and Applications; Cambridge University Press: Cambridge, UK, 2012. [Google Scholar]
- Kuang, Z.; Zhang, L.; Zhao, L. Energy- and Spectral-Efficiency Tradeoff with α-Fairness in Energy Harvesting D2D Communication. IEEE Trans. Veh. Technol. 2020, 69, 9972–9983. [Google Scholar] [CrossRef]
- Forrester, J.W. The Beginning of System Dynamics; McKinsey: New York, NY, USA, 1995; pp. 4–17. [Google Scholar]
- Hussain, S.R.; Odeh, A.; Shivakumar, A.; Chauhan, S.; Harfoush, K. Real-time traffic congestion management and deadlock avoidance for vehicular ad Hoc networks. In Proceedings of the 2013 High Capacity Optical Networks and Emerging/Enabling Technologies, Magosa, Cyprus, 11–13 December 2013; pp. 223–227. [Google Scholar]
- Akinlabi, O.A. Constrained Optimization of Femtocell Deployment in Cellular Network. Ph.D. Thesis, University of Johannesburg, Johannesburg, South Africa, 2012. [Google Scholar]
- 3GPP. Study on Channel Model for Frequencies from 0.5 to 100 GHz; 3rd Generation Partnership Project (3GPP): Nice, France, 2020; Volume TR 38.901. [Google Scholar]
- Klymash, M.; Kyryk, M.; Pleskanka, N.; Yanyshyn, V. Data Buffering Multilevel Model at a Multiservice Traffic Service Node. Korea Acad. Ind. Coop. Soc. 2014, 4, 294–306. [Google Scholar] [CrossRef]
- Navarro-Ortiz, J.; Romero-Diaz, P.; Sendra, S.; Ameigeiras, P.; Ramos-Munoz, J.J.; Lopez-Soler, J.M. A Survey on 5G Usage Scenarios and Traffic Models. IEEE Commun. Surv. Tutor. 2020, 22, 905–929. [Google Scholar] [CrossRef]
- Tusha, A.; Arslan, H. Interference Burden in Wireless Communications: A Comprehensive Survey from PHY Layer Perspective. IEEE Commun. Surv. Tutor. 2025, 27, 2204–2246. [Google Scholar] [CrossRef]
- Shokri-Ghadikolaei, H.; Fischione, C. Millimeter Wave Ad Hoc Networks: Noise-Limited or Interference-Limited? In Proceedings of the 2015 IEEE Globecom Workshops (GC Wkshps), San Diego, CA, USA, 6–10 December 2015; pp. 1–7. [Google Scholar]
- Rebato, M.; Mezzavilla, M.; Rangan, S.; Boccardi, F.; Zorzi, M. Understanding Noise and Interference Regimes in 5G Millimeter-Wave Cellular Networks. In Proceedings of the European Wireless 2016; 22th European Wireless Conference, Oulu, Finland, 18–20 May 2016; pp. 1–5. [Google Scholar]
- Shannon, C.E. A mathematical theory of communication. Bell Syst. Tech. J. 1948, 27, 379–423. [Google Scholar] [CrossRef]
- Akyildiz, I.F.; Nie, S.; Lin, S.-C.; Chandrasekaran, M. 5G roadmap: 10 key enabling technologies. Comput. Netw. 2016, 106, 17–48. [Google Scholar] [CrossRef]
- Adedoyin, M.A.; Falowo, O.E. Combination of Ultra-Dense Networks and Other 5G Enabling Technologies: A Survey. IEEE Access 2020, 8, 22893–22932. [Google Scholar] [CrossRef]
- Borralho, R.; Mohamed, A.; Quddus, A.U.; Vieira, P.; Tafazolli, R. A Survey on Coverage Enhancement in Cellular Networks: Challenges and Solutions for Future Deployments. IEEE Commun. Surv. Tutor. 2021, 23, 1302–1341. [Google Scholar] [CrossRef]
- 3GPP. 5G; NR; User Equipment (UE) Radio Access Capabilities (3GPP TS 38.306 Version 15.3.0 Release 15); 3GPP: Nice, France, 2018; pp. 1–35. [Google Scholar]
- Series, M. Minimum requirements related to technical performance for IMT-2020 radio interface(s). Report 2017, 2410. [Google Scholar]
- Shandilya, S.; Szymanski, Z.; Shandilya, S.K.; Izonin, I.; Singh, K.K. Modeling and Comparative Analysis of Multi-Agent Cost Allocation Strategies Using Cooperative Game Theory for the Modern Electricity Market. Energies 2022, 15, 2352. [Google Scholar] [CrossRef]
- Mao, T.; Feng, G.; Liang, L.; Qin, S.; Wu, B. Distributed Energy-Efficient Power Control for Macro–Femto Networks. IEEE Trans. Veh. Technol. 2016, 65, 718–731. [Google Scholar] [CrossRef]
- Nash, J.F. Equilibrium points in n-person games. Proc. Natl. Acad. Sci. USA 1950, 36, 48–49. [Google Scholar] [CrossRef]
- Gilboa, I.; Zemel, E. Nash and correlated equilibria: Some complexity considerations. Games Econ. Behav. 1989, 1, 80–93. [Google Scholar] [CrossRef]
- Sievidova, I.; Oliynik, T.; Mandych, O.; Kvyatko, T.; Romaniuk, I.; Leshchenko, L.; Vynohradenko, S.; Plyhun, S. Optimizing the Strategy of Activities Using Numerical Methods for Determining Equilibrium. East.-Eur. J. Enterp. Technol. 2019, 6, 47–56. [Google Scholar] [CrossRef]
- Wu, D.; Cai, Y.; Zhou, L.; Zheng, Z.; Zheng, B. Cooperative Strategies for Energy-Aware Ad Hoc Networks: A Correlated-Equilibrium Game-Theoretical Approach. IEEE Trans. Veh. Technol. 2013, 62, 2303–2314. [Google Scholar] [CrossRef]
- Černý, J.; An, B.; Zhang, A.N. Quantal Correlated Equilibrium in Normal Form Games. In Proceedings of the 23rd ACM Conference on Economics and Computation; Association for Computing Machinery, New York, NY, USA, 11–15 July 2022; pp. 210–239. [Google Scholar]
- Nau, R.F.; McCardle, K.F. Coherent behavior in noncooperative games. J. Econ. Theory 1990, 50, 424–444. [Google Scholar] [CrossRef]
- Bandhu, S.; Lahkar, R. Evolutionary robustness of dominant strategy implementation. Econ. Theory 2023, 76, 685–721. [Google Scholar] [CrossRef]
- Liu, Y.; Zhang, W. Study on the Evolutionary Dynamics of the Symmetric Sequential Game without Dominant and Weakly Dominant Strategies. IAENG Int. J. Appl. Math. 2025, 55, 1916–1920. [Google Scholar]
- Julius, P.N.R. The Economics of Cooperation and Conflict; University of California: Irvine, CA, USA, 2021. [Google Scholar]
- Zamir, S. Bayesian Games: Games with Incomplete Information; Springer: Berlin/Heidelberg, Germany, 1997. [Google Scholar]
- Fudenberg, D.; Tirole, J. Game Theory; MIT Press: Cambridge, MA, USA, 1991. [Google Scholar]
- Maschler, M.; Solan, E.; Zamir, S. Game Theory, NV-1 Onl.; Cambridge University Press: Cambridge, UK, 2020. [Google Scholar]
- Ziegler, R.; Ott, K. The quality of sustainability science: A philosophical perspective. Sustain. Sci. Pract. Policy 2011, 7, 31–44. [Google Scholar] [CrossRef]
- Þorsteinsson, R.V. A System Dynamics Approach to Macroeconomics. Ph.D. Thesis, School of Engineering and Natural Sciences, Reykjavík, Iceland, 1992. [Google Scholar]
- Sterman, J.D. Business Dynamics: Systems Thinking and Modeling for a Complex World (No. HD30. 2 S7835 2000); School of Engineering and Natural Sciences: Reykjavík, Iceland, 2000. [Google Scholar]
- Hasan, K.N.; Preece, R.; Milanović, J.V. Application of game theoretic approaches for identification of critical parameters affecting power system small-disturbance stability. Int. J. Electr. Power Energy Syst. 2018, 97, 344–352. [Google Scholar] [CrossRef]
- Liu, P.; Zhang, T.; Tian, F.; Teng, Y.; Yang, M. Hybrid Decision Support Framework for Energy Scheduling Using Stochastic Optimization and Cooperative Game Theory. Energies 2024, 17, 6386. [Google Scholar] [CrossRef]
- Hekimoğlu, M.; Barlas, Y. Sensitivity analysis for models with multiple behavior modes: A method based on behavior pattern measures. Syst. Dyn. Rev. 2016, 32, 332–362. [Google Scholar] [CrossRef]
- Christopher Frey, H.; Patil, S.R. Identification and review of sensitivity analysis methods. Risk Anal. 2002, 22, 553–578. [Google Scholar] [CrossRef]
Disclaimer/Publisher’s Note: The statements, opinions and data contained in all publications are solely those of the individual author(s) and contributor(s) and not of MDPI and/or the editor(s). MDPI and/or the editor(s) disclaim responsibility for any injury to people or property resulting from any ideas, methods, instructions or products referred to in the content. |
© 2025 by the authors. Licensee MDPI, Basel, Switzerland. This article is an open access article distributed under the terms and conditions of the Creative Commons Attribution (CC BY) license (https://creativecommons.org/licenses/by/4.0/).