Article

Closed-Form Approximation to the Average Symbol Error Probability for Cross-QAM over κμ Fading Channels with Experimental Validation in the Millimeter-Wave Band

by
Wilian Eurípedes Vieira
1,
Karine Barbosa Carbonaro
2,
Gilberto Arantes Carrijo
3,
Edson Agustini
4,*,
André Antônio dos Anjos
2 and
Pedro Luiz Lima Bertarini
2,*
1
Institute of Mathematics and Statistics, Federal University of Uberlandia, Patos de Minas 38701-002, MG, Brazil
2
Faculty of Electrical Engineering, Federal University of Uberlandia, Patos de Minas 38701-002, MG, Brazil
3
Faculty of Electrical Engineering, Federal University of Uberlandia, Uberlandia 38400-902, MG, Brazil
4
Institute of Mathematics and Statistics, Federal University of Uberlandia, Uberlandia 38400-902, MG, Brazil
*
Authors to whom correspondence should be addressed.
Telecom 2025, 6(4), 72; https://doi.org/10.3390/telecom6040072
Submission received: 20 August 2025 / Revised: 19 September 2025 / Accepted: 23 September 2025 / Published: 2 October 2025

Abstract

This work presents a closed-form approximation to the symbol error probability (SEP) for cross-quadrature amplitude modulation (cross-QAM) schemes over κ μ fading channels. The proposed formulation enables accurate performance evaluation while avoiding computationally expensive numerical integration. The analysis covers millimeter-wave (mmWave) frequencies at 55, 60, and 65 GHz, under both line-of-sight (LoS) and non-line-of-sight (nLoS) conditions, and for multiple transmitter–receiver polarization configurations. A key contribution of this work is the experimental validation of the theoretical expression with real channel-measurement data, which confirms the applicability of the κ μ model in realistic mmWave scenarios. Furthermore, we perform a detailed parametric study to quantify the influence of κ and μ on adaptive modulation performance, providing practical insights for 5G and future 6G systems. The proposed framework bridges theoretical analysis and experimental validation, offering a computationally efficient and robust tool for the design and evaluation of advanced modulation schemes in generalized fading environments.

1. Introduction

1.1. Related Work

The advancement of mobile communication technologies has been driven by the growing demand for faster, more reliable, and lower-latency connections, as well as the need to support an increasing number of connected devices. 5G networks emerge as a response to these challenges, offering substantial improvements over previous generations of mobile networks [1]. The growing demand for high data rates in wireless communication systems makes research in this field essential to ensure the quality of services and applications. A significant portion of these studies focuses on mitigating the negative effects of the wireless channel, with fading being the main phenomenon affecting this type of communication [2].
To address the reduction in spectral efficiency, it is common to increase the order of the modulation. Thus, QAM (quadrature amplitude modulation) schemes are often employed in various studies in the literature [3,4]. Currently, non-square constellations are widely used in communication systems because they exhibit lower amplitude fluctuations than square constellations [5,6]. Additionally, the performance of QAM in photonics-aided mmWave systems with multi-antenna diversity has been investigated in [7], reinforcing its practical relevance in next-generation architectures.
The advanced applications envisioned for wireless networks, especially in the mmWave band for 5G and future 6G systems, will inevitably lead to a wide range of propagation conditions. Although traditional fading models such as Rayleigh [8], Hoyt [9], Rice [10], Nakagami-m [11], and Weibull [12] may still be applicable, their ability to adapt to more complex scenarios is limited. However, more flexible and generalized models, such as the α μ [13], κ μ , and η μ [14] models, offer greater potential to represent these challenging conditions. Recent studies also highlight the relevance of generalized models such as κ μ and Beaulieu–Xie for analyzing realistic fading and interference environments [14,15].
These generalized models have proven particularly effective in representing propagation characteristics in real-world applications, including spectrum sensing [16], vehicular-to-vehicular (V2V) scenarios [17], device-to-device (D2D) communication systems [18], body area networks (BAN) [19], underwater ultrasonic links [20], 5G Frequency Range 2 (FR2) deployments [21], narrowband transmission systems [22], and mmWave channels [23,24,25,26]. Recent experimental investigations, such as the one conducted in [27], confirmed the flexibility of the α μ model in describing composite fading more accurately than classical models, further reinforcing the usefulness of generalized approaches. More recent studies have also validated the suitability of generalized fading models for next-generation scenarios, including κ μ shadowed fading with hardware impairments [28], fading channel models for outdoor mmWave communications [29], and symbol error probability analysis under α κ μ fading [30]. In particular, recent studies have also further highlighted the relevance of the κ μ model in next-generation systems, ranging from the characterization of novel modulation techniques [31], to secure transmission strategies in uplink Sparse Code Multiple Access (SCMA) [32], and even mixed fading products with practical and RIS-enabled applications [33].
The literature provides strong evidence that these generalized models offer enhanced adaptability to various wireless contexts [21,23,24]. In contrast, conventional models often fall short in representing particular propagation conditions, notably in mmWave scenarios [23,24,25,26], where the envelope probability function density (PDF) of the received signal may exhibit bimodal characteristics. These effects, common in severe fading conditions, underscore the necessity of employing generalized models to capture the full range of physical phenomena observed in modern wireless.
Building on this line of research, the present study turns to the generalized κ μ fading model [14], which is widely recognized for its flexibility in characterizing a variety of multipath propagation conditions, including both LoS (line-of-sight) and nLoS (non-line-of-sight) scenarios. This model captures small-scale fading effects by accounting for the presence of multiple dominant components and clustered scatterers, offering enhanced analytical tractability and encompassing several classical models as special cases. A closed-form approximation is derived for the SEP (symbol error probability) of cross-QAM schemes over the κ μ model. The analytical result is validated through performance simulations conducted in MATLAB R2024b. These simulations were carried out at mmWave frequencies of 55, 60, and 65 GHz. The evaluation is based on channel models developed from an extensive measurement campaign reported in [23], which considered both LoS and nLoS conditions in indoor scenarios. The results provide valuable insights into the behavior of QAM schemes in mmWave environments, clarifying their practical applicability and the challenges they may face in future high-frequency communication systems.
We align our discussion with the 3GPP TR 38.901 channel model for 0.5 100   GHz , which serves as the industry reference for 5G evaluations. Although TR 38.901 does not prescribe the κ μ distribution per se, κ μ generalizes key fading conditions underlying the standard models (including Rician, Rayleigh, and Nakagami-m), and numerous mmWave measurement campaigns in 28 65   GHz have reported excellent goodness-of-fit for κ μ and related generalized distributions [21,23,24]. We therefore adopt κ μ as an analytically tractable, generalized, and measurement-supported model consistent with 5G propagation.

1.2. Contributions and Organization

This work presents an adaptation of the analytical framework to the κ μ fading model, which, unlike the commonly considered η μ model in the literature, captures multiple dominant components and clustered scatterers typical of mmWave propagation. This adaptation required reformulations in the expansions of the Bessel function and approximations to the complementary error function, due to the coupling between the parameters κ and μ , preserving the convergence and accuracy of the expressions.
Furthermore, we propose a closed-form approximation to the SEP of cross-QAM modulation schemes over κ μ fading channels, particularly for the mmWave band. This expression avoids the need for numerical integration, which provides computational efficiency.
The work also provides experimental validation using measurement data from campaigns at 55, 60, and 65 GHz, covering scenarios with LoS and nLoS conditions, as well as various polarization combinations, which have not been addressed in previous studies.
Finally, we offer a detailed parametric study on the influence of the parameters κ and μ on modulation performance, providing practical insights for the design of robust systems in generalized fading environments.
The remainder of this paper is organized as follows. Section 2 reviews the cross-QAM scheme over κ μ fading. In Section 3, a closed-form approximation to the SEP of cross-QAM over the κ μ fading model is derived, representing a key contribution of this work. Section 4 analyzes the experimental data from [23] to validate the applicability of the model to mmWave environments, including statistical fitting with the κ μ distribution. Section 5 presents a performance evaluation based on MATLAB simulations at 55, 60, and 65 GHz, considering LoS/nLoS scenarios and different polarization configurations. Finally, Section 6 summarizes the main findings and conclusions.

2. Basic Review

2.1. Cross M-QAM Modulation

QAM is widely employed in digital communication systems due to its ability to efficiently transmit information through simultaneous modulation of carrier amplitude and phase. In this scheme, the constellation comprises M = 2 b symbols, with b denoting the number of bits carried by each symbol.
For odd values of b satisfying b 5 , a variation known as the cross M-QAM constellation is often adopted. Unlike conventional square-grid layouts, this structure arranges the symbols in a cross-shaped geometry to approximate a more compact constellation. This approach reduces the average symbol energy while supporting Gray-like labeling strategies. The resulting constellation points are mathematically described as
s = ± 2 u 1 ± 2 v 1 j ,
where the indices u and v follow these rules:
u = 1 , , 3 · 2 ( b 5 ) / 2 , v = 1 , , 3 · 2 ( b 5 ) / 2 ; if u 2 ( b 3 ) / 2 1 , , 2 ( b 3 ) / 2 ; if u > 2 ( b 3 ) / 2 ,
and j is the imaginary unit.
To normalize the constellation energy, a scale factor k is introduced, given by
k = 1 E M ,
where E M denotes the average energy per symbol in the cross-QAM constellation. According to [34], this average energy is expressed as
E M = 31 M 32 48 .
The constellation points are classified based on the number of adjacent symbols they have in the horizontal and vertical directions:
(a)
8 symbols have two neighbors;
(b)
3 2 M 16 symbols have three neighbors;
(c)
M 3 2 M + 8 symbols have four neighbors.
An illustration of this structure for M = 128 is shown in Figure 1, where the different categories of points are highlighted.
Assuming an additive white Gaussian noise (AWGN) channel, the SEP for cross-QAM modulation is analytically given by [34]
P e ( γ ) = 2 3 2 2 M erfc ( k γ ) 1 + 2 M 3 2 2 M erfc 2 ( k γ ) ,
where γ = E M N 0 = log 2 ( M ) E b N 0 represents the instantaneous signal-to-noise ratio (SNR) at the receiver, with E b being the average bit energy and N 0 the one-sided noise power spectral density in [watts/Hz].
This modulation format provides improved spectral efficiency for high data rate transmissions by enabling non-square constellations, which are particularly advantageous when M is not a power of four. Although square constellations are generally easier to implement, cross-QAM offers a compelling trade-off between the average energy per symbol and the constellation compactness [2]. It is therefore a practical choice for adaptive modulation schemes in modern wireless communication standards.

2.2. Fading Channels

In a fading propagation scenario, the instantaneous value of γ will vary randomly, and its PDF will depend on the considered type of fading. Thus, the average SEP can be calculated as [35]
P e ¯ = 0 P e γ p γ d γ ,
where P e γ is the symbol error probability of a QAM scheme conditioned on a fixed γ and p γ is the PDF of γ .

2.3. The κ μ Fading Model

The κ μ distribution is a flexible and generalized small-scale fading model capable of characterizing both LoS and nLoS propagation conditions. It has been extensively employed to describe wireless channels where the received signal is composed of multiple clusters of multipath components, each potentially containing a dominant wave.
According to [14], the PDF of the instantaneous SNR γ over κ μ fading is expressed as
p ( γ ) = μ ( 1 + κ ) ( μ + 1 ) / 2 γ ( μ 1 ) / 2 γ ¯ ( μ + 1 ) / 2 κ ( μ 1 ) / 2 e μ κ · exp μ ( 1 + κ ) γ γ ¯ I μ 1 2 μ κ ( 1 + κ ) γ γ ¯ ,
where μ > 0 corresponds to the number of multipath clusters (or the clustering level of the scattered components), κ 0 represents the ratio of the total power of the dominant components to that of the scattered waves, γ ¯ denotes the average received SNR, and I μ 1 ( · ) is the modified Bessel function of the first kind and order μ 1 .
The κ μ model encompasses several classical distributions as special cases [14], including Rice ( κ = K , μ = 1 ) , Nakagami-m ( κ 0 , μ = m ) , Rayleigh ( κ 0 , μ = 1 ) , and one-sided Gaussian ( κ → 0, μ = 1 2 ) . Further analytical treatments of QAM over mixed κ μ and η μ fading channels can be found in [36], highlighting the importance of generalized models in performance evaluation.
To facilitate analytical tractability, particularly in integrals involving the PDF, an infinite series representation of the Bessel function can be employed. A truncated form of the infinite series of the Bessel function, as presented in [37] (p. 375, Eq. 9.6.10), for z > 0 is given by
I μ 1 z z 2 μ 1 j = 0 n z 2 4 j j ! Γ μ + j ,
where Γ ( · ) denotes the Gamma function.
Substituting (7) into (6) with z = 2 μ κ ( 1 + κ ) γ γ ¯ , we obtain the following approximation to the PDF of γ :
p ( γ ) e μ κ μ μ ( 1 + κ ) μ γ ¯ μ γ μ 1 · exp μ ( 1 + κ ) γ γ ¯ j = 0 n μ 2 j κ j 1 + κ j γ j j ! Γ μ + j γ ¯ j .

3. Closed-Form Approximation to the SEP of Cross-QAM over κ μ  Model

Applying P e ( γ ) for the cross M-QAM constellation given in (4), and p γ for the κ μ fading model presented in (8), to P e ¯ given in (5), we obtain
P e ¯ ( γ ¯ ) e μ κ μ μ ( 1 + κ ) μ γ ¯ μ j = 0 n μ 2 k κ j 1 + κ j γ j j ! Γ μ + j γ ¯ j A X B Y ,
where
A = 2 3 2 2 M ,
B = 1 + 2 M 3 2 2 M ,
and X and Y are respectively defined as
X = 0 erfc k γ γ j + μ 1 exp μ ( 1 + κ ) γ γ ¯ d γ ,
Y = 0 erfc 2 k γ γ j + μ 1 exp μ ( 1 + κ ) γ γ ¯ d γ ,
where k is the scaling factor defined in (2).
Initially, the term X is determined by applying the substitution from Equation (14), which involves a change of variables:
γ = x 2 k 2 d γ = 2 x k 2 d x .
This substitution changes the integration limits from γ = 0 (corresponding to x = 0 ) to γ = (corresponding to x = ). Thus, we can then rewrite the term X as
X = 2 k 2 μ + 2 j 0 erfc x x 2 μ + 2 j 1 exp μ ( 1 + κ ) k 2 γ ¯ x 2 d x .
As stated by [38], the complementary error function is approximated to
erfc ( x ) exp ( x 2 ) 6 + exp 4 3 x 2 2 .
Hence,
X 1 3 k 2 μ + 2 j 0 x 2 μ + 2 j 1 exp μ ( 1 + κ ) + k 2 γ ¯ k 2 γ ¯ x 2 d x + 1 k 2 μ + 2 j 0 x 2 μ + 2 j 1 exp 3 μ ( 1 + κ ) + 4 k 2 γ ¯ 3 k 2 γ ¯ x 2 d x .
We use the following definite integral from the integral table in [39]:
0 x 2 m exp ( β x 2 n ) d x = Γ v 2 n β v ,
where v = 2 m + 1 2 n .
By comparing Equations (17) and (18), we obtain: n = 1 , v = 2 μ + 2 j 1 + 1 2 = μ + j , β 1 = μ ( 1 + κ ) + k 2 γ ¯ k 2 γ ¯ and β 2 = 3 μ ( 1 + κ ) + 4 k 2 γ ¯ 3 k 2 γ ¯ . Therefore, Equation (15) results in
X Γ μ + j γ ¯ μ + j 2 · 1 3 1 μ ( 1 + κ ) + k 2 γ ¯ μ + j + 3 ( 3 μ ( 1 + κ ) + 4 k 2 γ ¯ μ + j .
The term Y can be found considering the same variable substitution presented in (14) and can be rewritten as
Y = 2 k 2 μ + 2 j 0 erfc 2 x x 2 μ + 2 j 1 exp μ ( 1 + κ ) k 2 γ ¯ x 2 d x .
We expand the approximation of [38] given in (16),
erfc 2 ( x ) exp ( 2 x 2 ) 36 + exp 7 3 x 2 6 + exp 8 3 x 2 4 ,
and we apply the approximation to the Equation (20) to obtain
Y 1 18 k 2 μ + 2 j 0 x 2 μ + 2 j 1 exp μ ( 1 + κ ) + 2 k 2 γ ¯ k 2 γ ¯ x 2 d x + 1 3 k 2 μ + 2 j 0 x 2 μ + 2 j 1 exp 3 μ ( 1 + κ ) + 7 k 2 γ ¯ 3 k 2 γ ¯ x 2 d x + 1 2 k 2 μ + 2 j 0 x 2 μ + 2 j 1 exp 3 μ ( 1 + κ ) + 8 k 2 γ ¯ 3 k 2 γ ¯ x 2 d x .
Using the definite integral in Equation (18) again, Equation (20) results in the following:
Y Γ μ + j γ ¯ μ + j 2 1 18 1 μ ( 1 + κ ) + 2 k 2 γ ¯ μ + j + Γ μ + j γ ¯ μ + j 2 1 3 3 3 μ ( 1 + κ ) + 7 k 2 γ ¯ μ + j + Γ μ + j γ ¯ μ + j 2 1 2 3 3 μ ( 1 + κ ) + 8 k 2 γ ¯ μ + j .
Applying Equations (23) and (19) to (9), we obtain the closed-form approximation to the average SEP of the cross M-QAM scheme over the κ μ fading channel as follows:
P e ¯ ( γ ¯ ) e μ κ μ μ ( 1 + κ ) μ 2 j = 0 n { κ j μ 2 j ( 1 + κ ) j j ! 2 3 2 2 M 1 3 1 μ ( 1 + κ ) + k 2 γ ¯ μ + j + 3 3 μ ( μ + κ ) + 4 k 2 γ ¯ μ + j 1 + 2 M 3 2 2 M 1 18 1 μ ( 1 + κ ) + 2 k 2 γ ¯ μ + j + 1 3 3 3 μ ( 1 + κ ) + 7 k 2 γ ¯ μ + j + 1 2 3 3 μ ( 1 + κ ) + 8 k 2 γ ¯ μ + j } .

4. Field Measurements and Channel Modeling

In this work, the channel model described in [23] was adopted to evaluate the performance of cross-QAM schemes in the mmWave band. The measurements were carried out at the iTEAM Research Institute, Universitat Politècnica de València, Spain, in a laboratory environment characterized by a high density of reflective and scattering surfaces, including metallic cupboards, benches, computers, and other furniture. This rich multipath environment results from propagation mechanisms such as reflection, diffraction, and scattering. The measurement area covers a volume of approximately 13.5 m × 7 m × 2.6 m, enclosed by reinforced concrete floors and ceilings and walls made of wood and plasterboard.
The measurement campaign, as detailed in [23], aimed to characterize short-term fading in the 55–65 GHz frequency range. The setup included a vector network analyzer (VNA), vertically polarized antennas, and a receiver-side XY positioning system forming a uniform rectangular array (URA). Among the various configurations studied, Scenarios 1, 2, 3, and 4 were selected for analysis in this work due to their representativeness of different propagation conditions.
  • Scenario 1: LoS with crossed polarization (HV), distance of 3.29 m between transmitter (Tx) and receiver (Rx). This setting emphasizes diffuse components by attenuating the direct path.
  • Scenario 2: LoS with co-polarized antennas (VV) at the same distance of 3.29 m, providing strong antenna coupling and emphasizing the direct path with minimal attenuation.
  • Scenario 3: nLoS with co-polarized antennas (VV) at the same distance of 3.29 m, with an absorber obstructing the LoS to emulate common indoor blockage.
  • Scenario 4: Favorable LoS with VV polarization and reduced separation of 2.77 m, resulting in a strong dominant component.
These scenarios encompass a range of propagation conditions, from strong direct paths to obstructed environments, providing a comprehensive basis for evaluating signal fading effects in high-frequency communication systems. Table 1, adapted from [23], summarizes the estimated parameters of the κ μ fading model for Scenarios 1, 2, 3, and 4, at operating frequencies of 55, 60, and 65 GHz. The table includes (i) the κ parameter; (ii) the μ parameter; and (iii) the normalized mean square error (NMSE) (the NMSE is computed as 10 log 10 i ( p meas ( γ i ) p model ( γ i ) ) 2 i p meas 2 ( γ i ) , where p meas and p model denote the measured and fitted PDF, respectively. More negative values indicate a better goodness of fit), which reflects the accuracy of the model fitting to the empirical data in each evaluated scenario. All values presented in Table 1 were directly reproduced from [23], which reported the κ μ model fitting to the measurement data.
The results in Table 1 highlight the distinct small-scale fading characteristics across the four analyzed scenarios, as captured by the estimated parameters κ and μ of the κ μ distribution.
In Scenario 1 (LoS, HV polarization, 3.29 m), the estimated values of κ are relatively low (between 0.43 and 0.84), indicating a weak dominance of the LoS component. This is expected due to the cross-polarized configuration, which reduces antenna coupling and attenuates the direct path. The μ values remain close to 1 across all frequencies, suggesting a mildly dispersive environment with a limited number of significant multipath clusters. The NMSE values, ranging from 17.57 dB to 16.38 dB, reflect a good fit between the model and the measured data.
In Scenario 2 (LoS, VV polarization, 3.29 m), the values of κ vary significantly, from 2.66 to 24.47, with the peak occurring at 60 GHz. This strong direct component results from the co-polarized antenna configuration, which maximizes LoS reception. Notably, the extremely high κ = 24.47 paired with a very low μ = 0.19 at 60 GHz points to a channel dominated almost entirely by a deterministic LoS component, with minimal contribution from diffuse multipath. This configuration is physically consistent with highly direct propagation and low scattering. The NMSE values, between 16.73 dB and 14.94 dB, indicate a slightly more complex fitting process than in Scenario 1, possibly due to the sparsity of the scattered energy in some frequency bands.
Scenario 3 (nLoS, VV polarization, 3.29 m) presents κ values between 1.05 and 2.04, consistent with the absence of a direct path but the presence of strong reflected components acting as dominant signal contributors. This is typical in indoor nLoS conditions, where reflections from walls or furniture can mimic the role of an LoS path. The values of μ range from 0.81 to 1.57, with the highest multipath richness occurring at 60 GHz. The NMSE performance ( 17.31 dB to 16.19 dB) remains comparable to that of the LoS cases, suggesting that the κ μ model adapts well even under obstruction.
Finally, Scenario 4 (LoS, VV polarization, 2.77 m) stands out with the highest average value of κ observed in all scenarios, reaching 24.43 at 55 GHz, alongside an extremely low μ = 0.25 . This reflects a propagation condition with a strongly dominant LoS component and a highly sparse or unstable diffuse component, typical of short-range, highly directive links. At 60 GHz, κ drops sharply to 1.80 and μ rises to 2.06 , suggesting an increase in scattering due to greater interaction with surrounding surfaces. However, at 65 GHz, κ increases again to 3.53 while μ decreases to 1.32 , indicating a slight rebalancing between the dominant and scattered components. Scenario 4 also yields the lowest NMSE values among all scenarios (from 21.16 dB to 17.89 dB), demonstrating the excellent fit of the κ μ model in this near-optimum LoS propagation environment.
In summary, the estimated parameters κ and μ are physically coherent with the polarization and geometric configurations of each scenario. The κ μ distribution shows strong modeling capability across both highly directive LoS scenarios and more scattered nLoS conditions, as evidenced by the consistently low NMSE values.
It is worth noting that in some LoS scenarios, the estimated values of μ are less than one. This condition indicates a propagation environment with a very limited number of multipath clusters, often associated with highly directive LoS links in which the received signal is dominated by one or a few strong components and only sparse diffuse scattering. Physically, μ < 1 can represent even more severe fading than the Rayleigh case, since Rayleigh assumes μ = 1 with fully scattered components of equal power. Such conditions have also been reported in other mmWave experimental works [23,24], confirming that μ < 1 is a meaningful and realistic outcome in these practical scenarios.

5. Performance Evaluation

In order to analyze the performance of the cross M-QAM scheme in an indoor mmWave environment, a simulated communication system based on this modulation scheme was developed in MATLAB. The system transmitter generates N random symbols from the M-QAM constellation. The propagation channel between the transmitter (Tx) and the receiver (Rx) is modeled as a slow κ μ fading channel, assuming that its characteristics remain practically constant during the transmission of each symbol. Thus, the channel introduces a multiplicative gain to the envelope of the received symbols, generated in MATLAB using the Inverse Transform Sampling method [40].
A vector of circularly symmetric complex Gaussian noise with zero mean and variance N 0 / 2 , determined by the configured signal-to-noise ratio, is added to the symbol vector already affected by the channel. The receiver uses a zero-forcing equalizer at the input, followed by a maximum likelihood detector. The SEP is estimated by computing the ratio of incorrectly detected symbols to the total number of transmitted symbols. The performance curves presented in this section were obtained for values of E b / N 0 ranging from 0 dB to 40 dB, with N = 10 8 transmitted symbols for each point.
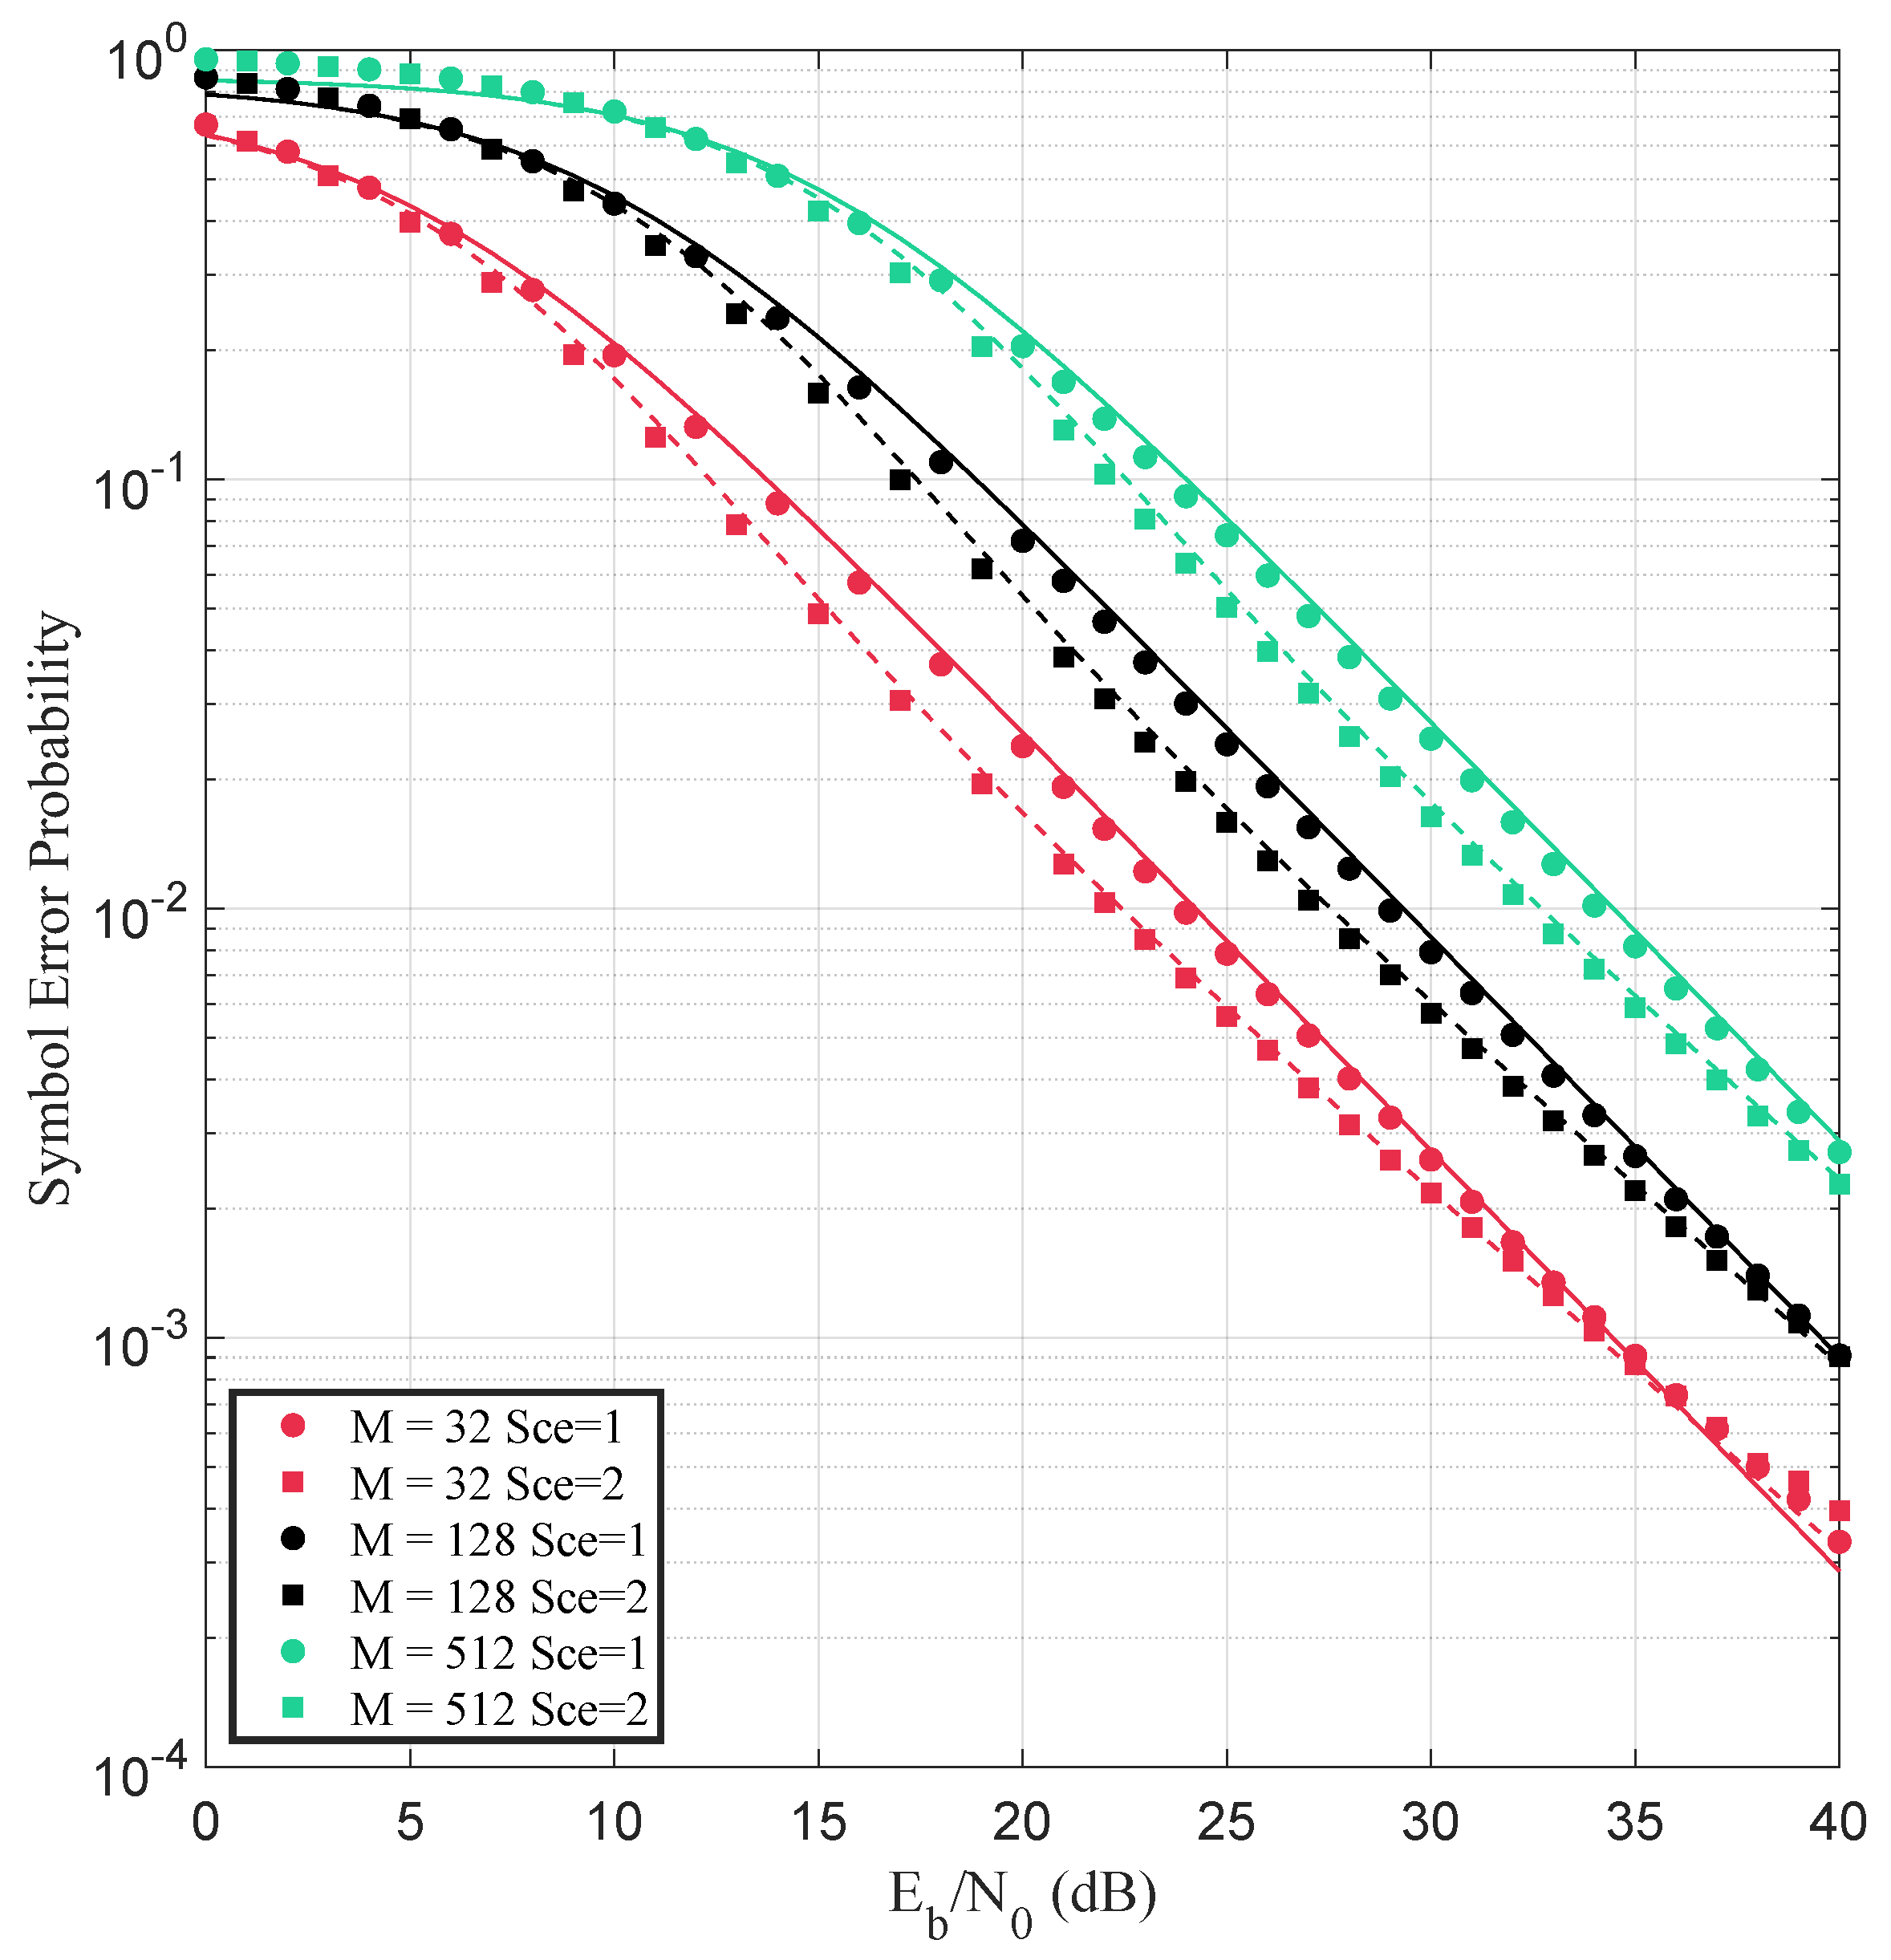
The developed system was initially simulated for M = 32 , 128, 512, considering an κ μ channel with the values of κ and μ presented in Table 1 for Scenarios 1 (LoS, HV) and 2 (LoS, VV). The estimated P e ¯ values (markers) at 55, 60, and 65 GHz are shown in Figure 2, Figure 3 and Figure 4 for Scenarios 1 and 2. The markers represent the results obtained through Monte Carlo simulations, while the solid and dashed lines correspond to the theoretical symbol error rate (SER) curves derived from the closed-form approximation in (24).
Analyzing the results presented in Figure 2, Figure 3 and Figure 4, it can be observed that the theoretical and simulated curves exhibit strong agreement in all simulated cases, validating the proposed approximation (24). This strong agreement has been achieved for relatively low values of n in (24) ( n = 15 ), due to the rapid convergence of the series whose truncated series is presented in (7).
At 55 GHz (Figure 2), Scenario 2 consistently achieves superior SEP performance across all E b / N 0 values and modulation orders. This improvement results from the strong antenna coupling provided by co-polarization (VV), which maximizes the reception of the LoS component and minimizes signal degradation. In contrast, in Scenario 1, despite the presence of a physical LoS, the cross-polarization (HV) configuration causes significant attenuation of the direct path, leading to worse performance. The estimated channel parameters reinforce this interpretation: Scenario 1 presents κ = 0.43 and μ = 0.99 , indicating a scenario with limited dominance of the LoS path and moderate scattering. In contrast, Scenario 2 shows κ = 2.92 and μ = 0.96 , pointing to a strong direct component with a similar level of dispersion.
When the frequency increases to 60 GHz (Figure 3), the performance gap between the two scenarios becomes more evident. Scenario 2 maintains its clear advantage in all conditions analyzed. The case of a high value κ = 24.47 in this scenario indicates a highly dominant direct path, while the low value μ = 0.19 reflects a very limited multipath richness. At the same frequency, in Scenario 1, the estimated parameters are κ = 0.84 and μ = 0.85 , suggesting a more balanced distribution between the direct and scattered components, yet it is insufficient to overcome the polarization losses. As a result, Scenario 2 offers a more favorable propagation environment for the operation of the system.
Lastly, at 65 GHz (Figure 4), Scenario 2 continues to outperform Scenario 1 regardless of the modulation order or E b / N 0 level. The channel parameters for Scenario 2 ( κ = 2.66 , μ = 0.83 ) still indicate a strong LoS component, maintaining a similar behavior as in lower frequencies. On the other hand, Scenario 1 presents κ = 0.77 and μ = 0.98 , suggesting a less prominent direct component and a channel with moderate multipath dispersion, resulting in reduced performance.
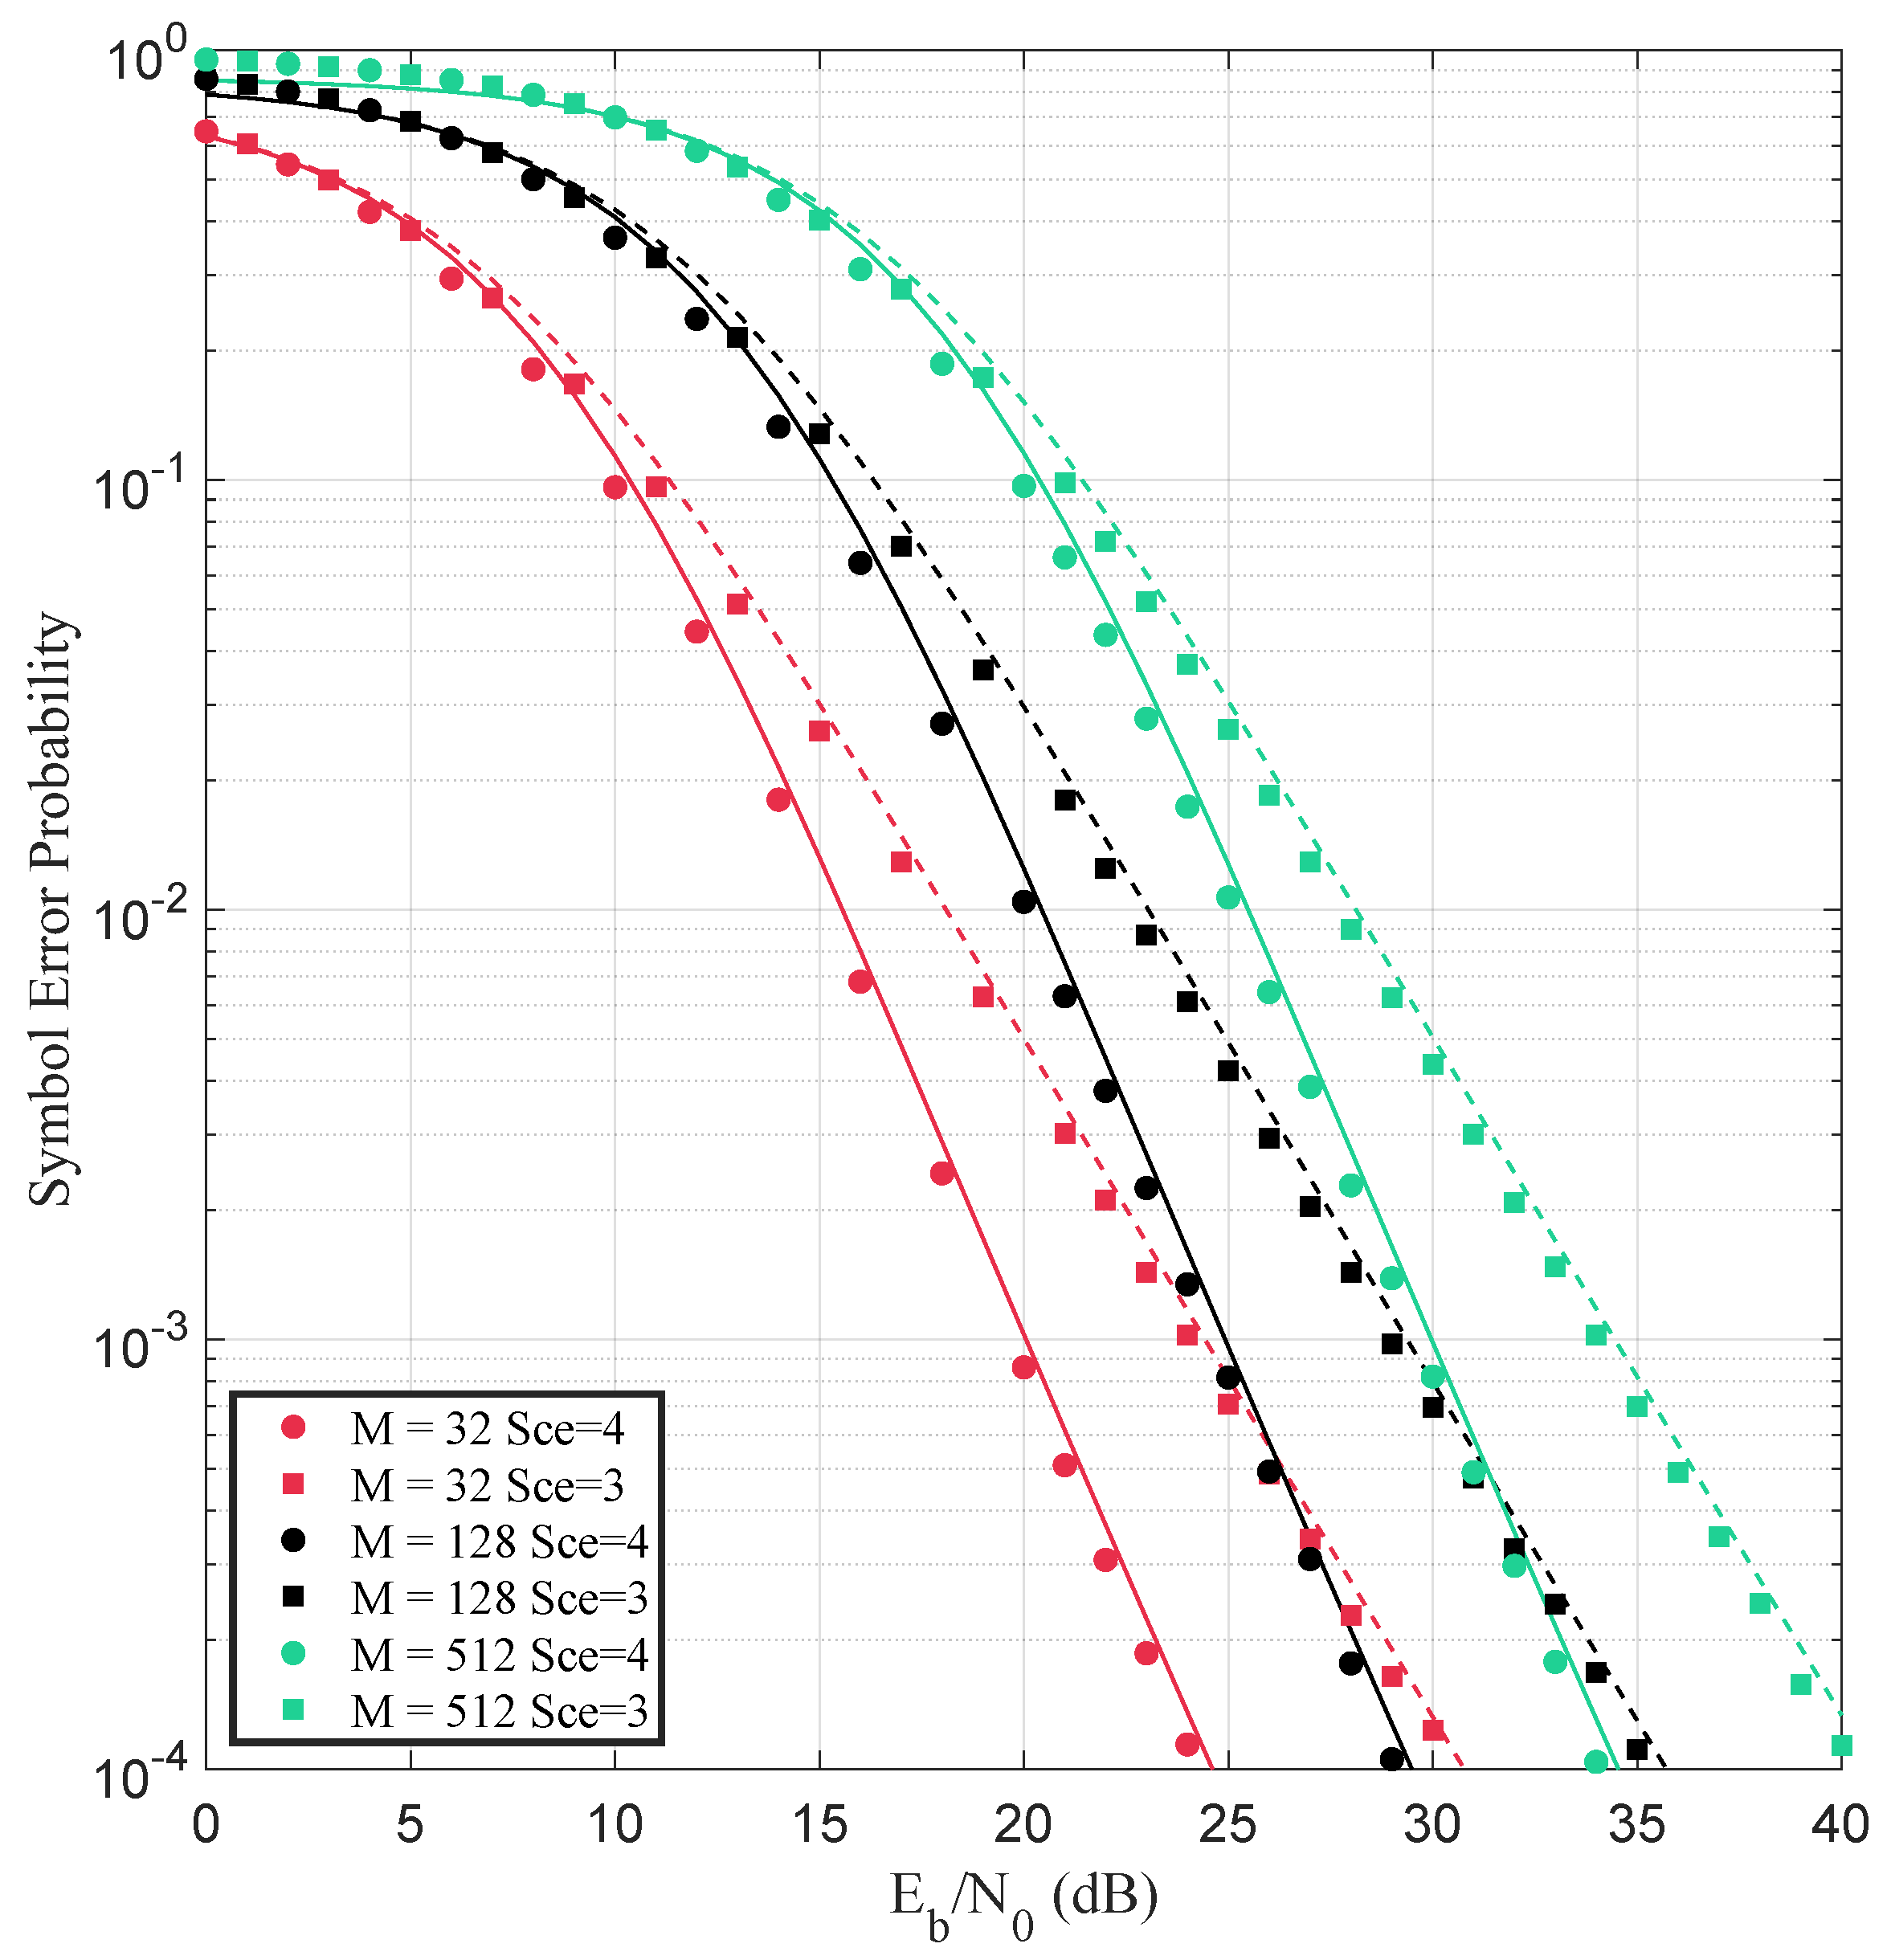
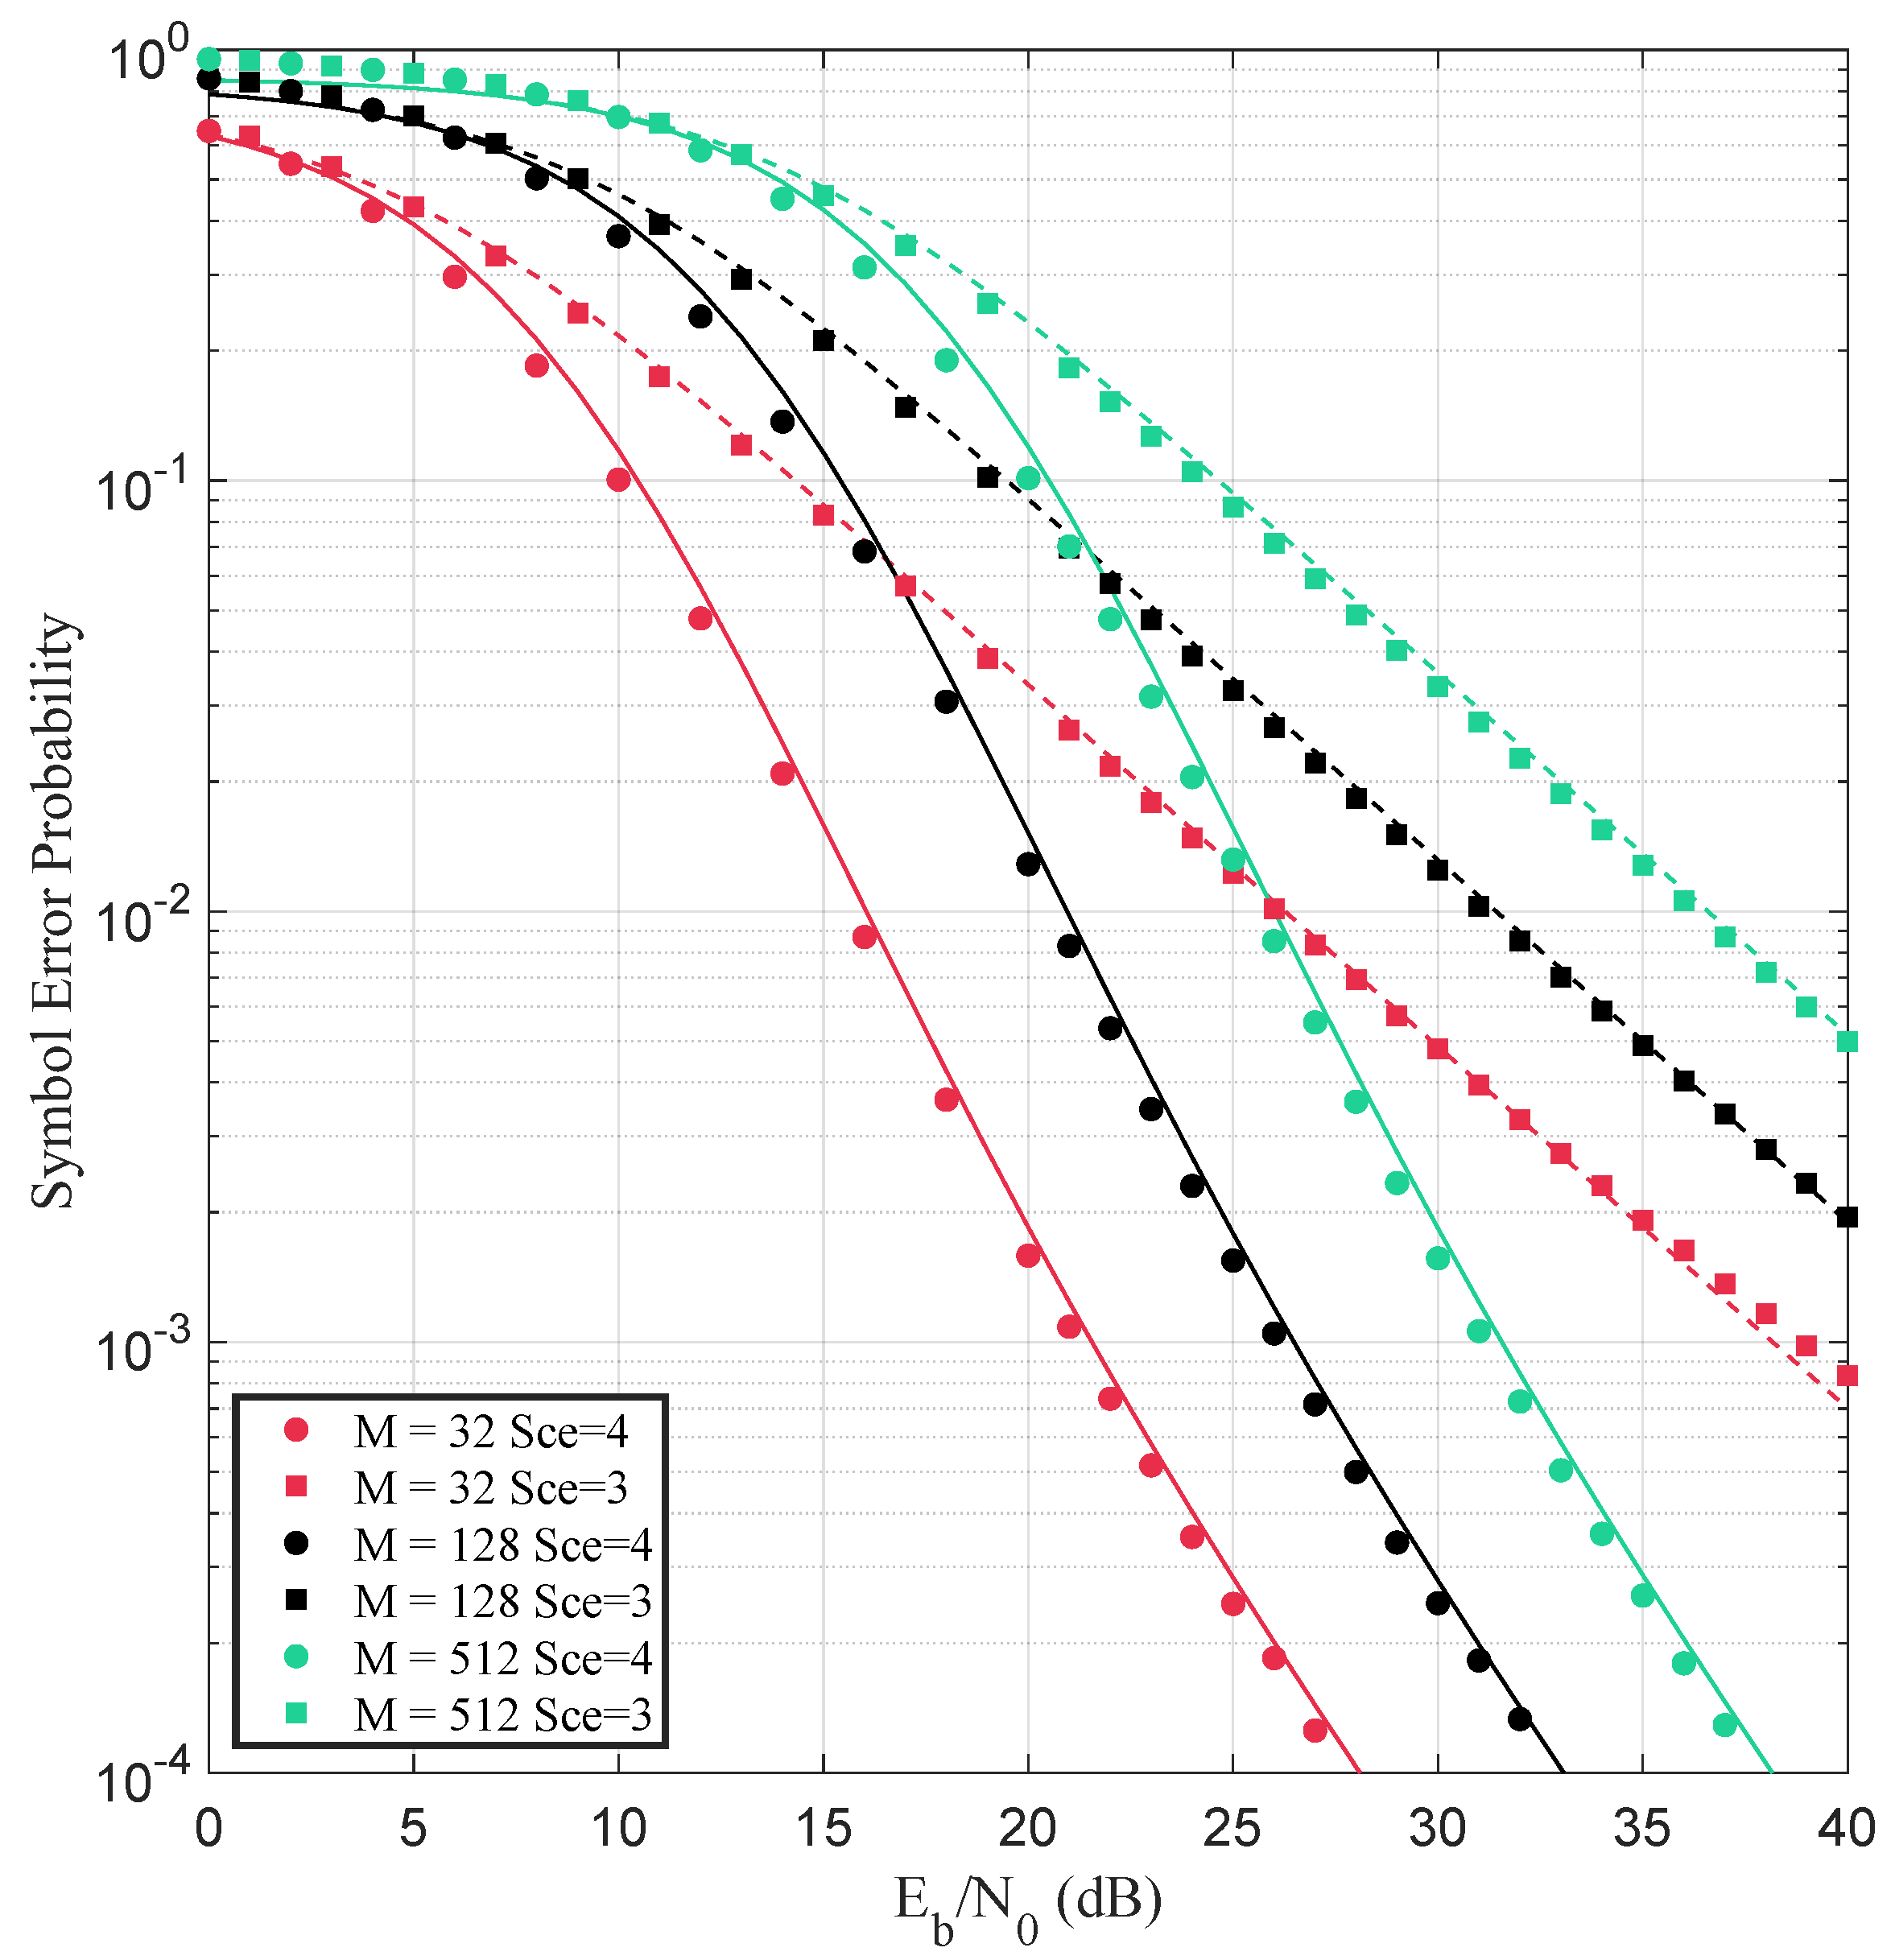
Figure 5, Figure 6 and Figure 7 illustrate the system SEP performance for the values M = 32 , 128, and 512, under a κ μ fading channel, with the values of κ and μ specified in Table 1 for Scenarios 3 (nLoS, VV, 3.29 m) and 4 (LoS, VV, 2.77 m). The estimated P e ¯ values (markers) at 55, 60, and 65 GHz are depicted in Figure 5, Figure 6, and Figure 7, respectively, along with the theoretical curves for Scenario 3 (dashed lines) and Scenario 4 (solid lines). In all the cases analyzed, Scenario 4 consistently outperforms Scenario 3 in all modulation orders and SNR ranges, highlighting it as the most favorable propagation condition evaluated.
In Figure 5, which corresponds to the 55 GHz frequency, the performance superiority of Scenario 4 is particularly evident due to the high κ value ( 24.43 ) and low μ value ( 0.25 ), indicating a strong dominant component and limited multipath dispersion. The VV polarization, combined with a shorter Tx-Rx separation, further improves antenna coupling and enhances direct signal reception.
In scenarios characterized by high κ and low μ values, such as those observed in Figure 3 (Scenario 2, 60 GHz) and Figure 5 (Scenario 4, 55 GHz), a divergence between the theoretical and simulated curves emerges at high E b / N 0 values—specifically, above approximately 20 dB ( M = 32 ), 25 dB ( M = 128 ), and 30 dB ( M = 512 ) for Scenario 2 and above 25 dB, 30 dB, and 35 dB, respectively, for Scenario 4. This discrepancy may stem from the approximation of the complementary error function and the truncation of an infinite series to a finite number of terms, which can introduce minor inaccuracies that become more prominent in high-SNR regimes. Nonetheless, the overall agreement between the analytical and the simulated results supports the validity and robustness of the proposed theoretical approximation for the practical SNR range.
Figure 6, corresponding to 60 GHz, still demonstrates the superior performance of Scenario 4 over Scenario 3, although the gap between them becomes less pronounced. In this case, Scenario 4 features more balanced values of κ = 1.80 and μ = 2.06 , indicating a favorable interaction between a dominant LoS component and multipath diversity. Scenario 3, with κ = 1.19 and μ = 1.57 , also offers reasonable robustness, but with a weaker direct signal contribution.
Finally, in Figure 7 (65 GHz), Scenario 4 continues to outperform Scenario 3 in terms of SEP across all modulation orders and SNR ranges. With κ = 3.53 and μ = 1.32 , the channel in Scenario 4 maintains a strong LoS component while preserving moderate multipath richness. In contrast, Scenario 3, characterized by lower values of κ = 1.05 and μ = 0.84 , exhibits more severe fading conditions, which significantly degrade performance, particularly for higher modulation orders.
Overall, the simulation results confirm the accuracy of the proposed closed-form approximation to various modulation orders, polarization configurations, and frequencies in the mmWave band. A slight divergence between theoretical and simulated curves was observed in scenarios characterized by very high κ and low μ , particularly in high-SNR regimes. However, for the SNR ranges typically encountered in practical communication systems, the proposed approximation remains remarkably accurate and provides a reliable tool for performance evaluation and system design in realistic fading environments.

6. Conclusions

This work presented a closed-form approximation to the SEP of cross M-QAM schemes over κ μ fading channels. The proposed formulation enables an accurate and efficient performance evaluation without the need for extensive numerical simulations. The expression was validated through Monte Carlo simulations in realistic environments within the mmWave spectrum (55, 60 and 65 GHz), considering both LoS and nLoS conditions, different Tx–Rx distances, modulation orders, and polarization configurations.
The results demonstrated excellent agreement between the analytical and the simulated curves, even for high-order modulations and high-SNR regimes, confirming the robustness of the proposed model. Although minor discrepancies were observed in scenarios with very high κ and low μ values—particularly at extreme SNR levels—the approximation remained highly accurate within the practical operating range of modern wireless systems.
The analysis further revealed that the polarization configuration and the presence of a LoS component play a critical role in determining the SEP performance. Scenarios with VV polarization and strong LoS consistently achieved superior performance at all evaluated SNR levels. However, under lower SNR conditions, the performance gap between LoS and nLoS scenarios tends to narrow. The observed behavior across different SNR thresholds highlights the joint influence of the parameters κ and μ on system performance.
In summary, the derived expression offers a valuable tool for the design and evaluation of high-frequency communication systems, particularly in emerging 5G and 6G networks. Future research may extend this framework to other generalized fading models and explore adaptive modulation and coding strategies based on analytical SEP expressions.

Author Contributions

Conceptualization, K.B.C., G.A.C., A.A.d.A. and P.L.L.B.; methodology, W.E.V., K.B.C., G.A.C., E.A., A.A.d.A. and P.L.L.B.; software, A.A.d.A. and P.L.L.B.; validation, W.E.V. and E.A.; formal analysis, W.E.V., K.B.C., G.A.C. and E.A.; investigation, W.E.V., K.B.C. and E.A.; resources, A.A.d.A. and P.L.L.B.; data curation, K.B.C. and A.A.d.A.; writing—original draft preparation, W.E.V., K.B.C., E.A. and A.A.d.A.; writing—review and editing, W.E.V., G.A.C., A.A.d.A. and P.L.L.B.; visualization, A.A.d.A.; supervision, E.A., A.A.d.A. and P.L.L.B.; project administration, P.L.L.B.; funding acquisition, P.L.L.B. All authors have read and agreed to the published version of the manuscript.

Funding

This research was partially funded by Minas Gerais Research Foundation (FAPEMIG) grant number RED-00194-23, under Minas Gerais Research Network in 5G and 6G project.

Data Availability Statement

The original contributions presented in this study are included in the article. Further inquiries can be directed to the corresponding authors.

Conflicts of Interest

The authors declare no conflicts of interest.

References

  1. Ghosh, A.; Maeder, A.; Baker, M.; Chandramouli, D. 5G Evolution: A View on 5G Cellular Technology Beyond 3GPP Release 15. IEEE Access 2019, 7, 127639–127651. [Google Scholar] [CrossRef]
  2. Proakis, J.G.; Manolakis, D. Digital Communications, 4th ed.; McGraw-Hill: New York, NY, USA, 2007. [Google Scholar]
  3. Orozco, N.; Carvajal, H.; de Almeida, C. A Hybrid Transmission Scheme Employing Opportunistic Transmission and Multiuser Diversity. In Proceedings of the 13th IEEE International Conference on Wireless and Mobile Computing, Networking and Communications (WiMob), Rome, Italy, 9–11 October 2017. [Google Scholar]
  4. Orozco, N.; Carvajal, H.; de Almeida, C. An Opportunistic System to Counteract Fading and Gaussian Interference Effects Under Different Modulation Schemes. IEEE Lat. Am. Trans. 2018, 16, 2716–2721. [Google Scholar] [CrossRef]
  5. Lee, J.; Jung, J.; Ahn, J.M. Simplified Non-Square Quadrature Amplitude Modulation Demapper for DOCSIS 3.1. IEEE Trans. Broadcast. 2017, 63, 156–161. [Google Scholar] [CrossRef]
  6. Morais, D.H. Novel Non-Square, Gray Coded, 64-QAM Constellations. In Proceedings of the 2015 IEEE Radio and Wireless Symposium (RWS), San Diego, CA, USA, 25–28 January 2015. [Google Scholar]
  7. Uddin, R.; Li, W.; Yu, J. Optimized Multi-Antenna MRC for 16-QAM Transmission in a Photonics-Aided Millimeter-Wave System. Sensors 2025, 25, 5010. [Google Scholar] [CrossRef]
  8. Rayleigh, L. On the Resultant of a Large Number of Vibrations of the Same Pitch and of Arbitrary Phase. Philos. Mag. 1880, 10, 73–78. [Google Scholar] [CrossRef]
  9. Hoyt, R.S. Probability Functions for the Modulus and Angle of the Normal Complex Variate. Bell Syst. Tech. J. 1947, 26, 318–359. [Google Scholar] [CrossRef]
  10. Rice, S.O. Statistical Properties of Random Noise. Bell Syst. Tech. J. 1945, 24, 46–156. [Google Scholar] [CrossRef]
  11. Nakagami, M. The m-Distribution—A General Formula of Intensity Distribution of Rapid Fading. Stat. Methods Radio Wave Propag. 1960, 26, 3–36. [Google Scholar]
  12. Weibull, W. A Statistical Distribution Function of Wide Applicability. J. Appl. Mech. 1951, 18, 293–297. [Google Scholar] [CrossRef]
  13. Yacoub, M.D. The α-μ Distribution: A Physical Fading Model for the Stacy Distribution. IEEE Trans. Veh. Technol. 2007, 56, 27–34. [Google Scholar] [CrossRef]
  14. Yacoub, M.D. The κ-μ Distribution and the η-μ Distribution. IEEE Antennas Propag. Mag. 2007, 49, 68–81. [Google Scholar] [CrossRef]
  15. Zhou, L.; Wang, Y.; Li, H. MDE and LLM Synergy for Network Experimentation: Case Analysis of Wireless System Performance in Beaulieu–Xie Fading and κμ Co–Channel Interference Environment with Diversity Combining. Sensors 2024, 24, 3037. [Google Scholar] [CrossRef]
  16. Anjos, A.A.; da Silva, C.R.N.; de Souza, R.A.A. Fading Evaluation in a Robust Spectrum Sensing System Based on Phase Difference Distribution. IEEE Trans. Veh. Technol. 2025, 74, 9404–9414. [Google Scholar] [CrossRef]
  17. Wu, Q.; Matolak, D.W.; Sen, I. 5-GHz-Band Vehicle-to-Vehicle Channels: Models for Multiple Values of Channel Bandwidth. IEEE Trans. Veh. Technol. 2010, 59, 2620–2625. [Google Scholar] [CrossRef]
  18. Cotton, S.L. Second-Order Statistics of κ-μ Shadowed Fading Channels. IEEE Trans. Veh. Technol. 2016, 65, 8715–8720. [Google Scholar] [CrossRef]
  19. Bhargav, N.; Cotton, S.L.; Smith, D.B. An Experimental-Based Analysis of Inter-BAN Co-Channel Interference Using the κ-μ Fading Model. IEEE Trans. Antennas Propag. 2017, 65, 983–988. [Google Scholar] [CrossRef]
  20. Canete, F.J.; Fernandez, J.L.; Corrales, C.G.; Sanchez, A.; Robles, E.; Rodrigo, F.J.; Paris, J.F. Measurement and Modeling of Narrowband Channels for Ultrasonic Underwater Communications. Sensors 2016, 16, 256. [Google Scholar] [CrossRef]
  21. Marins, T.R.R.; dos Anjos, A.A.; da Silva, C.R.N.; Penarrocha, V.M.R.; Rubio, L.; Reig, J.; de Souza, R.A.A.; Yacoub, M.D. Fading Evaluation in Standardized 5G Millimeter-Wave Band. IEEE Access 2021, 9, 67268–67280. [Google Scholar] [CrossRef]
  22. Chong, P.K.; Yoo, S.E.; Kim, S.H.; Kim, D. Wind-Blown Foliage and Human-Induced Fading in Ground-Surface Narrowband Communications at 400 MHz. IEEE Trans. Veh. Technol. 2011, 60, 1326–1336. [Google Scholar] [CrossRef]
  23. Marins, T.R.R.; dos Anjos, A.A.; Reig, J.; Rubio, L.; de Souza, R.A.A.; Yacoub, M.D. Fading Evaluation in the mm-Wave Band. IEEE Trans. Commun. 2019, 67, 8725–8738. [Google Scholar] [CrossRef]
  24. Anjos, A.A.; Marins, T.R.R.; da Silva, C.R.N.; Rodrigo-Penarrocha, V.M.; Rubio, L.; Reig, J.; de Souza, R.A.A.; Yacoub, M.D. Higher Order Statistics in a mmWave Propagation Environment. IEEE Access 2019, 7, 103876–103892. [Google Scholar] [CrossRef]
  25. Reig, J.; Martinez-Inglés, M.T.; Rubio, L.; Rodrigo-Penarrocha, V.M.; Molina-García-Pardo, J.M. Fading Evaluation in the 60 GHz Band in Line-of-Sight Conditions. Int. J. Antennas Propag. 2014, 12. [Google Scholar] [CrossRef]
  26. Blumenstein, J.; Prokes, A.; Chandra, A.; Mikulasek, T.; Marsalek, R.; Zemen, T.; Mecklenbrauker, C. In-Vehicle Channel Measurement, Characterization, and Spatial Consistency Comparison of 30–11 GHz and 55–65 GHz Frequency Bands. IEEE Trans. Veh. Technol. 2017, 66, 3526–3537. [Google Scholar] [CrossRef]
  27. Anjos, A.A.; Tenkorang, G.K.; Martins, F.C.; Leonardo, E.J.; Yacoub, M.D. Suitability of α-μ for Composite Fading Modeling. IEEE Trans. Antennas Propag. 2024, 72, 3670–3679. [Google Scholar] [CrossRef]
  28. Xia, Y.; Li, Z.; Zhang, H.; Wu, Q. Performance Analysis of Wireless Communications with Nonlinear Energy-Harvesting Hardware Impairments under κ-μ Shadowed Fading. Sensors 2023, 23, 3619. [Google Scholar] [CrossRef]
  29. Zemen, T.; Blumenstein, J.; Mecklenbräuker, C.; Prokeš, A. Fading Channel Models for mm-Wave Communications. Electronics 2021, 10, 798. [Google Scholar] [CrossRef]
  30. Bodempudi, N.S.P.; Chaturvedi, A.; H, R.; Kulkarni, M. Analysis of symbol error probability in GFDM under generalized ακμ channels: An approach based on probability density function for beyond 5G wireless applications. AEU -Int. J. Electron. Commun. 2025, 200, 155946. [Google Scholar] [CrossRef]
  31. Anjos, A.A.; Silva, H.S. On-Off Digital Noise Modulation. IEEE Wirel. Commun. Lett. 2025, early access. [Google Scholar] [CrossRef]
  32. Mora, H.R.C.; Garzón, N.V.O.; García, F.D.A.; Sánchez, J.D.V.; López, O.L.A. Secure Transmission for Uplink SCMA Systems Over κ-μ Fading Channels. IEEE Trans. Veh. Technol. 2024, 73, 754–770. [Google Scholar] [CrossRef]
  33. da Silva, C.R.N.; Simmons, N.; Alvarado, M.C.L.; Sofotasios, P.C.; Cotton, S.L.; Yacoub, M.D. α-μ, κ-μ, and η-μ Mixed Products: Exact and Simple-Approximate Solutions, and Practical and RIS Applications. IEEE Trans. Veh. Technol. 2024, 73, 14734–14748. [Google Scholar] [CrossRef]
  34. Zhang, X.; Yu, H.; Wei, G. Exact Symbol Error Probability of Cross-QAM in AWGN and Fading Channels. EURASIP J. Wirel. Commun. Netw. 2010, 917954. [Google Scholar] [CrossRef]
  35. Xiong, F. Digital Modulation Techniques, 2nd ed.; Artech House: Boston, MA, USA, 2006. [Google Scholar]
  36. Al-Hmood, H.; Al-Raweshidy, H. Performance of QAM Schemes with Dual-Hop DF Relaying Systems over Mixed η-μ and κμ Fading Channels. arXiv 2015, arXiv:1509.02620. [Google Scholar]
  37. Abramowitz, M.; Stegun, I.A. Handbook of Mathematical Functions with Formulas, Graphs and Mathematical Tables; Dover: New York, NY, USA, 1964. [Google Scholar]
  38. Chiani, M.; Dardari, D.; Simon, M.K. New Exponential Bounds and Approximations for the Computation of Error Probability in Fading Channels. IEEE Trans. Wirel. Commun. 2003, 2, 840–845. [Google Scholar] [CrossRef]
  39. Gradshteyn, I.S.; Ryzhik, I.M. Table of Integrals, Series and Products; Academic Press: New York, NY, USA; London, UK, 1980. [Google Scholar]
  40. Devroye, L. Non-Uniform Random Variate Generation, 1st ed.; Springer: New York, NY, USA, 1986. [Google Scholar]
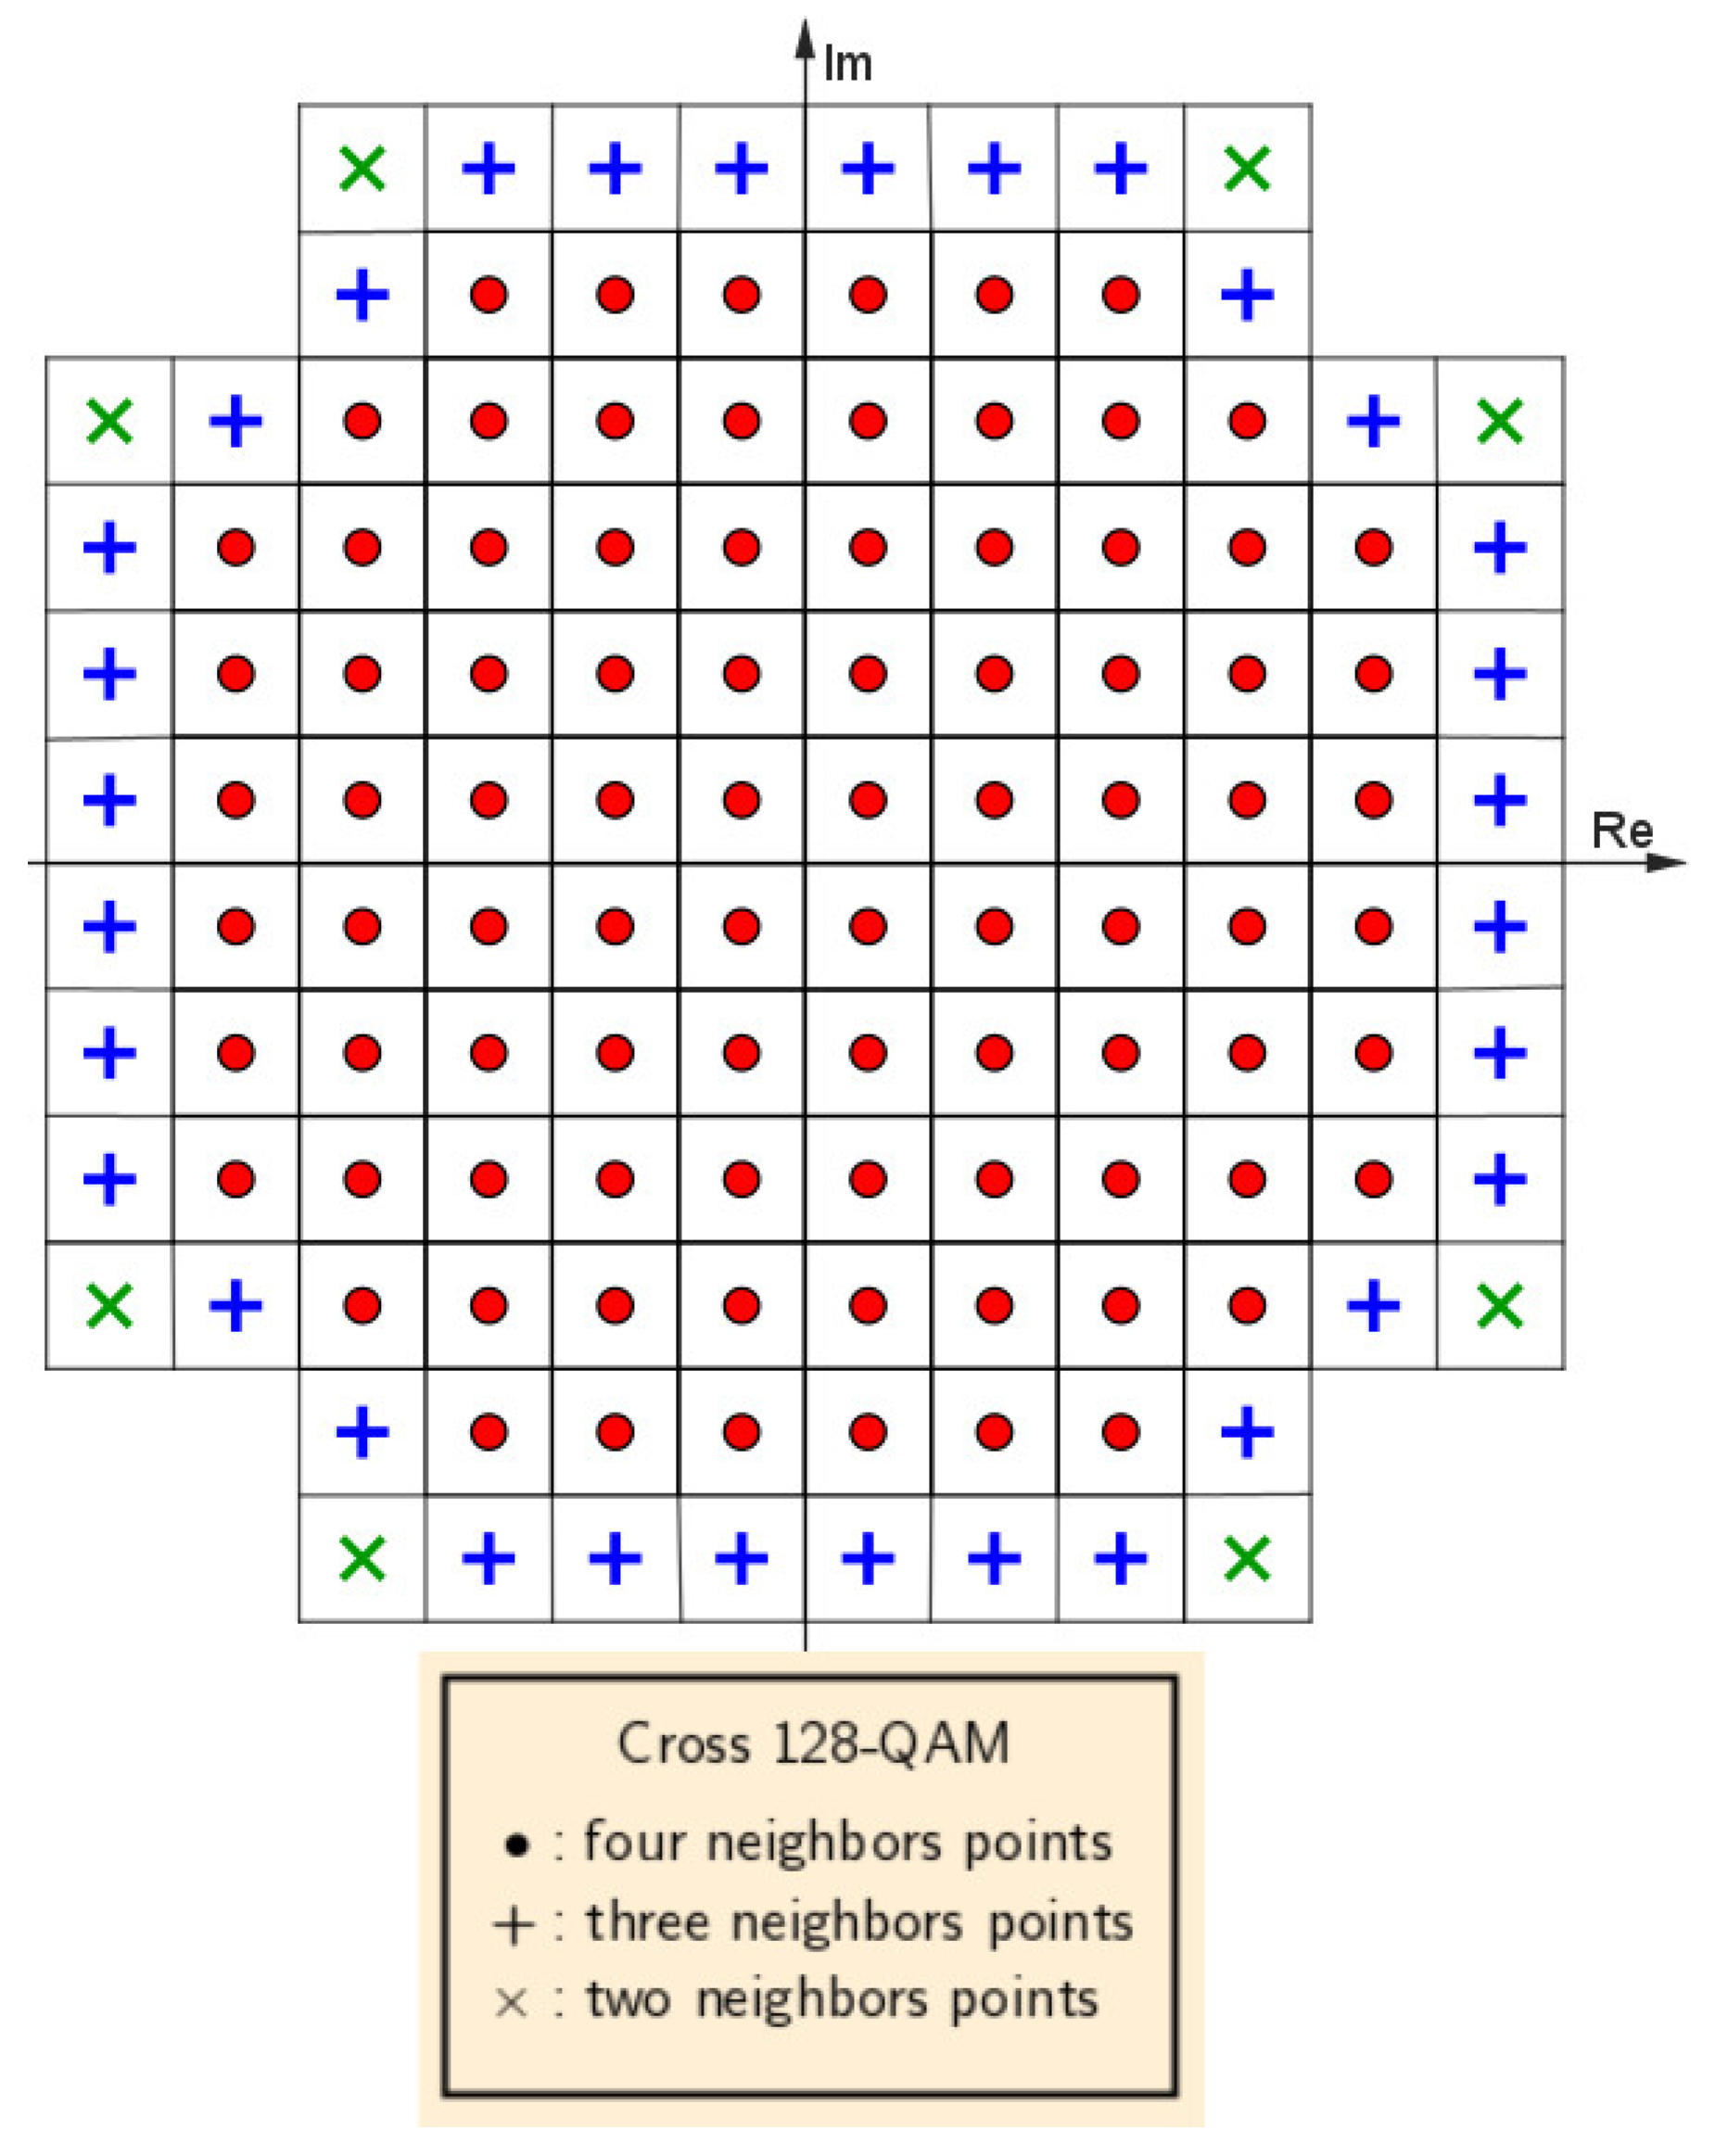
Figure 1. Cross 128-QAM constellation.
Telecom 06 00072 g001
Figure 2. Scenario 1 (LoS, HV) and Scenario 2 (LoS, VV), both with Tx-Rx separation of 3.29 m and 55 GHz. The solid (Scenario 1) and dashed lines (Scenario 2) correspond to the theoretical curves obtained from the closed-form expression in (24), while the markers denote the results from Monte Carlo simulations.
Telecom 06 00072 g002
Figure 3. Scenario 1 (LoS, HV) and Scenario 2 (LoS, VV), both with Tx-Rx separation of 3.29 m and 60 GHz. The solid (Scenario 1) and dashed lines (Scenario 2) correspond to the theoretical curves obtained from the closed-form expression in (24), while the markers denote the results from Monte Carlo simulations.
Telecom 06 00072 g003
Figure 4. Scenario 1 (LoS, HV) and Scenario 2 (LoS, VV), both with Tx-Rx separation of 3.29 m and 65 GHz. The solid (Scenario 1) and dashed lines (Scenario 2) correspond to the theoretical curves obtained from the closed-form expression in (24), while the markers denote the results from Monte Carlo simulations.
Telecom 06 00072 g004
Figure 5. Scenario 4 (LoS with Tx-Rx separation 2.77 m) and Scenario 3 (nLoS with Tx-Rx separation 3.29 m), at 55 GHz. The solid (Scenario 4) and dashed lines (Scenario 3) correspond to the theoretical curves obtained from the closed-form expression in (24), while the markers denote the results from Monte Carlo simulations.
Telecom 06 00072 g005
Figure 6. Scenario 4 (LoS with Tx-Rx separation 2.77 m) and Scenario 3 (nLoS with Tx-Rx separation 3.29 m), at 60 GHz. The solid (Scenario 4) and dashed lines (Scenario 3) correspond to the theoretical curves obtained from the closed-form expression in (24), while the markers denote the results from Monte Carlo simulations.
Telecom 06 00072 g006
Figure 7. Scenario 4 (LoS with Tx-Rx separation 2.77 m) and Scenario 3 (nLoS with Tx-Rx separation 3.29 m), at 65 GHz. The solid (Scenario 4) and dashed lines (Scenario 3) correspond to the theoretical curves obtained from the closed-form expression in (24), while the markers denote the results from Monte Carlo simulations.
Telecom 06 00072 g007
Table 1. Fitting results obtained for Scenarios 1, 2, 3, and 4 considering the κ μ distribution, as described in [23].
ScenarioFrequency κ μ NMSE [dB]
1–LoS–HV–3.29 m55 GHz 0.43 0.99 17.57
60 GHz 0.84 0.85 16.38
65 GHz 0.77 0.98 17.35
2–LoS–VV–3.29 m55 GHz 2.92 0.96 14.97
60 GHz 24.47 0.19 16.73
65 GHz 2.66 0.83 14.94
3–nLoS–VV–3.29 m55 GHz 2.04 0.81 17.31
60 GHz 1.19 1.57 16.19
65 GHz 1.05 0.84 16.47
4–LoS–VV–2.77 m55 GHz 24.43 0.25 21.16
60 GHz 1.80 2.06 19.62
65 GHz 3.53 1.32 17.89
Disclaimer/Publisher’s Note: The statements, opinions and data contained in all publications are solely those of the individual author(s) and contributor(s) and not of MDPI and/or the editor(s). MDPI and/or the editor(s) disclaim responsibility for any injury to people or property resulting from any ideas, methods, instructions or products referred to in the content.