Article

A Quantitative Study on Multipoint Video Distribution Systems MVDS Interference to GEO Satellites in Lebanon

1
Electrical and Computer Department, Faculty of Engineering, Beirut Arab University, Debbieh Campus, Beirut 1107, Lebanon
2
College of Engineering and Technology, American University of the Middle East, Egaila 54200, Kuwait
*
Authors to whom correspondence should be addressed.
Telecom 2025, 6(2), 36; https://doi.org/10.3390/telecom6020036 (registering DOI)
Submission received: 19 April 2025 / Revised: 16 May 2025 / Accepted: 19 May 2025 / Published: 28 May 2025

Abstract

:
This paper investigates the potential for interference from multipoint video distribution systems (MVDS) transmissions, specifically side lobe radiation in Lebanon, to geostationary Earth orbit (GEO) satellites. Through simulation and analysis of antenna radiation patterns, the impact of varying MVDS power levels on the carrier-to-noise ratio (C/N) at the satellite receiver is quantified. The results demonstrate a significant degradation in signal quality, with the C/N dropping to −2.29 dB at an MVDS power of 0 dBW for the current system. To mitigate this interference, a two-step potential strategy is proposed and evaluated. The study boosts the potential for the coexistence of MVDS and GEO satellite services in the Ku-band within the Lebanese context.

1. Introduction

The growing demand for high-capacity multimedia services—driven by the rapid expansion of cellular networks, high-speed internet access, the Internet of Things (IoT), and television broadcasting—has significantly increased the use of the mid-band spectrum, particularly in the 7 to 24 GHz range [1,2,3]. Within this spectrum, the Ku-band (approximately 10.7 to 14.5 GHz) plays a critical role. It is widely utilized by geostationary Earth orbit (GEO) satellite systems to provide a variety of communication services, especially direct-to-home (DTH) television broadcasting.
In countries like Lebanon, multipoint video distribution systems (MVDS) also operate within the Ku-band, using microwave links to deliver television and multimedia content directly to end users [4]. However, the coexistence of MVDS and GEO satellite systems within this shared frequency band introduces challenges related to signal interference. Since both systems transmit and receive signals in overlapping frequencies, there is an inherent risk of mutual interference that can degrade service quality and reliability.
Mitigating these coexistence issues requires effective interference management strategies and clearly defined regulatory guidelines. International bodies, such as the International Telecommunication Union (ITU), play a crucial role in this domain by issuing recommendations to guide spectrum sharing. For example, ITU-R Recommendation S.1432 provides methodologies for assessing and reducing interference in shared frequency bands [3].
In the case of Lebanon, MVDS networks often use high-power transmission to link headquarters with transmission sites. While this ensures robust terrestrial signal delivery, it also increases the potential for harmful interference with GEO satellites. Conversely, reducing MVDS transmission power can help limit interference but may compromise terrestrial service quality. Therefore, balancing performance and interference mitigation is a key concern in shared Ku-band environments [1,4].
A thorough understanding and characterization of this interference is paramount for developing effective strategies to ensure the harmonious coexistence and reliable operation of both terrestrial MVDS and GEO satellite communications [5]. The use of the radio frequency spectrum, particularly in congested bands like Ku-band, is a significant area of research [6,7]. Frameworks have been developed to analyze the complex interactions and potential interference between different communication systems sharing the spectrum, such as terrestrial systems and satellite systems [8]. Understanding the characteristics of MVDS is essential; these systems use microwave point-to-point links for content distribution and have specific deployment considerations [5,6,8].
Studies have highlighted factors such as the positioning and orientation of MVDS transmitting antennas, which, within urban environments like Beirut, for example, can significantly influence the level of interference experienced by satellites [8]. Some analyses have presented results quantifying this interference under specific conditions or antenna alignments [7,9].
Research related to spectrum sharing often involves evaluating the impact of terrestrial transmissions on satellite services. Methods have been explored for calculating necessary protection zones for GEO systems, considering different terrestrial antenna configurations, such as omnidirectional versus more directional beamforming antennas [10,11]. Results from such studies might indicate the effectiveness of certain antenna techniques in limiting unwanted emissions towards satellites [10,11]. Furthermore, establishing clear guidelines and management approaches is considered vital for mitigating interference and ensuring the long-term viability of spectrum sharing between different services [5]. Additional research has also focused on specific simulation techniques to model these interference scenarios [6,12] and examined relevant regulatory power limits applicable to MVDS operations to protect satellite services [13]. The collective body of work underscores the need for careful system design and coordination, which this paper aims to contribute to by analyzing the specific Lebanese MVDS case.
While existing research often addresses multipoint video distribution systems (MVDS) and their potential interference with satellite services in a general manner or within different geographical and systemic contexts, a specific gap persists in the literature. There is currently a lack of a comprehensive analysis specifically tailored to the unique operational parameters and deployment characteristics of MVDS systems as they are utilized in Lebanon. Furthermore, dedicated studies focusing on the potential impact of these Lebanese MVDS operations on geostationary orbit (GEO) satellite receivers are notably absent. This study, therefore, aims to fill this critical void by providing an in-depth investigation focused on the distinct Lebanese MVDS environment and its specific implications for GEO satellite services.
This paper is structured to provide a comprehensive analysis of the interference between MVDS systems and GEO satellites. Following this introduction, Section 2 will detail the system model, outlining the scenario under investigation and the operational parameters of both MVDS and GEO satellite systems. Section 3 will provide a detailed description of the systems involved, including the technical specifications of MVDS and GEO satellite technologies, as well as the various interference mechanisms considered. Section 4 will focus on the mathematical models used to quantify the different types of interference, including link budget calculations and specific formulations for adjacent satellite interference and MVDS side lobe interference. Section 5 will present and analyze the results obtained from these calculations, comparing ideal scenarios with those incorporating different interference sources. Section 6 will then present a comparative analysis of the interference levels under varying MVDS power and bandwidth conditions. Subsequently, Section 7 will propose and evaluate a potential mitigation strategy to reduce the identified interference. Finally, the paper will conclude with a summary of the key findings and suggestions for future research directions.

2. System Description

MVDS deployments utilize directive antenna systems to transmit signals to end-users efficiently. However, the inherent radiation characteristics of these antennas, particularly the presence of secondary lobes, present a potential source of unintended interference to other satellite communication systems (as shown in Figure 1). This section delineates the fundamental architecture and operational parameters of MVDS, followed by a description of geostationary Earth orbit (GEO) satellite systems, which are inherently vulnerable to interference from terrestrial transmitters such as MVDS. Subsequently, an overview of the key interference mechanisms relevant to the system analysis undertaken in this paper will be presented.
To enhance the readability of the analysis, a comparison between MVDS and GEO satellite systems is provided in Table 1, focusing on aspects relevant to potential interference.

2.1. Multi-Dimensional Video Distribution Systems (MVDS)

Multi-dimensional video distribution systems (MVDS) operate primarily in the Ku-band (10–13.5 GHz) [4,8]. In Lebanon, MVDS efficiently distributes digital television and broadband internet services for point-to-multipoint or point-to-point transmission over large areas using high-power Ku-band transmitters operating in the range of 13.75–14.75 GHz [14]. With higher-frequency bands, MVDS achieves greater bandwidth capacity than earlier systems [8], enabling the delivery of numerous channels and interactive services [4]. Its architecture allows for signal retransmission without regeneration, simplifying deployment. Modern digital modulation techniques enhance spectral efficiency [8].

2.2. Geostationary Earth Orbit (GEO)

Geostationary Earth orbit (GEO) refers to the circular orbit located approximately 35,786 km above the Earth’s equator, where satellites revolve around the planet at the same rotational speed as the Earth. This unique positioning allows GEO satellites to maintain a fixed point in the sky relative to the surface, making them ideal for continuous coverage. Due to their stationary appearance and wide coverage footprint, GEO satellites are frequently used in fixed satellite services (FSS). However, this stationary nature also makes them more susceptible to prolonged interference from terrestrial systems, particularly those operating at similar frequencies or with high power densities, such as MVDS transmitters. GEO satellite systems receive uplink signals in the Ku-band (13.75–14.75 GHz) from ground-based Earth stations (ES) in Lebanon. After amplification and down conversion to the Ku-band downlink frequency (10.75–12.75 GHz), the satellite retransmits these signals to the Earth.

3. System Model

This section establishes the foundational framework for analyzing the interference radiated from MVDS towards GEO satellites. First, an overview of the potential interference mechanisms will be presented. To facilitate a comprehensive investigation, a representative system model is defined (as shown in Figure 1b), encompassing the geographical scenario, the operational frequency bands of the involved systems, and the potential interference pathways.
MVDS is a wireless television distribution system designed to deliver high-quality, multi-channel programming directly to households. It aggregates signals from various sources, including satellites, terrestrial feeds, and IP-based streams. Operating in the Ku-band, MVDS systems typically use high-power transmitters (often above 10 dBW) to provide direct-to-home (DTH) television services. The MVDS transmission infrastructure includes the following two primary types of microwave links.
Repeater link: This link connects transmission sites via intermediate repeater stations. It uses high-power Ku-band uplinks (ranging from 13.75 to 14.75 GHz) with transmission power levels typically between 40 and 50 dBm.
Direct-to-home (DTH) broadcast link: This link transmits content directly to end-users using Ku-band downlink frequencies (10.75 to 13.75 GHz), also with transmission powers in the 40–50 dBm range.
These two components work together to ensure wide coverage and reliable service delivery, especially in areas where traditional cable infrastructure is limited or absent.
Figure 1b illustrates the spatial relationship between the MVDS transmission site and the target satellite (Intelsat1002 at 35° W). The magenta line represents the interference radiated from MVDS toward the satellite transmission link from the MVDS site in Beirut to the satellite.

3.1. Overview of Interference Mechanisms

During signal transmission, several types of interference can degrade the performance of these systems [9,15].
  • Adjacent satellite interference (ASI): Signals from neighboring satellites can interfere with the desired signal;
  • Intermodulation interference (IMI): Non-linear amplification in high-power amplifiers can generate intermodulation products;
  • Cross-polarization interference (XPI): Imperfect polarization isolation in antennas can lead to cross-polarization interference, where signals intended for one polarization can leak into the other;
  • Adjacent channel interference (ACI): Imperfect filtering or insufficient channel guard bands can result in interference from adjacent channels;
  • MVDS interference: Secondary lobes of MVDS antennas can radiate energy towards the satellite, causing interference.
In the context of this work, we will include a theoretical and practical analysis of the carrier-to-noise ratio that includes all these interferences but focuses on ASI and MVDS interferences. Based on the analysis, we will propose recommendations and methods to mitigate MVDS interference and enhance the carrier-to-noise ratio and energy per bit at the satellite level.

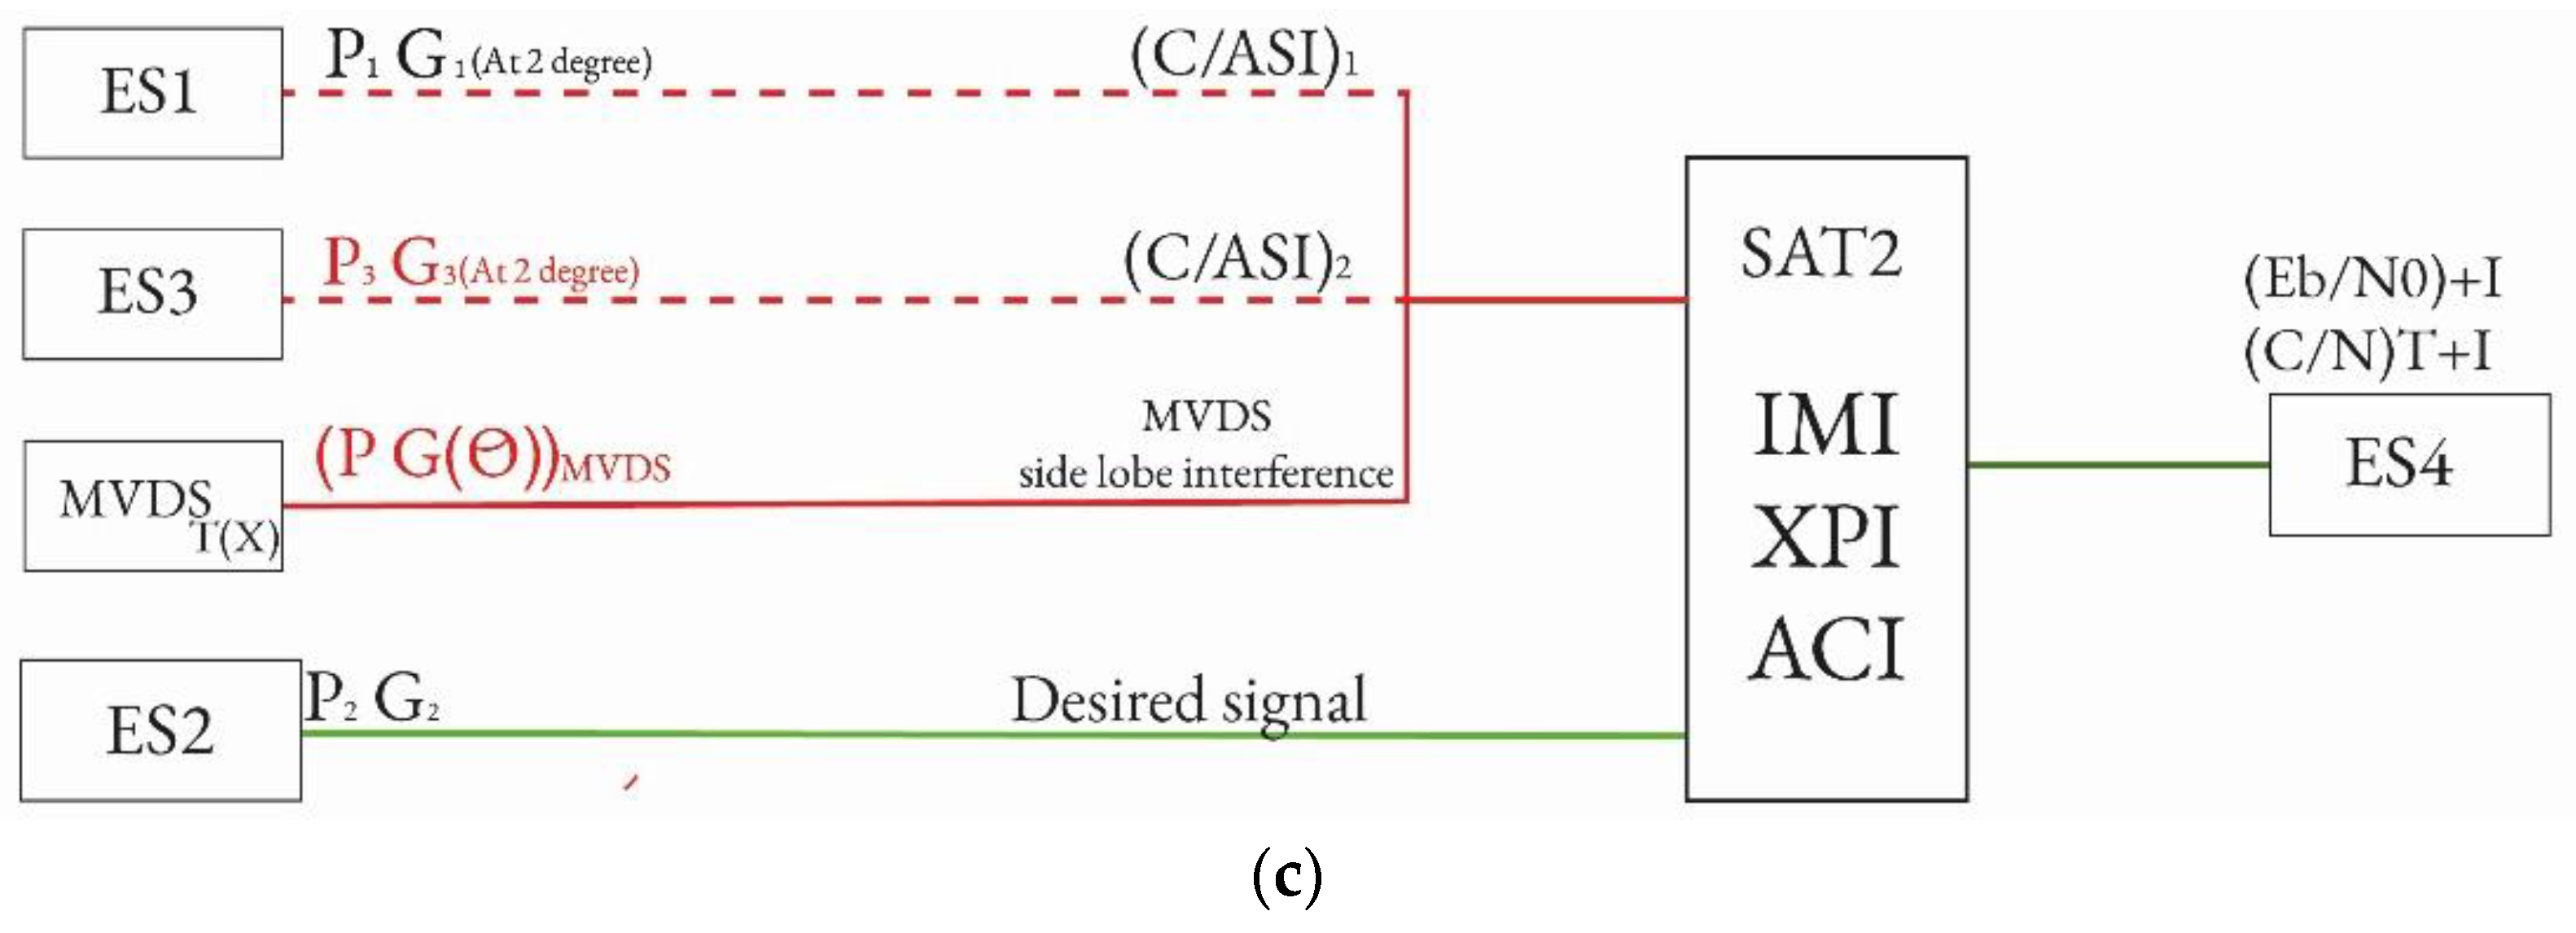
3.2. Scenario Description

Figure 1a illustrates a typical scenario in Lebanon. In this scenario, we consider a single broadcaster MVDS head-end. The head-end co-exists with four Earth stations communicating with three satellites located in the GEO orbit. All the communications between these systems occur in the same Ku-band.
The four earth stations (ES1 to ES4) communicate with three GEO satellites: satellite 1 (S1), the victim satellite (S2), and satellite 3 (S3). Adjacent satellites are spaced 2 degrees apart, as seen from any corresponding ES, as set by the International Telecommunication Union (ITU) [16,17]. In this scenario, the desired signal is transmitted from ES2 towards S2. Satellite S2 retransmits the signal back to ES4, as shown in Figure 1a. This signal suffers from interference. Satellite S2 considered in this study is the IS-1002 located at 35° west. This satellite provides coverage to the area under study (Lebanon) [4].
In practical situations, S2 receives undesired signals from ES1 and ES3 (the dashed red line in Figure 1a). We refer to this type of interference as adjacent satellite interference (ASI). To study its effect, we will evaluate the carrier-to-ASI (C/ASI) value at S2.
Another interference arises from the MVDS broadcaster. This interference comes from the nature of the transmitting antennas used in these systems. These antennas have non-negligible side lobe levels. If a side lobe aligns perfectly with S2, it potentially disrupts the desired signal on S2 (straight red line in Figure 1a). The introduced interference I by the MVDS system is not negligible, as we will show later. We will consider the worst-case scenario where the first side lobe of the MVDS transmitting antenna aligns perfectly with S2. In our case, the satellite most susceptible to interference is the one located at 35 degrees west or 105 degrees east from the observation point in Beirut [4]. Thus, we will consider that S2 is located at 35 degrees west.
In addition, we will consider that ASI, self-interference (including intermodulation, adjacent channel interference, and cross-polarization interference), and MVDS interference all combine to destructively affect the received signal at ES4. This worst-case scenario aims to evaluate the desired signal in a possible realistic setting and will help identify the most reliable recommendations and solutions to mitigate the interference (as shown in the planner block diagram Figure 1c of Figure 1a, which shows all the important parameters).

4. Interference Analysis

This section presents the different parameters and formulas used in our study. The first subsection introduces some parameter definitions and relevant relations used in the study. The second subsection introduces the formulas that will help evaluate the impact of the total interference on the signal.

4.1. Parameter Definitions and Relevant Equations

4.1.1. Parameters

The key parameters used in this work are listed in Table 2.

4.1.2. Relevant Equations

This subsection lists the fundamental equations that relate most of the key parameters listed above. These relations are used to calculate the different carrier-to-interference parameters.
The power flux density (or power density) at a distance r from a point power source P is the total power emitted by the source divided by the surface area of a sphere with radius r centered at P.
The PFD is given in terms of EIRP and d, the distance from the transmitting antenna to the point where PFD is measured, as shown in Equation (1):
P F D = E I R P 4 π d 2
The EIRP can be deduced from the output power of the system (ES or satellite) using Equation (2):
E I R P = G + P
The PFD can be calculated from the IBO using Equation (3):
I B O i = S F D P F D
where SFD is the satellite flux density, typically provided in the satellite’s specifications.
The PFD at the satellite level can be calculated using Equation (4):
P F D = E I R P E S F S L u p L A B S + G 1
where FSLup is the free-space path loss on the uplink, LABS represents atmospheric losses, and G1 signifies the satellite gain.
IBO and OBO are system specifications managing the trade-off between the power efficiency and linearity of the satellite’s high-power amplifier (HPA), as well as the HPA at the Earth station. The satellite’s Fr is related to IBO and OBO by Equation (5):
F r = I B O I B O i = O B O O B O i
E b N 0 is a fundamental and crucial parameter in digital communication systems. It provides a fundamental measure of the system’s power efficiency and compares the performance of different modulation/coding schemes, even if they operate at different bandwidths. There is a direct relation between C N and E b N 0 . To calculate the key ratio E b N 0 , Equation (6) is used:
C N = 10 log E b N 0 + 10 l o g r B
where C N can be calculated from C N 0 , as in Equations (7) and (8):
C N = C N 0 t o t a l 1 B  
O r :   C N d B = C N 0 T o t a l 10 l o g 10 ( B )

4.2. Mathematical Models for Interference Calculation

This subsection details the mathematical models employed in our analysis. We will present the formulations used to calculate the power ratios of various interference types, including adjacent satellite interference and, most importantly, the interference originating from MVDS side lobes.

4.2.1. Link Budget Calculation

A link budget meticulously accounts for all the power gains and losses that a signal experiences as it travels from the transmitter to the receiver. This includes the transmitted power, the gains of the transmitting and receiving antennas, various propagation losses (such as free-space loss and atmospheric attenuation), and any other gains or losses within the system. By carefully constructing the link budget for the interfering signal path, we can accurately estimate the interference power level at the victim receiver.
  • Uplink Carrier-to-Noise Density Calculations
The uplink carrier power-to-noise power spectral density ratio at the satellite receiver input, denoted as C N 0 u p , is a key metric for evaluating the quality of the uplink. This ratio considers the uplink system thermal noise. The calculation of C N 0 u p at the S2 receiver, neglecting other potential noise contributions, is given by the Equation (9) [9,18]:
C N 0 u p = E I R P E S F S L u p L A B S + G s a t T + k
where   F S L = 32.4 + 20 log f + 20 log ( R )
In Equation (10), the frequency is used in MHz and R in km. These formulas will be used in the Results section to evaluate the signal power levels and the interferences associated.
  • Downlink Carrier Power-to-Noise Calculations
The downlink carrier power-to-noise power spectral density ratio at the ES4 receiver input can be calculated from Equation (11):
C N 0 d o w n = E I R P s a t F S L d o w n L A B S + G T E S + k
In the next subsection, we present the C/ASI calculations in our considered scenario.

4.2.2. Adjacent Satellite Interference (C/ASI)

In satellite communication, adjacent satellite interference can significantly impact the quality of satellite signals. This discussion aims to shed light on both aspects of adjacent interference to estimate their cumulative effect.
ITU Recommendation ITU-RS.465-6 offers valuable guidelines for determining the off-axis gain pattern [19,20]. This gain pattern is represented by the equation G(θ) = 29–25 log(θ) dBi. For example, considering the case of ES1 and for θ = 2°, G(2°) will correspond to the gain value at 2° angle from the primary line joining ES1 to S2.
In our case, the ASI on S2 comes from similar systems on both sides (ES1 and ES3). We will derive the formula for C A S I that takes this particular condition into account.
Formula (2) can be used to calculate the value of the EIRP uplink from ES1 toward the operating satellite S2 in off-axis conditions, as given in Equation (12):
E I R P u p _ E S 1 = P E S 1 + G O f f a x i s _ E S 1
Considering G o f f a x i s _ E S 1 = G θ , the interfering signal power from ES1 towards S2, E I R P u p _ E S 1 , is given by Equation (13):
E I R P u p _ E S 1 = P E S 1 + 29 25 L o g ( θ )
Note that, since we are considering identical ES characteristics, the signal arriving at S2 from ES3 has the same EIRP value as E I R P u p _ E S 1 . However, the signal arriving at S2 from ES2 will be calculated with Equation (14):
E I R P u p _ E S 2 = P E S 2 + G E S
Now, ASI0_ES1 due to the interference from ES1 is determined by E I R P u p _ E S 1 and the path loss experienced by the signal all the way to S2 transmitted from ES1. On the other hand, the desired signal at S2 is determined by E I R P u p _ E S 2 and the path loss experienced by the signal all the way to S2 transmitted from ES2. Considering this, C A S I 0 _ E S 1 can be calculated as in Equation (15):
C A S I 0 _ E S 1 = C E S 2 A S I E S 1 = E I R P u p E S 2 P L E S 2 S 2 E I R P u p E S 1 P L E S 1 S 2 = P E S 2 + G + P L E S 2 S 2 [ P E S 1 + G θ P L E S 1 S 2 ]
Since the distance from the ES to the satellite is large, we can consider equal path loss values. Considering the assumptions made, P E S 2 = P E S 1 and P L E S 2 S 2 = P L E S 1 S 2 , Equation (15) becomes:
C A S I 0 _ E S 1 = G G θ = G [ 29 25 L o g θ ]
Adding the interference from ES3, Equation (16) becomes:
C A S I 0 t o t a l = G 29 25 L o g θ 3 d B = 23.03   dB - Hz
Using Equation (8) to calculate the total carrier-to-ASI ratio per bandwidth of B = 30 MHz:
C A S I =   25.7   +   10   Log   ( 30   ×   106 )   =   97.8   dB
In the following section, we will evaluate the interference from the MVDS broadcaster on S2.

4.2.3. MVDS Side Lobe Interference

This subsection will present the MVDS details and the mathematical formula used to calculate the interference power received by GEO satellite S2 due to the radiation from the side lobes of the MVDS transmitting antennas. This model will consider the key parameters influencing this interference, including the MVDS transmitter’s power, the antenna’s off-axis radiation pattern, the angular separation between the MVDS transmitter and the GEO satellite, and the path loss experienced by the interfering signal as it propagates through the atmosphere and space.
The lowest satellite elevation observed in Beirut, located at 35 degrees east longitude, has a footprint that covers the city. The satellite’s footprint coverage is shown in Figure 2 [21]. S2 has a figure of merit G T S 2 of 5.6 dB/K in the coverage region where Lebanon is located.
To accurately assess the potential for interference from an MVDS system to GEO satellite S2, we analyze the side lobe radiation patterns of a representative 1.2 m parabolic antenna, commonly employed in MVDS transmissions in Lebanon. Figure 3 illustrates the far-field elevation pattern of the antenna at 14 GHz. The antenna exhibits a high directivity with a maximum gain of 41.5 dB at 0.0 degrees and a narrow 3 dB beamwidth of 1.1 degrees. This orientation typically corresponds to the direction of the intended terrestrial coverage area. The side lobe levels are relatively suppressed, with the highest side lobe being approximately −11.3 dB below the main lobe peak, resulting in a gain of around 30.2 dB at approximately ±2 degrees off the main beam. This gain level is substantial and can induce interference at the GEO satellite (S2) if the side lobe happens to be directed towards it. While other secondary lobes also contribute to the overall interference potential, for the purpose of establishing a conservative, worst-case interference estimate, we assume that the peak of the first secondary lobe, with a gain of 30.2 dBi, is perfectly aligned with the direction of GEO satellite S2. This assumption facilitates the derivation of robust recommendations and mitigation strategies aimed at minimizing interference from MVDS transmissions.
The interference radiated from MVDS can be calculated by utilizing Equation (19) [5]:
I = P M V D S 4 π R 2 G ( θ ) M V D S     λ 2 4 π     1 B W
where λ represents the wavelength in free space at the operating frequency, and G ( θ ) M V D S represents the antenna’s off-axis performance. These parameters collectively contribute to the formulation of interference calculations and are instrumental in assessing the impact of MVDS transmissions’ interference on GEO satellites.

5. Results

This section presents the results of the interference analysis conducted based on the system model and mathematical frameworks detailed in the previous sections. We will explore various cases to quantify the impact of different interference sources on the GEO satellite system. The satellite uplink and downlink specifications are listed in Table 3. Initially, we will establish a baseline by examining an ideal scenario devoid of interference. Subsequently, we will present the results obtained when considering adjacent satellite interference (ASI) and then the specific interference arising from MVDS transmissions.

5.1. Ideal Scenario (No Interference)

In the considered real-world scenario, a desired signal is transmitted from ES2 via the victim satellite (S2: IS-1002 at 35° west) and received by ES4. In this first step, we consider an ideal scenario where no interference exists on the signal traveling between the ESs and satellite S2. We will consider a typical case of an ES transmitting with a power of 5 dBW, a QPSK modulated signal with a bandwidth B = 3 MHz, and an EIRP of 52.5 dBW during clear weather conditions. A typical ES has a figure of merit of 24 dB/K. The signal power levels, in this case, can be calculated using the end-to-end link budget equation presented previously. This begins with determining the uplink carrier-to-noise density ratio using Equations (9) and (10) and the S2 specifications.
Using Equation (10) and (20) calculates the FSL:
FSL = 32.4 + 20log (14,000) + 20 log (40,973) = 207.57 dB
Using Equations (9) and (20), we get:
C N 0 u p = 47.5 + 5 207.573 L A B S + 5.6 + 228.6 = 79.12   dB - Hz
It is well-established that the total atmospheric and ionospheric absorption loss L A B S in the Ku-band can range from less than 1 dB under clear sky conditions to over 10 dB, and potentially exceed 20 dB during heavy rainstorms. Given that this study considers a practical scenario within Beirut territory, which experiences a significant number of clear sky days annually (estimated at approximately 200, while severe weather conditions are rare), it is important to evaluate the expected magnitude of L A B S under such prevalent conditions. While some atmospheric and ionospheric absorption is inherent even under clear-sky conditions at Ku-band frequencies, this effect becomes more significant when considering the typically low elevation angles of signals transmitted from terrestrial stations to geostationary satellites, these losses are typically in the order of 0.5 dB. For the purpose of this initial analysis, and acknowledging that precipitation events would introduce considerably higher attenuation, we will proceed with the assumption that the clear sky L A B S represents a relatively small contribution to the overall path loss. However, a more comprehensive analysis in future work could incorporate the statistical impact of varying weather conditions and elevation angles on L A B S .
Similarly, using Equations (10) and (11) and Table 3, C N 0 d o w n can be calculated using (22) and (23):
FSLdown = 32.4 + 20log (12,000) + 20 log (40,973) = 206.2 dB
C N 0 d o w n = 25.6 206.2 + 24 + 228.6 = 72   dB - Hz
Now, Equation (24) calculates the end-to-end carrier-to-noise density ratio C N 0 T o t a l in the considered ideal case:
C N 0 T o t a l 1 = C N 0 u p 1 + C N 0 D o w n 1 =   71.2 dB - Hz
Using Equation (8), C N can be calculated using Equation (25) as:
C N = C N 0 T o t a l 10 l o g 10 ( 3 × 10 6 ) = 6.5   dB
Using Equation (25), the energy per bit-to-noise power spectral density E b N 0 can be calculated using Equation (26):
C N = 10 l o g E b N 0 + 10 log r B E b N 0 = 4.9   dB - Hz
Table 4 summarizes the calculated values for the considered 3 MHz bandwidth QPSK signal under ideal conditions. In a later section, we will study the effect of varying the bandwidth of the signal.
In the following section, we will start considering more real-life scenarios by including the ASI.

5.2. Scenario with ASI Interference

ASI interference, calculated using Equation (18), is added to determine its impact on ideal end-to-end performance (Equation (27)). The results are shown in Table 4.
C N 0 T o t a l 1 = C N 0 u p 1 + C N 0 D o w n 1 + C A S I 1
The decrease in [C/N] and [Eb/N0] suggests a reduction in the signal quality and an increased likelihood of errors in the received data. The magnitude of the degradation, around 1 dB to 1.2 dB, is significant and should be considered in the overall system design and interference mitigation strategies to ensure reliable communication.
In the next section, the impact of the MVDS broadcaster on the received signal at ES4 is studied.

5.3. Real Scenario with MVDS Interference

This section calculates a real-life satellite signal scenario. We introduce various interference types—adjacent satellite interference (ASI), adjacent channel interference (ACI), carrier-to-intermodulation (C/IM), and carrier-to-cross-polarization (C/XP). In our case, the self-interference values at the corresponding operating frequencies are summarized in Table 5.
C N 0 T o t a l 1 = C N 0 u p 1 + C N 0 D o w n 1 + C A S I 1 + C I M 1 + C ACI 1 + C X P 1 + C M V D S 1
We consider different power levels of the MVDS broadcaster (−10 dBW to 10 dBW). Table 6 presents a comprehensive analysis of the MVDS side lobe interference effect on the GEO satellite system in a realistic scenario. This table quantifies the impact of increasing MVDS transmitted power on key performance metrics at the satellite receiver.
Table 6 clearly demonstrates an inverse relationship between the transmitted power of the MVDS system and the quality of the signal received at the GEO satellite. As the MVDS power increases from −10 dBW to 10 dBW, we observe a consistent decrease in C N 0 t o t a l , C N , and E b N 0 . This degradation in the carrier-to-noise ratios directly translates to a decline in the perceived signal quality.
At −5 dBW, the quality is “fair,” and it further degrades to “critical” when the MVDS power reaches 0 dBW. This critical point corresponds to a E b N 0 of −3.93 dB, indicating that the interference power is approaching or exceeding the carrier power.
Beyond 0 dBW, the values become significantly negative, resulting in a “bad” signal quality. This signifies a severe level of interference where the desired signal is likely overwhelmed by the noise and interference from the MVDS side lobes, rendering the communication link unreliable.
These findings underscore that even the side lobe emissions from MVDS transmitters can have a substantial impact on satellite link performance, particularly as the MVDS power increases.
In the following section, we investigate the impact of the MVDS interference for different power levels when the signal bandwidth is varied.

6. Comparative Interference Analysis

This section presents a comparative analysis of the impact of varying MVDS interference levels on the satellite communication link. To evaluate the system’s resilience, we simulated the performance in different potential MVDS interference scenarios, ranging from −10 dBW to 10 dBW of MVDS transmitted power. These simulations were conducted across a bandwidth of 1 to 7 MHz, a typical range for MVDS communication channels. The results are visualized in Figure 4 and Figure 5, illustrating the relationship between bandwidth B and C N , and E b N 0 , respectively, at different MVDS interference power levels.
Figure 4 displays the variation of C N versus B for an ideal signal (no interference) and under the influence of MVDS interference at power levels of −10 dBW, −5 dBW, 0 dBW, 5 dBW, and 10 dBW. As expected, for all scenarios, as the bandwidth increases, the C N ratio decreases. This is because a wider bandwidth captures more noise power, thus reducing the ratio of carrier power to the total noise and interference power. Notably, the ideal signal (no interference) consistently exhibits the highest C N values across the entire bandwidth range. The introduction of MVDS interference progressively degrades the C N , with higher MVDS power levels resulting in more significant reductions. For instance, at a bandwidth of 3 MHz, the C N for the ideal case is approximately 6.5 dB. However, with 10 dBW of interference, this value drops to around −12 dB.
Figure 5 presents a similar analysis that focuses on the E b N 0 ratio. This metric is crucial for assessing the bit error rate performance of a digital communication system. The trends observed in Figure 5 mirror those in Figure 4. At a bandwidth of 3 MHz, the ideal E b N 0 is around 4.9 dB, while with 10 dBW of MVDS interference, it plummets to approximately −13.9 dB. These results indicate a severe degradation in the energy per bit relative to the noise and interference, suggesting a significant impact on the reliability of the communication link at higher MVDS interference levels. The critical threshold where E b N 0 becomes negative is crossed at MVDS power levels of 0 dBW and above, implying a high probability of communication failure under such conditions.
The analysis presented in this section demonstrates the detrimental effects of MVDS side lobe interference on the GEO satellite communication link, with the severity of the impact directly proportional to the transmitted power of the MVDS system. The significant reduction in both C N and E b N 0 at higher MVDS power levels underscores the need for effective mitigation strategies. In the next section, we will introduce possible simple solutions to address this issue.
This outcome suggests that operators can leverage the findings to facilitate a shift towards lower-power transmission strategies. By adopting innovative, high-gain low-noise amplifier (LNA) technologies, it becomes feasible to decrease the transmission power of MVDS systems while maintaining, and potentially improving, service quality. This reduction in transmission power is crucial for mitigating potential interference with geostationary (GEO) satellites, a critical consideration for efficient spectrum utilization and harmonious coexistence of different satellite services. This approach aligns with the growing need for efficient use of the radio frequency spectrum and can contribute to more sustainable telecommunications practices.
Operators can effectively leverage high-gain LNA technologies to reduce transmission power requirements. Adjustments at the transmitter side, such as replacing high-power transistors with lower-power alternatives, can further contribute to this reduction. These modifications can typically be made by in-house engineers without incurring significant additional costs.
High-gain LNAs are available from MVDS equipment manufacturers at prices ranging from a few hundred dollars, depending on the brand and country of origin [21,22]. Overall, the transition is considered affordable for MVDS operators.
A phased transition plan is crucial for the successful adoption of new LNA technologies and low-power transmitters. This approach enables a smooth migration, minimizes service disruption, and allows operators to prioritize critical regions and high-interference zones during the rollout.

7. Interference Mitigation Strategies

Currently, the MVDS system in Lebanon utilizes high-power transmitters with power levels ranging from 10 to 15 dBW. The receiving amplifier gain (low-noise amplifier [LNA] gain) at the MVDS receiver is 30 dB. The regulatory landscape in Lebanon lacks specific guidelines for determining the transmission power gain of microwave video distribution systems (MVDS). However, there is a long-standing adherence to the International Telecommunication Union (ITU) recommendation Rec. ITU-R S.2029, which addresses both long-term and short-term interference. Additionally, ITU recommendation Rec. ITU-R S.1432 offers several protective measures for fixed satellite services, one of which concerns the degradation of error performance and availability due to frequency sharing.
This excerpt clarifies how interference allowances are quantified as a percentage of the system’s noise power. It explains that interference equal to 10% of the system noise results in an interference-to-noise ratio (I/N) of −10 dB. Furthermore, it posits that a 1 dB increase in noise leads to a tenfold increase in the bit error rate (BER). Based on this relationship, the passage provides specific I/N values for different BER percentages: −2.4 dB for 0.03% of any month and 0 dB for 0.005% of any month. By extending this trend, an I/N of −12 dB is estimated for 100% of any month, which is equivalent to 6% of the satellite system’s noise power.
These system parameters, particularly the transmitter’s side lobe gain and power gain, contribute significantly to potential interference with GEO satellites. Analysis has shown that these power levels could severely degrade the desired signal quality at the satellite in a worst-case scenario. To mitigate this interference, we present a two-step method. The first step of the proposed solution suggests reducing the MVDS transmitted power, and the second step involves employing a new antenna design with lower side lobes. In this analysis, the contributions from intermodulation interference (IMI) and cross-polarization interference (XPI) were incorporated as constant baseline values in the total interference budget. This is justified because the primary factors dictating XPI (antenna polarization discrimination) were unchanged, and the relevant amplifying stages (e.g., MVDS transmitter, satellite transponder) were assumed to operate under conditions where their IMI generation remained consistent across the specific parameters being varied in this study. This approach allows for a focused assessment of the impact of varying ASI and MVDS side lobe interference.

7.1. Step 1: Adjusting MVDS Transmission Power and Receiver LNA Gain

The first step of the proposed solution involves reducing the MVDS transmitted power significantly. The current transmission power is around 10 dBW. To minimize interference to negligible levels at the GEO satellite while maintaining MVDS performance, the MVDS transmission power gain can be reduced to −10 dBW. To compensate for this substantial reduction in transmission power and preserve the quality of service for MVDS customers, the gain of the low-noise amplifier (LNA) at the MVDS receiver can be simultaneously enhanced from the existing 30 dB to 65 dB (commercially available). This trade-off ensures that the reduced transmission power is offset by increased receiver sensitivity, thereby preserving the necessary signal quality for the MVDS link while significantly decreasing the interference radiated towards the GEO satellite.
To validate our claim of preserving the quality of service for MVDS customers, the new proposed MVDS system is solely simulated using a radio network planning and optimization tool based on integrated communication systems (ICS) and automated spectrum management solutions (ATDIs). Table 7 illustrates the parameters of both the current and proposed MVDS systems used in the simulation software.
Table 7 shows the power levels at the output receiver LNA in both cases. These results confirm that the proposed system maintains sufficient signal quality to preserve the expected quality of service for MVDS users. In the second step, we suggest decreasing the off-axis gain of the used parabolic antenna at the MVDS broadcaster.

7.2. Step 2: Utilizing an Improved Antenna with Reduced Side Lobes

Established techniques for enhancing RF device performance include strategies for both interference protection and radiation pattern control. High-power interference mitigation often involves broadband protective components like superconducting or shielded transmission lines [23,24]. Concurrently, side lobe suppression, crucial for minimizing off-axis interference, can be achieved using advanced materials [25,26], optimized antenna geometries, or modified reflectors. However, given that the existing antenna is ill-suited for the target operational scenario in Lebanon, this work focuses on a fundamental antenna redesign. This approach is selected over applying mitigation techniques like advanced materials or shielding to a baseline design not inherently optimized for the required performance.
The currently used 1.2 m parabolic antenna exhibits a first side lobe gain of approximately 30 dBi. To reduce the interference towards the GEO satellite at 35° west, a new antenna design is proposed.
The antenna is designed and optimized using computer simulation technology (CST) software (Figure 6a). The new antenna has a diameter of 1.1 m. The far-field pattern of the proposed antenna is shown in Figure 6b. The plot shows that the proposed antenna achieves a main lobe magnitude of 42 dB, which is comparable to the 41.5 dB of the currently used antenna, ensuring that the signal strength in the intended coverage area (MVDS customers in Beirut) is maintained. The 3 dB angular width of the main lobe is 1.4 degrees, a slight increase from the current 1.1 degrees. The most significant improvement is observed in the side lobe levels. The proposed antenna exhibits a side lobe level of −28.7 dB relative to the main lobe. This translates to a first side lobe gain of approximately 13.9 dB, a substantial reduction of over 16 dB compared to the first side lobe gain of the currently used antenna (approximately 30.2 dB).
Table 8 presents the updated calculated interference levels at the ES4 when PMVDS is reduced and the proposed antenna design is employed. The expected interference levels are considerably lower compared to the previous scenario, as shown in Table 6 (−10 dBW to 10 dBW). It presents a comprehensive analysis of the MVDS side lobe interference effect on the GEO satellite system in a realistic scenario. This table quantifies the impact of increasing MVDS transmitted power on key performance metrics at the satellite receiver.
The proposed system’s signal quality remains above the “critical” threshold up to 5 dBW, whereas the current system reaches the “critical” level at 10 dBW. This table demonstrates the effectiveness of the proposed two-step mitigation technique in decreasing the interference caused by MVDS side lobe radiation towards GEO satellites across a range of MVDS transmission powers.

8. Discussion

This study confirms that MVDS side lobe radiation presents a significant interference threat to GEO satellite links in the shared Ku-band within Lebanon. Our quantitative analysis shows substantial degradation in signal quality metrics ( C N and E b N 0 ) as MVDS power increases, reaching critical levels even at 0 dBW, highlighting the need for mitigation.
The findings support the proposed two-step mitigation strategy: reducing MVDS transmit power (compensated by increased receiver LNA gain) and employing an antenna with significantly lower side lobe gain. This combined approach effectively reduces interference impact, facilitating coexistence while maintaining MVDS service quality, as indicated by the preserved receiver output power and improved signal quality thresholds.
While based on specific modeling assumptions, including worst-case side lobe alignment and clear sky conditions, the results clearly demonstrate the potential for harmful interference and the viability of the proposed mitigation techniques for the Lebanese operational context.

9. Conclusions and Future Work

This study has investigated the interference potential of MVDS side lobe radiation on GEO satellites operating in the Ku-band. The results indicate that reducing the MVDS transmission power to −20 dBW and simultaneously increasing the LNA gain at the MVDS receiver to 65 dB can effectively maintain the MVDS service quality while minimizing interference to the GEO satellite. Furthermore, adopting a new antenna design with a first side lobe gain of 13.9 dBi, compared to the 30 dBi of the currently used antenna, demonstrates a significant reduction in off-axis radiation, leading to a substantial improvement in the interference environment for the GEO satellite.
For future work, several avenues of research could be explored further. Investigating the impact of different modulation schemes and bandwidths used by MVDS systems on the interference levels would provide a more comprehensive understanding. Analyzing the potential for worst-case interference and the likelihood of it disrupting the intended satellite signal necessitates a comprehensive evaluation of aggregated interference from multiple MVDS transmissions, both within Lebanon and potentially from neighboring regions.
To accurately estimate the real interference impact of MVDS operations, a probabilistic approach should be adopted.
This analysis would involve the following.
  • Modeling the radiation patterns of typical MVDS transmitting antennas: This includes considering the main beam and side lobe characteristics to understand the spatial distribution of the radiated power;
  • Determining the geographical distribution and density of MVDS transmitters: Understanding the locations and number of active MVDS systems is crucial for assessing the cumulative interference;
  • Considering the operating frequencies and transmission power of each MVDS transmitter: These parameters directly influence the strength of the interference signal received at the satellite;
  • Analyzing the effects of varying weather conditions, particularly rain attenuation, on both the desired MVDS signal and the interference path to the satellite would add another layer of realism to the study.
Also, several promising directions exist for future research in this area.
  • Advanced interference mitigation: Exploring advanced interference mitigation techniques, such as those employing AI-based dynamic spectrum management, could significantly enhance the efficiency and robustness of MVDS systems. AI algorithms can learn and adapt to changing interference conditions, enabling real-time optimization of spectrum use and minimizing disruption to other services.
  • On-board regenerative satellite processing: Further evaluation of on-board regenerative satellite processing is warranted. This technology, which involves demodulating, processing, and remodulating signals on the satellite, can improve signal quality, reduce interference, and enable more flexible and efficient use of satellite resources.

Author Contributions

Conceptualization, H.I.; Methodology, H.I. and A.K.; Formal analysis, A.K. and M.A.-H.; Investigation, A.K. and H.A.; Data curation, A.K.; Writing—original draft, A.K.; Writing—review & editing, H.I.; Supervision, H.A. and H.I.; Project administration, H.I. All authors have read and agreed to the published version of the manuscript.

Funding

This research received no external funding.

Data Availability Statement

Data is contained within the article.

Conflicts of Interest

The authors declare no conflict of interest.

Abbreviations

The following abbreviations are used in this manuscript.
AbbreviationMeaning
MVDSMultipoint video distribution systems
GEOGeostationary Earth orbit
C/NCarrier-to-noise ratio
dBWDecibel watt
FSSFixed satellite services
ESEarth stations
ASIAdjacent satellite interference
IMIIntermodulation interference
XPICross-polarization interference
ACIAdjacent channel interference
ITUInternational Telecommunication Union
IS1002Intelsat 1002
C/ASICarrier-to-adjacent satellite interference
dBiDecibels relative to isotropic
MHZMegahertz
C/IMCarrier-to-intermodulation interference
C/XPCarrier-to-cross-polarization interference
ATDIAutomated spectrum management solutions
ICSIntegrated communication systems
LNALow-noise amplifier
RFRadio frequency
CSTComputer simulation technology

References

  1. Kang, S.; Geraci, G.; Mezzavilla, M.; Rangan, S. Terrestrial-Satellite Spectrum Sharing in the Upper Mid-Band with Interference Nulling. In Proceedings of the ICC 2024—IEEE International Conference on Communications, Denver, CO, USA, 9–13 June 2024; pp. 5057–5062. [Google Scholar] [CrossRef]
  2. Niloy, T.S.R.; Hasan, Z.; Smith, R.; Anapana, V.R.; Shah, V.K. Context-Aware Spectrum Coexistence of Terrestrial Beyond 5G Networks in Satellite Bands. In Proceedings of the 2024 IEEE International Symposium on Dynamic Spectrum Access Networks (DySPAN), Washington, DC, USA, 13–16 May 2024. [Google Scholar] [CrossRef]
  3. Zhang, L.; Li, Z.; Yang, S. Evaluating the Influence of Satellite Systems on Terrestrial Networks: Analyzing S-Band Interference. Electrical Engineering and Systems Sciences Signal Processing. arXiv 2024, arXiv:2501.05462. [Google Scholar] [CrossRef]
  4. Karaki, A.; Abdalla, H.; Issa, H. Investigating Ku-band Up-Link Interference from Terrestrial Microwaves on Satellite Reception. In Proceedings of the 5th IEEE Middle East and North Africa Communications Conference (MENACOMM), Byblos, Lebanon, 20–22 February 2025; pp. 1–6. [Google Scholar] [CrossRef]
  5. Braun, C.; Voicu, A.M.; Simic, L.; Mahonen, P. Should We Worry About Interference in Emerging Dense NGSO Satellite Constellations. In Proceedings of the 2019 IEEE International Symposium on Dynamic Spectrum Access Networks (DySPAN), Newark, NJ, USA, 11–14 November 2019; pp. 1–10. [Google Scholar] [CrossRef]
  6. Hills, A.; Peha, J.M.; Munk, J. Feasibility of Using Beam Steering to Mitigate Ku-Band LEO-to-GEO Interference. IEEE Access 2022, 10, 74023–74032. [Google Scholar] [CrossRef]
  7. Hills, A.; Peha, J.M.; Munk, J. Controlling Antenna Sidelobe Radiation to Mitigate Ku-Band LEO-to-GEO Satellite Interference. IEEE Access 2023, 11, 71154–71163. [Google Scholar] [CrossRef]
  8. Zhang, C.; Jiang, C.; Kuang, L.; Jin, J.; He, Y.; Han, Z. Spatial Spectrum Sharing for Satellite and Terrestrial Communication Networks. IEEE Trans. Aerosp. Electron. Syst. 2019, 55, 1075–1089. [Google Scholar] [CrossRef]
  9. Maral, G.; Bousquet, M.; Sun, Z. Satellite Communications Systems: Systems, Techniques and Technology; John Wiley & Sons: Hoboken, NJ, USA, 2020. [Google Scholar]
  10. Ren, Z.; Jin, J.; Li, W.; Wen, R.; Zhan, Y. Frequency Prediction and Assignment among SatComs Networks: A CNN-LSTM Approach. In Proceedings of the 2022 IEEE/CIC International Conference on Communications in China (ICCC Workshops), Foshan, China, 11–13 August 2022; pp. 106–111. [Google Scholar] [CrossRef]
  11. Liu, H.; You, Y.; Shi, L. Multi-domain united link adaptation technique in high-throughput satellite communication system. J. Phys. 2023, 2469, 012027. [Google Scholar] [CrossRef]
  12. Susanto, A.; Iskandar, I. Analysis of Uplink and Downlink Interference between NGSO and GSO Satellites at Ku Band Frequency: Case Study on Starlink and Telkom-3S. In Proceedings of the 2024 10th International Conference on Wireless and Telematics (ICWT), Batam, Indonesia, 4–5 July 2024; pp. 1–5. [Google Scholar] [CrossRef]
  13. Ma, Y.; Zhu, J.; Wu, L. ASI regulations comparison for GSO satellite communication system at Ku-band. In Proceedings of the 2015 International Conference on Control Electronics, Renewable Energy and Communications (ICCEREC), Bandung, Indonesia, 27–29 August 2015; pp. 171–175. [Google Scholar] [CrossRef]
  14. Yu, H.; Zhang, R.; Ding, R. Interference Recognition Based on Machine Learning for Satellite Communications. In Proceedings of the ICMLT ‘18: Proceedings of the 2018 International Conference on Machine Learning Technologies, Jinan, China, 19–21 May 2018. [Google Scholar] [CrossRef]
  15. Ippolito, L.J., Jr. Satellite Communications Systems Engineering: Atmospheric Effects, Satellite Link Design and System Performance, 2nd ed.; John Wiley & Sons: Hoboken, NJ, USA, 2017. [Google Scholar]
  16. International Telecommunication Union. Maximum Permissible Levels of Off-Axis. 28 November 2024. Available online: https://www.itu.int/rec/R-REC-S.524/en (accessed on 29 November 2024).
  17. Ip, W.-C.; Vong, C.-Y.; Zhang, R. Measured Downlink Adjacent Satellite Interference of C-Band Satellites with 2° Orbital Separation; World Academy of Science, Engineering and Technology: Istanbul, Türkiye, 2012; Volume 69. [Google Scholar]
  18. Wang, T.; Qian, Z. Coexistence Interference Analysis of 28 GHz IMT and Fixed-Satellite Service Systems. In Proceedings of the 2017 IEEE 2nd Advanced Information Technology, Electronic and Automation Control Conference (IAEAC), Chongqing, China, 25–26 March 2017. [Google Scholar]
  19. International Telecommunication Union. Satellite System Characteristics Should Be Considered in Frequency-Sharing Analyses Within the Fixed-Satellite Service. July 2024. Available online: https://www.itu.int/rec/R-REC-S.1328-5-202407-I/en (accessed on 1 January 2020).
  20. Marvasti, M.; Ghayekhloo, A.; Boutayeb, H. Parabolic Reflector Antenna Design to Generate Pure High Order Vortex Modes at 24 GHz. In Proceedings of the 2023 International Conference on Engineering and Emerging Technologies (ICEET), Istanbul, Türkiye, 27–28 October 2023; pp. 1–3. [Google Scholar] [CrossRef]
  21. Intelsat. Satellite Frequency Allocations; Intelsat: McLean, VA, USA, 2024. [Google Scholar]
  22. UMT. UMT TV [Wireless TV Broadcasting]. Available online: https://umt-tv.com/ (accessed on 15 July 2024).
  23. Sotnikov, O.; Petrov, K.; Udovenko, S.; Gnusov, I.; Radchenko, V.; Kaliakin, S.; Gromliuk, K.; Kyrychenko, O. The Use of Coplanar Transmission Lines for Protecting Receiving Antenna Systems from Powerful Electromagnetic Radiation in a Wide Frequency Range. Probl. Reg. Energetics 2023, 1, 134–146. [Google Scholar] [CrossRef]
  24. Kaddour, D.; Issa, H.; Abdelaziz, M.; Podevin, F.; Pistono, E.; Duchamp, J.M.; Ferrari, P. Design guidelines for low-loss slow-wave coplanar transmission lines in RF-CMOS technology. Microw. Opt. Technol. Lett. 2008, 50, 3029–3036. [Google Scholar] [CrossRef]
  25. Jordanova, L.T. Reduction of the Stoslobes in the Parabolic Antenna Radiation Pattern, Using Absorbing Ferrites. In Proceedings of the Sixth International Wroclaw Symposium on Electromagnetic Compatibility, Wroclaw, Poland, 22–24 June 1982; p. 152. [Google Scholar] [CrossRef]
  26. Nassiopoulou, A.G.; Hourdakis, E.; Sarafis, P.; Ferrari, P.; Issa, H.; Raskin, J.P.; Roda Neve, C.; Ben Ali, K. Porous Si as a substrate material for RF passive integration. In Proceedings of the 14th International Conference on Ultimate Integration on Silicon (ULIS), Coventry, UK, 19–21 March 2013; pp. 89–93. [Google Scholar] [CrossRef]
Figure 1. (a) Interference scenario between the GEO satellite and MVDS transmitter. (b) Locations of the satellite and MVDS systems: the experimental region, Beirut (Zoom in 1), and the MVDS system (Zoom in 2). (c) Block diagram showing important parameters for this study.
Telecom 06 00036 g001aTelecom 06 00036 g001b
Figure 2. Image of the 35-degree satellite footprint [21].
Telecom 06 00036 g002
Figure 3. Far-field elevation pattern of the 1.2 m parabolic antenna at 14 GHz.
Telecom 06 00036 g003
Figure 4. (C/N) comparison between ideal signal and interference from MVDS.
Telecom 06 00036 g004
Figure 5. Eb/N0 comparison between ideal signal and interference from MVDS.
Telecom 06 00036 g005
Figure 6. (a) Proposed antenna. (b) Far-field elevation pattern of the antenna at 14 GHz; 1.2 m parabolic antenna.
Telecom 06 00036 g006
Table 1. Comparison between MVDS and GEO satellite systems.
FeatureMVDSGEO Satellite
Primary UseDelivery of television and multimedia contentCommunication links, broadcasting, weather monitoring
Operating FrequencyKu-band (10.75–14.5 GHz)Ku-band (extensively used)
Coverage AreaLocal or regional, up to 50 km from a transmitterWide area; can cover continents
MobilityFixed terrestrial transmittersFixed position relative to a point on Earth
Antenna CharacteristicsDirective antennas with potential side lobesLarge, fixed antennas on the ground
Potential Interference SourceGEO satellites (terrestrial transmissions)MVDS (signal reception might be affected by strong terrestrial signals)
Table 2. Key parameters used in this work.
ParameterDescriptionDetails (Nominal Values, Units, …)
fOperating frequencyUplink: 13.75–14.75 MHz
Downlink: 10.75–12.75 MHz
BSignal bandwidthSatellite: 30 MHz
MVDS: 3 MHz
kBoltzmann’s constant228.6 dB
Rdistance between ES and GEO satellite system40,973 km
P F D Power flux density at a distance d from the antennaW/m2
GAntenna gain in dBiES: GES = 47.5 dBi
MVDS: GMVDS = 41.5 dBi
PTransmission powerPES = 5 dBW
PMVDS = 10 dBW
EIRPEffective isotropic radiated powerES: EIRPES = 52.5 dBi
MVDS: EIRPMVDS = 25.6 dBi
C N 0 Carrier-to-noise-density ratiodB-Hz
C N Carrier-to-noise ratiodB
E b N 0 Energy per bit to noise power spectral densitydB-Hz
RData rateMbps
FSLFree-space path lossdB
L A B S Atmospheric and ionospheric losses0 dB
G T Figure of merit of a communication system ES :   G T ES = 24 dB/K
MVDS :   G T MVDS = 5.6 dB/K
G(θ)Off-axis gain of the Earth station antennadBi
ΘOff-axis angleDegree
C A S I Carrier-to-adjacent satellite interference ratiodB
C A C I Carrier-to-adjacent-carrier interference ratiodB
C I M I Carrier-to-intermodulation interference ratiodB
C X P I Carrier-to-cross-polarization interference ratiodB
C I Carrier-to-MVDS side lobe interferencedB
FrSatellite power fraction
IBO, IBOiInput backoff for the entire satellite system and the input backoff of an individual carrier−4 dB
OBO, OBOiOutput backoff for the entire satellite system and the output backoff of an individual carrier−4 dB
Table 3. Satellite uplink and downlink specifications.
Satellite Specifications of IS-1002 at 35° West
EIRPBack-offG/T
25.6 dBW−4 dB5.6 dB/K
Uplink parameters
FrequencyAntenna gainHPA-dBW
14 GHz47.5 dB5 dBW
Downlink parameters
FrequencyAntenna gainG/T
12 GHz46.2 dB22 dB/k
Table 4. Parameters for end-to-end calculations.
Ratio C N 0 t o t a l C N E b N 0
Case
Ideal case (no interference)71.2 dB-Hz6.4 dB4.9 dB-Hz
Real case with ASI70.2 dB-Hz5.4 dB3.7 dB-Hz
Table 5. Different interference types.
Interference (dB-Hz) C A C I C I M C X P C A S I
Real scenario case82.7577.6686.66597.8
Table 6. MVDS side lobe effect using a real scenario for different power levels of MVDS.
PMVDS (dBW) C N 0 t o t a l C N E b N 0 Signal Quality
−1068.693.912.28Good
−567.47942.701.069Fair
062.47−2.29−3.93Critical
557.4794−7.29−8.93Bad
1052.4794−12.29−13.9Bad
Table 7. Current and proposed MVDS system parameters.
SystemCurrent Proposed
MVDS GTx (dBi)41.541.5
PMVDS (dBW)10−20
MVDS GRx (dBi)41.541.5
GRx_LNA (dB)3065
Rmax (km)5050
Path loss (dB) from (10) 149.3149.3
PRx at LNA i/p −29.519−59.519
PRx at LNA o/p 0.4815.481
Table 8. Expected interference at ES4 employing the new antenna design.
PMVDS (dBW) C N 0 t o t a l C N E b N 0 Signal Quality
−1070.15.33.717Negligible Interference
−569.74.953.3Very Good
068.73.92.28Good
5 67.52.71.07Fair
10 62.5−2.3−3.9Critical
Disclaimer/Publisher’s Note: The statements, opinions and data contained in all publications are solely those of the individual author(s) and contributor(s) and not of MDPI and/or the editor(s). MDPI and/or the editor(s) disclaim responsibility for any injury to people or property resulting from any ideas, methods, instructions or products referred to in the content.

