Article

Investigating the Reliability of Empirical Path Loss Models over Digital Terrestrial UHF Channels in Ikorodu and Akure, Southwestern Nigeria

by
Akinsanmi Akinbolati
* and
Bolanle T. Abe
Department of Electrical Engineering, Tshwane University of Technology, Emalahleni 1034, South Africa
*
Author to whom correspondence should be addressed.
Telecom 2025, 6(2), 28; https://doi.org/10.3390/telecom6020028
Submission received: 21 February 2025 / Revised: 20 March 2025 / Accepted: 7 April 2025 / Published: 18 April 2025

Abstract

:
It is well known that existing empirical models cannot fit perfectly into environments other than those they were formulated in due to differences in terrain and climate. The Okumura–Hata family of models are gaining acceptability over the VHF/UHF channels. However, it is imperative to investigate their reliability and to use the one most suited to each environment. This study investigated the reliability of the Okumura–Hata, COST-231, ECC-33, and Ericsson models over digital UHF channels in Ikorodu and Akure, Southwestern Nigeria. The drive test protocol was used for data collection at intervals of 1 km along different routes from the experimental stations up to maximums of 10 and 16 km in Ikorodu and Akure, respectively. This was carried out for both wet and dry season months using a digital Satlink meter with a spectrum (WS-6936), GPS Map 78s and a field vehicle. The uniqueness of this study is that it used real-world data with a seasonal scope, and the mean values were employed in the analysis to strengthen the reliability of the results. The measured path loss (MPL) and predicted path loss (PPLM) were computed, with error margin analysis carried out between them. The results reveal a mean MPL of 110.42 dB in Ikorodu, while the PPLMs were 121.90, 123.55, 158.42, and 291.01 dB for the Hata, COST-231, Ericsson, and ECC-33 models, respectively. In Akure, the mean MPL was 123.157 dB, while the PPLMs were 121.922, 130.179, 198.979, and 313.494 dB. The results further indicate that the Hata model had the best performance with the lowest RMSE of 10.812 in Ikorodu, while COST-231 had the best performance in Akure, with the lowest RMSE of 9.877. The optimized Hata and COST-231 models were developed with improved RMSEs of 5.895 and 7.815 for the Ikorodu and Akure environments, respectively. The optimized models had higher degrees of reliability and will provide a valuable approach to wireless communication planning in tropical urban and suburban environments for achieving quality of transmission and reception (QoTnR) over UHF channels in Nigeria and similar environments in Africa.

1. Introduction

Path loss reduces the quality and strength of transmitted radio frequency (RF) energy along the propagation path from the transmitter to the receiver. This is primarily due to wave divergence and secondarily due to the interaction of the transmitted signal with the terrain, hydrometeors, and primary and secondary radio climatic factors on its propagation path [1,2]. Investigation of the performance evaluation or error margins of empirical path loss models over wireless communication channels has become imperative for ensuring reliable power budgets and link design in any local environment. It is well known that existing empirical models do not fit perfectly in geographic environments or climates different from the original environments in which they were formulated [3,4,5,6,7,8]. What is new, however, is how radio scientists and engineers have taken up the challenge to investigate the degree of reliability of these popular and standardized models in their geographic locations to enhance the quality of transmission and reception (QoTnR) of wireless signals. Based on the above, different researchers all over the world have carried out studies in this respect in their localities [7,8,9,10,11,12]. Many authors have engaged in rigorous studies on path loss assessment and modeling and have evaluated the suitability of existing models for use in environments different from their original environments [6,8,13,14,15]. Related studies on path loss and coverage areas for AM and FM radio channels include the works of [16,17,18,19]. Many studies have also been conducted on path loss assessment and have evaluated the performance of GSM signals both in Nigeria and internationally [9,10,11,12,15,20,21,22]. Most of the findings of these studies have favored the use of one or two of the Okumura–Hata family models in their areas of study.
Researchers have also captured studies on television channels in this regard. For analogue TV channels, the works of [3,4,5,6,7,8,23] are available. With the technology of digital terrestrial television (DTTV) gradually replacing analogue technology in Nigeria, few related studies have been reported on the digital UHF television channels in Nigeria, such as the works of [1,24,25,26,27].
Other scenarios where empirical path loss studies have been carried out include space-to-ground and rain-induced attenuation over the satellite-to-earth link system [28,29].
There is still a need for many studies on path loss assessment and the evaluation of empirical models over DTTV channels in Nigeria. This will enhance proper coverage area assessments for existing digital terrestrial television stations and link design for full analogue switch-off (ASO) to digital switch over (DSO) in Nigeria. This forms the motivation and the gap this study aims to fill.
The importance of empirical models in wireless communications are numerous, such as in path loss assessment, channel estimation, and coverage area prediction and mapping [3]. Empirical models are also useful for network optimization in communication and radio map systems [30], as well as in radio-link design and power budgeting over wireless channels [8,27].
However, the study is not exhaustive and will continue to attract more findings aimed at achieving QoTnR due to the dynamic nature of terrain and weather in different geographic regions of the world. Over the years, the Okumura–Hata model and other improved versions based on it have been gaining acceptability over the VHF/UHF channels in some geographic locations [3,9,10,14,31]. Since accuracy and reliability are required, none of these models should be hand-picked for use in an environment without evaluating their performance to select the most suitable model.
It was on this premise that we decided to investigate the reliability of four models belonging to the Okumura–Hata family. These include the Okumura–Hata, the European Cooperation for Scientific and Technical Research (COST-231), the European Communication Committee (ECC), and the Ericsson models. In addition, they were selected because ITU-R has supported their use as references for new approaches over the UHF channel [32]. Lastly, all independent parameters in the models are available in the data collected in this study, and the different environment definitions are equally compliant. However, it is difficult to determine which of the improved versions would be most suitable for terrains and environments or climates different from the original environments in which they were formulated. Table 1 presents some closely related studies (cited in this work) indicating the methods, locations, and key findings.
Therefore, this study aims to determine the measured path loss of the two digital terrestrial UHF television channels in the coastal city of Ikorodu, Lagos and Akure, a city in Nigeria’s tropical rainforest zone. Secondly, the path loss predicted by the four selected models will be determined using their respective models. The third objective is to carry out a margin-of-error analysis on the results of the predicted models, comparing them to the measured data, to determine which of the models is best suited for path-loss prediction in the study areas and frequencies. Lastly, the models will be optimized to further enhance their reliability in the study area and similar tropical urban or suburban areas and frequencies. All these objectives have been achieved in this study.

2. Materials and Methods

2.1. Study Locations and Experimental Procedures

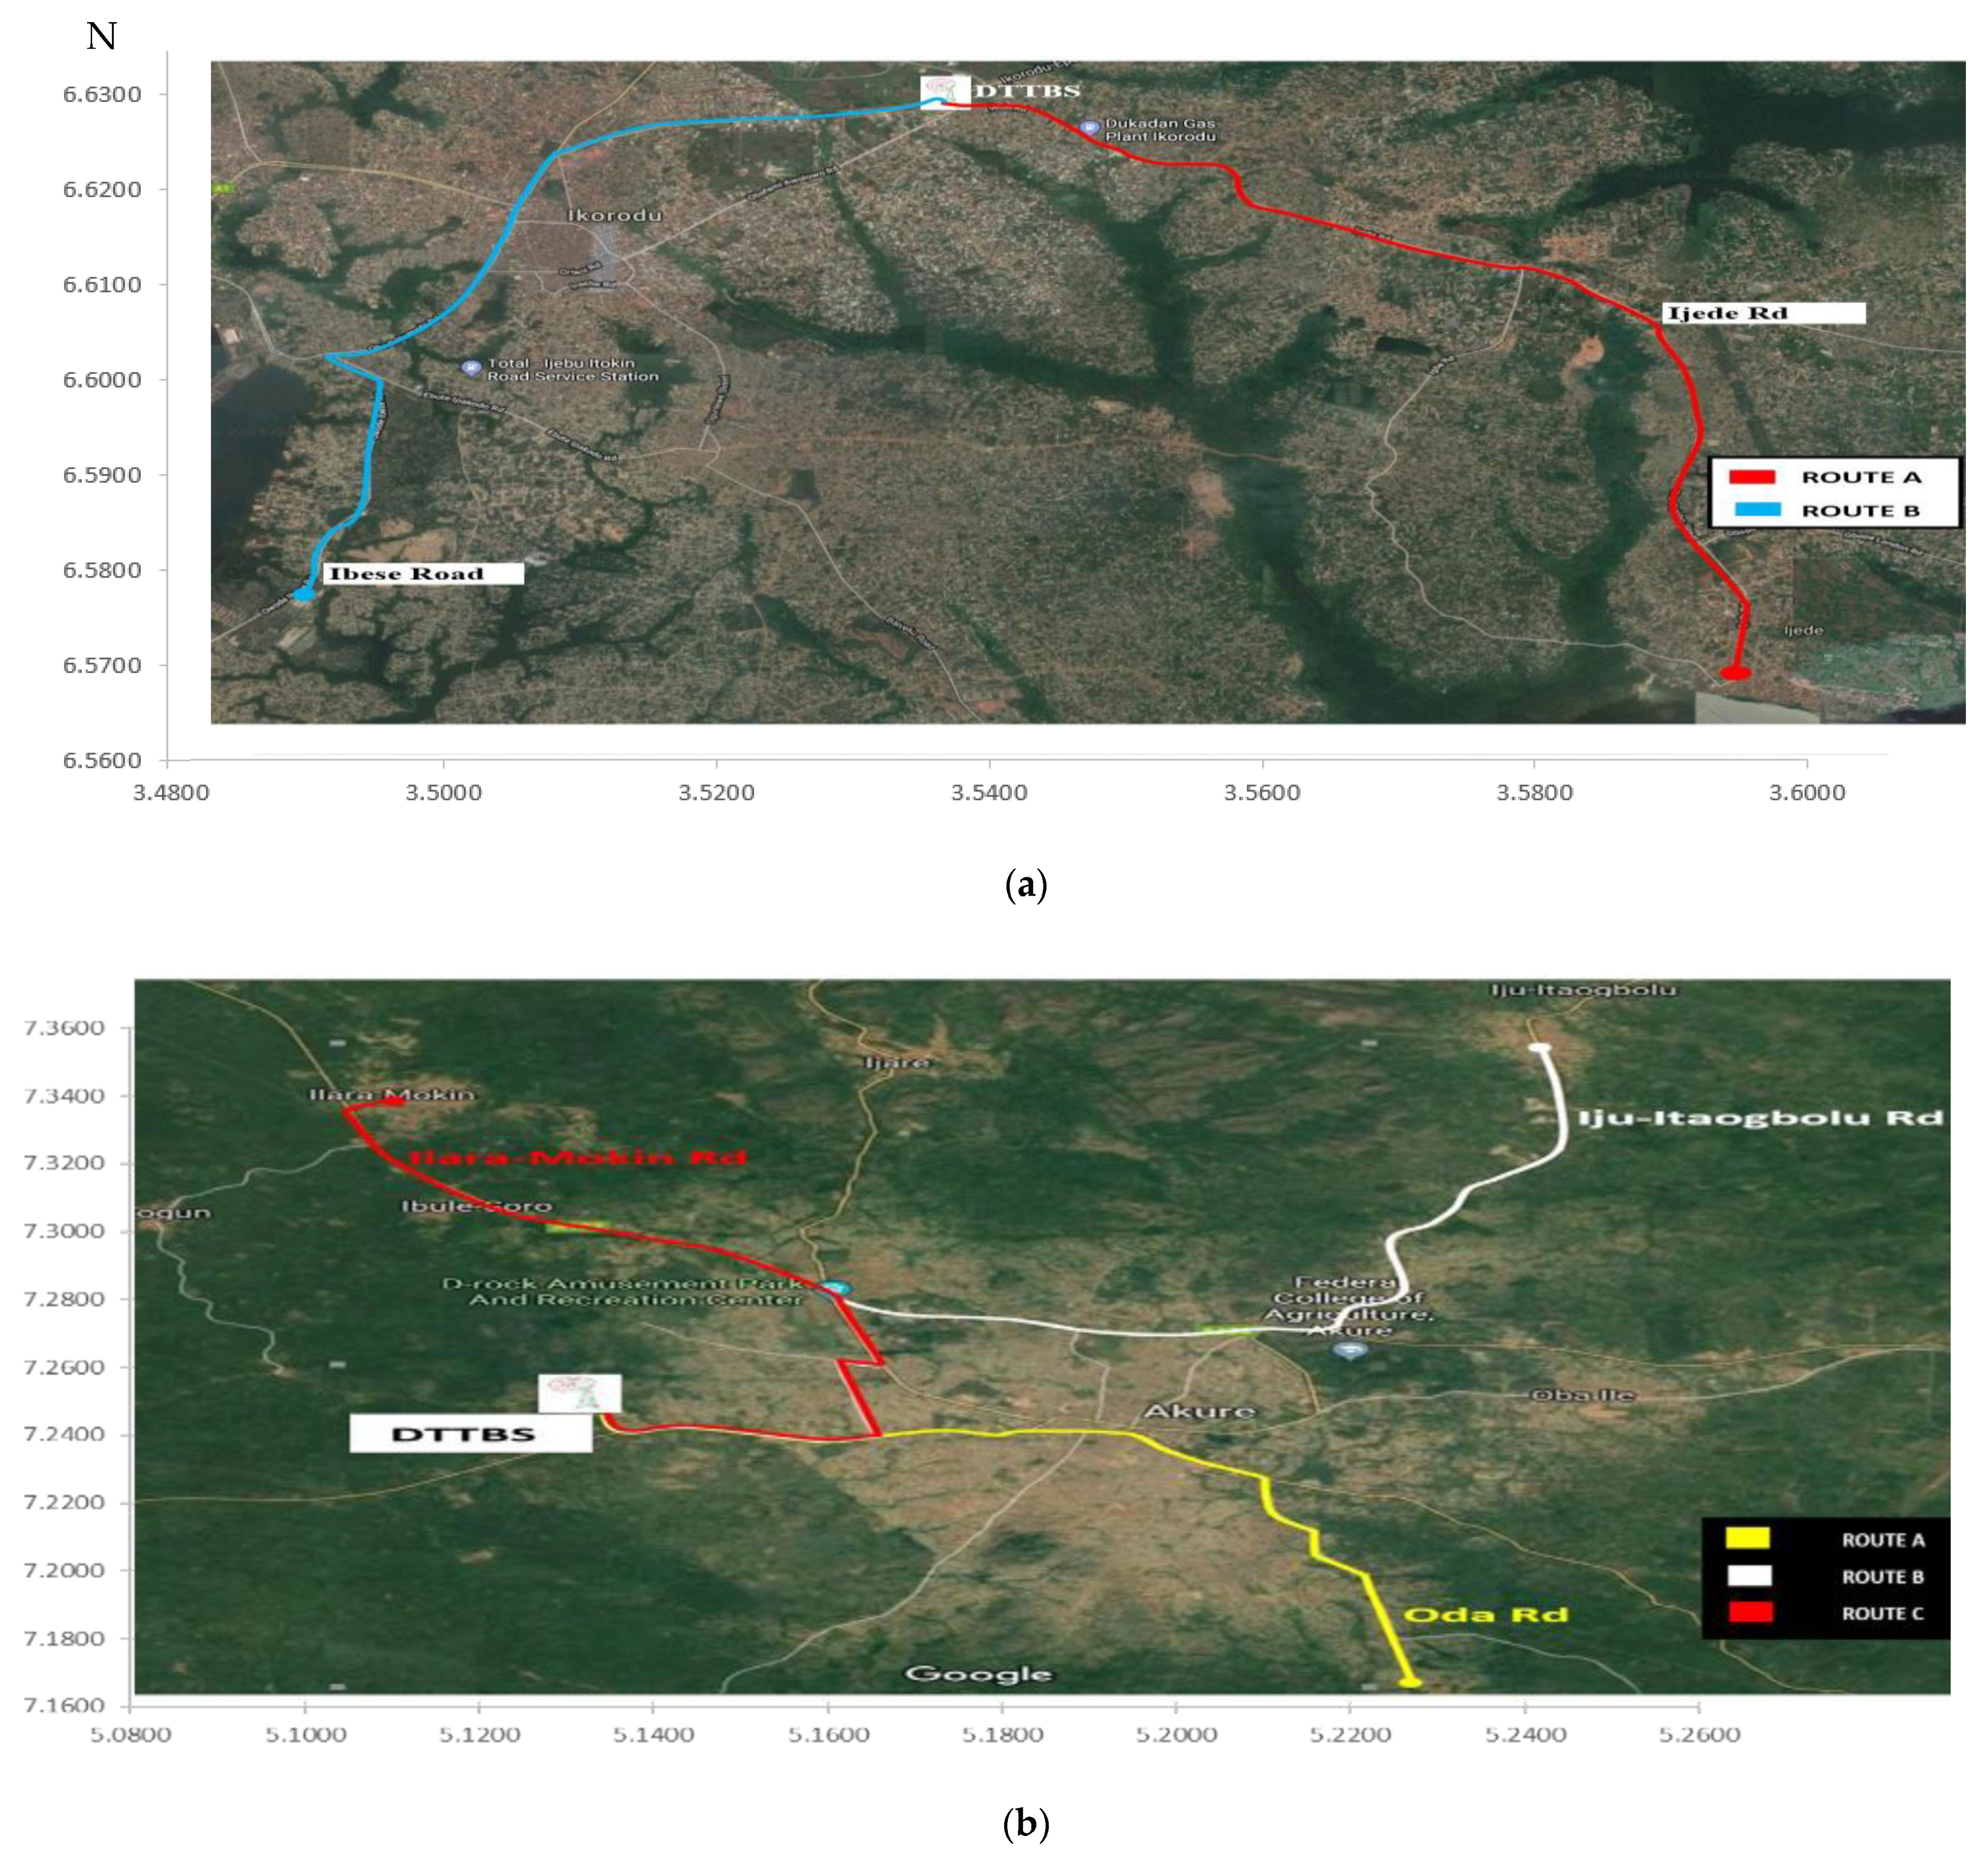
2.1.1. Research Location and Measurement Routes

This study was carried out on Star Times digital terrestrial UHF channels 44 and 52, with carrier frequencies of 658 and 752 MHz, located in Ikorodu and Akure Cities, respectively. Two measurement routes for the data collection were considered for each location. The routes considered in Ikorodu were from the base station in Magodo to Egbin passing through Ijede for route A, while route B was from the base station to Ibese Town passing through Ojubode-Beach Road. Each route was 10 km. Table 2 presents key transmission and receiver parameters for the study, while Figure 1 presents the maps of the measurement routes.
Meanwhile, according to the Okumura definition, the Ikorodu environment, especially the measurement routes, comprises about 40% suburban and 60% urban environments, respectively. The urban environment along measurement route A (from the base station to Egbin), spans from the base station in Magodo to Oke Eletu (0–6 km). The area from Abule Eko to Ijede falls within the suburban area (7–10 km). For route B (from the base station to Ibese Town), the urban area falls within the base station to Ibese Road (0–6.5 km) and from Ibese Road to Ibese Town (6.5–10 km). This necessitated the computation of the predicted path loss models (PPLMs) for urban and suburban areas in Ikorodu, and the mean value was used for analysis and discussions. In contrast, the Akure environment is considered a sub-suburban area based on the Okumura standard of classifications. Specifically, the measurement routes considered comprised about 70% suburban and 30% urban environments according to the Okumura definition. For route A (from the base station on Ondo Road, Akure, to Oda Town), 70% falls within the suburban area, including from the base station to the Arakale roundabout (0–7 km) and from the State Secretariat roundabout to Oda Town (10–15 km). The urban area comprising 30% is between the Arakale roundabout and the State Secretariat roundabout). Similarly, for route B (from the base station to Ita-Ogbolu Town), 30% falls within the urban area (from Oyemekun Grammar School to the Oloko-Chicken Republic junction; 4.5–6 km), while the remaining routes from the base station to Oyemekun (0–4.5 km) and from the Oloko junction to Ita-Ogbolu Town (6 to 16 km) falls within the suburban area, covering about 11 km out of the total 16 km. For this reason, the Akure routes were treated as suburban areas.

2.1.2. Method of Data Collection

Data collections were carried out during the dry and wet season months of June and November, respectively, in the two cities. The method deployed was the drive test protocol, whereby a field vehicle was used for mobility along the routes, with data taken at intervals of 1 km using the base station as the reference point. Two routes (A and B) were considered in Ikorodu, with a length of 10 km each (Figure 1a), while three were identified in Akure (1b). However, only two routes (A and B) with a maximum length of 16 km were used for analysis in this study. A digital signal level meter with a spectrum (Satlink WS-6936) was used to measure the received power in (dBm) of the transmitted signal, while a handheld GPS was used to capture the coordinates of the data points and the transmitter-to-receiver distance (Tx-Rx) of the data points from the base stations. Five datasets of the power received (dBm), Tx-Rx (km), latitude (°N), longitude (°E), and elevation (m) were measured and recorded for each data point. The accuracy of the Satlink WS-6936 and the GPS Garmin Map78s were validated in an initial test measurement. A few measured coordinates of the data locations were compared with Google online coordinates of the locations and found to be in agreement. Also, the received power measured around the base station using the Satlink was also validated at the base station(s) before the main measurement campaign.
The data were sorted according to route and season, with the mean values of the routes (A and B) for both seasons used for computational analysis to enhance the reliability of the results.

2.2. Empirical Formula and Path Loss Prediction Models Used in This Study

Equation (1) presents the conversion of the transmitted output power of the base stations in (kW) to (dBm), while (2) was used to calculate the measured path loss along the routes of measurement [12,31].
P t d B m = 10 log ( P t k W 1000 ] + 30
L d B = P t d B m + G t d B m P r d B m
where
  • L ( d B ) is the measured path loss;
  • P t is the transmitted power;
  • G t is gain of the transmitting antenna;
  • P r is the power received (received signal strength (RSS) in this study).
The details of the predicted models are presented as follows:
(1)
Hata’s Model (Okumura–Hata)
This model [35] is an improvement over the Okumura model. It was formulated in the year 1980 based on the data provided by Okumura and is valid within a frequency range of 150–1500 MHz and a distance of 0–20 km from the base station. The path loss for urban areas L U is as presented in (3):
L U = 69.55 + 26.16 log f 13.82 log h b α ( h r ) + ( 44.9 6.55 log ( h b ) log ( d )
where
  • L U is the path loss in dB;
  • f is the carrier frequency, 150–1500 MHz;
  • h b is the transmitting base station’s tower or mast height, ranging between 20 and 200 m;
  • h r is the receiver antenna’s height, ranging from 1 to 10 m;
  • d is the distance between the transmitter and the receiver (Tx-Rx), ranging from 1 to 20 km;
  • a h r is the correction factor for the receiver height and is given as follows:
    a h r = [ 1.1 log 10 f 0.7 ] h r 1.56 log 10 f 0.8 F o r   s u b u r b a n   o r   r u r a l   a r e a . 8.29 log 10 1.54 h r 2 1.1 F o r   a n   U r b a n   a r e a :       f 200   MHz . 3.2 log 10 11.75 h r 2 4.97 F o r   a n   U r b a n   a r e a :       200 f 400   M H z .    
The Hata path loss equations for suburban areas and open areas are presented in (5) and (6), respectively:
L S U d B = L U 2 log 10 f 28 2 5.4
Open areas:
L O d B = L H a t a U r b a n 4.78 log 10 f 2 18.33 log 10 f 40.94
The variables are as defined for (3).
(2)
COST-231 Model
This is an extension of the Okumura–Hata model [36] to cover a wide range of frequencies between 0.5 and 2 GHz. It is used for medium to small cities:
L d B = 46.3 + 33.9 log 10 f 13.82 log 10 h b + 44.9 6.55 log 10 h b log 10 d α h r + C m
where a h r is the receiver antenna correction factor, as presented in (4), while C m = 0   d B for medium-sized cities and suburban areas and 3   d B for urban areas.
(3)
ECC-33 Model
This was extrapolated from the original measurements by Okumura and optimized to be fit for the fixed wireless access (FWA) system. It is useful for the ultra-high-frequency (UHF) band and covers up to 3.5 GHz [8]. The model is presented in (8):
L d B = L F S + L b m G t G r
where L F S ,   L b m ,   G t ,   a n d   G r (in dB) are the free space attenuation, basic medium path loss, transmitting antenna height gain factor, and the receiver antenna height gain factor, respectively. They are given as follows:
L F S = 92.4 + 20 log 10 d + 20 log 10 f ,
L b m = 20.41 + 9.83 log 10 d + 7.89 log 10 f + 9.56 [ l o g 10 ( f ) ] 2 ,
G t = log 10 h t 200 13.98 + 5.8 log 10 d 2 ,
For medium-sized cities,
G r = 42.57 + 13.7   log 10 f log 10 h m 0.585 ,
and for big cities,
G r = 0.759 h m 1.862
where f is in GHz,   d is in km, and h t and h m are in meters.
(4)
Ericsson Model 9999,  ( P E r i c )
This model was developed by Ericsson’s company [9,12,37]. It allows the parameters to be adjusted according to different propagation environments. The parameters are presented in (14) and (15).
P E r i c = a 0 + a 1 log d + a 2 log h b + a 3 log h b log d 3.2 [ l o g 11.75 h r ) 2 + g ( f )
g f = 44.49 log f 4.78 log f 2
where a 0 , a 1 , a 2 , and a 3 are constants. Table 3 presents the details of the environments and the constants.
  • f is the carrier frequency, 150–1900 MHz;
  • h b is the transmitting base station’s tower or mast height, ranging between 20 and 200 m;
  • h r is the receiver antenna’s height, and it ranges from 1 to 10 m;
  • d is the distance between the transmitter and the receiver (Tx-Rx), which ranges from 1 to 20 km.

2.3. Error Analysis of the Prediction Models

The predicted models’ mean, minimum, maximum, and root mean square error (RMSE) were analyzed. The RMSE was the main factor used to determine the performance evaluation of the four models investigated. This is because it has been statistically determined to be a good metric to measure predicted performance with measured values. RMSEs of 0–7 dB and 7–15 dB are deemed acceptable for urban and suburban environments, respectively [38]. The prediction error ( P e r r ), is the difference between the measured path loss ( P M D ) and the model’s predicted path loss ( P P D ) [9,36]. It is presented in Equation (16), while the RMSE is presented in (17); n is the number of observations.
P e r r = P M D P P D
R M S E = ( P M D P P D )   2 n

2.4. Optimization Procedure for the Preferred Model(s)

Equation (18) presents the logarithmic linear model [31,33] used to optimize the models that have the best path loss prediction (the smallest RMSE) in the two environments.
Y = A + B l o g d
where A and B are the logarithmic constants, and d is the Tx-Rx distance. The values of A and B are defined as follows:
A = ( L )   [ l o g d 2 ] ( l o g d )   [ L l o g d ] n ( l o g d ) 2 ( l o g d ) 2
B = [ n ( L ) ( l o g d ) ] [ ( L ) ( l o g d ) ] n [ l o g d 2 ] l o g d 2
where
  • L is the absolute value of the difference between the measured and predicted path loss;
  • d is the Tx-Rx distance;
  • n is the number of observations.

3. Results and Discussions

3.1. Typical Samples of the Raw Data Collected During the Measurement Campaign

Table 4 presents the data samples collected during the dry season along route A in Ikorodu and Akure.
In the table, it can be observed that the RSS is inversely proportional to the distance from the base station. However, there are a few exceptions at some locations, which may be attributed to the influence of the terrain or atmospheric conditions of these locations. This observation is not reflected in the inverse square law but underscores the advantage of real-world propagation measurements. For Ikorodu, Lagos, the elevation above sea level is low compared to that of Akure, as it is a coastal city. This is one of the factors responsible for the varying degrees of attenuation and the different performances of the models in the two cities.

3.2. Results and Discussion of Findings over the Digital Transmitting Base Station (DTBS) Channel in Ikorodu

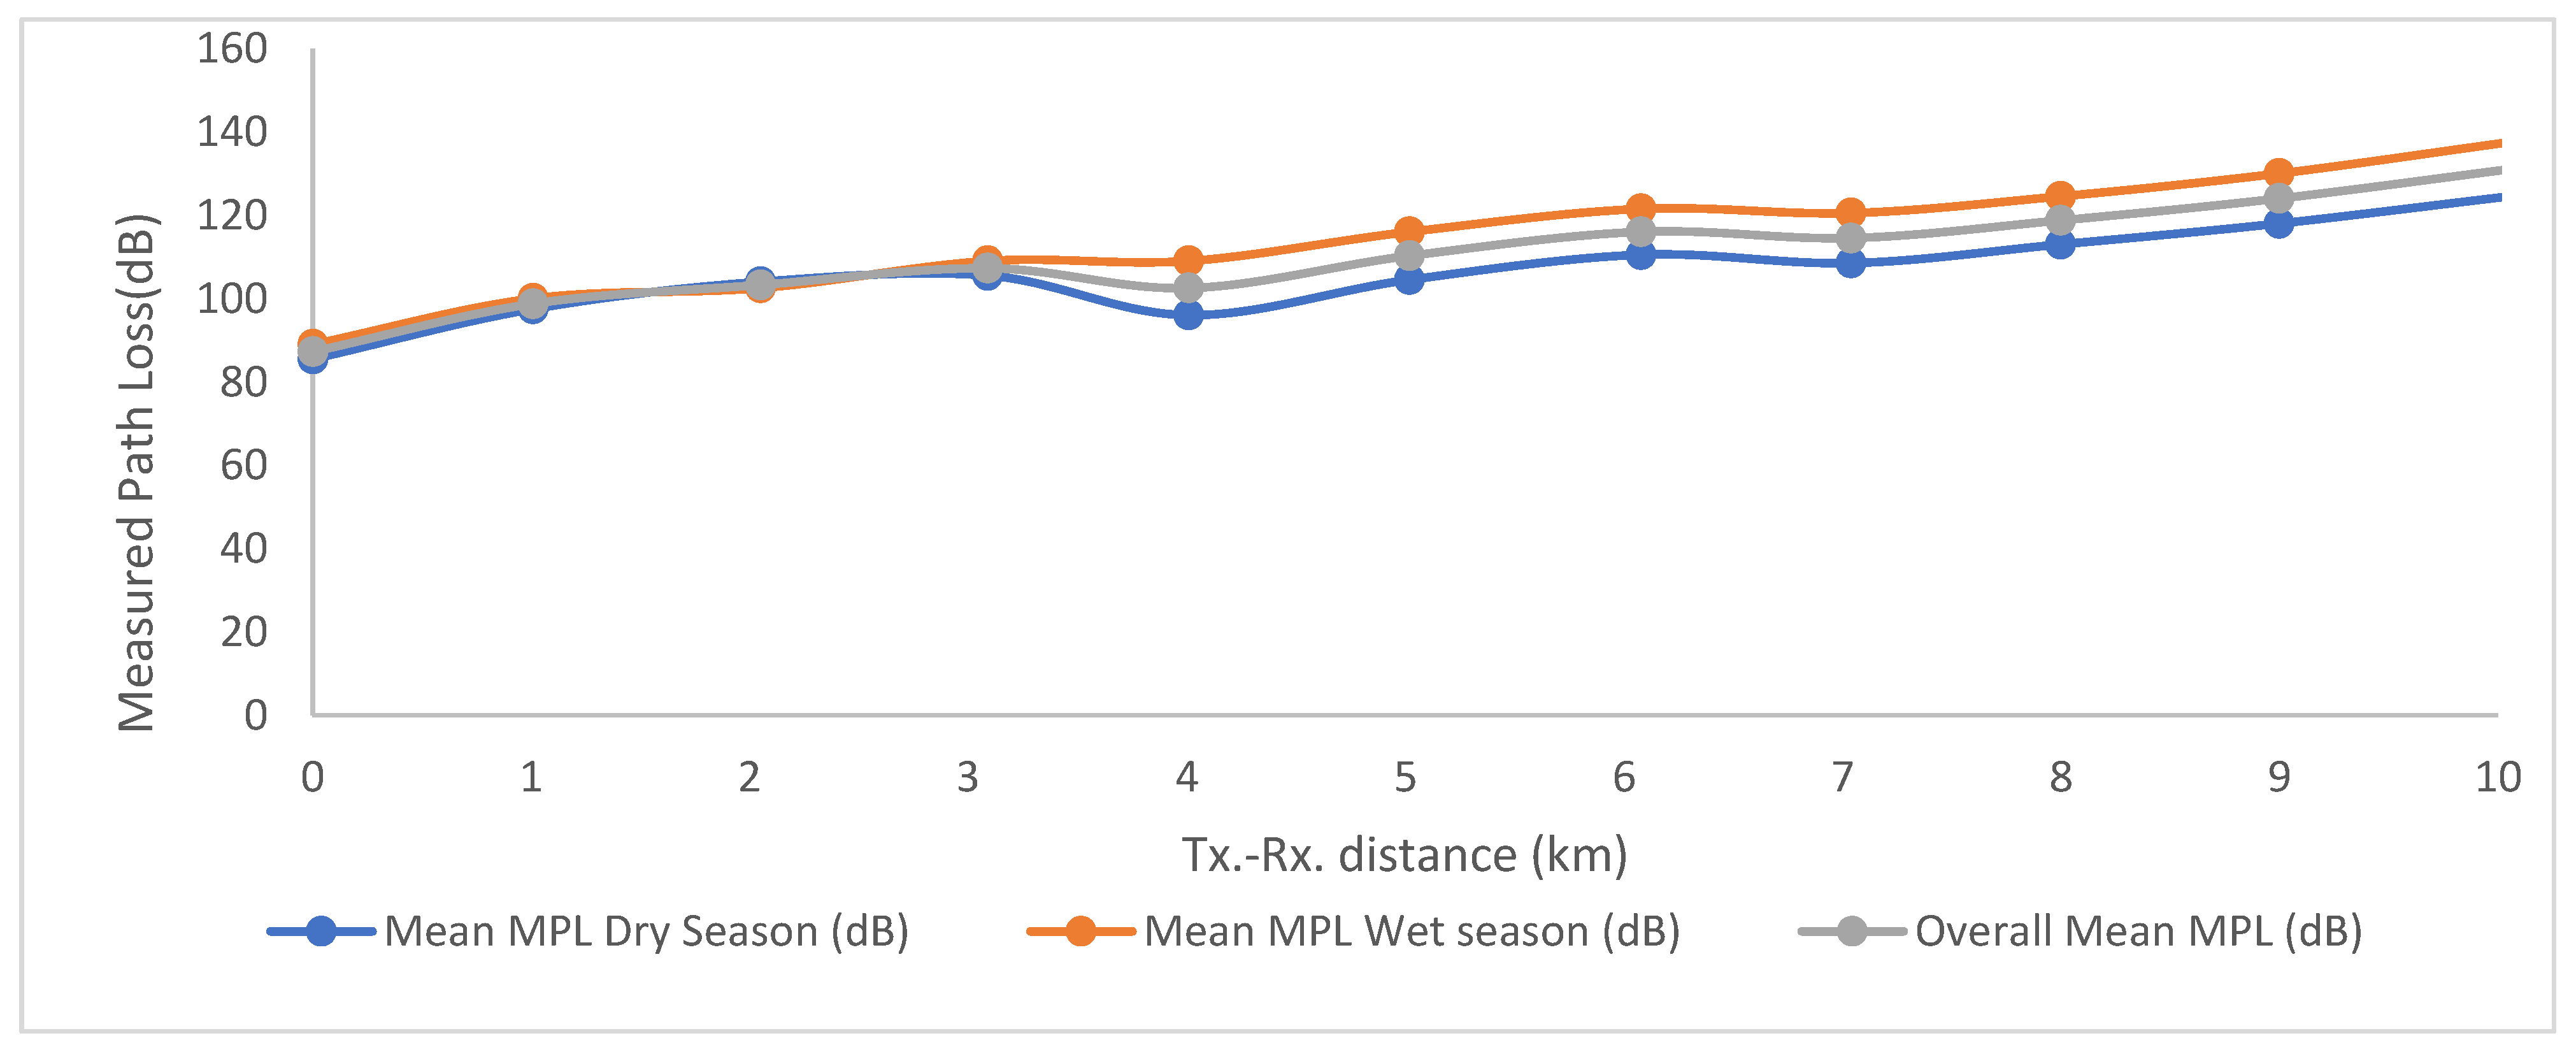
3.2.1. Evaluated Measured Path Loss (MPL)

Table 5 presents the evaluated mean measured path loss for the routes and seasons over 10 km from the base station. The mean values for both routes during the dry and wet season months were 106.186 and 114.555 dB, respectively, with an overall mean of 110.371 dB. Path loss during the wet season months was higher than the dry season months, which may be attributable to the effects of hydrometeors and wet vegetation compared to that of the dry season.
Similarly, Figure 2 presents comparison plots of the measured path loss for both the wet and dry season months and their mean values in the study area. It indicates an increase with the increase in the Tx-Rx distance, which is consistent with the inverse square law, although a smooth exponential rise was not observed. The pattern depicts the influence of elevation and perhaps some other terrestrial features causing signal enhancements and degradation contrary to the theoretical expectations. In addition, it can be observed that there was no significant difference in their values from the DTBS up to 3 km. However, a significant difference was observed at distances between 3 and 10 km from the base station, with the wet season recording higher values. The need for DTBS operators and regulators to compensate for losses during wet season months in tropical environments is recommended.

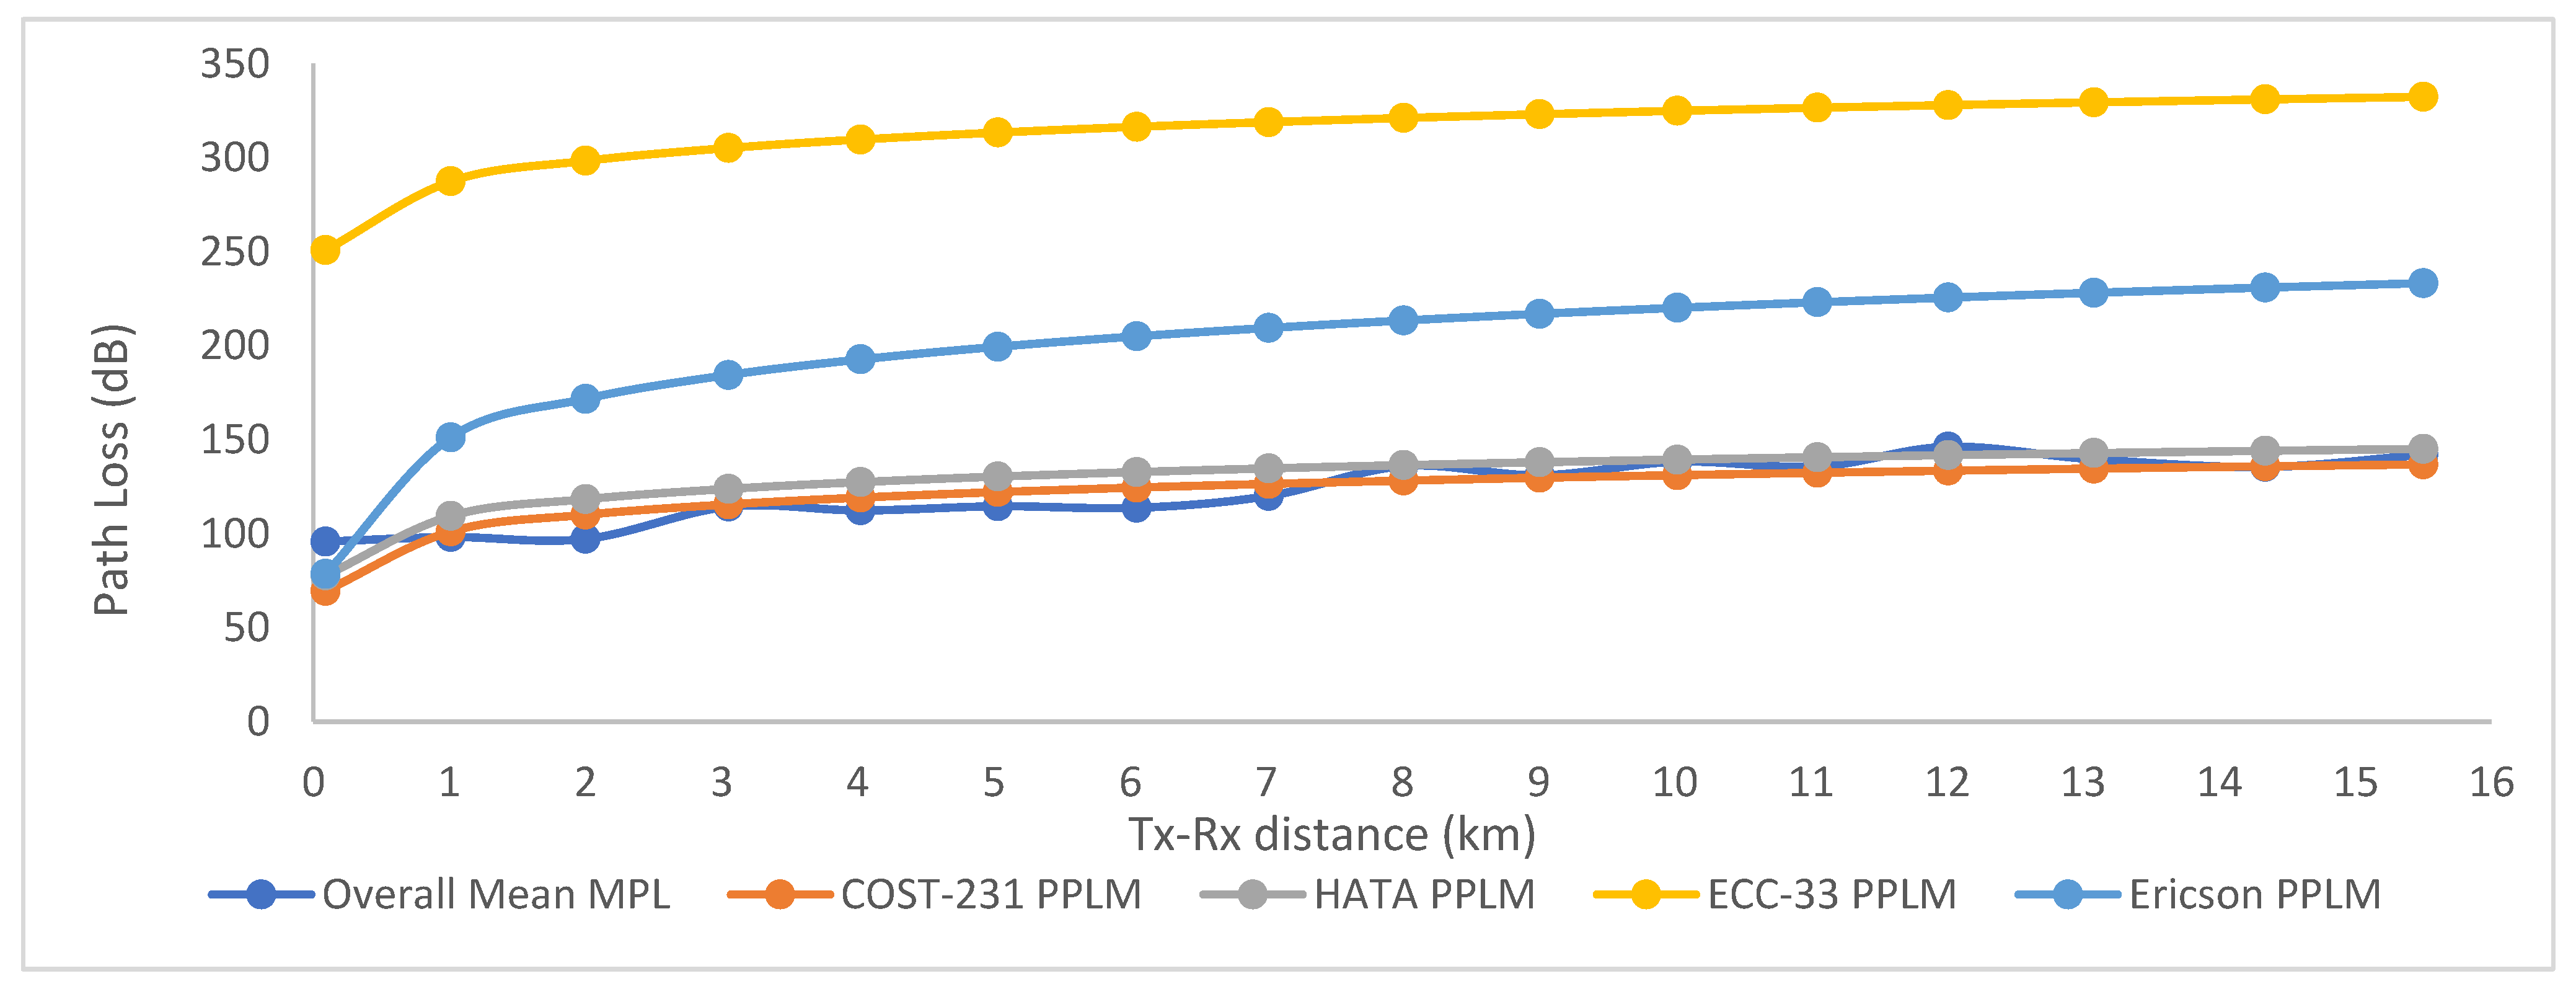
3.2.2. Comparison of Measured Path Loss (MPL) with Predicted Path Loss Models (PPLMs) in Ikorodu

As stated in the Method’s section, four widely used Okumura–Hata family prediction models were investigated. Comparative analysis/plots of the MPL (dB) with the Okumura–Hata, COST-231, ECC-33, and Ericsson models are presented in Figure 3. The ECC-33 and Ericsson models overestimated the path loss and would not be suitable for use in the study area. However, the Hata and COST-231 models slightly overestimated the losses, and the two presented almost the same values, with little deviation. Error analysis would determine the better model for prediction between them. In addition, the overall mean value of the measured data was 110.42 dB, while for the predicted data, they were 121.90, 123.55, 158.42, and 291.01 dB for the Hata, COST-231, Ericsson, and ECC-33 models, respectively, as presented in Table 6. The model with the closest prediction was Hata, followed by COST-231 and Ericsson, while ECC-33 predicted the highest overestimated value.

3.2.3. Error Analysis of the PPLMs to Determine Their Degree of Reliability for Path Loss Prediction over the DTBS in Ikorodu

Table 7 presents the results of the performance evaluation metrics of the four models. The Hata model performed the best, with the smallest RMSE, minimum error, maximum error, mean error, and skewness values of 13.540, 2.949, 19.515, 12.820, and 141.150, respectively for the urban calculations. For the suburban calculations for Ikorodu, the Hata model presented RMSE, minimum error, maximum error, mean error, and skewness values of 8.083, 0.323, 19.513, 5.636, and 62.50, respectively. The COST-231 followed the Hata model closely in performance, with RMSEs of 15.099 and 14.801 for the urban and suburban calculations, respectively. The mean RMSE for the Ikorodu computations in both environments using the Hata and COST-231 models were 10.812 and 14.95, respectively. These are the results of this study, using the mean values of both suburban and urban measured path loss for analysis. These RMSE values are still within the acceptable ranges, although many studies have projected maximum acceptable RMSE values of 7 and 15 dB for urban and suburban environments, respectively. These findings show that both the Hata and COST 231 models could be used for prediction. However, the Hata model is the preferred prediction model for use in the study area. Figure 4 presents the variations in the RMSE analyses for the models.

3.3. Results and Discussion of Findings over the Digital Transmitting Base Station (DTBS) Channel in Akure

3.3.1. Evaluated Measured Path Loss in the Akure Environment

Table 8 presents the evaluated mean measured path loss for the routes and seasons over 15 km from the base station. The mean values for both routes during the dry and wet season months were 121.142 and 125.171 dB, respectively, with an overall mean of 123.157 dB. The path loss for the wet season was again more significant than for the dry season months.
Figure 5 presents a comparison of the measured path loss for both the wet and dry season months, as well as their means in the study area. An increase in path loss with an increase in the Tx-Rx distance can be observed, showing a trend similar to that observed in Ikorodu. Again, the key takeaway here is that the signal’s profile did not follow a smooth exponential rise as theoretically expected. Instead, it depicts the unique impact of the terrain along the propagation path.

3.3.2. Comparison of Measured Path Loss (MPL) and Predicted Path Loss Models (PPLMs) in Akure Environment

A comparative analysis is presented in Figure 6. The ECC-33 and Ericsson models again overestimated the path loss and would not be suitable for use in the study area. However, the Hata and COST-231 models exhibited similar performances, with little deviation from the measured data. The overall mean value for the measured data was 123.157 dB, while for the predicted data, they were 121.922, 130.179, 198.979, and 313.494 dB for the COST-231, Hata, Ericsson, and ECC-33 models, respectively, as presented in Table 9. It was observed in the Akure environment that the COST-231 model performed better than the Hata model based on the evaluated mean values, which is in contrast to the results for Ikorodu.

3.3.3. Error Analysis in the Akure Environment

Table 10 presents the results of the performance evaluation metrics of the four models. The COST-231 model had the best performance with the smallest RMSE, minimum error, mean error, and skewness values of 9.877, 0.308, 7.343, and 117.025, respectively. The Hata model was the next in performance, with an RMSE of 11.799. These findings show that both the COST 231 and Hata models are fit for predicting path loss over a digital terrestrial UHF signal in the suburban city of Akure. This is based on the fact that their RMSE values were comfortably within the 7–15 dB range, which is acceptable for suburban cities [2]. However, COST-231, with the smallest RMSE, is preferred for the study area. Ericsson and ECC-33 are not fit for use in this environment based on their inaccurate predictions, mainly due to out-of-range RMSE values. Figure 7 presents the variation in the RMSE for the models.

4. Optimization of Hata and COST-231 Models for Better Performances in Ikorodu and Akure Environments, Respectively

These models were optimized using the logarithmic linear models presented in (18)–(20). The logarithmic constants for the Hata model, being the most suitable for prediction in Ikorodu based on its smallest RMSE, were computed to be A = 7.876 and B = 3.504 . The derived logarithm linear model is presented in (21):
Y = 7.876 3.504 l o g d
Equation (21) was added to the main Hata equation to obtain the optimized Hata model [ L u r b O p z ] for prediction in the Ikorodu environment, as presented in (22). This model was used to re-compute the path loss over the study area, with error analysis carried out between the measured data and the optimized model. The optimized model gave an improved RMSE of 5.895 compared to 10.810 of the untuned model, which is a significant improvement.
The optimized model is presented in (22) and recommended for prediction in Ikorodu or any similar tropical environment.
L u r b O p z = 69.55 + 26.16 log ( f ) 13.82 log ( h b ) α ( h r ) + 44.9 6.55 log h b log ( d ) + ( 7.876 3.508 l o g d )
where
  • f is the carrier frequency, 150–1500 MHz;
  • h b is the transmitting base station’s tower or mast height, ranging between 20 and 200 m;
  • h r is the receiver antenna’s height, ranging from 1 to 10 m;
  • d is the distance between the transmitter and the receiver (Tx-Rx), which ranges from 1 to 20 km;
  • a h r is the correction factor for the receiver height and is as given in (4).
Similarly for the COST-231, A and B were determined to be 6.550 and −5.862, respectively. The derived logarithmic model for COST-231 is presented in (23) and was added to the main COST-231 model, as presented in (24).
Y = 6.550 5.862 l o g d
The optimized COST 231-Model L O P Z C O S T is as follows:
L O P Z C O S T = { 46.3 + 33.9 log 10 f 13.82 log 10 h b + 44.9 6.55 log 10 h b log 10 d α h r + 6.550 5.862 l o g d }
where all parameters are as previously defined, and C m = 0 for the suburban city of Akure.
This model was again used to re-compute the path loss in the Akure environment. The optimized model obtained an improved RMSE of 7.815 compared to the value of the untuned model, with 9.877 dB. The optimized model is recommended for prediction in Akure or any similar environment. Comparison plots of the variations in the measured path loss between the untuned Hata and the optimized Hata models for Ikorodu are presented in Figure 8. There was significant improvement in the optimized model compared to the untuned model. Similarly, the variation in the measured path loss with distance of the untuned COST-231 and optimized COST-231 models for Akure is presented in Figure 9. There was marginally significant improvement in the optimized model over the untuned one because the untuned RMSE of 9.877 is significantly within the acceptable range of 7–15 dB for suburban areas. The improvement in the optimized over the untuned models is clearly depicted. The optimized models have demonstrated better performances based on their lower RMSE values compared to the untuned models. They will provide a valuable approach to wireless communication planning in tropical urban and suburban environments, with the aim of enhancing the quality of transmission and reception (QoTnR) over UHF channels in Nigeria and similar environments in Africa.

5. Conclusions

This study investigated the degree of reliability (performance evaluation) of four widely used empirical path loss models (the Hata, COST-231, ECC-33 and Ericsson models) on UHF channels, specifically over the digital UHF channels in Ikorodu, Lagos and Akure, Southwestern Nigeria. Data were obtained from rigorous in situ measurements of the received power, transmitter–receiver distance, and other necessary transmission parameters of the digital terrestrial UHF TV base stations studied. For the Ikorodu DTBS, the overall mean value of the measured path loss for the two routes and seasons was 110.42 dB, while the predicted values were 121.90, 123.55, 158.42, and 291.01 dB for the Hata, COST-231, Ericsson, and ECC-33 models, respectively. The Hata model performed the best, with the smallest RMSE of 10.812. These findings show that Hata is the preferred prediction model for use in the Ikorodu environment. In addition, findings in the suburban city of Akure reveal that the overall mean value of the MPL was 123.157 dB, while the PPLMs were 121.922, 130.179, 198.979, and 313.494 dB for the COST-231, Hata, Ericsson, and ECC-33 models, respectively. In the study area, the COST-231 model had the best performance, with the smallest RMSE of 9.877. The Hata model presented the next best performance, with an RMSE of 11.799. These findings show that both the COST-231 and Hata models are suitable to predict path loss over digital terrestrial UHF signals in the suburban city of Akure. This is based on the fact that their RMSE values were comfortably within the 7–15 dB range, which is acceptable for suburban cities [8,38]. However, COST-231 is preferred for use in the study area. The differences in the performances of Hata and COST-231 in the two environments could be attributed to the terrain factors of the individual environments.
Optimization of the preferred models was carried out using logarithmic regression analysis to increase their reliability. Newly optimized Hata and COST-231 models were developed. The Hata model showed an improved RMSE of 5.895 compared to 10.810 dB of the untuned model, while the COST-231 model showed an RMSE of 7.815 compared to the value of 9.877 dB of the untuned model. The difference in the performances of the models in the two environments could be attributed to their terrain and atmospheric factors.
The optimized models have higher degrees of reliability and can provide a valuable approach to wireless communication planning in tropical urban and suburban environments, with the aim of enhancing quality of transmission and reception (QoTnR) over UHF channels in Nigeria and similar environments in Africa.
The novelty of these models underscores their ability to enhance signal’s performance. For example, no matter how small a signal’s gain (1, 2, 3 dB) may look practically, it can be highly significant in wireless communications and prevent a signal from crossing the sensitivity value(s). The optimized model in Figure 8 shows an improved RMSE from 10.810 to 5.895 dB, bringing it into the acceptable range for urban areas. In Figure 9, the optimized model shows an improved RMSE from 9.877 to 7.815 dB, which is still suitable and well within the acceptable range. These models are strongly recommended for path loss prediction in these environments. The Ericsson and ECC-33 models are not fit for use in these environments based on their inaccurate predictions and mostly out-of-range RMSE values obtained in this study. Other general findings include that measured path loss values were greater during the wet season months than in the dry season months, and they increased with the Tx-Rx distance. The path loss profile depicts the influence of terrain roughness, while the PPLM profile shows a smooth exponential rise with distance. The overall findings of this study have significant implications for path loss assessment, optimization, and power budget analysis of digital terrestrial wireless communications operating on UHF bands in tropical urban or suburban environments.
The novelty of this study over previous studies in the region is highlighted as follows:
i.
No similar studies based on in situ (real-world) data collection with the data scope of dry and wet season months for two consecutive years in the same study environments and over the experimental digital terrestrial UHF channels have been conducted.
ii.
The results show that empirical models have varying degrees of performance in different environments (location- and climate-dependent) and underscore the need for scientists to validate the reliability of existing empirical models in their locality before they are adapted for use.
iii.
The validated and optimized Hata and COST-231 models for the Ikorodu, Lagos and Akure environments, respectively, provide valuable applications in the performance assessment of existing digital terrestrial television channel links. They would also be useful in creating coverage limitation mappings for predicting television white spaces (TVWS), with the aim of maximizing spectrum and frequency reuse in the study area or similar environments.
Conclusively, the significance of this study for other regions or countries includes the following:
i.
The experimental results, especially for the optimized models, can be employed for channel estimation and modeling over digital terrestrial television channels in regions or countries with geographies similar to the coastal and tropical rainforest zones of Nigeria. These results would find useful application particularly in the coastal–tropical African countries and in any similar climate.
ii.
This study can also be re-produced in other similar regions, with the aim of ensuring quality of service over digital terrestrial television links.

Author Contributions

Conceptualization, A.A.; Formal Analysis, A.A.; Investigation, A.A.; Methodology, A.A.; Supervision, B.T.A.; Validation, A.A. and B.T.A.; Writing—Original Draft, A.A. and B.T.A.; Writing—Review and Editing, A.A. and B.T.A. All authors have read and agreed to the published version of the manuscript.

Funding

This research received no external funding.

Data Availability Statement

The original contributions presented in this study are included in the article. Further inquiries can be directed to the corresponding author.

Acknowledgments

The authors acknowledge the support of Tshwane University of Technology, South Africa.

Conflicts of Interest

The authors declare no conflicts of interest.

References

  1. Akinbolati, A.; Ajewole, M.O.; Adediji, A.T.; Ojo, J.S. Propagation curves and coverage areas of digital terrestrial television base stations in the tropical zone. Heliyon 2020, 6, e03599. [Google Scholar] [CrossRef] [PubMed]
  2. Sabiru, Y.A.; Akinbolati, A.; Ikechiamaka, F.N.; Abe, B.T. Characterization of some secondary radio-climatic factors for reliable radio wave propagation and link’s design over, Northwestern Nigeria. Adv. Space Res. 2024, 74, 890–898. [Google Scholar] [CrossRef]
  3. Armoogum, V.; Soyjaudah, K.M.S.; Mohamudally, N.; Forgarty, T. Propagation models and their applications in digital television broadcast network design and implementation. In Trends in Telecommunications Technology; Bouras, C.J., Ed.; ReserchGate: Berlin, Germany, 2010; pp. 165–183. [Google Scholar]
  4. Ayeni, A.A.; Faruk, N.; Olawoyin, L.; Muhammad, M.Y.; Gumel, M.I. Comparative assessments of some selected existing radio propagation models: A study of Kano city, Nigeria. Eur. J. Sci. Res. 2012, 70, 120–127. [Google Scholar]
  5. Obiyemi, O.O.; Ibiyemi, T.S.; Gbenga-Ilori, A.O.; Ojo, J.S. Path loss model for radio wave propagation at VHF/UHF bands using electric field strength measurement over Ilorin middle-belt, Nigeria. In Proceedings of the IEEE 2nd International Conference on Advances in Computational Tools for Engineering Applications (ACTEA), Beirut, Lebanon, 12–15 December 2012; pp. 43–46. [Google Scholar]
  6. Faruk, N.; Adeseko, A.A.; Yinusa, A.A. Error Bounds of Empirical Path Loss Models at VHF/UHF Bands in Kwara State, Nigeria. In Proceedings of the IEEE Conference Paper, Zagreb, Croatia, 1–4 July 2013. [Google Scholar] [CrossRef]
  7. Oluwafemi, I.B.; Femijemilohun, O.J.; Oluwasola, S.L.; Owolabi, I.E. Investigation of error bounds of empirical path loss Models at UHF band in Ondo State, Nigeria. ARPN J. Eng. Appl. Sci. 2018, 13, 9. [Google Scholar]
  8. Akinbolati, A.; Agunbiade, O.J. Assessment of Error Bounds for Path Loss Prediction Models for TV White Space Usage in Ekiti State, Nigeria. Int. J. Inf. Eng. Electron. Bus. 2020, 3, 28–39. [Google Scholar] [CrossRef]
  9. Mollel, M.S.; Kisangiri, M. Comparison of Empirical Propagation Path Loss Models for Mobile Communication. Comput. Eng. Intell. Syst. 2014, 5, 1–10. [Google Scholar]
  10. Ilo, U.S.; Akpado, K.; Osondu, U.S. Analysis of Artificial Neural Network Model Against Empirical Model (Okumara-Hata Model) for Predicting Pathloss in GSM Network. Invent. J. Res. Technol. Eng. Manag. (IJRTEM) 2019, 3, 33–40. [Google Scholar]
  11. Abiodun, I.C.; Idogho, J. The Study of Empirical Path Loss Models for Accurate Prediction of GSM Signal for Applications in Microcellular Environments. Eur. J. Sci. Innov. Technol. 2022, 2, 2–5. [Google Scholar]
  12. Akande, O.A.; Semire, F.A.; Adeyemo, Z.K.; Agubor, C.K. A Modified Empirical Path Loss Model for 4G LTE Network in Lagos, Nigeria. Iran. J. Electr. Electron. Eng. 2023, 19, 2081. [Google Scholar] [CrossRef]
  13. Ranvier, S. Path Loss Models: S-72.333 Physical Layer Methods in Wireless Communication Systems. Radio Laboratory/TKK. 2004. Available online: https://www.academia.edu/21587105/Path_loss_models_S_72_333_Physical_layer_methods_in_wireless_communication_systems_Sylvain_Ranvier_Radio_Laboratory_TKK (accessed on 7 April 2025).
  14. Nisirat, M.A.; Ismail, M.; Nissirat, L.; Al-Khawaldeh, S. A terrain correction factor for Hata path loss model at 900 MHz. Prog. Electromagn. Res. C 2011, 22, 11–22. [Google Scholar] [CrossRef]
  15. Tariq, S.M.; Al-Mejibli, I.S. ANFIS-Based Indoor Localization and Tracking in Wireless Sensor Networking. Niger. J. Technol. Dev. 2024, 21, 1–9. [Google Scholar] [CrossRef]
  16. Ajayi, G.O.; Owolabi, I.E. Coverage Area of the 10 kW, 702 kHz Medium Wave Transmitter at Minna and Feasibility Studies for Full Radio Coverage of Niger State. In Technical Report of the Electrical Communication Consultancy Unit (ECCU), Department of Electrical and Electronics Engineering, University of Ife, Nigeria; University of Ife: Osun, Nigeria, 1979. [Google Scholar]
  17. Ajewole, M.O.; Oyedum, O.D.; Adediji, A.T.; Eichie, J.O.; Moses, A.S. Spatial Coverage of FM Radio Transmitters in Niger State, Nigeria. IUP J. Telecommun. 2012, 4, 7. [Google Scholar]
  18. Domingo, M.G.; Estebal, P.K.E.; Tongco, G.A.; Mappatao, G.P. Development of a reliable path-loss model for FM broadcast reception in office locations. Bull. Electr. Eng. Inform. 2020, 9, 1654–1661. [Google Scholar] [CrossRef]
  19. Ashidi, A.G. Pathloss and Coverage Analysis of FM Signals for Terrestrial Communication Design over Akure, Nigeria. J. Microw. Eng. Technol. 2023, 10, 8–21. [Google Scholar]
  20. Abiodun, O. Assessment of Path Loss Prediction Models for Wireless Propagation Channels at L-Band Frequency over Different Micro-Cellular Environments of Ekiti State, Southwestern Nigeria. Int. J. Electron. Commun. Eng. 2017, 11, 1103–1109. [Google Scholar]
  21. Faruk, N.; Adeseko, A.A.; Yinusa, A.A.; Nazmat, S.B. Improved Path-Loss Model for Predicting DTV Coverage for Secondary Access. Int. J. Wirel. Mob. Comput. 2014, 7, 6. [Google Scholar]
  22. Olawole, E.T.; Akande, D.O.; Adeyemo, Z.K.; Ojo, F.K.; Ojo, S.I. Effect of Modulation Domain Coupled Kalman-Spectral Filter on Speech Enhancement over Wireless Voiced Communication System. Niger. J. Technol. Dev. 2024, 21, 20–28. [Google Scholar] [CrossRef]
  23. Ajewole, M.O.; Oyedum, O.D.; Adediji, A.T.; Moses, A.S.; Eichie, J.O. Spatial Variability of VHF/UHF Electric Field Strength in Niger State, Nigeria. Int. J. Digit. Inf. Wirel. Commun. 2013, 3, 26–34. [Google Scholar]
  24. Akinbolati, A.; Omotoso, Y.I.; Adamu, I.; Suleiman, M.; Yaradua, S.A. Path Loss Assessment of a Terrestrial Digital UHF Channel over Kano City, Nigerian. J. Phys. 2024, 33, 15–22. [Google Scholar] [CrossRef]
  25. Ojo, J.S.; Ayegba, A.; Adediji, A.T. Impact of Atmospheric Parameters and Noise Temperature on Digital Terrestrial Television Signal Strength over Karshi, Area, Abuja, North-Central, Nigeria. In Proceedings of the International Conference on Energy and Sustainable Environment, Ota, Nigeria, 23–25 June 2020; IOP Conference Series: Earth and Environmental Science. Volume 665, p. 012048. [Google Scholar] [CrossRef]
  26. Ayegba, A.; Ojo, J.S.; Adediji, A.T. Statistical Analysis of Atmospheric Parameters, noise temperature and digital terrestrial television signal strength over Jos Metropolis, Plateau State, Nigeria. Heliyon 2022, 8, e09988. [Google Scholar] [CrossRef]
  27. Akinbolati, A.; Isah, S.; Okpala, C. Investigation of Error Margin of Some Path Loss Models over Digital Terrestrial Television Channel in Katsina Metropolis. Niger. J. Theor. Environ. Phys. 2023, 1, 1–8. [Google Scholar] [CrossRef]
  28. Sodunke, M.A.; Ojo, J.S.; De, A. Study of the seasonal characteristics of rainfall rate in Southwestern Nigeria and its effect on induced attenuation in earth-satellite communications. J. Atmos. Sol.-Terr. Phys. 2024, 263, 106331. [Google Scholar] [CrossRef]
  29. Lyu, Y.; Wang, W.; Chen, P. Fixed-Wing UAV Based Air-to-Ground Channel Measurement and Modelling at 2.7 GHz in Rural Environment. In Proceedings of the IEEE Transactions on Antennas and Propagation, Florence, Italy, 19 July 2024; p. 1. [Google Scholar] [CrossRef]
  30. Wang, J.; Zhu, Q.; Lin, Z.; Wu, Q.; Huang, Y.; Cai, X.; Zhong, W.; Zhao, Y. Sparse Bayesian Learning-Based 3-D Radio Environment Map Construction—Sampling Optimization, Scenario-Dependent Dictionary Construction, and Sparse Recovery. In Proceedings of the IEEE Transactions on Cognitive Communications and Networking, Piscataway, NJ, USA, 26 September 2023; Volume 10. [Google Scholar] [CrossRef]
  31. Aremu, O.A.; Olaosebikan, A.; Makinde, O.S.; Oyinkanola, L. Optimization of COST-231 Hata Radio Propagation Prediction Model for GSM 4G FDD-LTE Operating at 1800 MHz in Tropical Region. J. Electron. Commun. Eng. Res. 2023, 9, 9–16. [Google Scholar]
  32. ITU-R. Propagation Data and Prediction Methods Required for Terrestrial Land mobile Services. Recommendation P.529-3. 1997. Available online: https://www.itu.int/rec/R-Rec.P.529-3 (accessed on 7 April 2025).
  33. Mardeni, R.; Priya, T.S. Optimized COST-231 Hata Models for WiMAX Path Loss Prediction in Suburban and Open Urban Environments. Mod. Appl. Sci. 2010, 75–89. [Google Scholar] [CrossRef]
  34. Wang, H.; Xiao, P.; Li, X. Channel Parameter Estimation of mmWave MIMO System in Urban Traffic Scene: A Training Channel-Based Method. IEEE Trans. Intell. Transp. Syst. 2024, 25, 754–762. [Google Scholar] [CrossRef]
  35. Hata, M. Empirical formula for propagation loss in land mobile radio services. IEEE Trans. Veh. Technol. 1980, 29, 317–325. [Google Scholar] [CrossRef]
  36. COST Action-231 (1999). Digital Mobile Radio Towards Future Generation Systems Final Report (EUR18957). Available online: https://op.europa.eu/en/publication-detail/-/publication/f2f42003-4028-4496-af95-beaa38fd475f (accessed on 7 April 2025).
  37. Hoomod, H.K.; Al-Mejibli, I.; Jabboory, A.I. Analyzing Study of Path loss Propagation Models in Wireless Communications at 0.8 GHz. J. Phys. Conf. Ser. 2018, 1003, 012028. [Google Scholar] [CrossRef]
  38. Blaunstein, N.; Censor, D.; Katz, D. Radio propagation in rural residential areas with vegetation. Prog. Electromagn. Res. 2003, 40, 131–153. [Google Scholar] [CrossRef]
Figure 1. (a) GIS map indicating measurement routes in Ikorodu; (b) GIS map indicating measurement routes in Akure [1].
Telecom 06 00028 g001
Figure 2. Comparison of measured path loss (MPL) for both wet and dry season months over distance.
Telecom 06 00028 g002
Figure 3. Comparison of measured and predicted path loss values in the Ikorodu environment.
Telecom 06 00028 g003
Figure 4. Variation in the RMSE for the predicted models in the Ikorodu environment.
Telecom 06 00028 g004
Figure 5. Comparison of measured path loss (MPL) for both wet and dry season months over distance in Akure.
Telecom 06 00028 g005
Figure 6. Comparison of MPL with PPLMs over distance in Akure environment.
Telecom 06 00028 g006
Figure 7. Variation in RMSE for the predicted models in Akure environment.
Telecom 06 00028 g007
Figure 8. Variation in measured path loss using the untuned Hata and optimized Hata models in the Ikorodu environment.
Telecom 06 00028 g008
Figure 9. Variation in the measured path loss using the untuned and optimized COST-231 models in the Akure environment.
Telecom 06 00028 g009
Table 1. Closely related studies indicating the methods, locations, and key findings.
ReferenceNature of Work/LocationMain Finding(s)/Limitations/Strengths
[6]Drive test protocols (DTPs) deployed for data collection in three environments in Kwara State, Nigeria. Empirical path loss model (EPLM) performances investigated for VHF/UHF channel.Hata and Davidson models recommended for prediction, limited to analog channels, no optimization.
[7]DTPs deployed for data collection over analog UHF channels in Ondo State, Nigeria. EPLMs were tested.Davidson model recommended, no optimization, limited to analog channel.
[9]Measurements by DTPs over GSM 900 MHz in urban, suburban, and rural areas of, Dar es Salaam, Tanzania. EPLMs were tested.ECC-33 recommended, especially in suburban areas, no optimization.
[12]Propagation measurements by DTPs over GSM 4G in urban and suburban areas of Lagos, Nigeria. Five EPLMs were tested.Okumura–Hata performed best and was optimized.
[14]Propagation measurement by DTPs over 900 MHz in West of Amman, Jordan. Terrain roughness incorporated in Hata model.Modified Hata model proposed over microcell.
[18]Propagation measurements of three FM signals in office buildings scenarios in Philippines.Proposed new models for FM path loss, limited to FM channels.
[24]DTPs employed for data collection over DTV in Kano City, Nigeria. Okumura model used for path loss assessment.Modified Okumura model proposed, limited to a model, no optimization.
[27]DTPs employed for data collection over DTV in Katsina City, Nigeria. Performance evaluation of seven EPLMs carried out.COST-231 performed best and is recommended for use, no optimization.
[28]Studied seasonal characteristics of rainfall rate and rain-induced attenuation on earth–satellite link in Akure.ITU-R 618-13 (2017) was modified for use.
[29]Investigated the channel fading path loss over an air-to-ground link at 700 m.Shadow fading has a high dependence on UAV.
[30]A 3-D radio environment map based on sparse Bayesian learning was developed.Results had higher accuracy under the low sampling rate.
[31]Propagation measurement by DTPs over GSM 4G in urban and suburban areas of Ibadan, Nigeria. Three EPLMs were tested.COST-231 performed best and was optimized.
[33]Field measurements were conducted to determine path loss over WiMAX, in Cyberjaya, Malaysia. Performance evaluation of three EPLMs carried out.COST-231 performed best and was optimized for use over 2360–2390 MHz band, in the urban and suburban environments.
[34]Channel parameter estimation of mmWave MIMO system was carried out in urban traffic scene.Noise weighting was introduced in their proposed method, and the simulated results showed validity of the method in frequency-selective mmWave MIMO channel.
Present StudyThe reliability of four empirical Okumura–Hata family-based models in tropical urban and suburban environments is investigated in Ikorodu, Lagos and Akure, Southwestern Nigeria. Data were collected through in situ drive test campaigns along propagation measurement routes covering both dry and wet season months for two consecutive years. The mean values of the data were employed for analysis to enhance the reliability of the results.This study aims to fill the following research gaps by:
(i)
This study was carried out using real-world data with seasonal scopes so that the findings could be useful for the accurate prediction of path loss over digital terrestrial UHF channels in the study regions or similar environments.
(ii)
The best performing model(s) that would provide valuable and reliable applications in assessing the performance of existing digital terrestrial television channels are validated and optimized. This will also be useful in creating coverage limitation mappings for predicting television white spaces (TVWS), contributing to the maximization of spectrum and frequency reuse in the study area or similar environments.
These gaps have largely been overlooked in the previous literature.
Table 2. Key transmission and receiver parameters of the two DTBS.
s/nStation ParametersIkorodu DTBSAkure DTBS
1Location’s geographic coordinatesLatitude 6°37′43″ N, Long. 3°31′42″ ELatitude 7°15′08″ N, Long. 5°07′53″ E
2Frequency of transmission (MHz)/channel658/UHF 44772/ UHF 52
3Transmitted power (kW)1.802.90
4Height of transmitting base station’s mast/antenna ( h b ) (m)182.50182.50
5Height of receiver antenna ( h r ) (m)3.03.0
6Antenna’s gain (dB)17.0017.00
7Cable and connector loss (dB)3.03.0
Table 3. Environments and constant definitions for Ericsson model [9,12,35].
s/nEnvironment a 0 a 1 a 2 a 3
1Urban36.230.2120.1
2Suburban43.268.93120.1
3Rural45.95100.6120.1
Table 4. Typical datasets for dry season months along route A for both base stations in Ikorodu, Lagos and Akure.
Measured Parameters at Data Points in Ikorodu
Data PointsLat. (°N)Long. (°E)RSS1 (dBm)RSS2 (dBm)RSS Mean (dBm)
DTBS, Ikorodu6°37′433°31′42″−25−27−26
Magodo6°37′38″3°31′46″−21−20−21
Ijede Road6°37′55″3°32′12″−35−37−36
EPIC Events Centre, Ikorodu6°37′37″3°32′48″−44−42−43
Omitoro Ikorodu6°37′25″3°33′19″−39−37−38
Ijede, Ikorodu6°37′05″3°33′46″−31−31−31
Chong fuel station, Ikorodu6°36′52″3°34′16″−40−42−41
Defaks Petroleum6°36′43″3°34′45″−58−59−59
Oke Eletu6°36′12″3°35′12″−41−40−41
Abule Eko6°35′13″3°35′13″−45−46−46
FRCN Nat. Station, Ijede6°34′41″3°35′26″−53−55−54
Egbin Power Station, Ijede6°34′05″3°35′30″−70−71−71
Measured Parameters at Data Points in Akure
DTBS in Akure7°15′09″5°07′53″−24−26−26
Positive FM7°15′10″5°07′52″−31−30−30
Ondo Rd I7°14′59″5°09′16″−49−46−46
Ondo Rd II7°15′00″5°10′06″−38−35−35
Isinkan 17°15′05″5°11′07″−45−46−46
NEPA Junction7°14′40″5°12′13″−69−68−68
NUT Oda Road7°13′27″5°13′03″−64−65−65
NYSC zonal7°12′45″5°13′22″−77−75−75
Ilekun 17°12′03″5°13′39″−71−70−70
Ilekun 27°11′19″5°13′49″−75−77−77
Oda 17°10′36″5°14′01″−79−78−78
Oda 2, Ogbe High School7°10′09″5°14′17″−85−83−83
Table 5. Mean measured path loss (MPL) for routes A and B for both dry and wet season months in Ikorodu.
Tx-Rx Distance (km)Mean MPL
Dry Season (dB)
Mean MPL
Wet Season (dB)
Overall
Mean MPL (dB)
0.00285.55189.05287.3015
1.01097.545100.05298.7985
2.050104.051102.557103.304
3.090105.550109.053107.3015
4.01096.052109.054102.553
5.020104.551116.054110.3025
6.080110.551121.553116.0515
7.040108.550120.552114.551
8.000113.038124.565118.8015
9.000118.052130.054124.053
10.050124.552137.554131.053
Mean106.186114.555110.371
Table 6. Comparison of the mean values of the measured and the predicted path loss models (PPLM) in the study environment.
Path LossMPL (dB)Hata Model (dB)COST-231 (dB)Ericsson (dB)ECC-33 (dB)
Value110.42121.90123.55158.42291.01
Table 7. Error analysis of the PPLMs in the Ikorodu environment.
Error MetricsHATACOST-231Ericsson ModelECC-33 Model
RMSE10.8114.9560.17175.20
Maximum error19.5120.7570.01194.02
Minimum error1.653.3017.10150.25
Mean error9.5013.5160.48170.50
Skewness101.50144.50550.801920.00
Table 8. Mean measured path loss (MPL) for routes A and B for both dry and wet season months in Akure.
Tx-Rx Distance (km)Mean MPL
Dry Season (dB)
Mean MPL
Wet Season (dB)
Overall
Mean MPL (dB)
0.0995.63595.97595.805
1.0197.65098.68598.167
2.00100.26094.11097.185
3.05113.635115.120114.377
4.02107.620117.120112.37
5.03108.410120.700114.555
6.05108.120119.410113.765
7.02115.565124.605120.085
8.01134.620137.360135.99
9.01131.120130.975131.0475
10.02138.620137.910138.265
11.05135.120136.315135.7175
12.01146.620145.810146.215
13.08131.120147.960139.54
14.34133.620137.370135.495
15.50140.550143.315141.9325
Mean121.142125.171123.157
Table 9. Comparison of the mean values of the measured and predicted path loss models (PPLMs) in Akure.
Path LossMPL (dB)COST-231 (dB)Hata Model (dB)Ericsson (dB)ECC-33 (dB)
Value123.157121.922130.179198.979313.494
Table 10. Error analysis of the PPLMs in Akure.
Error MetricsCOST-231HATAEricsson ModelECC-33 Model
RMSE9.87711.79980.150190.642
Maximum error26.26621.13695.388202.635
Minimum error0.3080.46317.225154.994
Mean error7.3439.83218.570190.337
Skewness117.025157.3131213.1453045.397
Disclaimer/Publisher’s Note: The statements, opinions and data contained in all publications are solely those of the individual author(s) and contributor(s) and not of MDPI and/or the editor(s). MDPI and/or the editor(s) disclaim responsibility for any injury to people or property resulting from any ideas, methods, instructions or products referred to in the content.

