

Development of an Analog Gauge Reading Solution Based on Computer Vision and Deep Learning for an IoT Application

 , , ,
, , ,  , and
, and 
Abstract
:1. Introduction
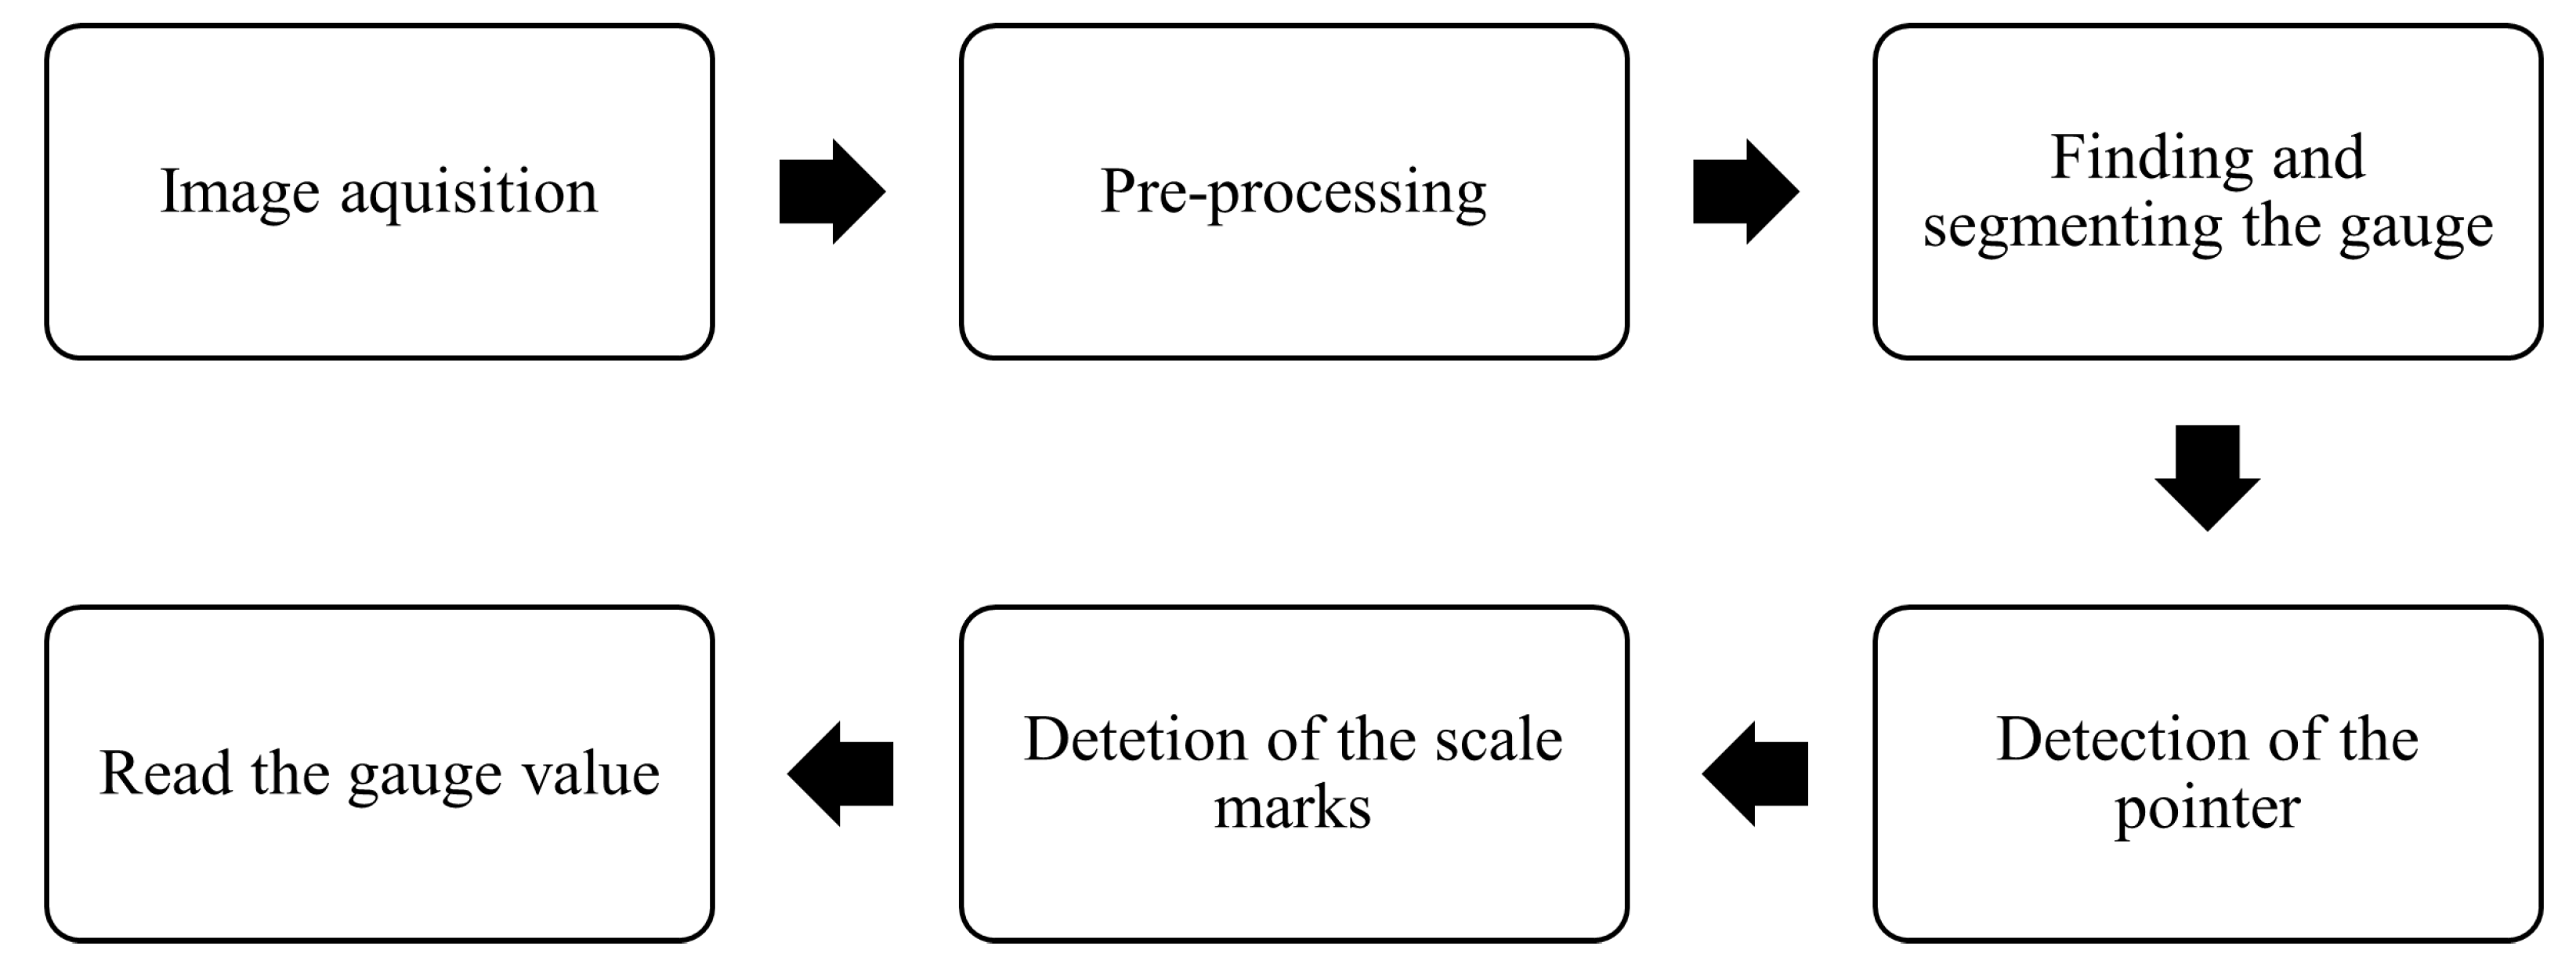
2. Methodological Approach
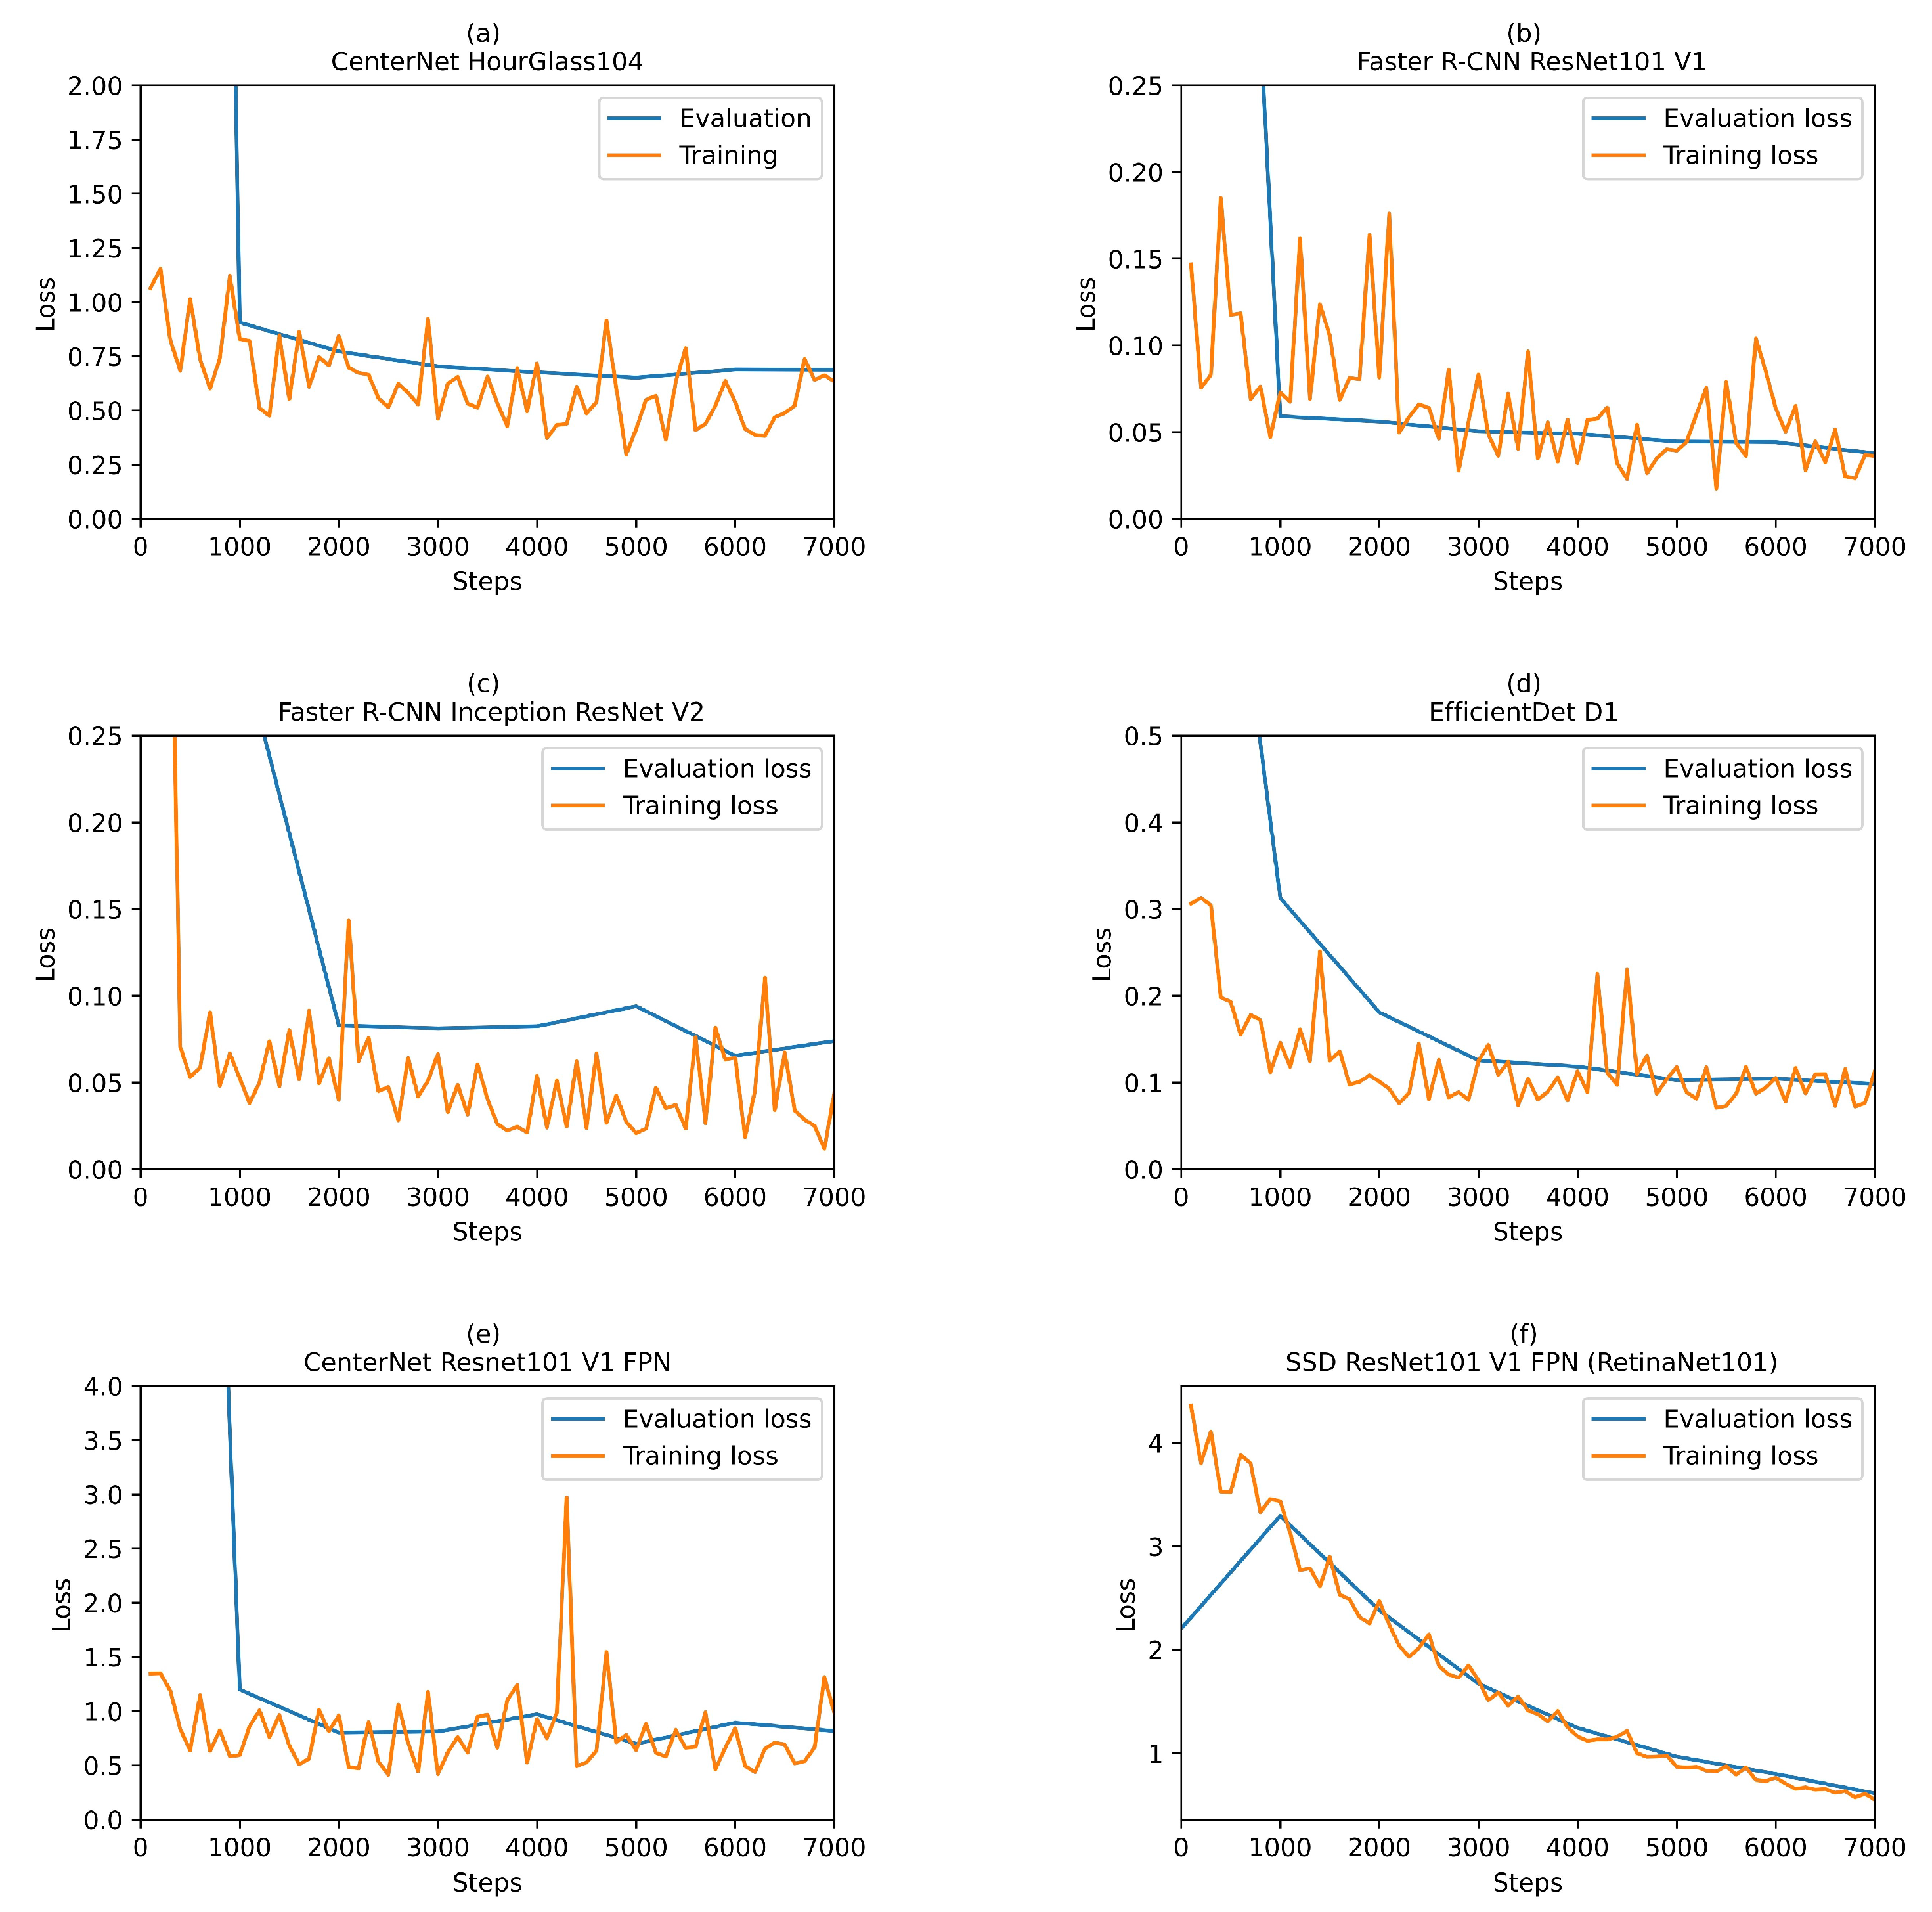
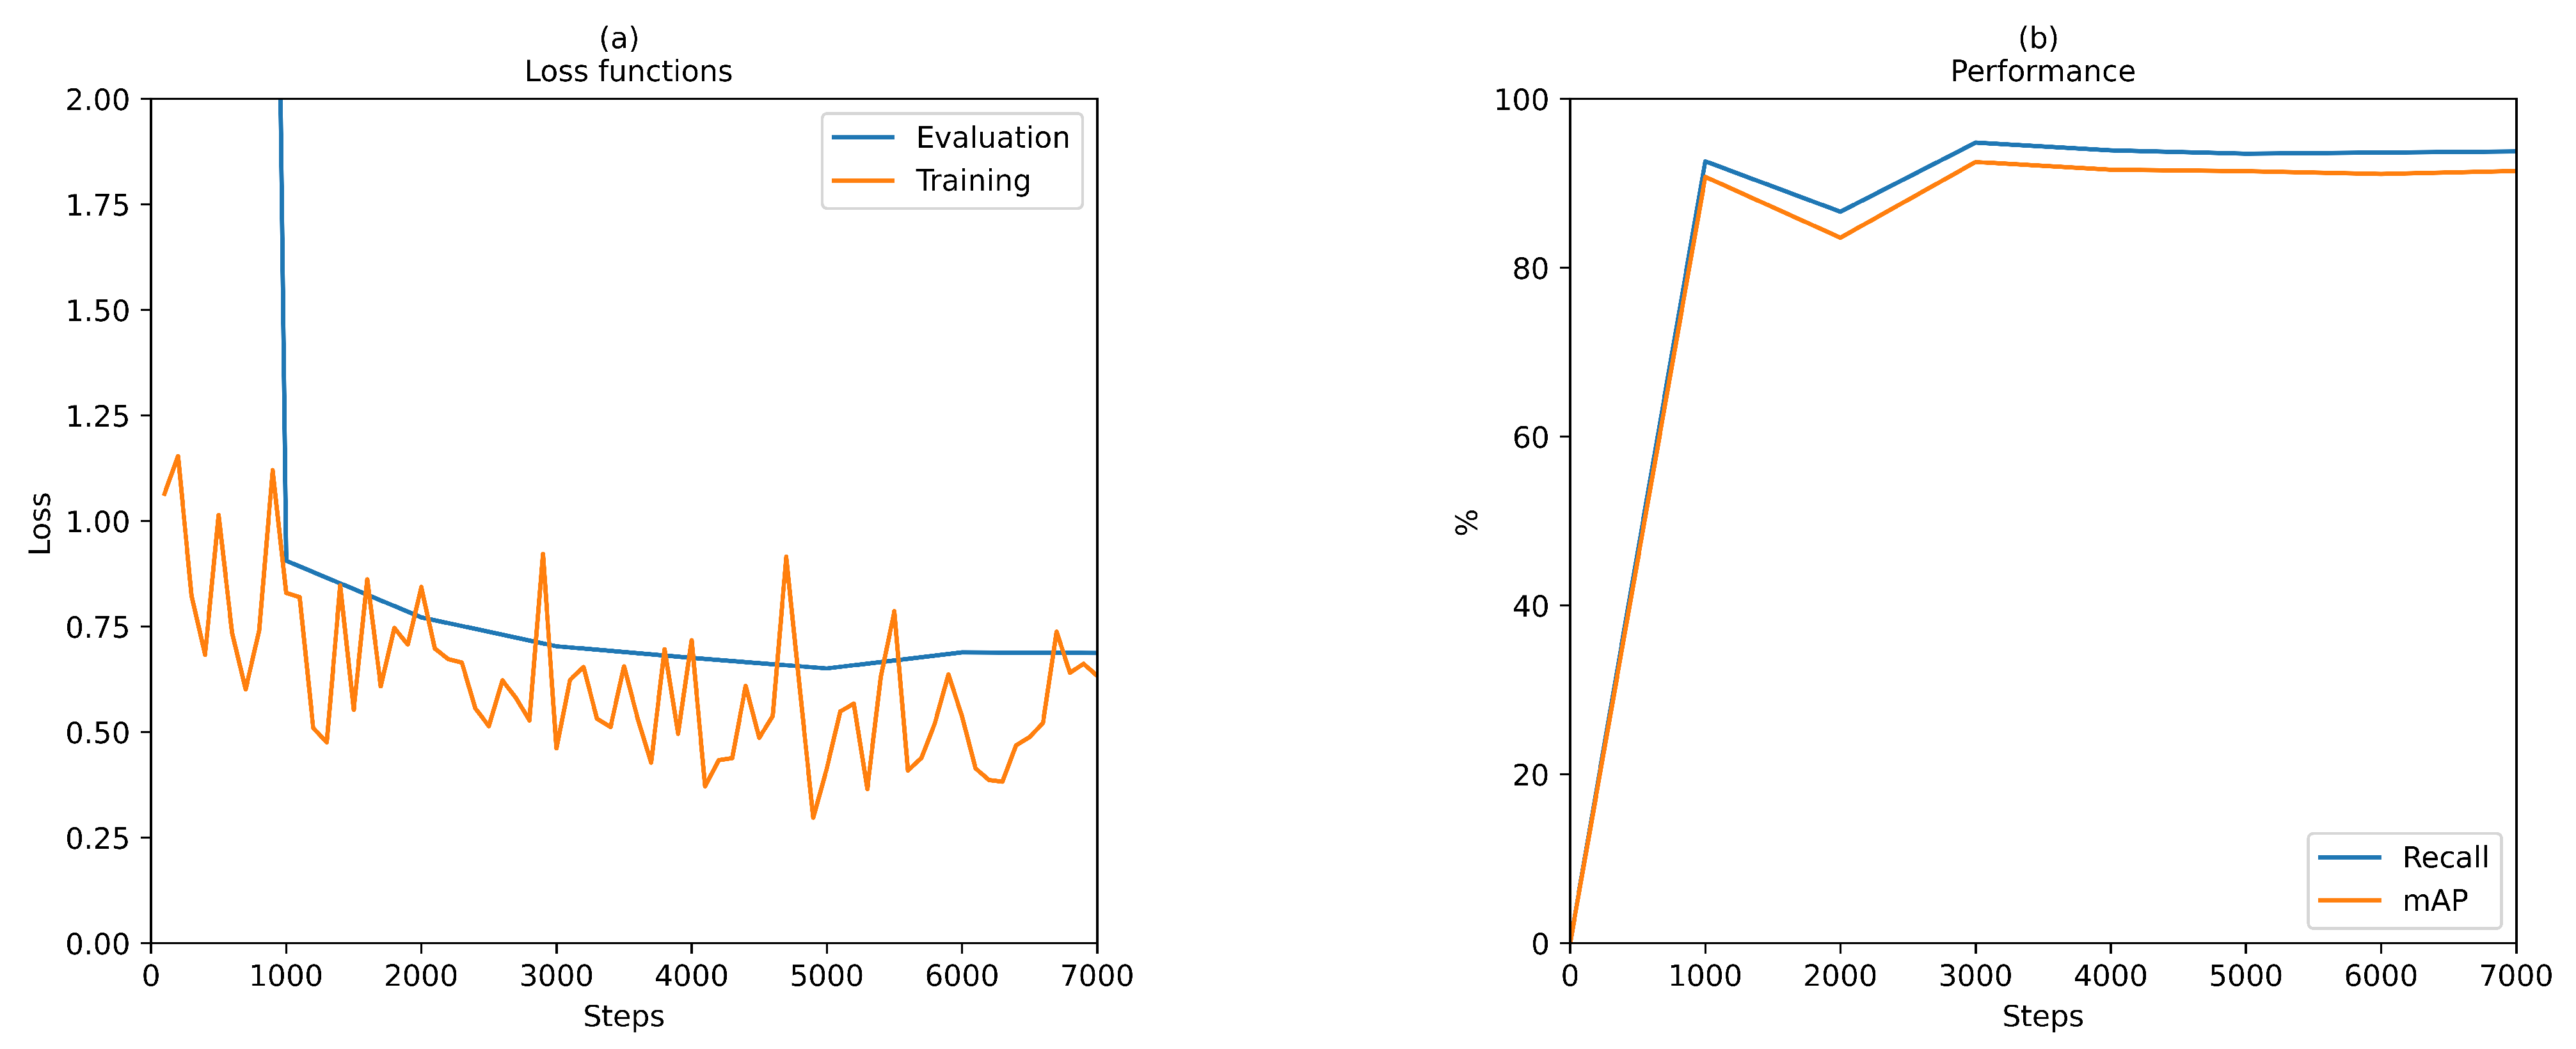
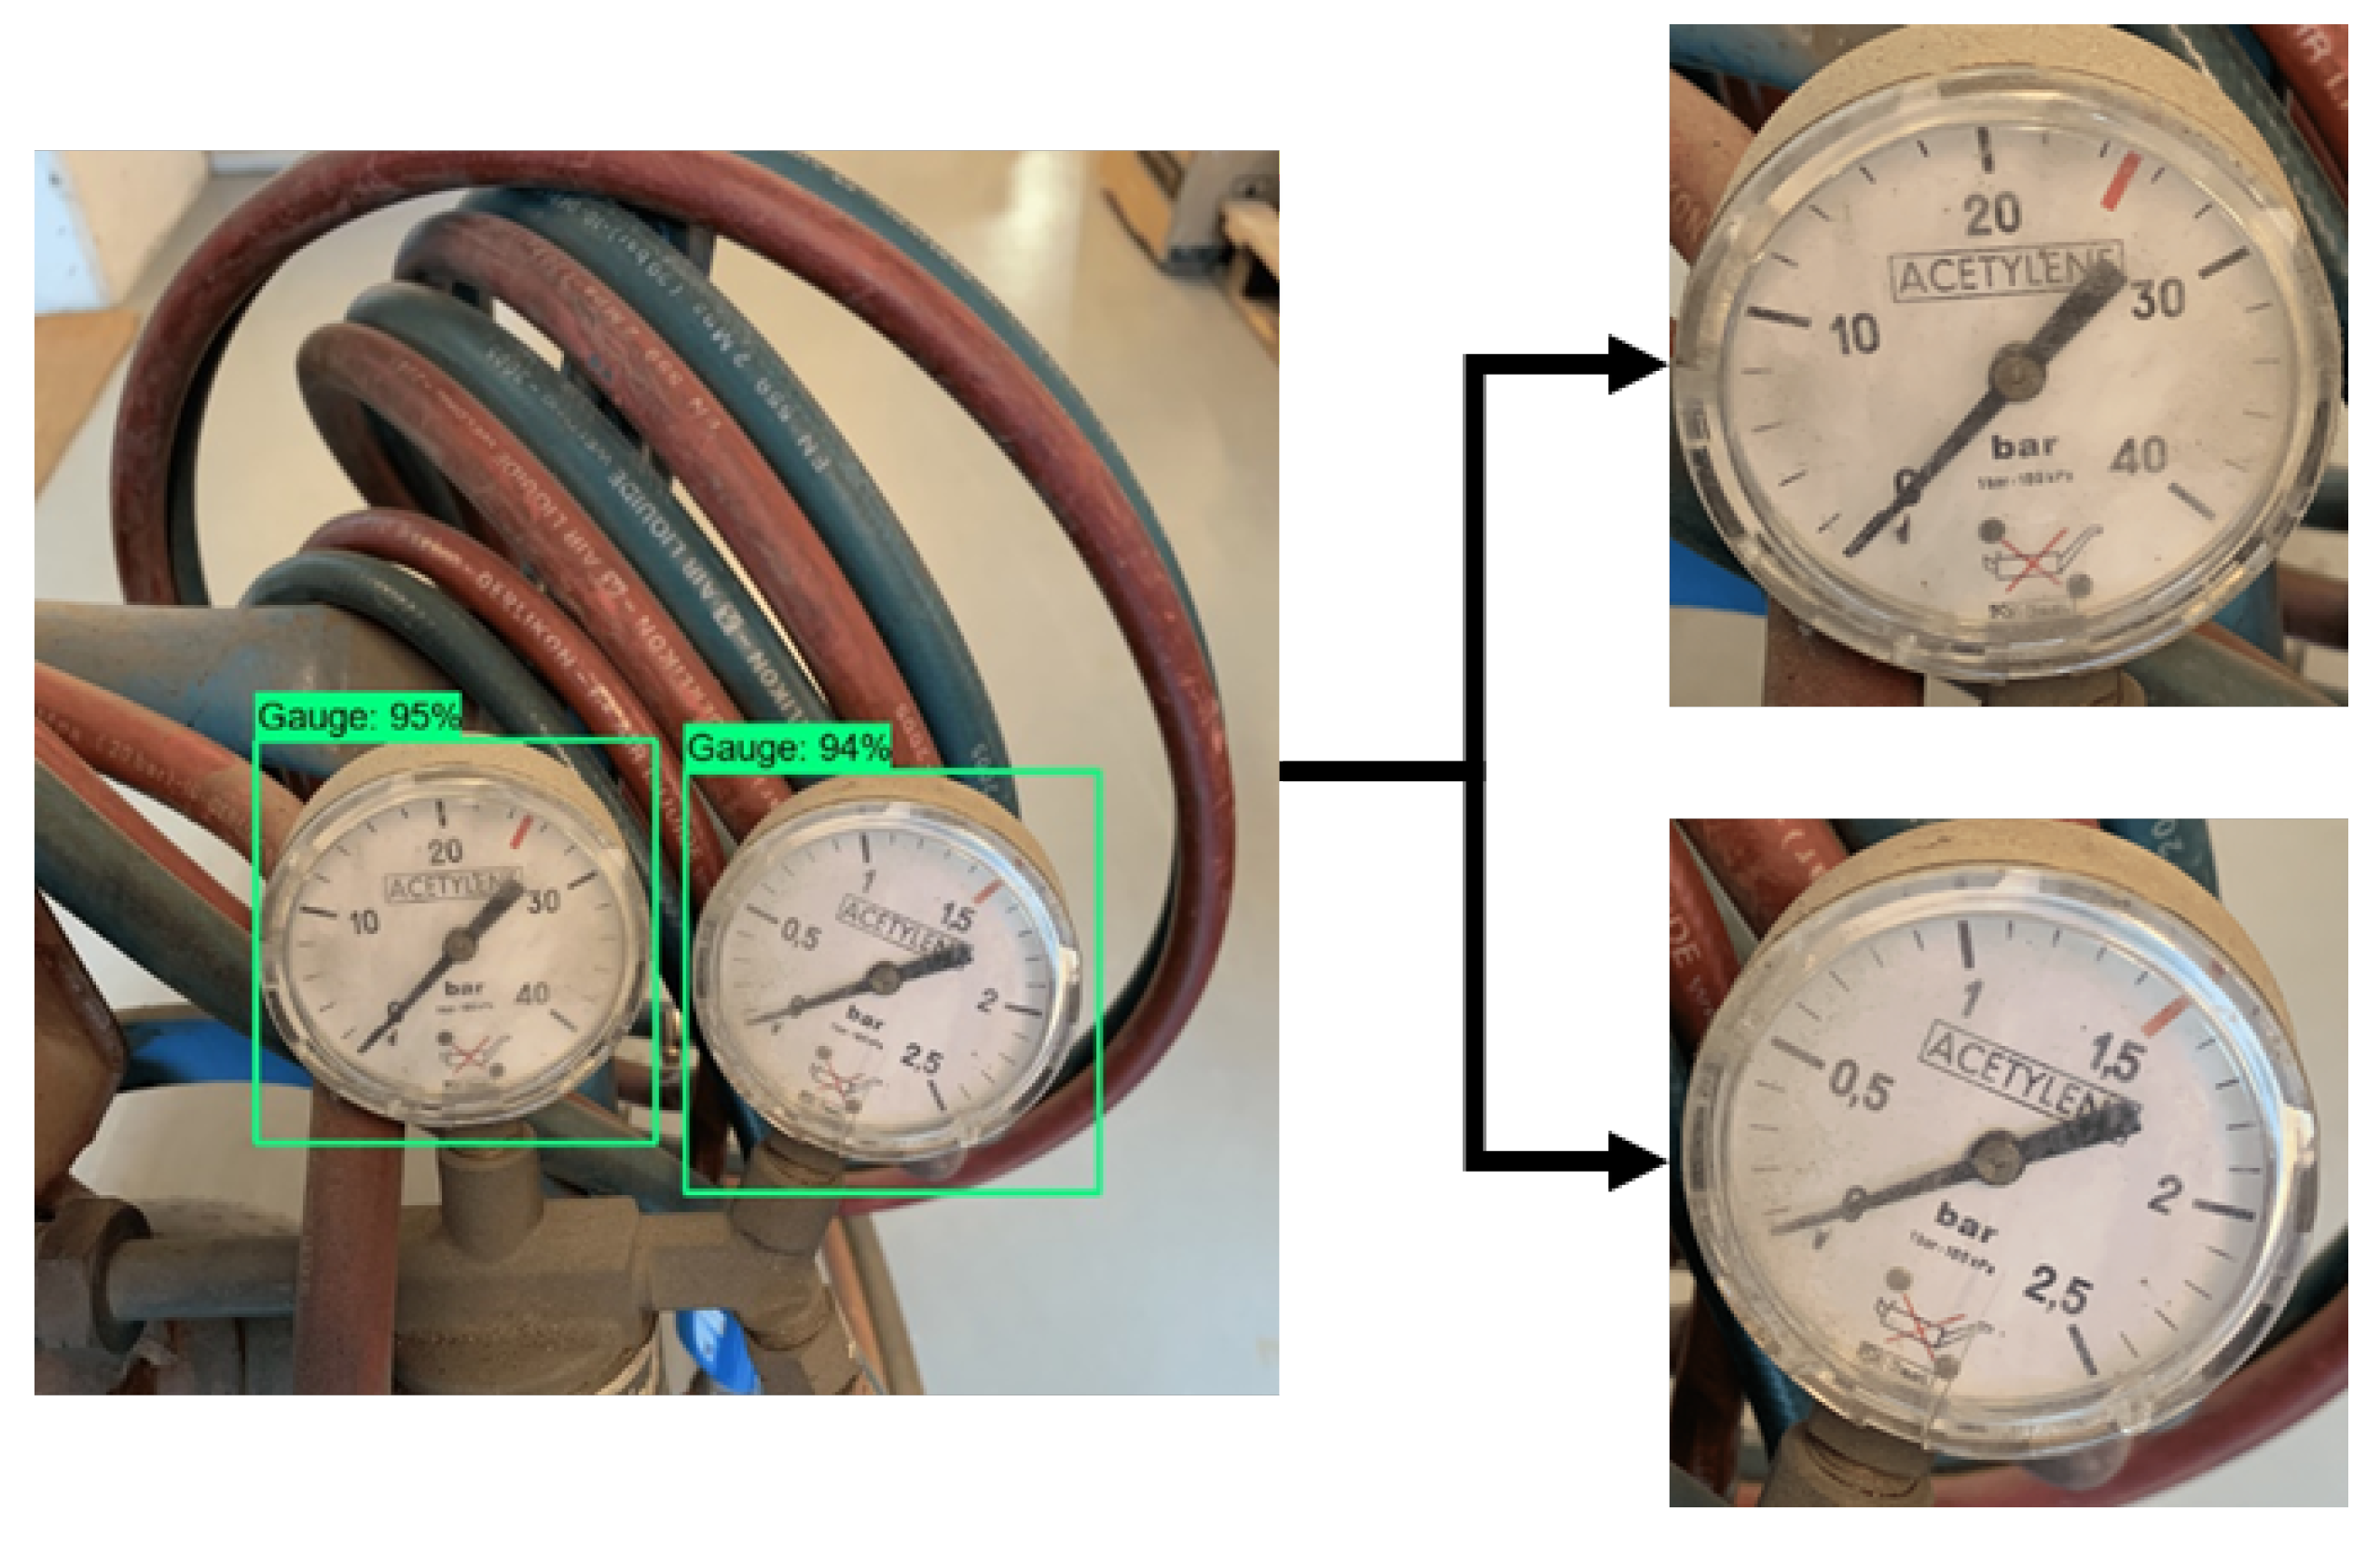
2.1. Object Detection Based on CNN
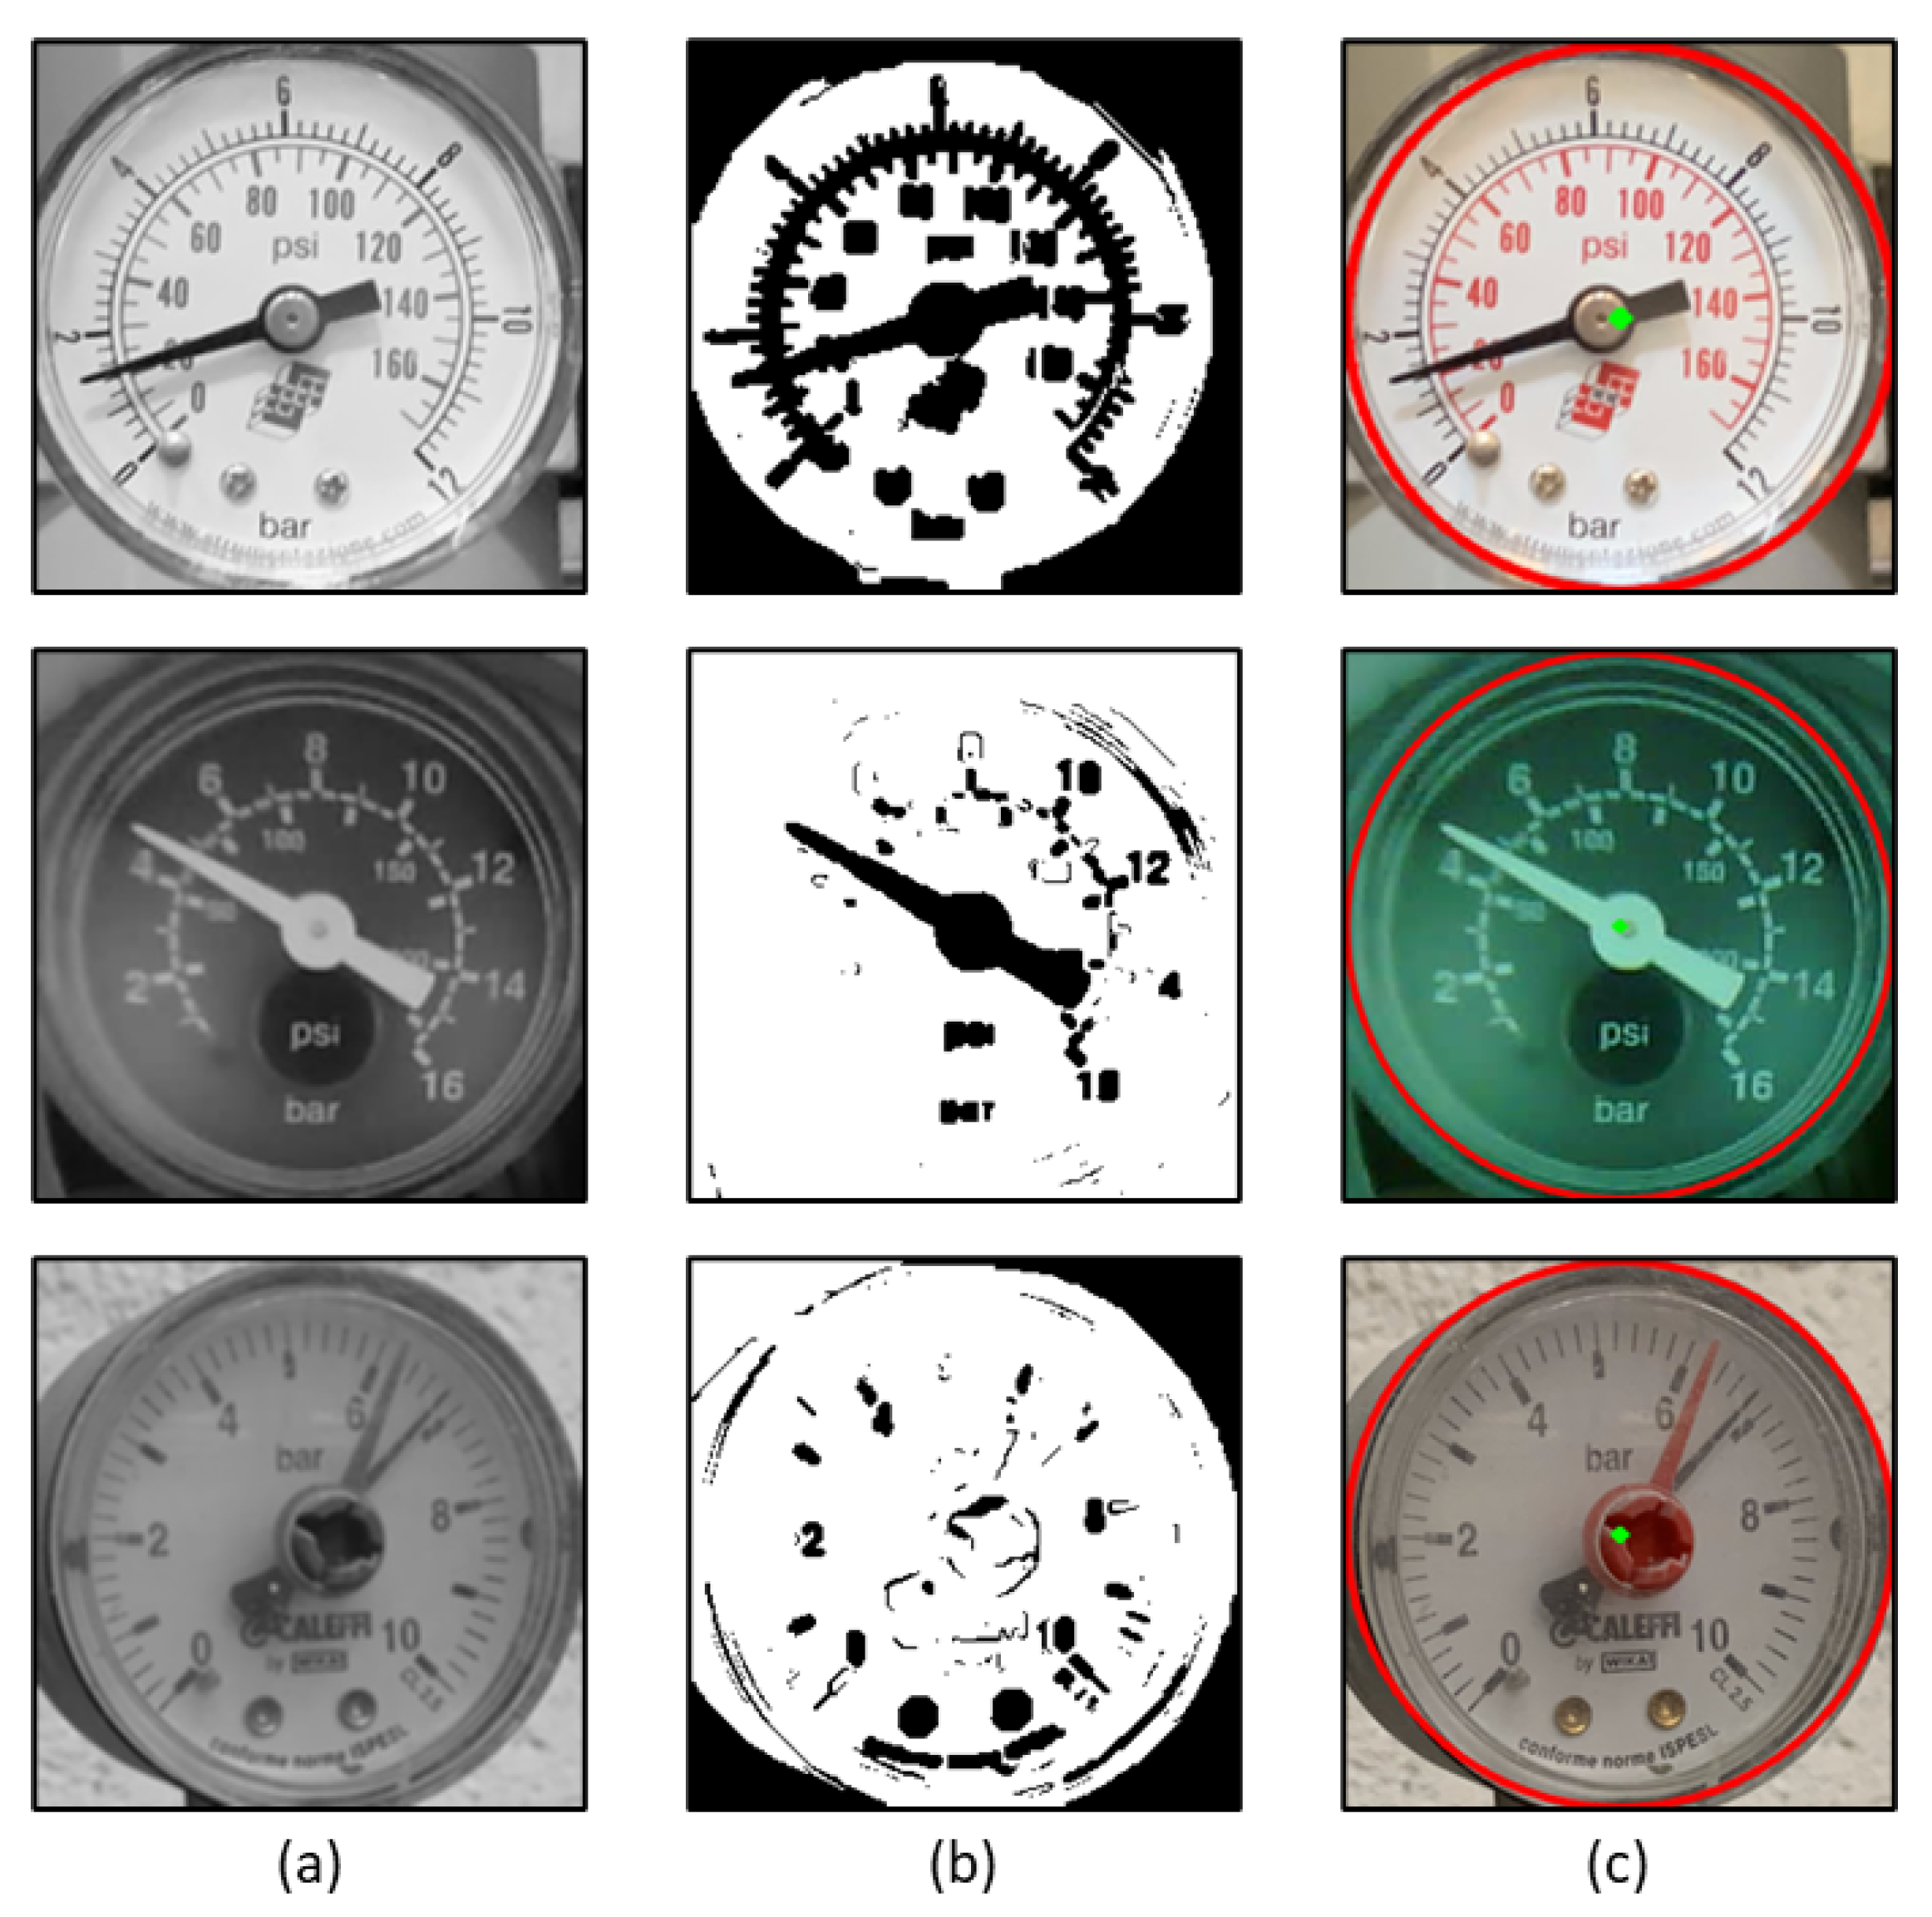
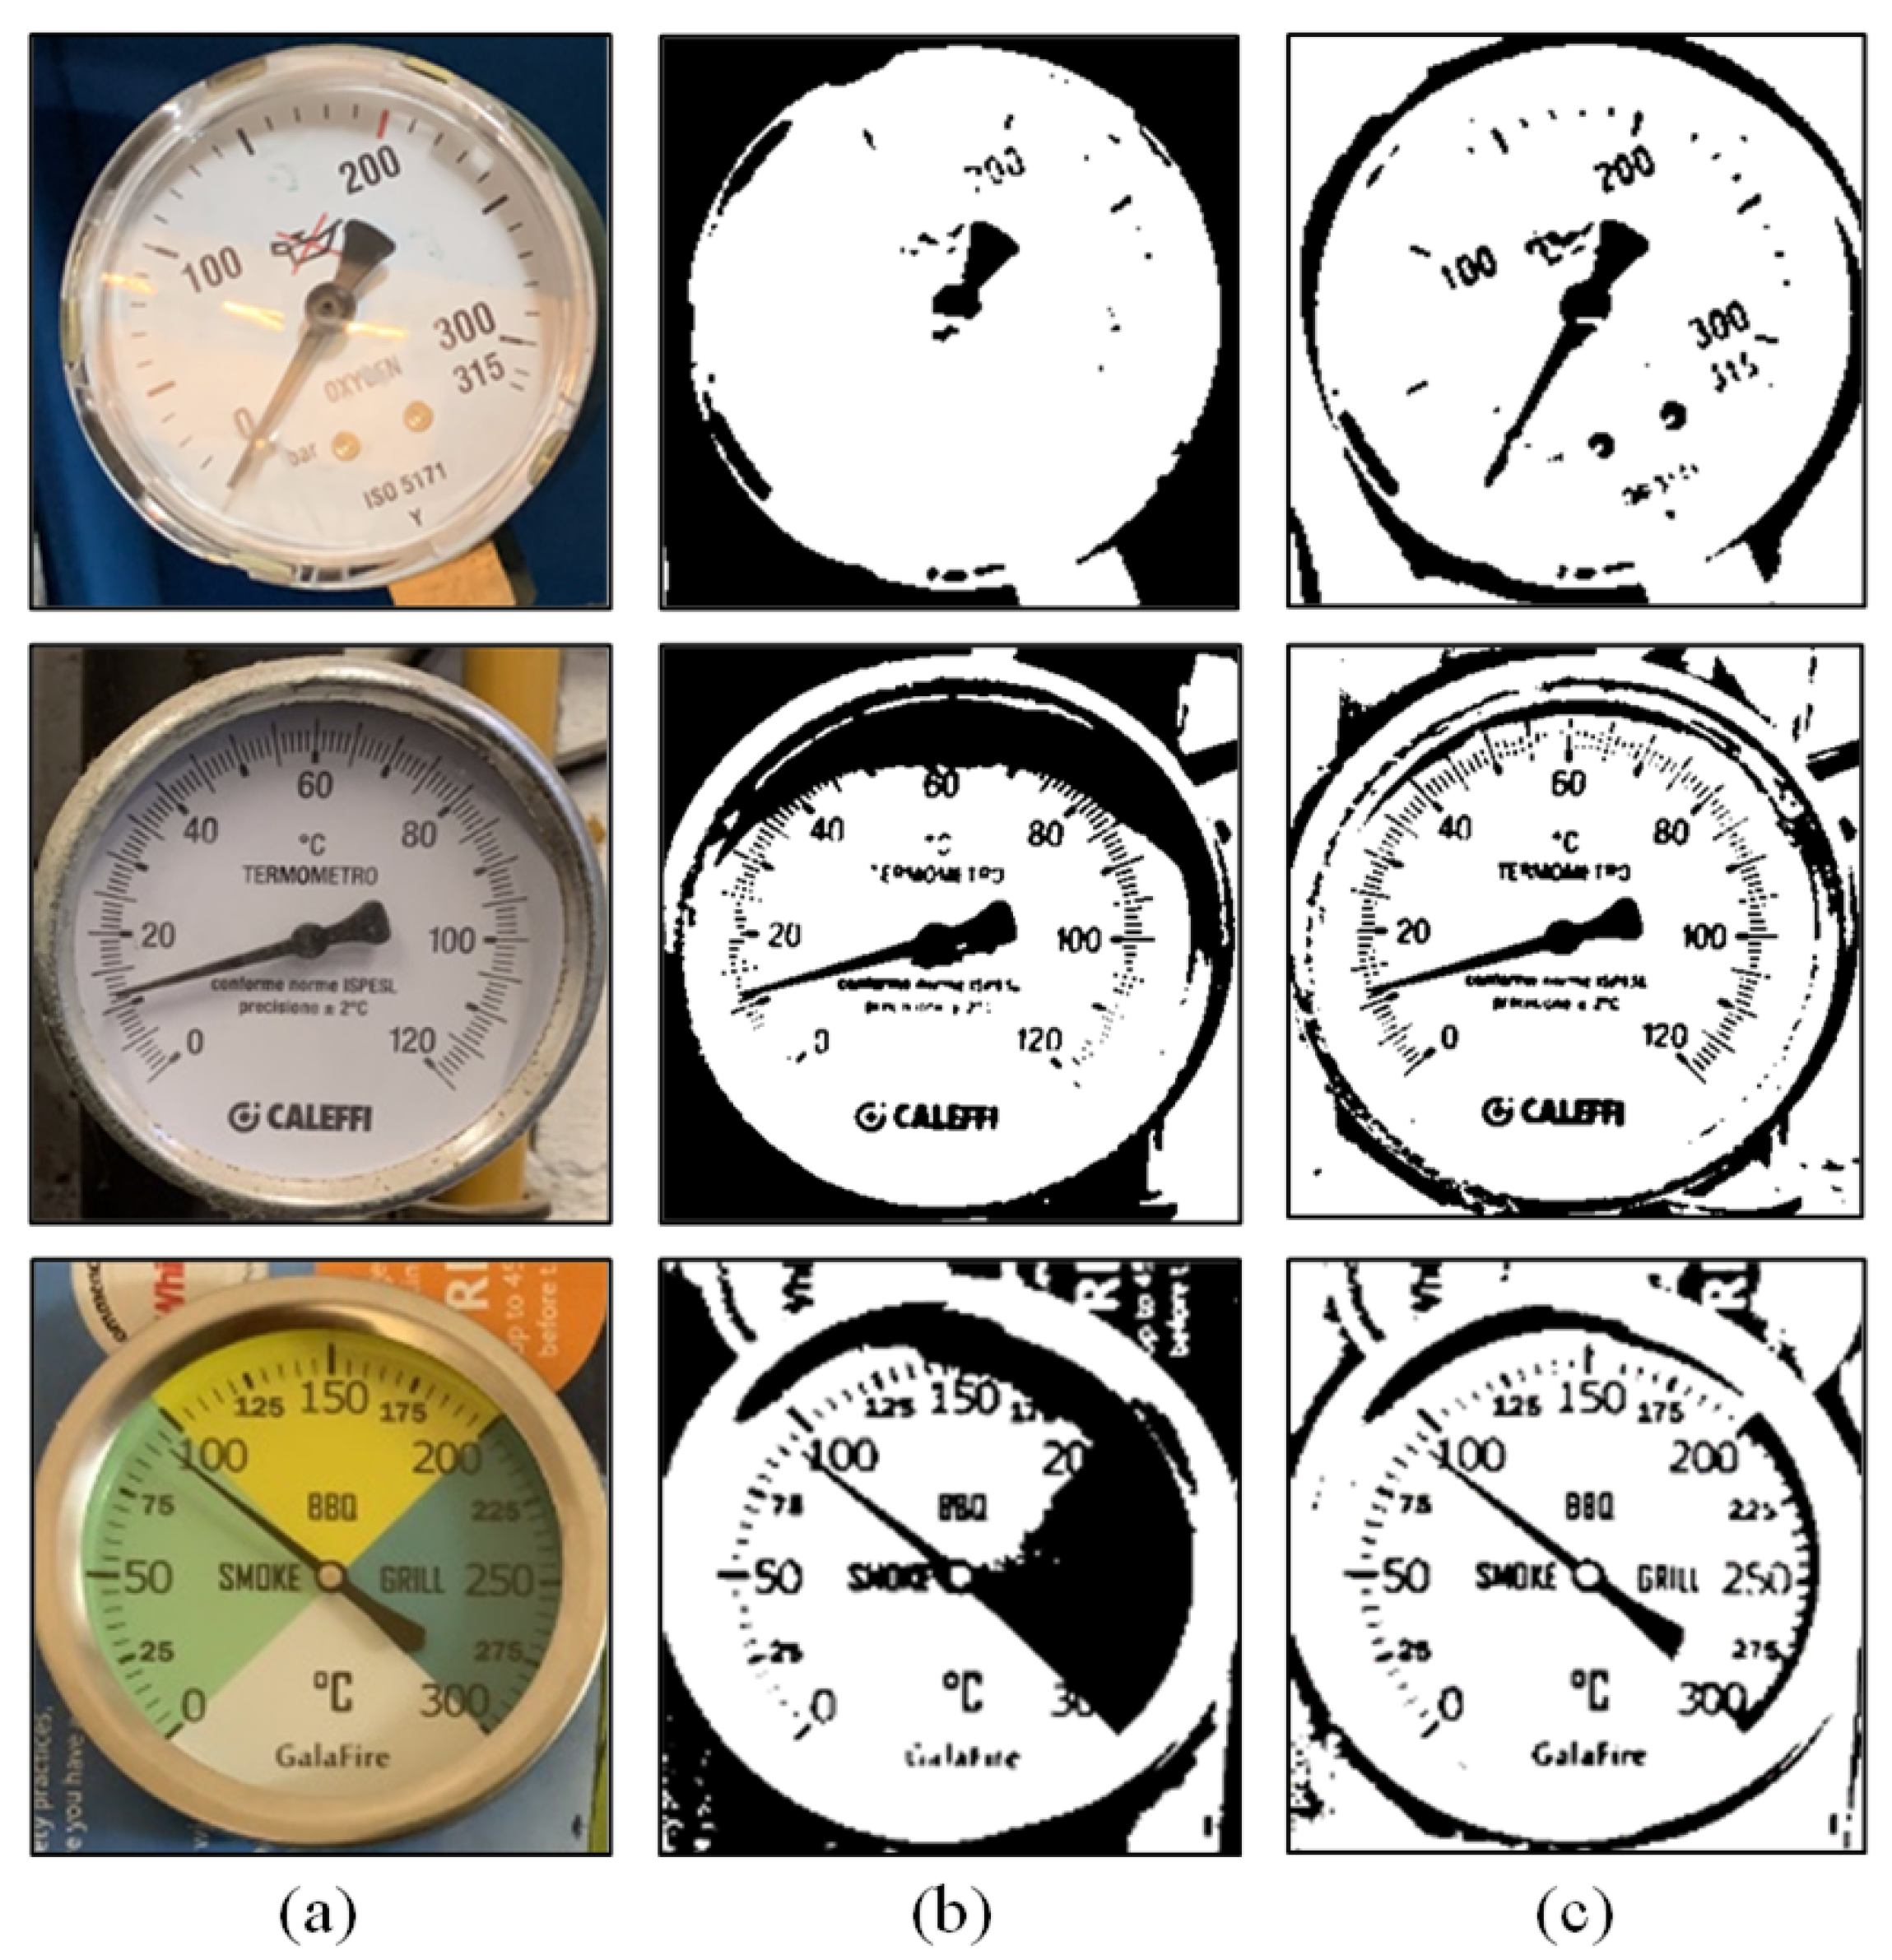
2.2. Dial Segmentation and Center Localization
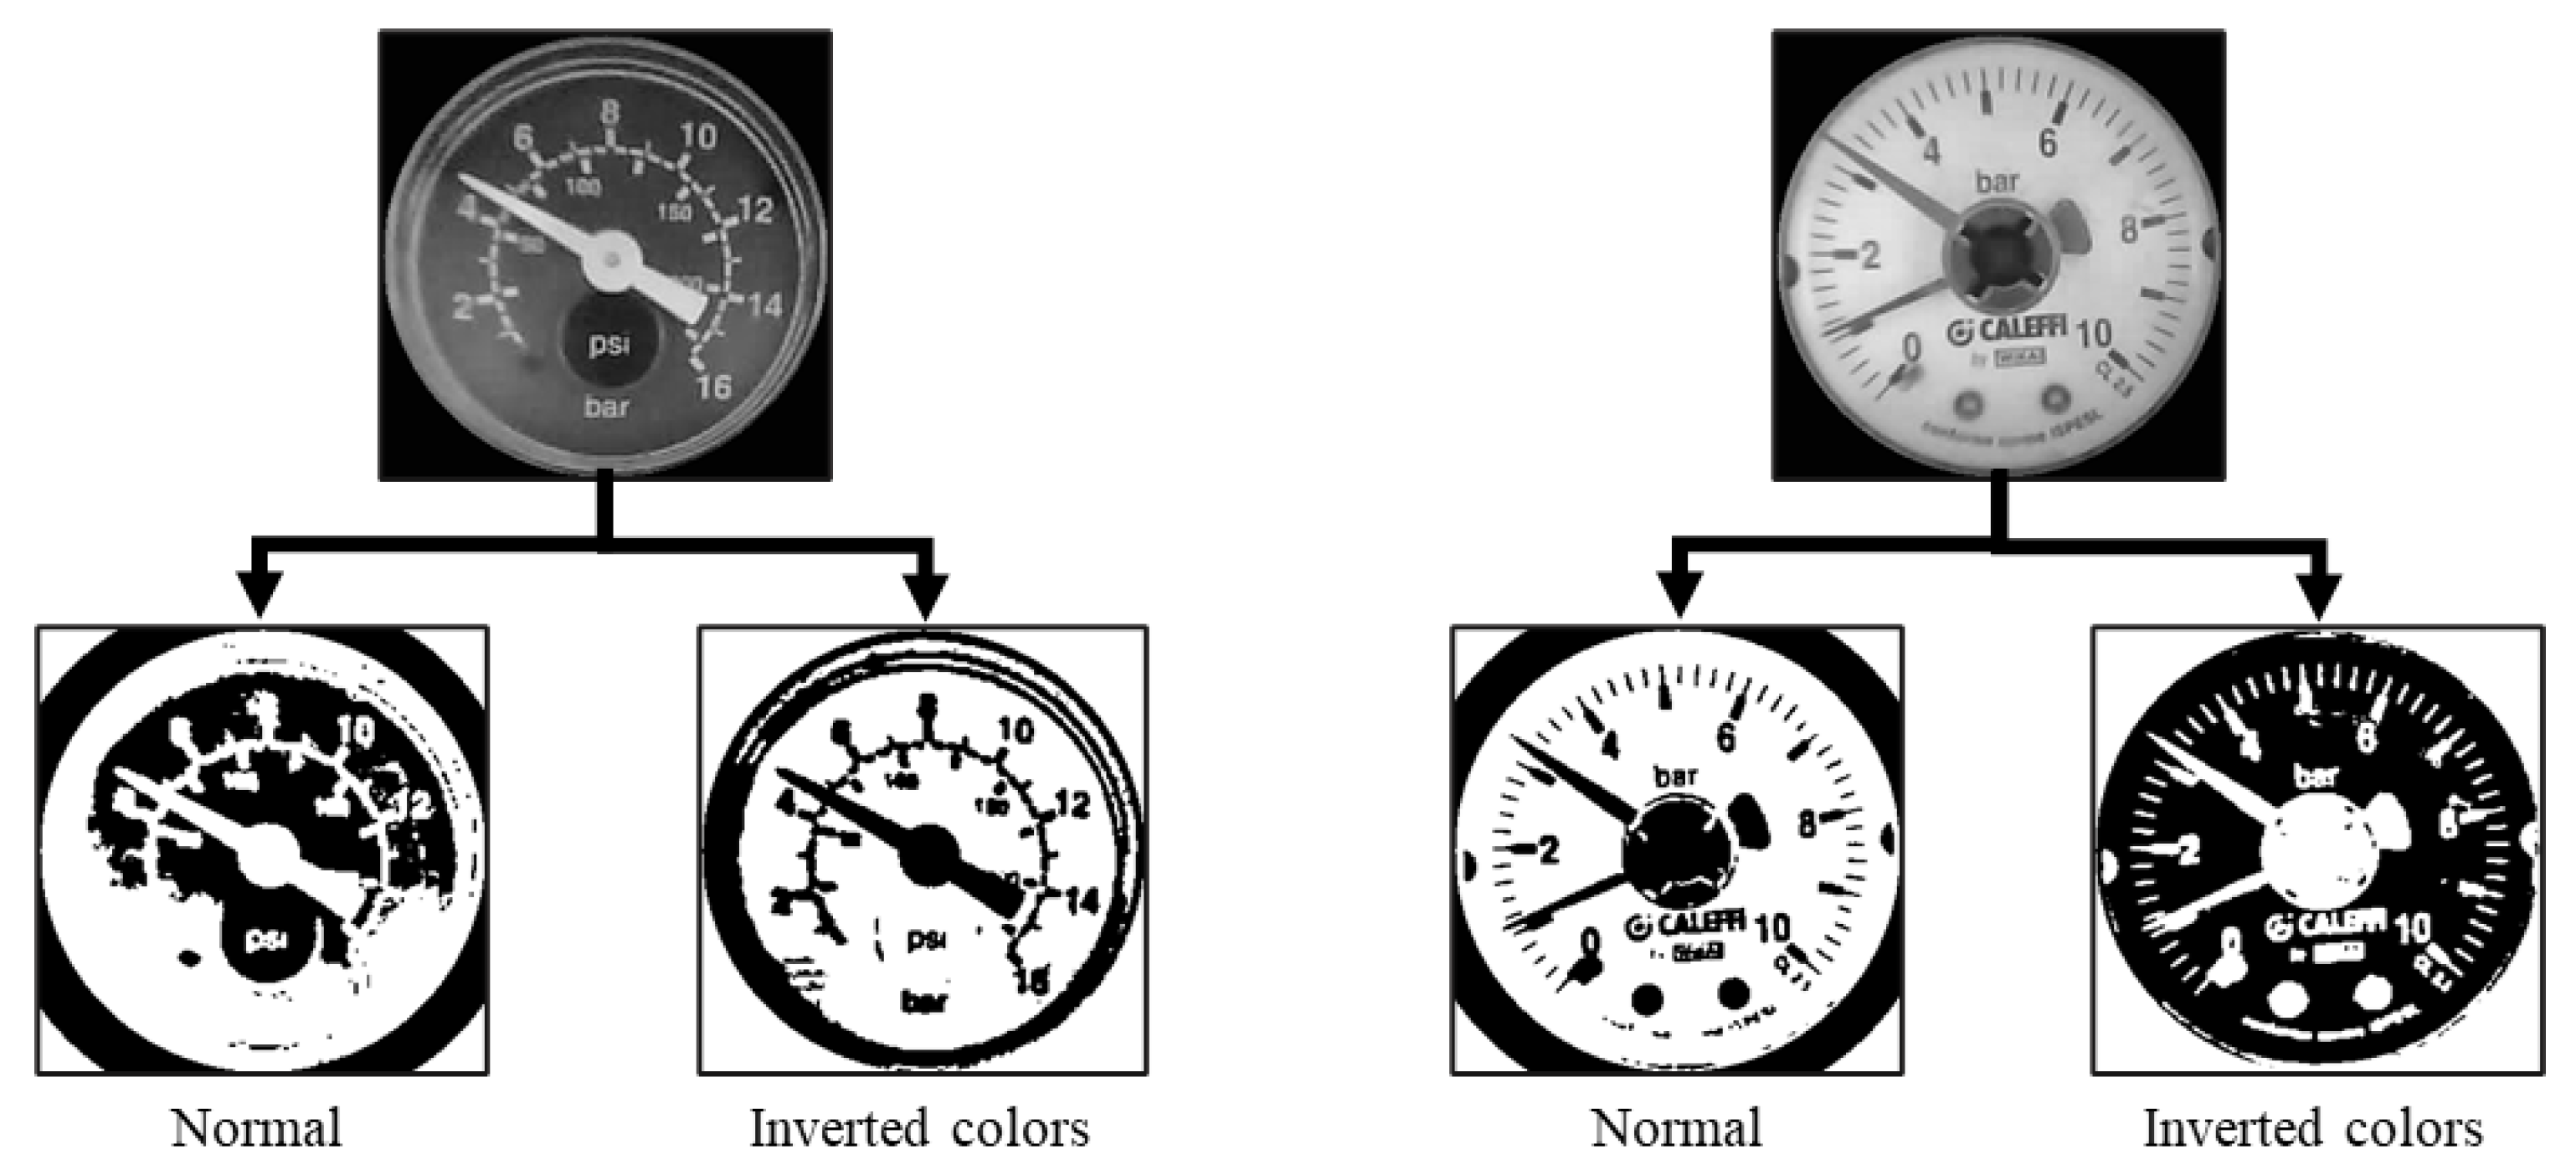
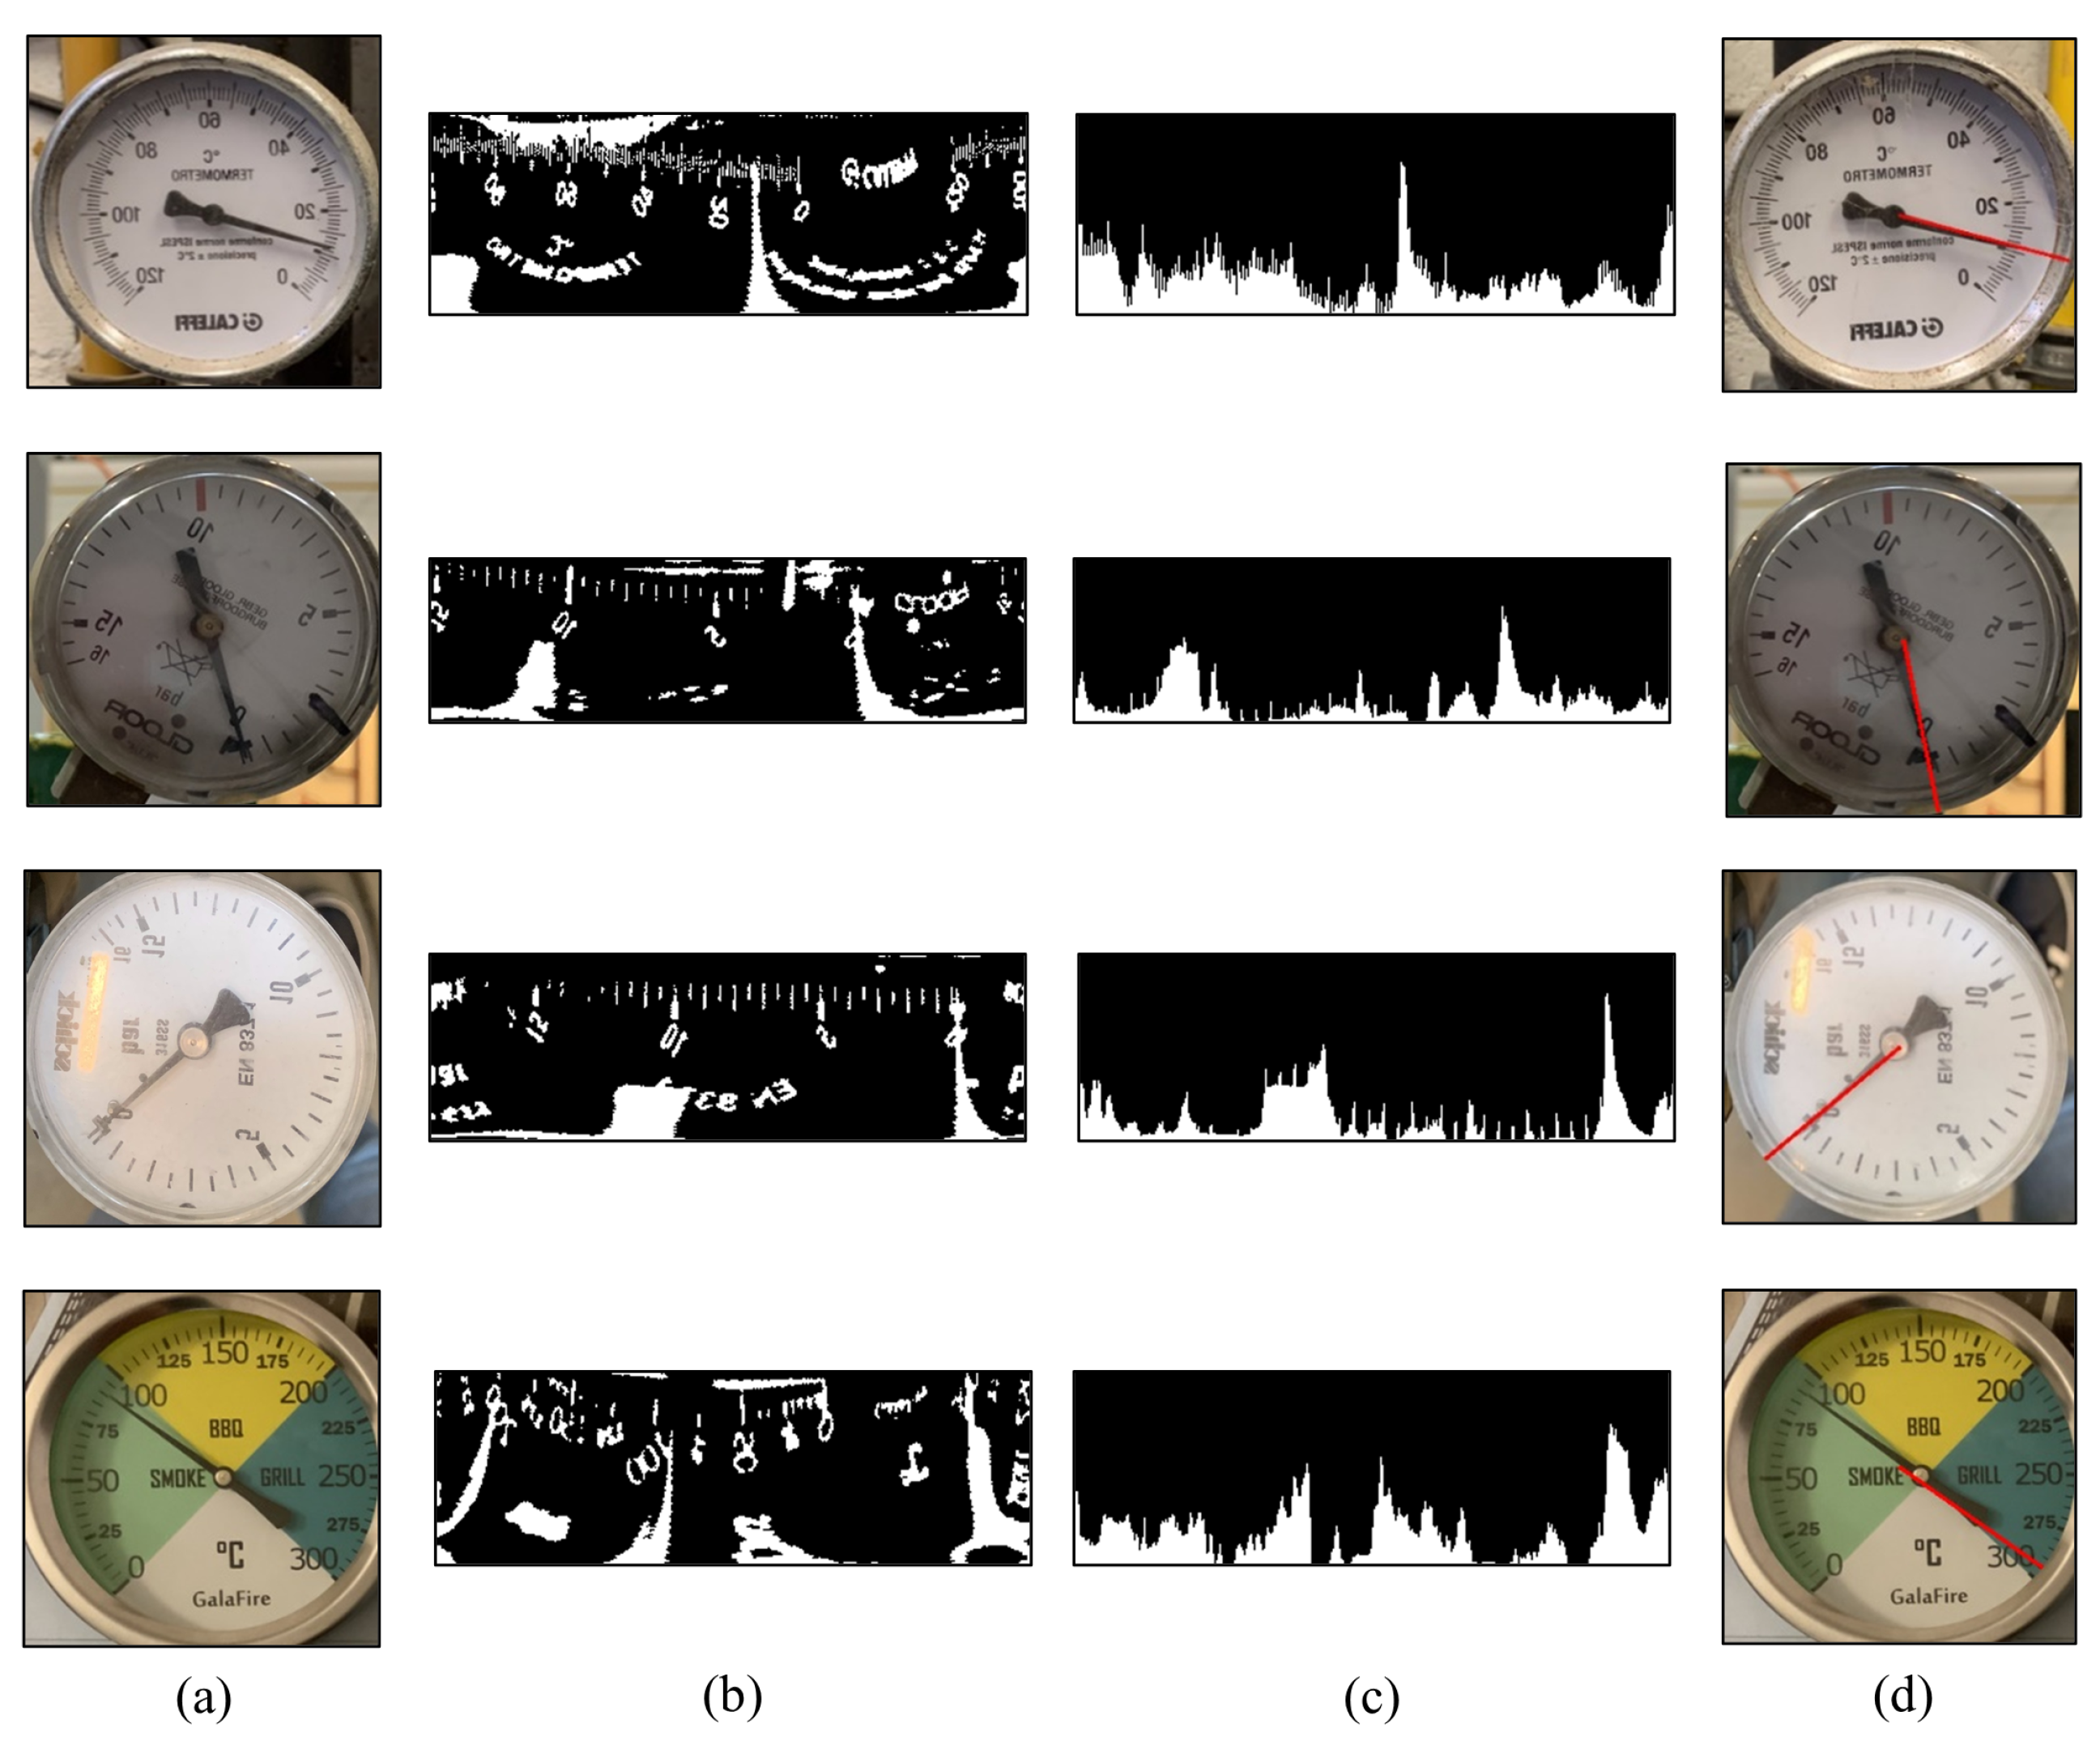
2.3. Image Uniformization
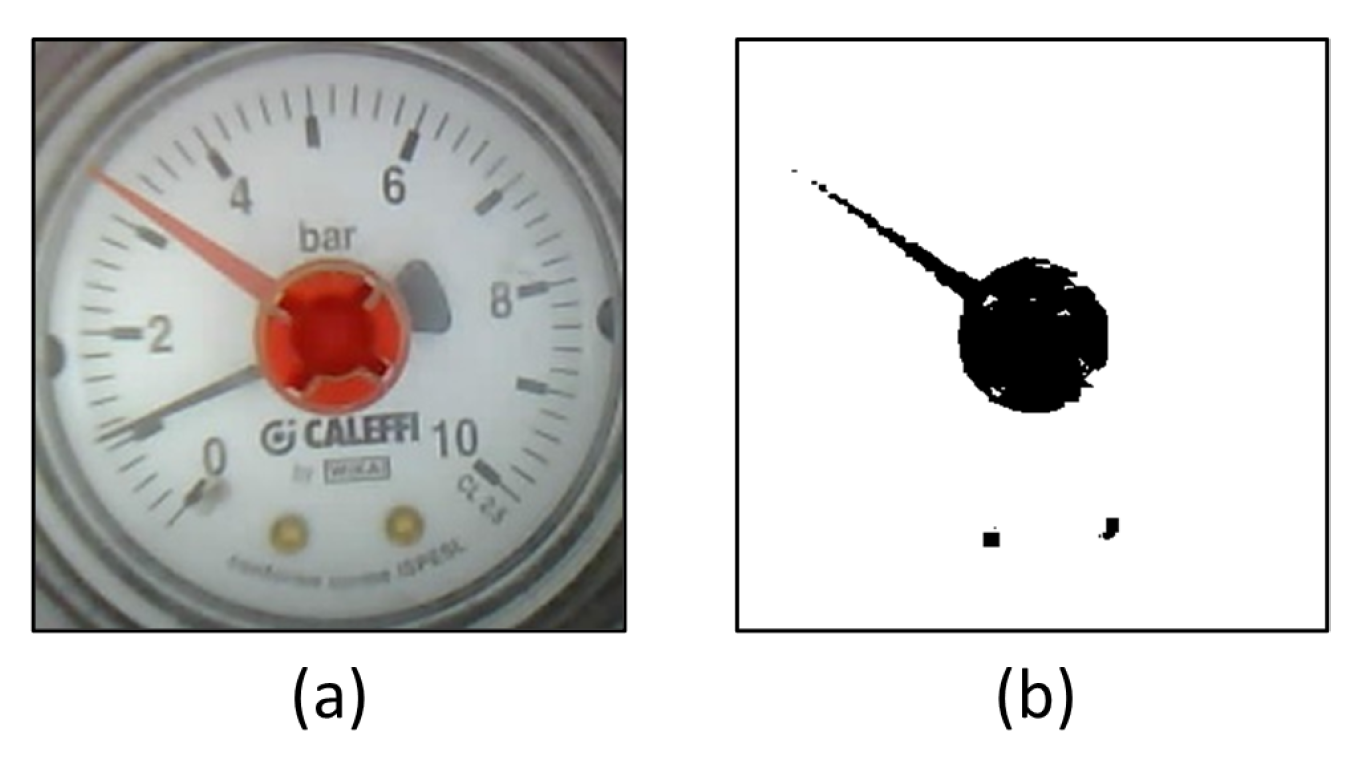
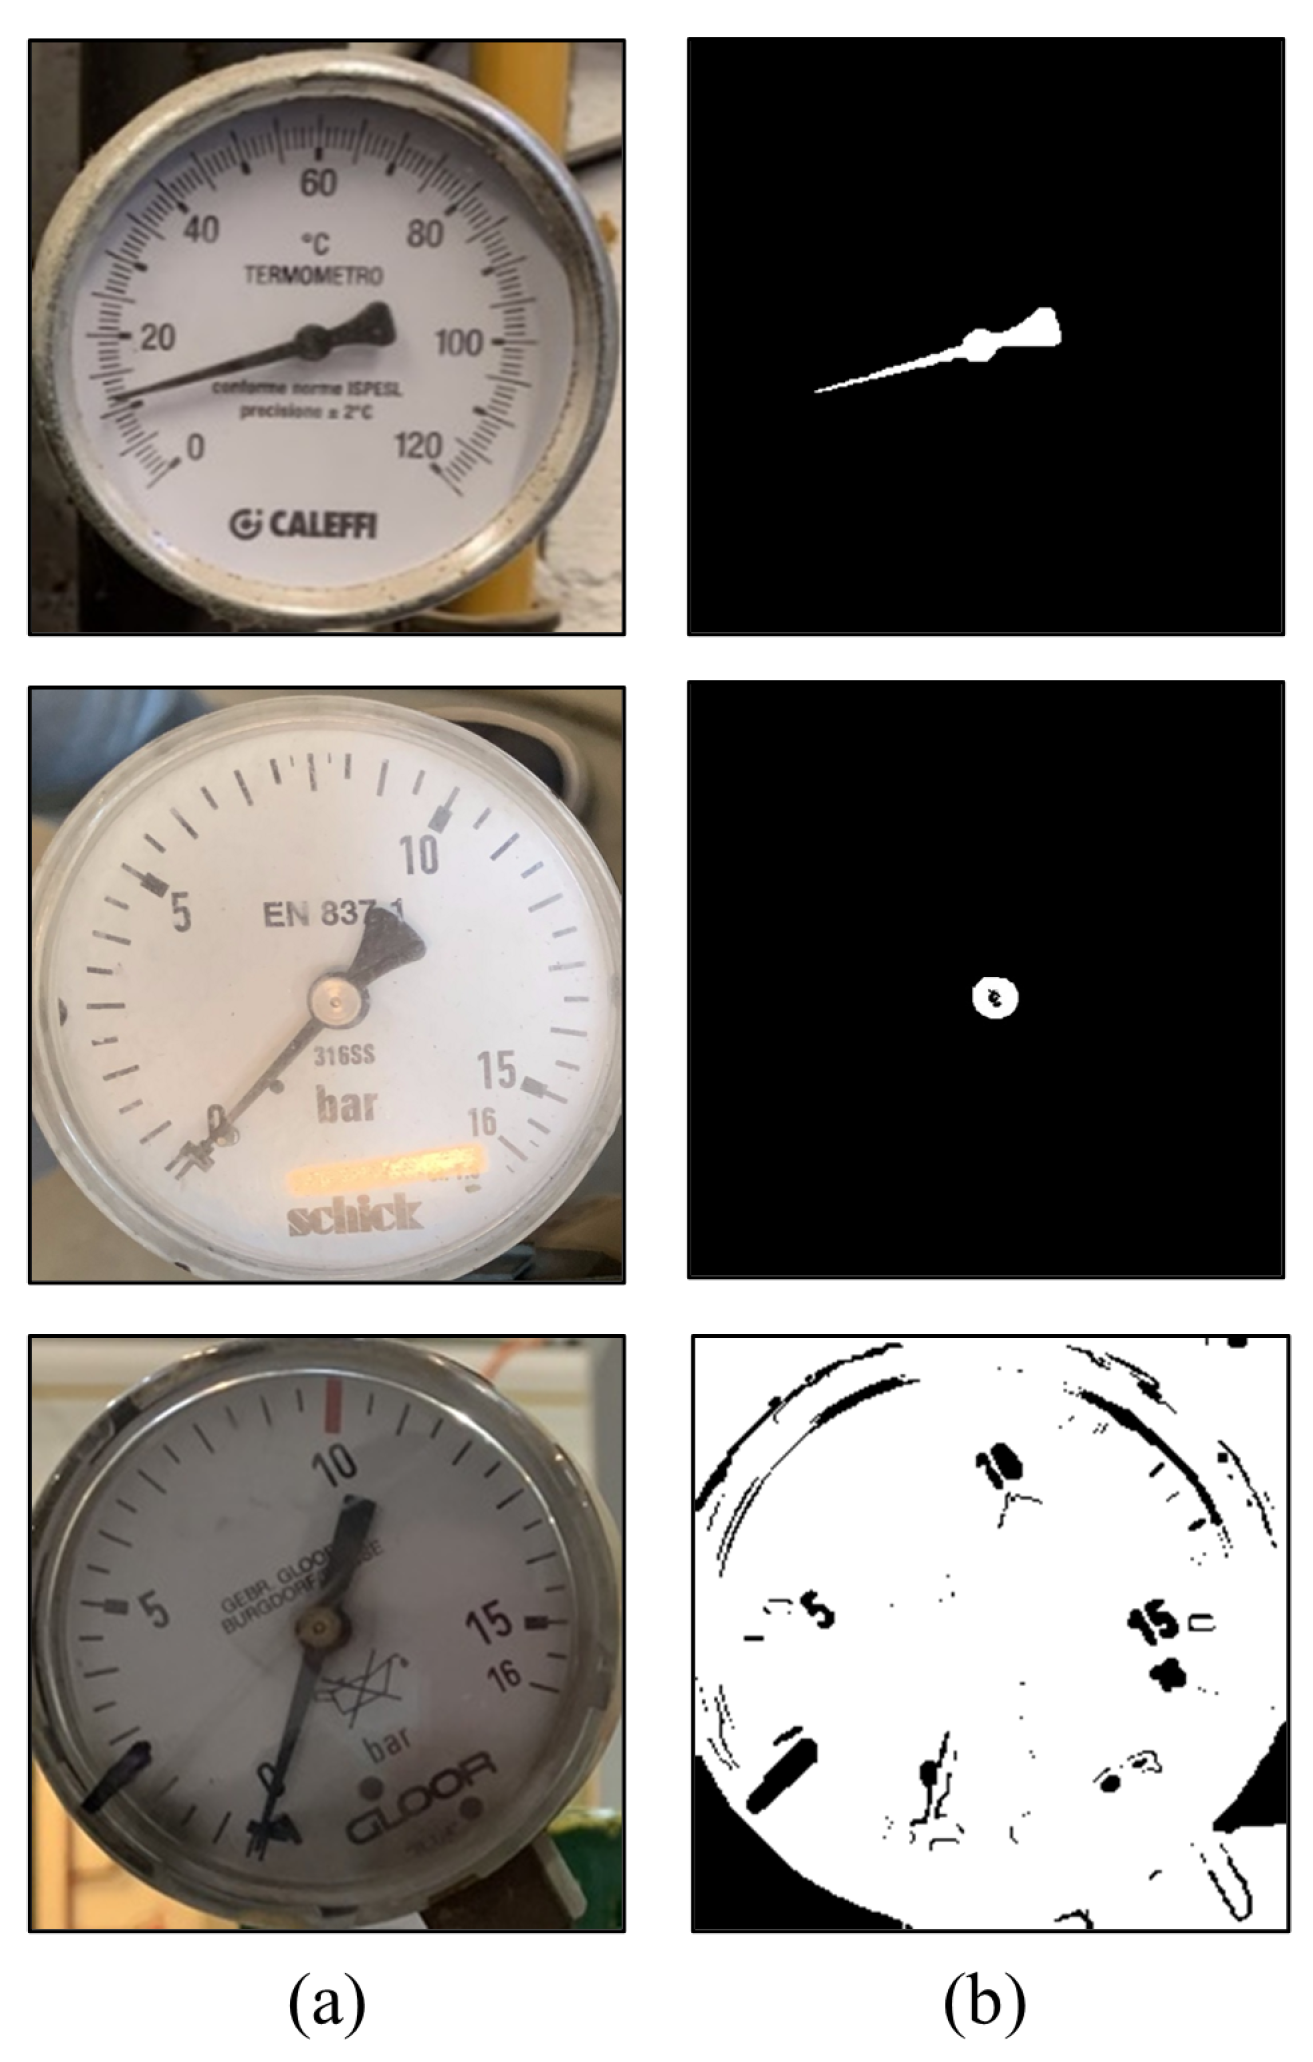
2.4. Pointer Detection
2.5. Determination of the Indicating Value of the Gauge
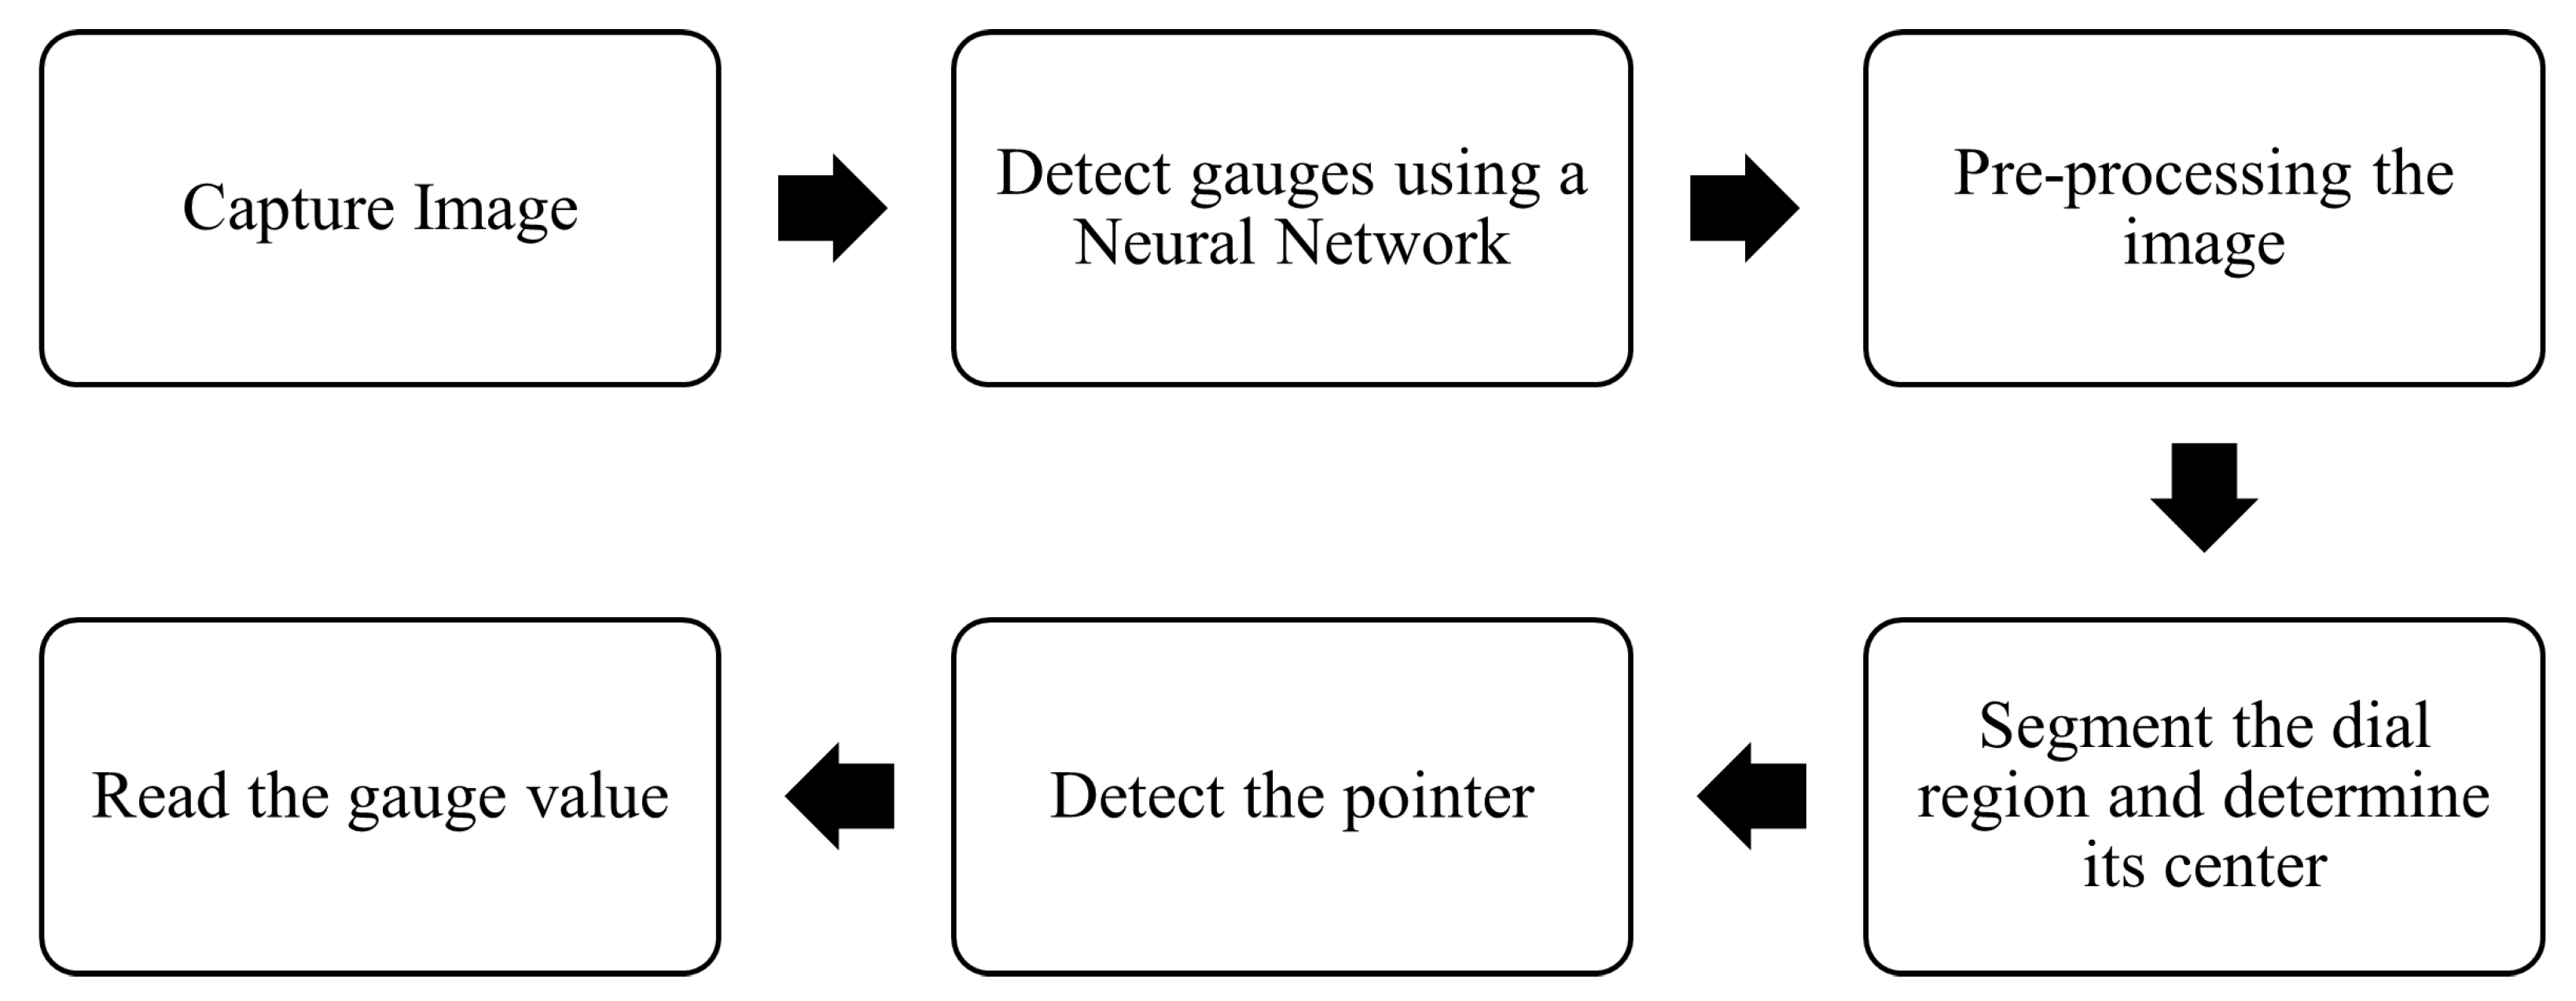
2.6. Proposed Final Solution
3. Experimental Tests and Results Analysis
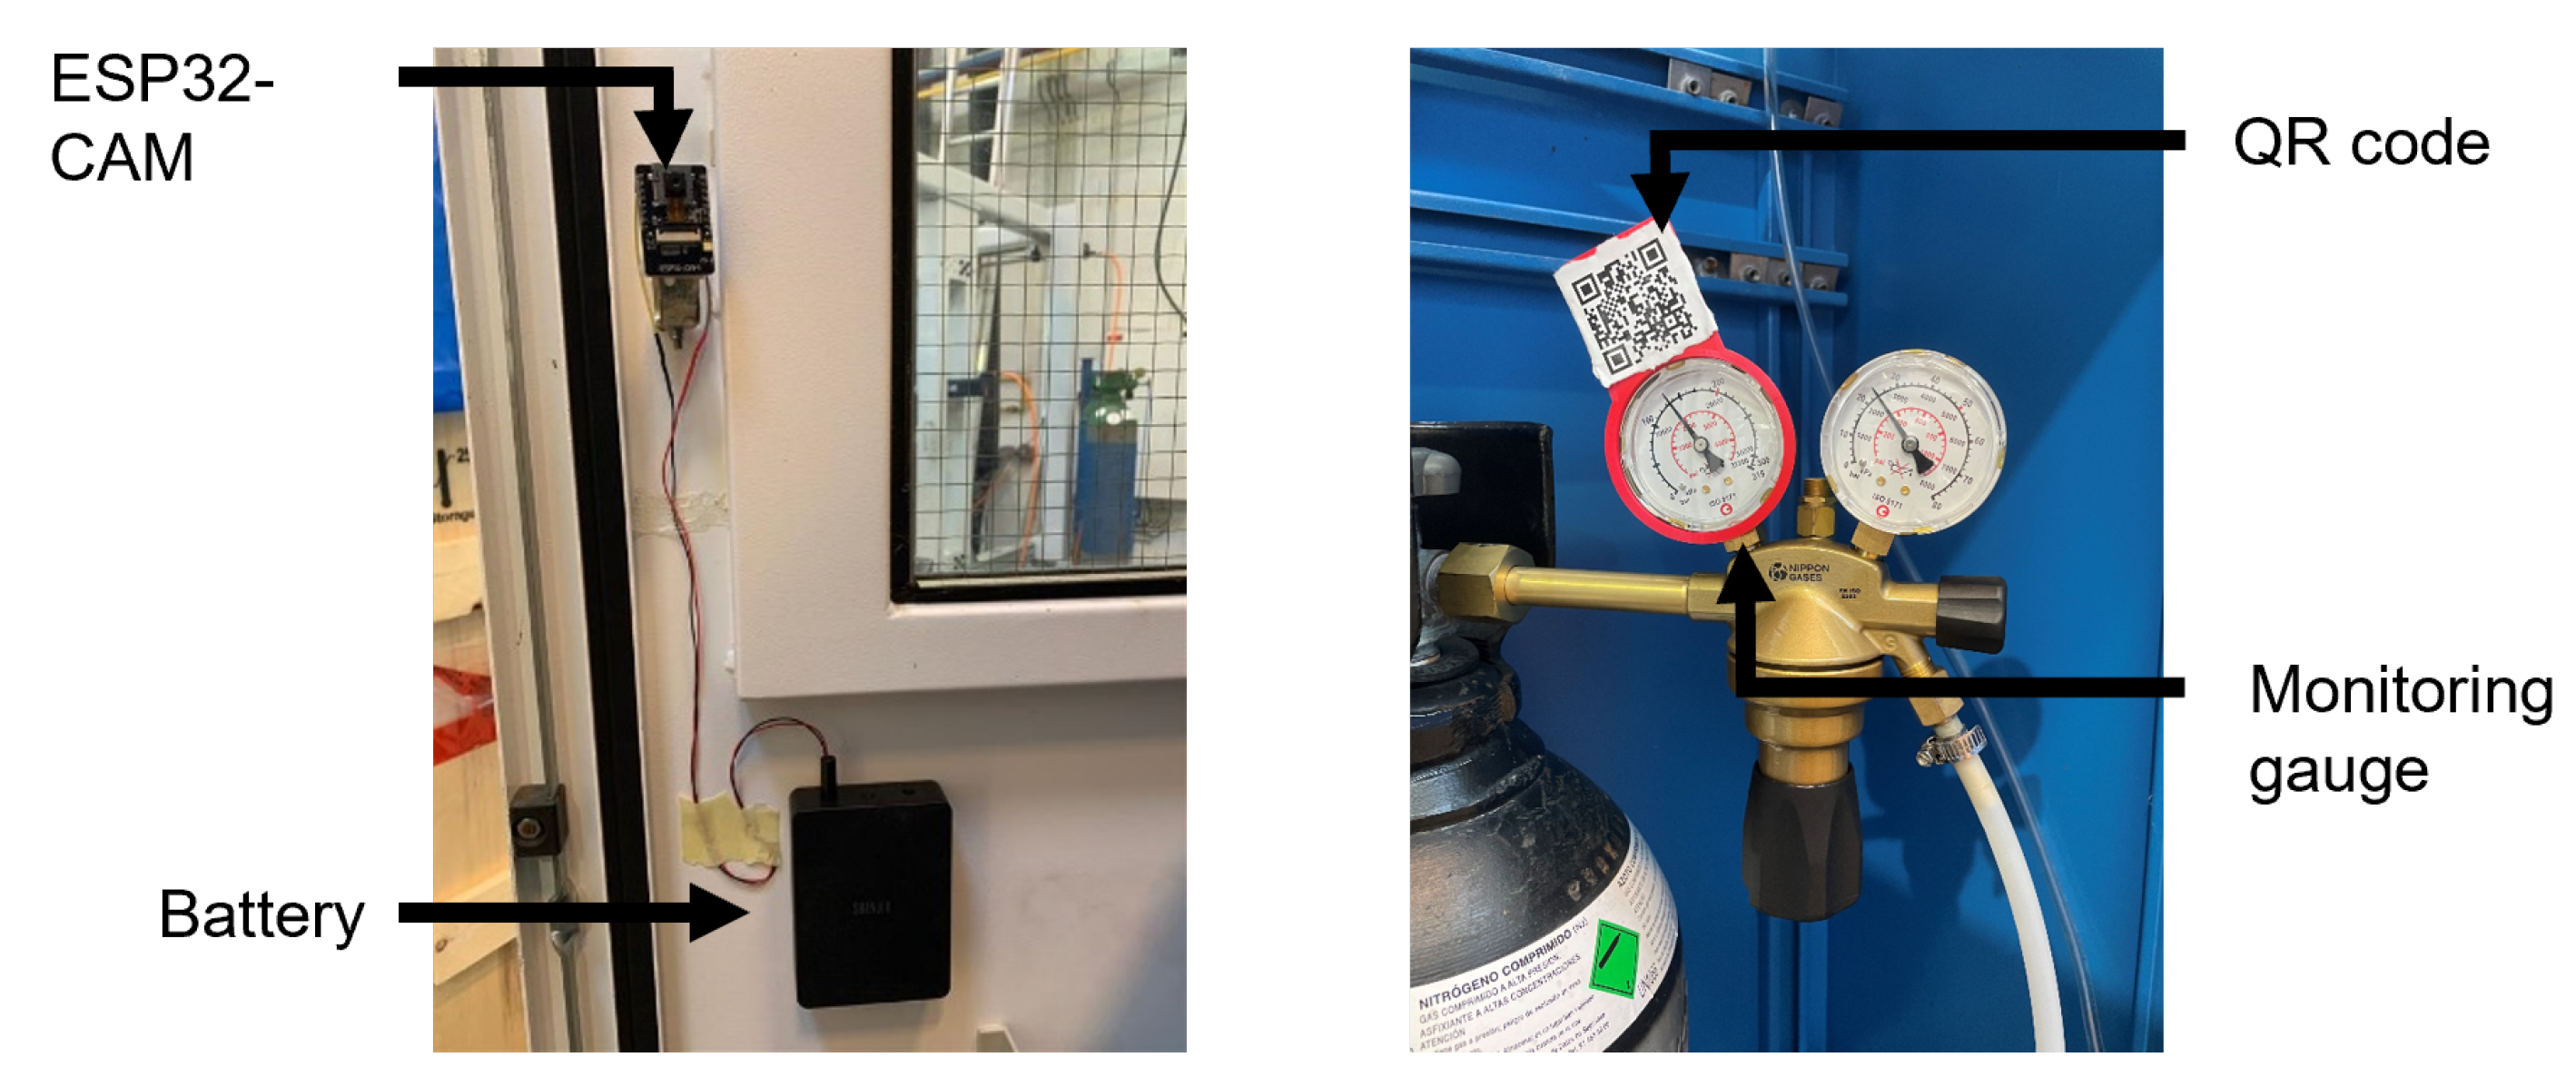
Implementation of an IoT Solution
4. Conclusions
Author Contributions
Funding
Institutional Review Board Statement
Informed Consent Statement
Data Availability Statement
Acknowledgments
Conflicts of Interest
Appendix A

References
- Atieno, N. How Intelligent Automation Is Powering Machine Vision, 2021. Available online: https://www.section.io/engineering-education/how-intelligent-automation-is-powering-machine-vision (accessed on 25 June 2022).
- Wang, L.; Wang, P.; Wu, L.; Xu, L.; Huang, P.; Kang, Z. Computer vision based automatic recognition of pointer instruments: Data set optimization and reading. Entropy 2021, 23, 272. [Google Scholar] [CrossRef] [PubMed]
- Gellaboina, M.K.; Swaminathan, G.; Venkoparao, V. Analog dial gauge reader for handheld devices. In Proceedings of the 2013 IEEE 8th Conference on Industrial Electronics and Applications (ICIEA), Melbourne, VIC, Australia, 19–21 June 2013; pp. 1147–1150. [Google Scholar] [CrossRef]
- Chi, J.; Liu, L.; Liu, J.; Jiang, Z.; Zhang, G. Machine Vision Based Automatic Detection Method of Indicating Values of a Pointer Gauge. Math. Probl. Eng. 2015, 2015, 283629. [Google Scholar] [CrossRef] [Green Version]
- Zhuo, H.B.; Bai, F.Z.; Xu, Y.X. Machine vision detection of pointer features in images of analog meter displays. Metrol. Meas. Syst. 2020, 27, 589–599. [Google Scholar] [CrossRef]
- Li, B.; Yang, J.; Zeng, X.; Yue, H.; Xiang, W. Automatic Gauge Detection via Geometric Fitting for Safety Inspection. IEEE Access 2019, 7, 87042–87048. [Google Scholar] [CrossRef]
- Zheng, C.; Wang, S.; Zhang, Y.; Zhang, P.; Zhao, Y. A robust and automatic recognition system of analog instruments in power system by using computer vision. Measurement 2016, 92, 413–420. [Google Scholar] [CrossRef]
- Lee, D.; Kim, S.; Han, Y.; Lee, S.; Jeon, S.; Seo, D. Automatic Reading Analog gauge with Handheld device. In Proceedings of the 2020 IEEE International Conference on Consumer Electronics (ICCE), Las Vegas, NV, USA, 4–6 January 2020; pp. 1–3. [Google Scholar] [CrossRef]
- Feng, H.P.; Jun, Z. Application research of computer vision in the auto-calibration of dial gauges. In Proceedings of the 2008 International Conference on Computer Science and Software Engineering, Wuhan, China, 12–14 December 2008; Volume 2, pp. 845–848. [Google Scholar] [CrossRef]
- Lauridsen, J.; Grassmé, J.; Pedersen, M.; Jensen, D.; Andersen, S.; Moeslund, T. Reading Circular Analogue Gauges using Digital Image Processing. In Proceedings of the 14th International Joint Conference on Computer Vision, Imaging and Computer Graphics Theory and Applications (Visigrapp 2019), Prague, Czech Republic, 25–27 February 2019; Volume 4, pp. 373–382. [Google Scholar] [CrossRef]
- Wang, Q.; Fang, Y.; Wang, W.; Wu, M.; Wang, R.; Fang, Y. Research on automatic reading recognition of index instruments based on computer vision. In Proceedings of the 2013 3rd International Conference on Computer Science and Network Technology, Dalian, China, 12–13 October 2013; pp. 10–13. [Google Scholar] [CrossRef]
- Alegria, F.C.; Serra, A.C. Automatic calibration of analog and digital measuring instruments using computer vision. IEEE Trans. Instrum. Meas. 2000, 49, 94–99. [Google Scholar] [CrossRef]
- Li, D.; Li, W.; Yu, X.; Gao, Q.; Song, Y. Automatic Reading Algorithm of Substation Dial Gauges Based on Coordinate Positioning. Appl. Sci. 2021, 11, 6059. [Google Scholar] [CrossRef]
- Liu, J.; Liu, Y.; Yu, L. Novel method of Automatic Recognition for Analog Measuring Instruments. In Proceedings of the 2015 6th International Conference on Manufacturing Science and Engineering, Guangzhou, China, 28–29 November 2015. [Google Scholar] [CrossRef] [Green Version]
- Yi, M.; Yang, Z.; Guo, F.; Liu, J. A clustering-based algorithm for automatic detection of automobile dashboard. In Proceedings of the IECON 2017—43rd Annual Conference of the IEEE Industrial Electronics Society, Beijing, China, 29 October–1 November 2017; pp. 3259–3264. [Google Scholar] [CrossRef]
- Liu, Y.; Liu, J.; Ke, Y. A detection and recognition system of pointer meters in substations based on computer vision. Measurement 2020, 152, 107333. [Google Scholar] [CrossRef]
- Cai, W.; Ma, B.; Zhang, L.; Han, Y. A pointer meter recognition method based on virtual sample generation technology. Measurement 2020, 163, 107962. [Google Scholar] [CrossRef]
- Zuo, L.; He, P.; Zhang, C.; Zhang, Z. A robust approach to reading recognition of pointer meters based on improved mask-RCNN. Neurocomputing 2020, 388, 90–101. [Google Scholar] [CrossRef]
- Yu, H.; Chen, C.; Du, X.; Li, Y.; Rashwan, A.; Hou, L.; Jin, P.; Yang, F.; Liu, F.; Kim, J.; et al. TensorFlow Model Garden, 2020. Available online: https://github.com/tensorflow/models (accessed on 25 June 2022).
- Read Analogue Gauges with Computer Vision on AWS, 2020. Available online: https://aws-computer-vision.jacobcantwell.com (accessed on 25 June 2022).
- Howells, B.; Charles, J.; Cipolla, R. Real-time analogue gauge transcription on mobile phone. In Proceedings of the IEEE/CVF Conference on Computer Vision and Pattern Recognition, Virtual, 19–25 June 2021; pp. 2369–2377. [Google Scholar] [CrossRef]
- Shorten, C.; Khoshgoftaar, T.M. A survey on Image Data Augmentation for Deep Learning. J. Big Data 2019, 6, 60. [Google Scholar] [CrossRef]
- Pressure Gauges. BS EN 837-1. 1998. Available online: http://bqw.csstgc.com.cn/userfiles/2c9b92cd31ce403ca56b87348189cf0f/files/teckSolution/2019/09/BS%20EN%20837-1%20Pressure%20Gauges.pdf (accessed on 25 June 2022).


| Source | Nr. of Images | Types of Gauges |
|---|---|---|
| INEGI | 118 | 21 |
| AWS [20] | 37 | 1 |
| Jjcvision [21] | 49 | 3 |
| Total | 204 | 25 |
| Shooting Environment | Average Relative Error (%) |
|---|---|
| Ideal conditions | 0.67 |
| Bad lighting conditions | 1.28 |
| Different shooting angles | 1.23 |
| All images | 0.95 |
| Methods | Average Relative Error (%) |
|---|---|
| Zheng et al. (2016) [7] | 0.95 |
| Wang et al. (2019) [2] | 1.35 |
| Zuo et al. (2020) [18] | 0.17 |
| Proposed solution | 0.95 |
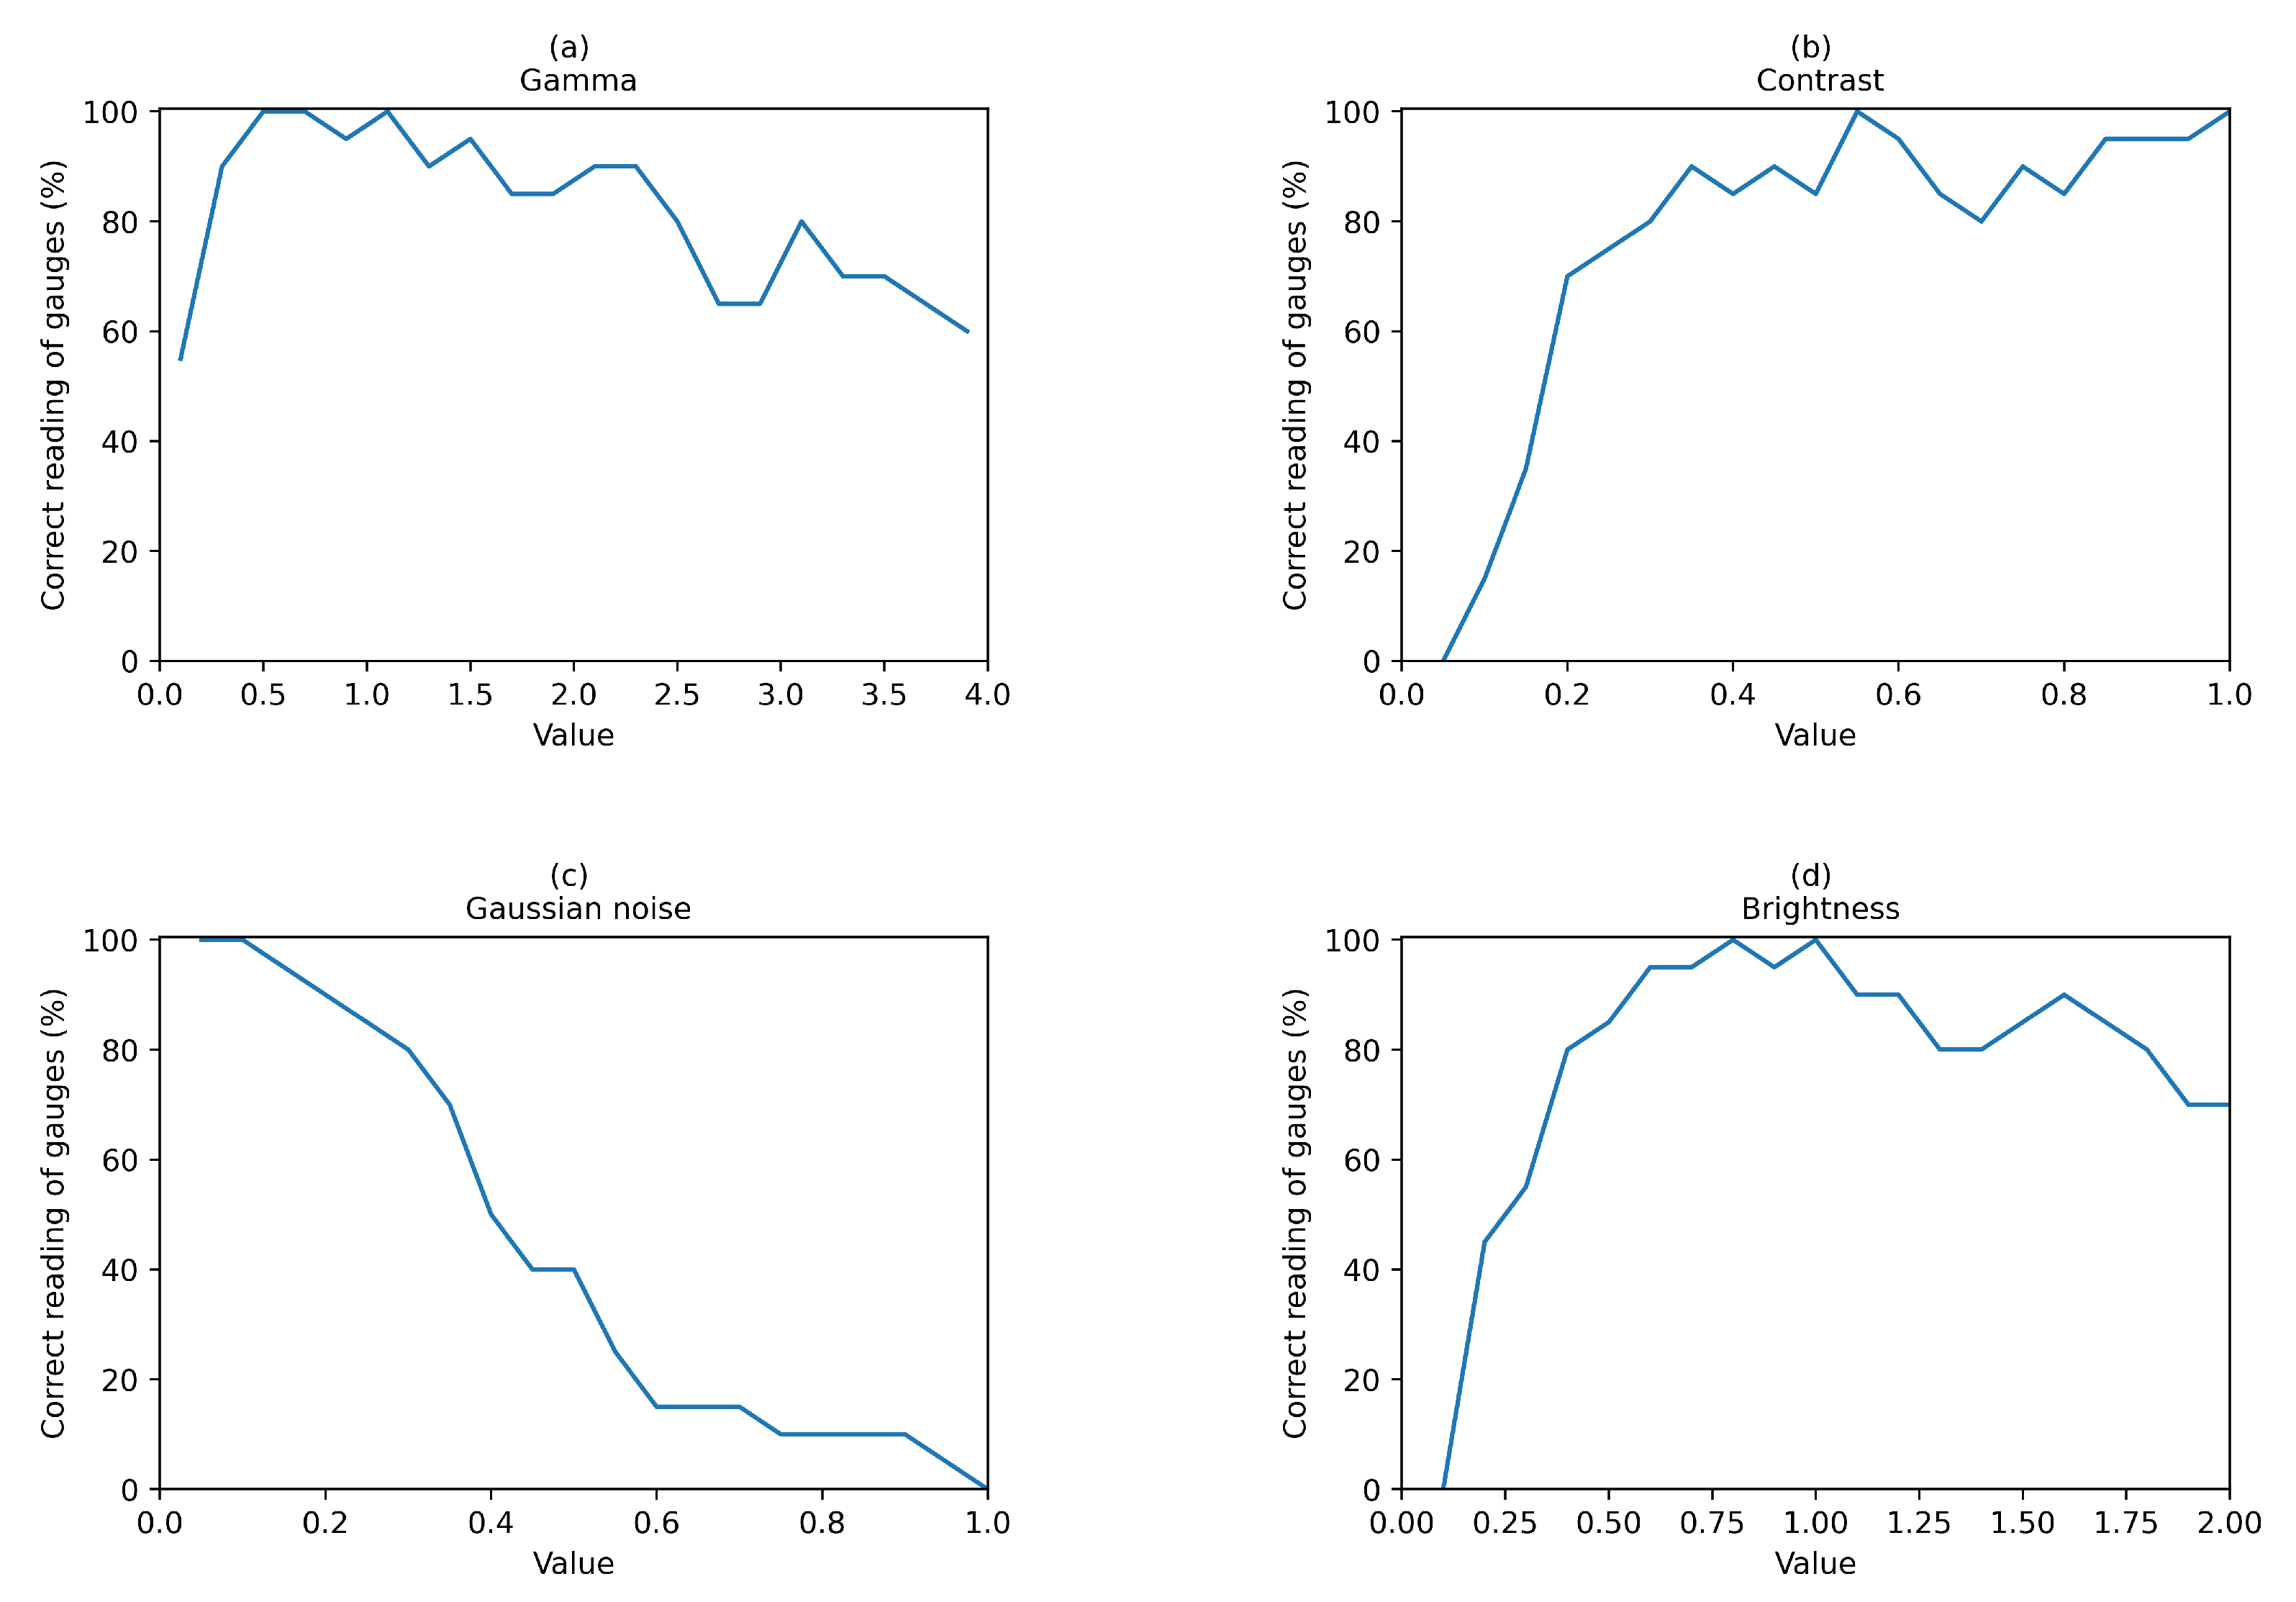
| Gamma (%) | Contrast (%) | Gaussian Noise (%) | Brightness (%) |
|---|---|---|---|
| 81.5 | 77.3 | 43.3 | 78.5 |
Publisher’s Note: MDPI stays neutral with regard to jurisdictional claims in published maps and institutional affiliations. |
© 2022 by the authors. Licensee MDPI, Basel, Switzerland. This article is an open access article distributed under the terms and conditions of the Creative Commons Attribution (CC BY) license (https://creativecommons.org/licenses/by/4.0/).
Share and Cite
Peixoto, J.; Sousa, J.; Carvalho, R.; Santos, G.; Mendes, J.; Cardoso, R.; Reis, A. Development of an Analog Gauge Reading Solution Based on Computer Vision and Deep Learning for an IoT Application. Telecom 2022, 3, 564-580. https://doi.org/10.3390/telecom3040032
Peixoto J, Sousa J, Carvalho R, Santos G, Mendes J, Cardoso R, Reis A. Development of an Analog Gauge Reading Solution Based on Computer Vision and Deep Learning for an IoT Application. Telecom. 2022; 3(4):564-580. https://doi.org/10.3390/telecom3040032
Chicago/Turabian StylePeixoto, João, João Sousa, Ricardo Carvalho, Gonçalo Santos, Joaquim Mendes, Ricardo Cardoso, and Ana Reis. 2022. "Development of an Analog Gauge Reading Solution Based on Computer Vision and Deep Learning for an IoT Application" Telecom 3, no. 4: 564-580. https://doi.org/10.3390/telecom3040032
APA StylePeixoto, J., Sousa, J., Carvalho, R., Santos, G., Mendes, J., Cardoso, R., & Reis, A. (2022). Development of an Analog Gauge Reading Solution Based on Computer Vision and Deep Learning for an IoT Application. Telecom, 3(4), 564-580. https://doi.org/10.3390/telecom3040032