Article

Engine Response and Emission Optimization of Ceramic-Oxide-Doped Diesel Blends with Reclaimed Waste Energy

1
Department of Mechanical Engineering, RGM College of Engineering and Technology, Nandyal 518501, India
2
Department of Civil Engineering, Madan Mohan Malaviya University of Technology, Gorakhpur 273010, India
3
Department of Mechanical Engineering, Maulana Azad National Institute of Technology, Bhopal 462003, India
*
Authors to whom correspondence should be addressed.
Fuels 2025, 6(3), 70; https://doi.org/10.3390/fuels6030070
Submission received: 8 August 2025 / Revised: 1 September 2025 / Accepted: 15 September 2025 / Published: 19 September 2025

Abstract

Without changing any of its constituents, tyre pyrolysis oil energy (TPOE) has frequently been subjected to Diesel-RK (D-RK) analyses in diesel engines in an effort to serve as a substitute for diesel fuel. Environmentally beneficial TPOE features, such as biodegradability, renewability, and ease and safety of handling, are highly sought after. In addition to its beneficial aspects, TOPE also has drawbacks. The BTE and SFC of performance metrics, as well as the smoke and NOx of emission parameters of alternative fuel, do not meet the emission limits specified by regulatory authorities. Nano-additions have been shown to be effective for boosting fuel quality for improved performance and production characteristics. In this study, TPOE–diesel blends are blended with ceramic oxide (CeO2 of 50 and 100 ppm) nanoparticles and subjected to a performance and production investigation of engine working physiognomies in diesel engines. For the blend TPOE10CDF80 + D, the numerical results show a positive outcome of a 1.0% rise in BTE, a 2.0% decrease in SFC, a 17.7% decrease in smoke emission, and an 18.2% increase in NOx emission as compared to diesel fuel (CDF).

1. Introduction

Internal combustion engine emissions that are harmful are a problem worldwide. Therefore, in addition to traditional exhaust gas treatment technologies like diesel particle filters and catalytic converters, scientists and engineers are searching for alternate production control mechanisms. Utilizing nano-additives is a common alternative method now in use to meet the rising need for energy [1]. Yasar et al. [2] examined the effects of copper nitrate, titanium dioxide, and cerium acetate hydrate on diesel fuel to reduce exhaust gas discharges from diesel engines. It was determined that diesel emissions of NOx are significantly reduced by the addition of cerium acetate hydrate, titanium dioxide, and copper nitrate. The outcome of coconut shell nanoparticles on diesel engine features through various blends was established by Vinukumar et al. [3]. It is significant to note that the CO, CO2, and NOx discharges are decreased when coconut shell nanoparticles are added to diesel-alternative fuel blends. Ghanbari et al. [4] suggested adding cerium oxide nanoparticles (80 ppm) to blended gasoline to improve performance and reduce discharge (HC and CO). Ardebili et al. [5] evaluated the effects of sugarcane nano-biochar particles (25, 50, 75, 100, and 125 ppm) with fuel oil–diesel blends on a diesel engine. According to their research, adding fuel oil reduced NOX and UHC discharges while raising CO discharges.
Gharehghani and Pourrahmani [6] investigated the influence of adding carbon nanotubes (120, 80, and 40 ppm) as nano-additives to diesel–alternative blends, as well as the physiognomies of diesel engines. According to their findings, the blending of diesel and alternatives with nanoparticles improved engine performance by 2.0% and decreased fuel ingestion by 7.08%. The addition of nanoparticles causes a rise in CO2 and NOx discharges and a reduction in HC and CO discharges when associated with diesel and alternative blends. Khalife et al. [7] examined how diesel–alternative aqueous additives affected diesel engine performance. The results showed an increase in BTE and a significant decrease in CO, HC, and NOx emissions when the blends were considered. Perumal and Ilangkumaran conducted studies on the usage of pongamia as an alternative to copper oxide in diesel engines [8]. It was discovered that the B20CuO100 mix had a 4.01% gain in thermal efficiency, a 1.0% decrease in fuel consumption, a 9.8% decrease in NOX discharges, and a 12.8% decrease in smoke discharges. Örs et al. [9] evaluated the effects of adding a titanium dioxide nano-additive to diesel, used cooking oil, and n-butanol alternative fuel mixes. According to their findings, blending diesel and alternatives increased engine power, brake torque, and NOx discharges while lowering fuel consumption, HC, and CO discharges.
Ettefaghi et al. [10] looked into how adding carbon quantum dots, an alternative–water–diesel–biodegradable nano-additive, affected engines. The outcomes demonstrated that the addition of the titanium dioxide nano-additive reduced engine power, brake torque, and fuel consumption. In comparison to B15 pure fuel (85% diesel fuel + 15% alternative), the HC and NOx discharges were reduced for the titanium dioxide nano-additive (5% water + B15 fuel containing + 60 ppm carbon quantum dots). Hasannuddin et al. [11] examined the possessions of adding various nano-additives including water to diesel, including zinc oxide, copper oxide, aluminium oxide, magnesium oxide, and manganese oxide. The outcomes demonstrated that the sample with 10% water and aluminium oxide led to lower fuel consumption and better engine performance. Nano-additives reduced NOx and CO outputs. Dhanasekar et al. [12] used CeO2 and CeO2: Gd nanoparticles in diesel and pongamia oil alternative mixes to improve compression ignition engine performance. CeO2 and CeO2: Gd reduced CO output and smoke opacity in diesel and pongamia oil alternatives. Kumaravel et al. [13] added cerium oxide to a diesel–tyre oil alternative as a nano-additive with the aim of enhancing the oil characteristics of the diesel–tyre mixes. The outcomes demonstrated that CeO2 greatly decreases smoke emission and improves thermal efficiency in a diesel–tyre oil alternative blend. Table 1 displays the results of an earlier investigation on alternative mixtures with nanoparticles and diesel.
Research on the combustion, performance, and emission characteristics of a single-cylinder diesel engine powered by tyre-derived oil, diesel blends, and CeO2 nanoparticles is still scarce, despite the recent explosion in interest in alternative fuels. The majority of the current research focuses on traditional biodiesel or fuels made from trash, but little is known about the combined effects of tyre oil and nanomaterials on pollutant reduction, heat release properties, and ignition delay. Moreover, despite its critical function determining thermal efficiency and emissions, the impact of loads on these blends has not been thoroughly investigated. The optimization of such fuel blends for real-world diesel engine applications is limited by this gap.
Goals of the research: Through the combination of theoretical simulation and real-world experimentation, the current work aims to fill the aforementioned research gap:
  • To examine the performance and combustion properties of a single-cylinder diesel engine running on blends of tyre oil, diesel, and CeO2 under various load scenarios.
  • To forecast cylinder pressure, the heat release rate, and emission behaviour by simulating an engine cycle with the Diesel-RK (D-RK) tool.
  • To assess how various loads affect pollution reduction, combustion stability, and efficiency and to validate the model and optimize performance by contrasting simulation and experimental data.
  • To determine the ideal blend composition and compression ratio in order to maximize efficiency and reduce hazardous emissions.

2. Material and Procedure

2.1. Material and Properties

Cerium oxide (CeO2) nanoparticles, diesel fuel, and tyre oil pyrolytic extract (TPOE) were used for the current study in order to create innovative alternative fuel mixes for diesel engine testing. Four tyre oil–diesel combinations, TPOE5D95, TPOE10D90, TPOE15D85, and TPOE20D80, were first created with replacement amounts of 5%, 10%, 15%, and 20% by volume. By adding CeO2 nanoparticles to particular blends, the fuel properties were further improved, resulting in the formulations TPOE5D90 + A, TPOE5D85 + B, TPOE10D85 + c, and TPOE10D80 + D. The CeO2 nanoparticles were obtained from a specialized manufacturer of metal oxide nanomaterials, as shown in Figure 1a [13], and the blending strategy was directed by techniques documented in earlier research, as shown in Figure 1b. Equation (1) can be used to calculate the surface tension of blends based on fuel density (constant C1 = 49.6 and C2 = 14.92) [14]. Table 2, Table 3 and Table 4 display the fuel characteristics and properties of the mixture.
σ = C 1 ρ C 2 × 10 3
Because of its remarkable oxygen storage and release capabilities, which result from the reversible redox transition between Ce4+ and Ce3+, cerium oxide (CeO2) is an essential catalytic component in the processing of diesel and pyrolysis oil. The breakdown of heavy hydrocarbons and the conversion of oxygenated chemicals found in pyrolysis oils are facilitated by the capacity of CeO2s to provide active oxygen for oxidation processes, even in oxygen-lean environments. Therefore, by encouraging full combustion and lowering the creation of unwanted byproducts like soot and coke, CeO2 makes it easier to produce cleaner fuels. CeO2 also works very well in deoxygenation reactions, assisting in the removal of oxygenates from pyrolysis oil, which enhances the stability and calibre of the fuel that it produces. CeO2 improves dispersion, redox activity, and resistance to deactivation when combined with other catalysts to improve overall catalytic performance. Because of these characteristics, CeO2 is an essential catalyst for improving pyrolysis and diesel oil, which enhances fuel quality and lowers emissions into the atmosphere.

2.2. Experimental Setup

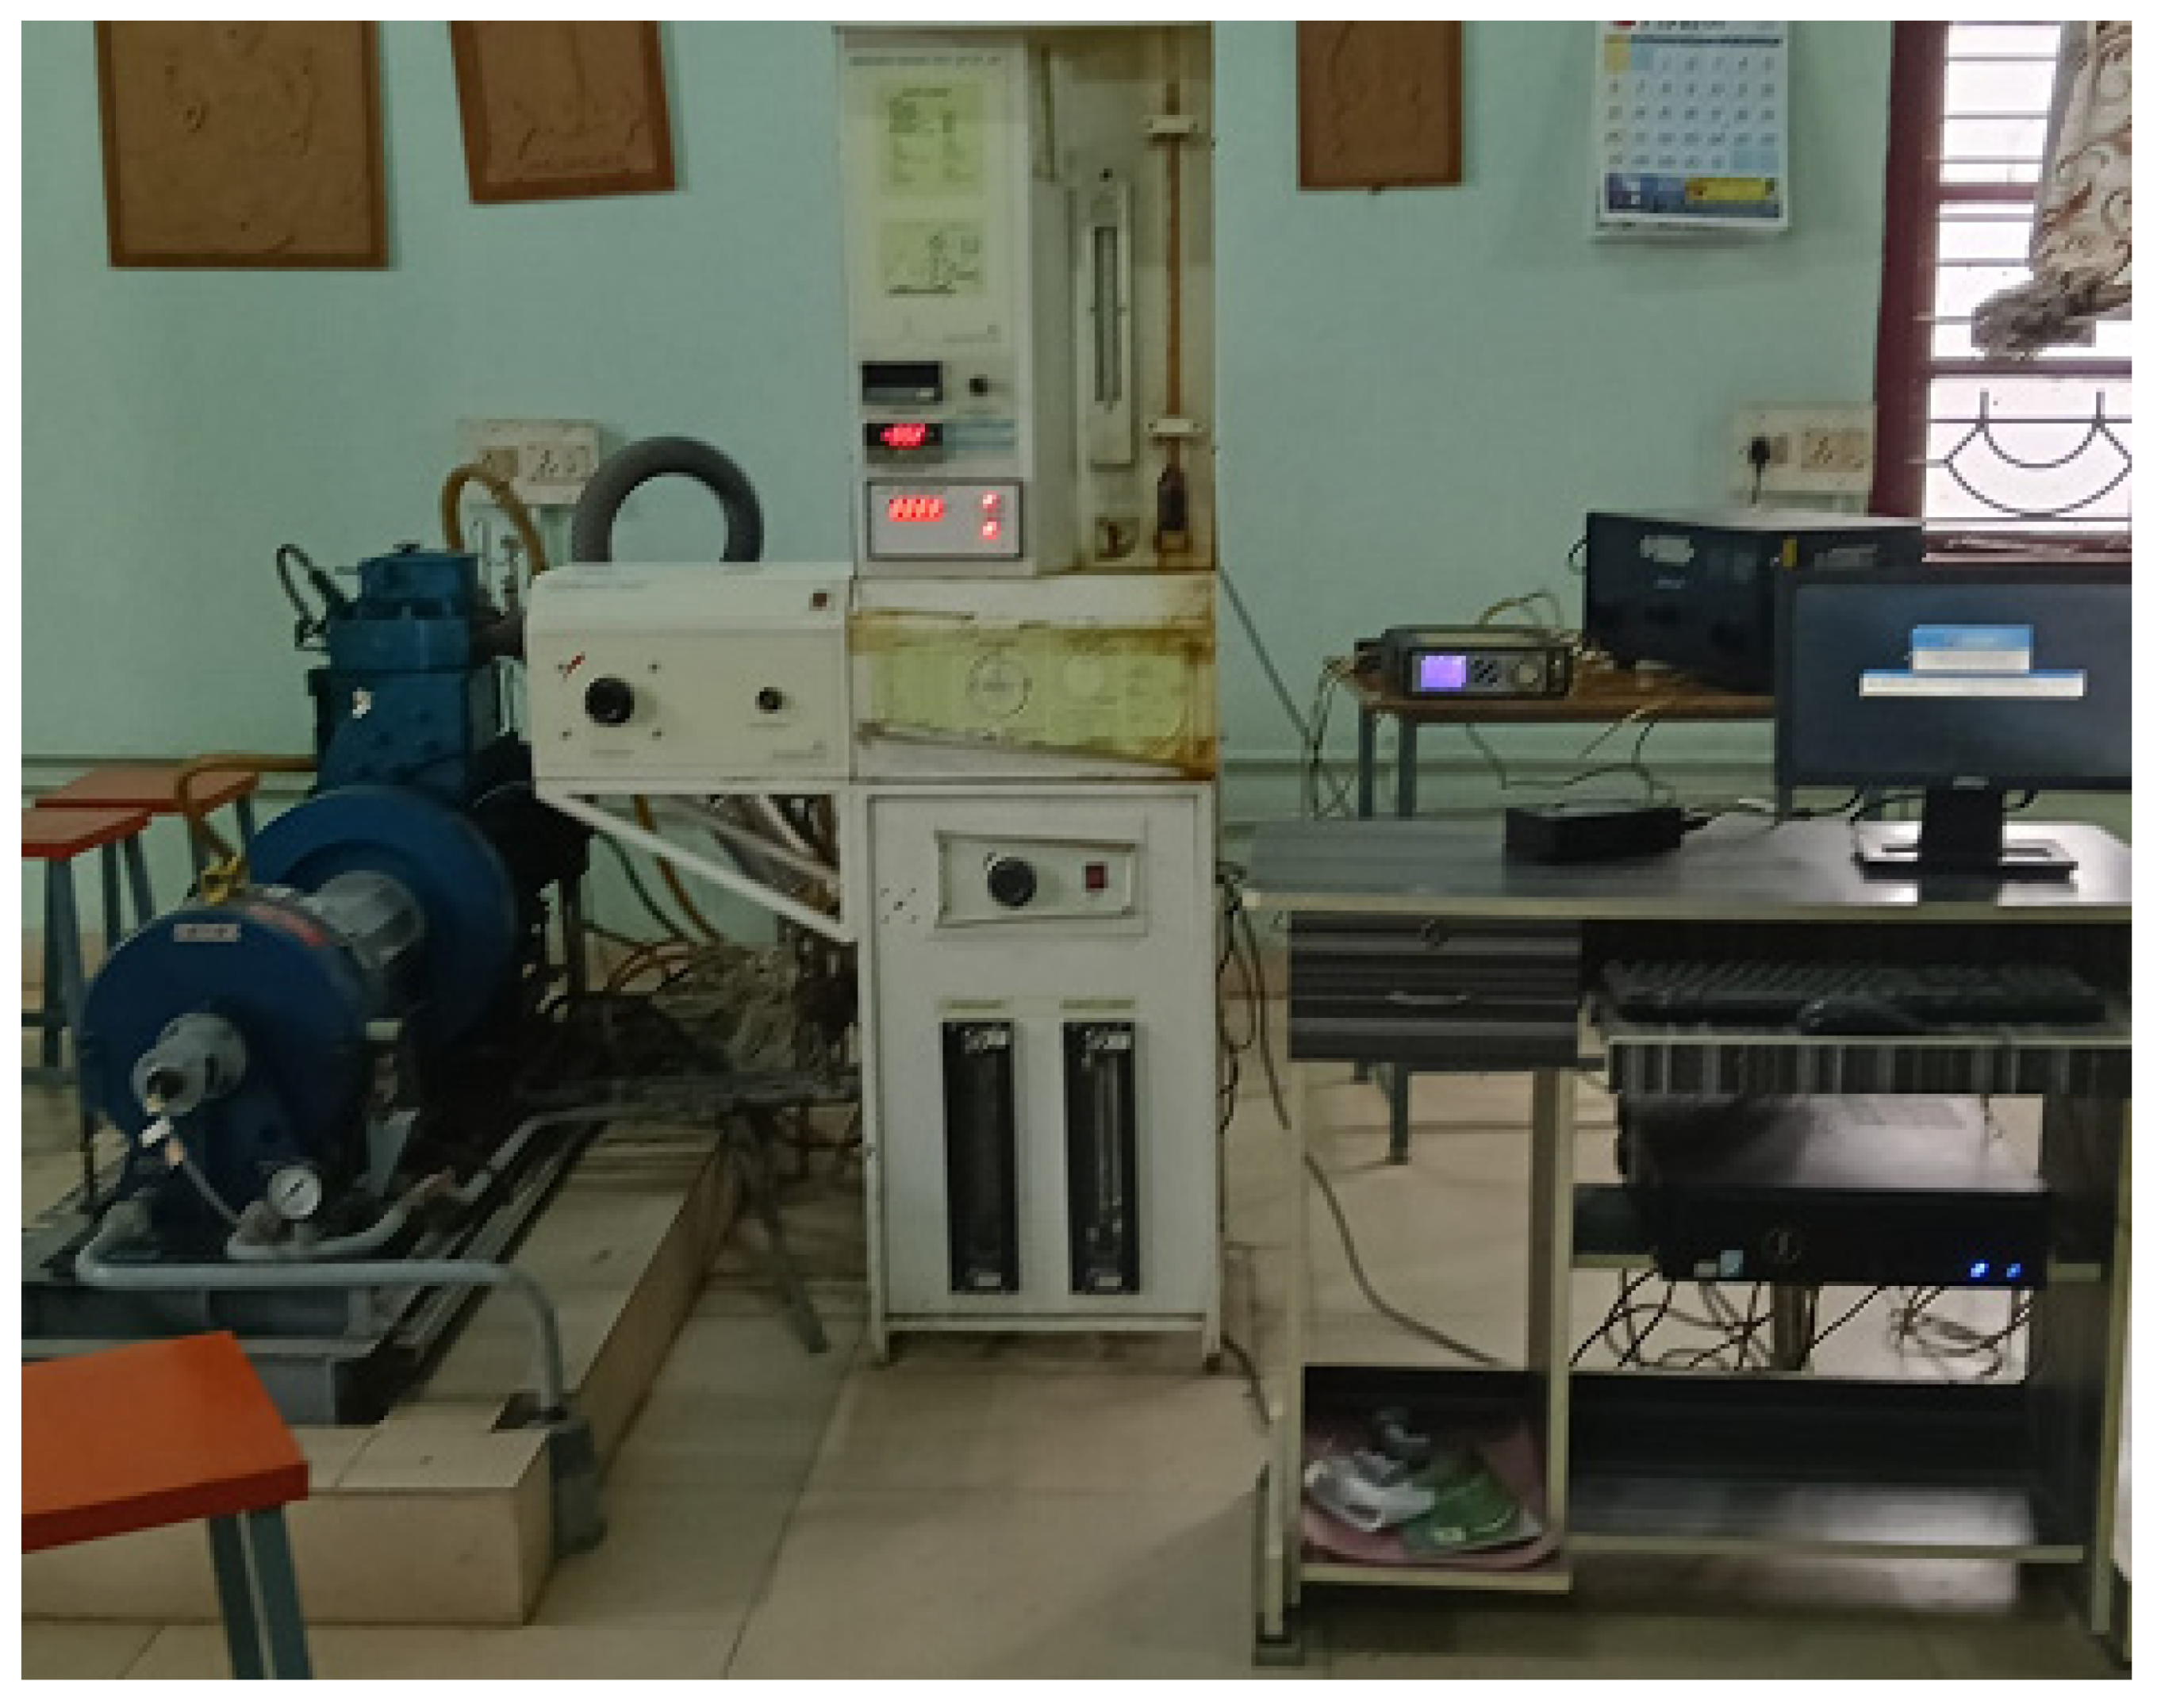
A diesel engine was used for the experiment. For the D-RK tool [15,16], validation against chamber pressure and the heat release rate for diesel fuel was used while preserving injection time and speed (as shown in Figure 2). Table 5 highlights and illustrates the technical details of the different testing equipment employed, as well as the largest unknowns prior to the experiment. Using the equipment and the study’s standard deviation equation, error deviations were estimated [17,18]. On the basis of the uncertainty shown in Table 6, the total uncertainty of the experimental data was then computed using the standard deviation equation. The calculated uncertainty was2.68% overall, as per Equation (2). Four load levels, 25%, 50%, 75%, and 100%, of the rated load were used to operate the engine. An eddy current dynamometer was used to regulate the brake power, and torque was measured with an accuracy of ±0.5%. Because 1500 rpm is a common operating point for small stationary diesel engines used in power generation and agricultural applications, this speed was maintained throughout the experiments. Small variations (±5 rpm) were noted and adjusted for in the analysis. The crank angle before the top dead centre (b TDC) was set at 23.5° for the baseline injection time. Initially, no changes were made to the injection timing for blended fuels; however, trends in heat release and ignition delay were tracked to guarantee stable combustion. Depending on the impacts of nanoparticles, future optimization might entail moving the timing forward by 1–2° CA. The total uncertainty was calculated using Equation (2) [19] and was found to be 2.68%.
U n c e r t a i n t y = [ A i r   f l o w   r a t e 2 + D y n a m o m e t e r 2 + E n c o d e r 2 + C o n s u m p t i o n   o f   f u e l 2 + C O 2 2 + N O x 2 + C O 2 + L o a d   c e l l 2 + P r e s s u r e   s e n s o r 2 + S m o k e   m e t e r 2 + T e m p e r t u r e   s e n s o r 2 + s p e e d   s e n s o r 2 + B T E 2 + D e n s i t y 2 + F l a s h   p o i n t 2 + ( F i r e   p o i n t ) 2 + H e a t i n g   v a l u e 2 + V i s c o s i t y 2 ]
This study’s uncertainty analysis is mostly restricted to formulaic computations and does not provide a more thorough assessment of how these errors affect the dependability of the findings. A more through approach that addresses the impact and propagation of errors is required. One important concern is the in-cylinder pressure. Combustion analysis is directly impacted by even minor sensor errors that can skew the heat release rate and ignition delay. Regarding brake power and fuel consumption, measurement mistakes can spread to the BTE and SFC, making efficiency gains less certain. Regarding emission data, results for NOx, CO, and HC are extremely sensitive to analyser calibration; even little variations could obscure the impacts of nanoparticles.
There is also the issue of the spread of uncertainty, as error propagation should be measured rather than just the main sensor errors. For example, a ±1–3% variation in SFC could be caused by a ±1% inaccuracy in fuel flow. In the absence of this, performance trends could seem more or less robust than they truly are.

2.3. Model Descriptions

2.3.1. Governing Equations

The first rule of thermodynamics is the foundation of the Diesel-RK tool, which analyses engine performance, combustion, and emission data. This model incorporates the conservation equations from Land and Assanis, which utilize the Diesel-RK program [20,21]. The following equations are linked to the Diesel-RK program: conservation of energy (5); conservation of mass (3); conservation of species (4); modelling of engine friction (6); the rate of heat release computed using Tolstov’s equation (ignition delay time; premixed combustion phase, mixing-controlled ignition phase, and late ignition phase) (7); and NOx production via the Zeldovich mechanism (8). Table 7 provides the formation of soot and particulate matter by alkydas (9), HSL (10), and BSN (11).

2.3.2. Validation Tool

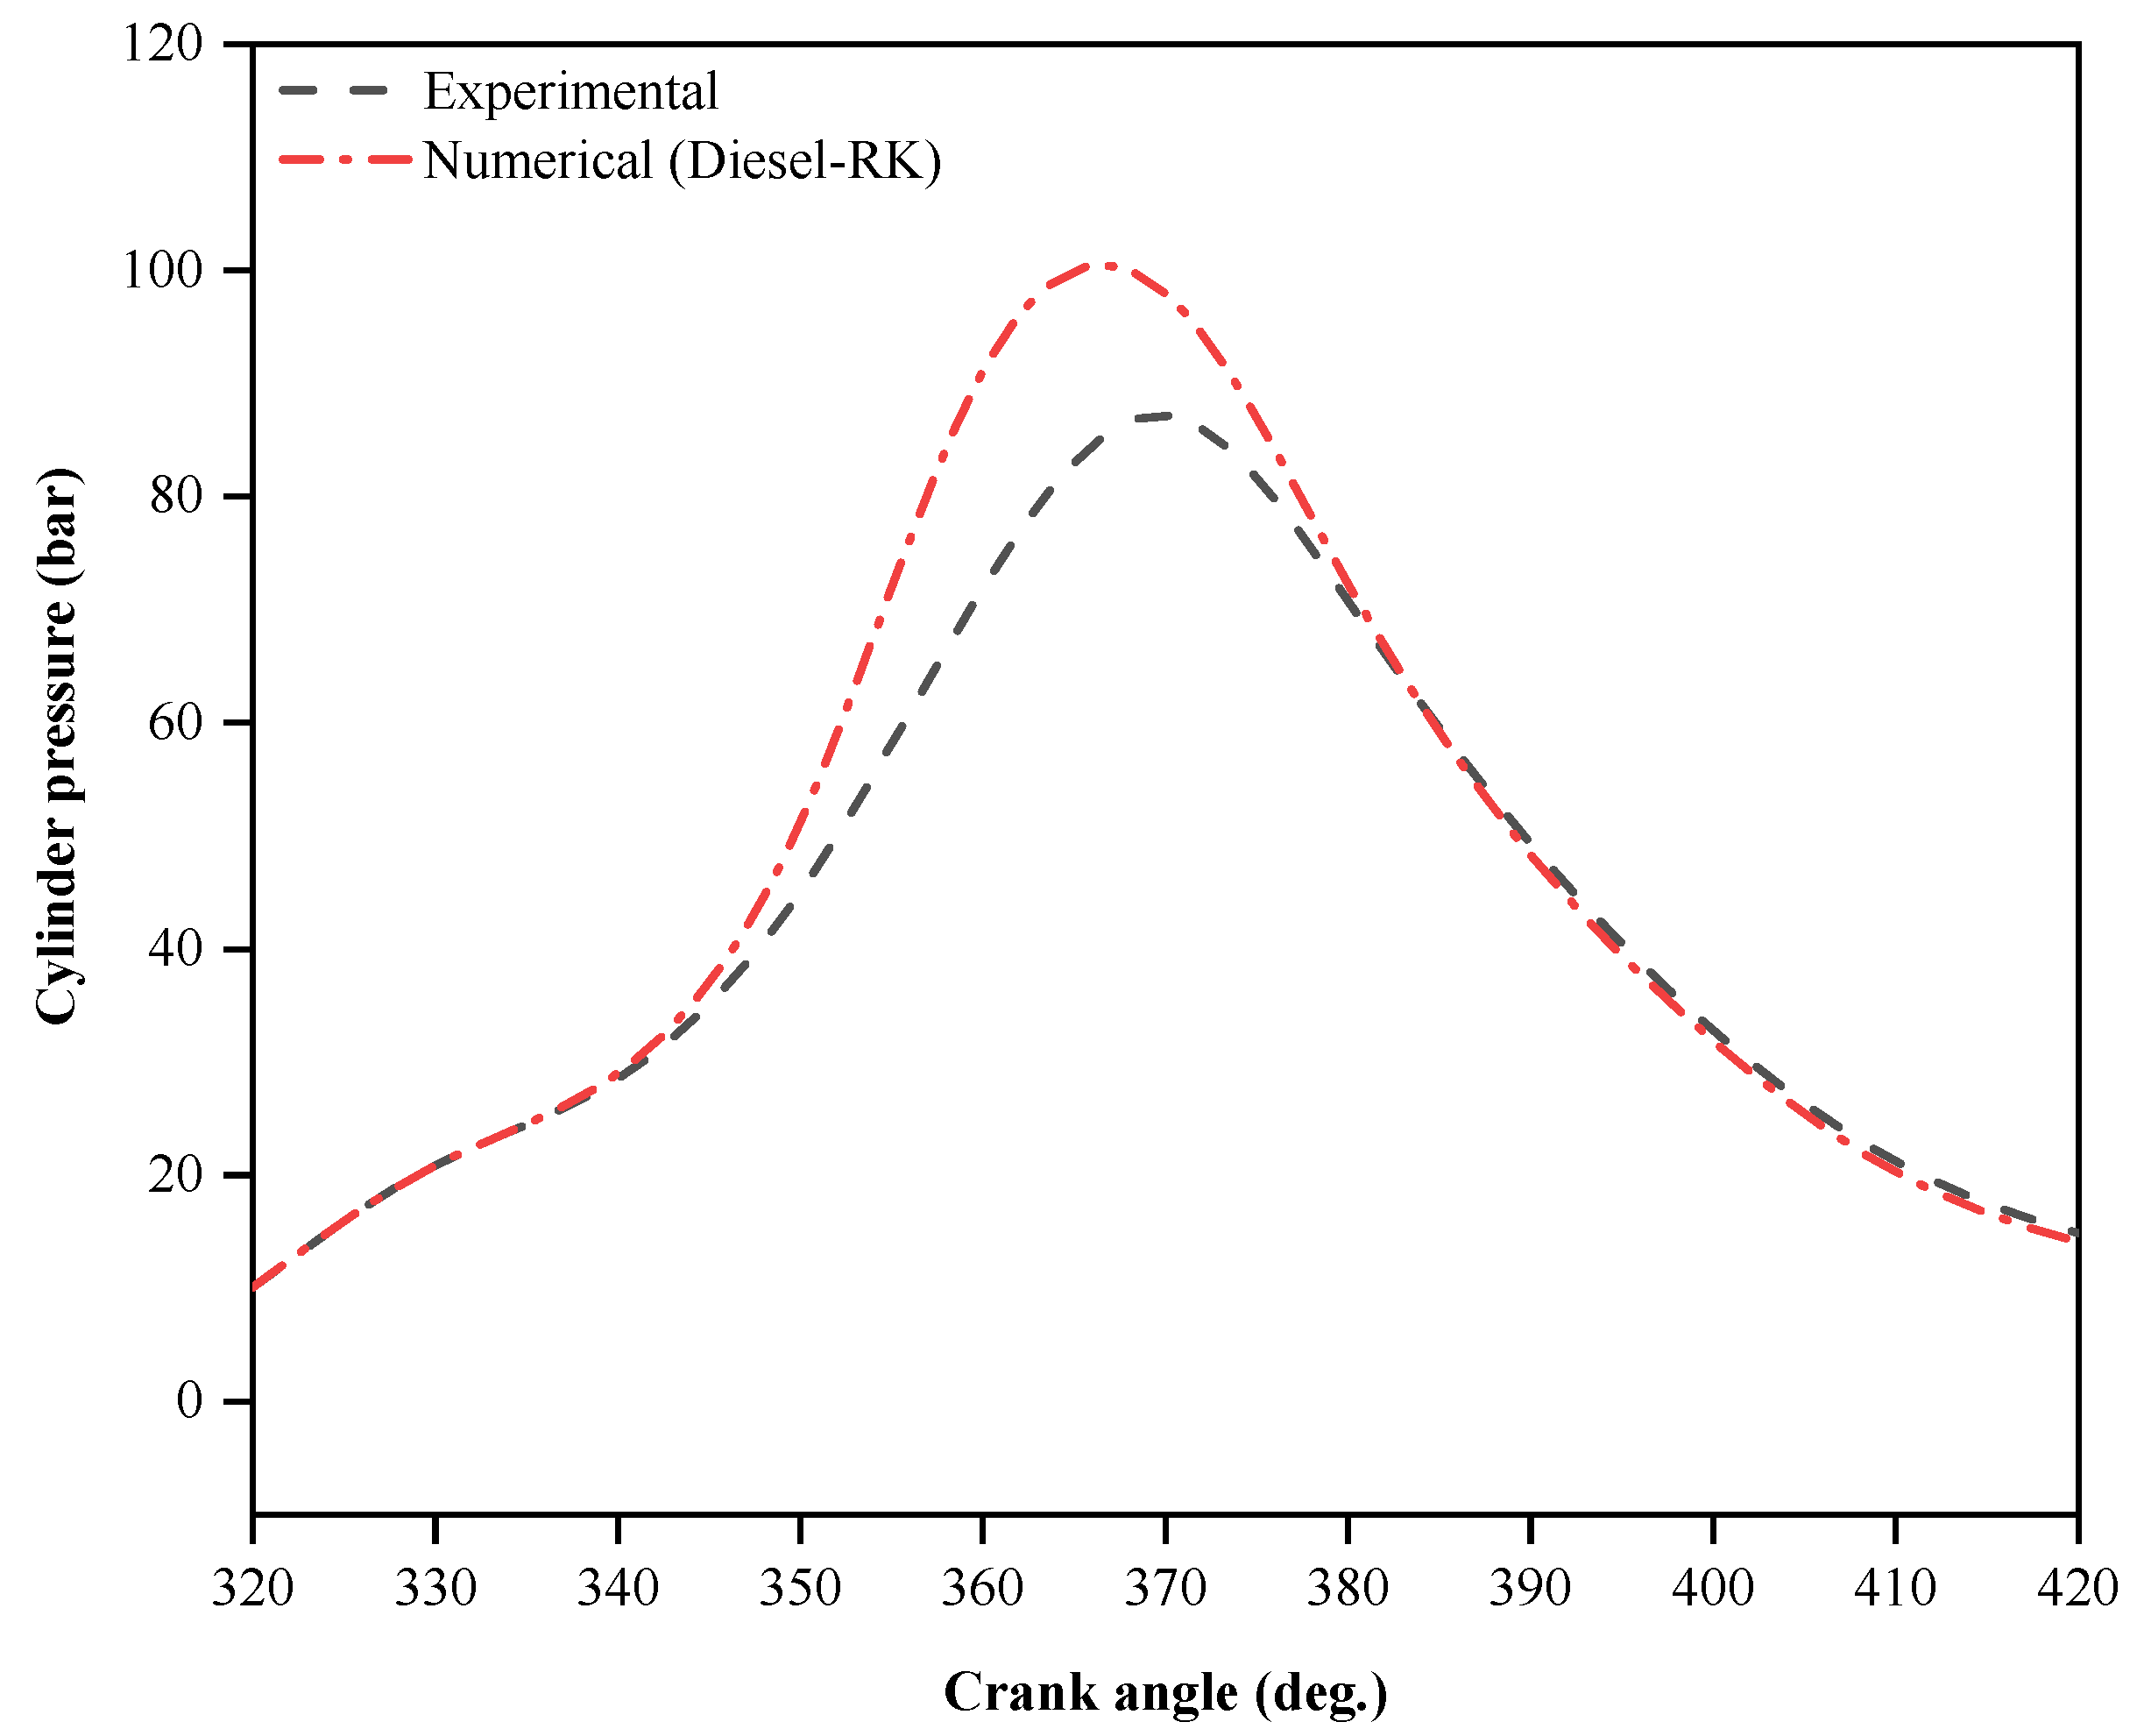
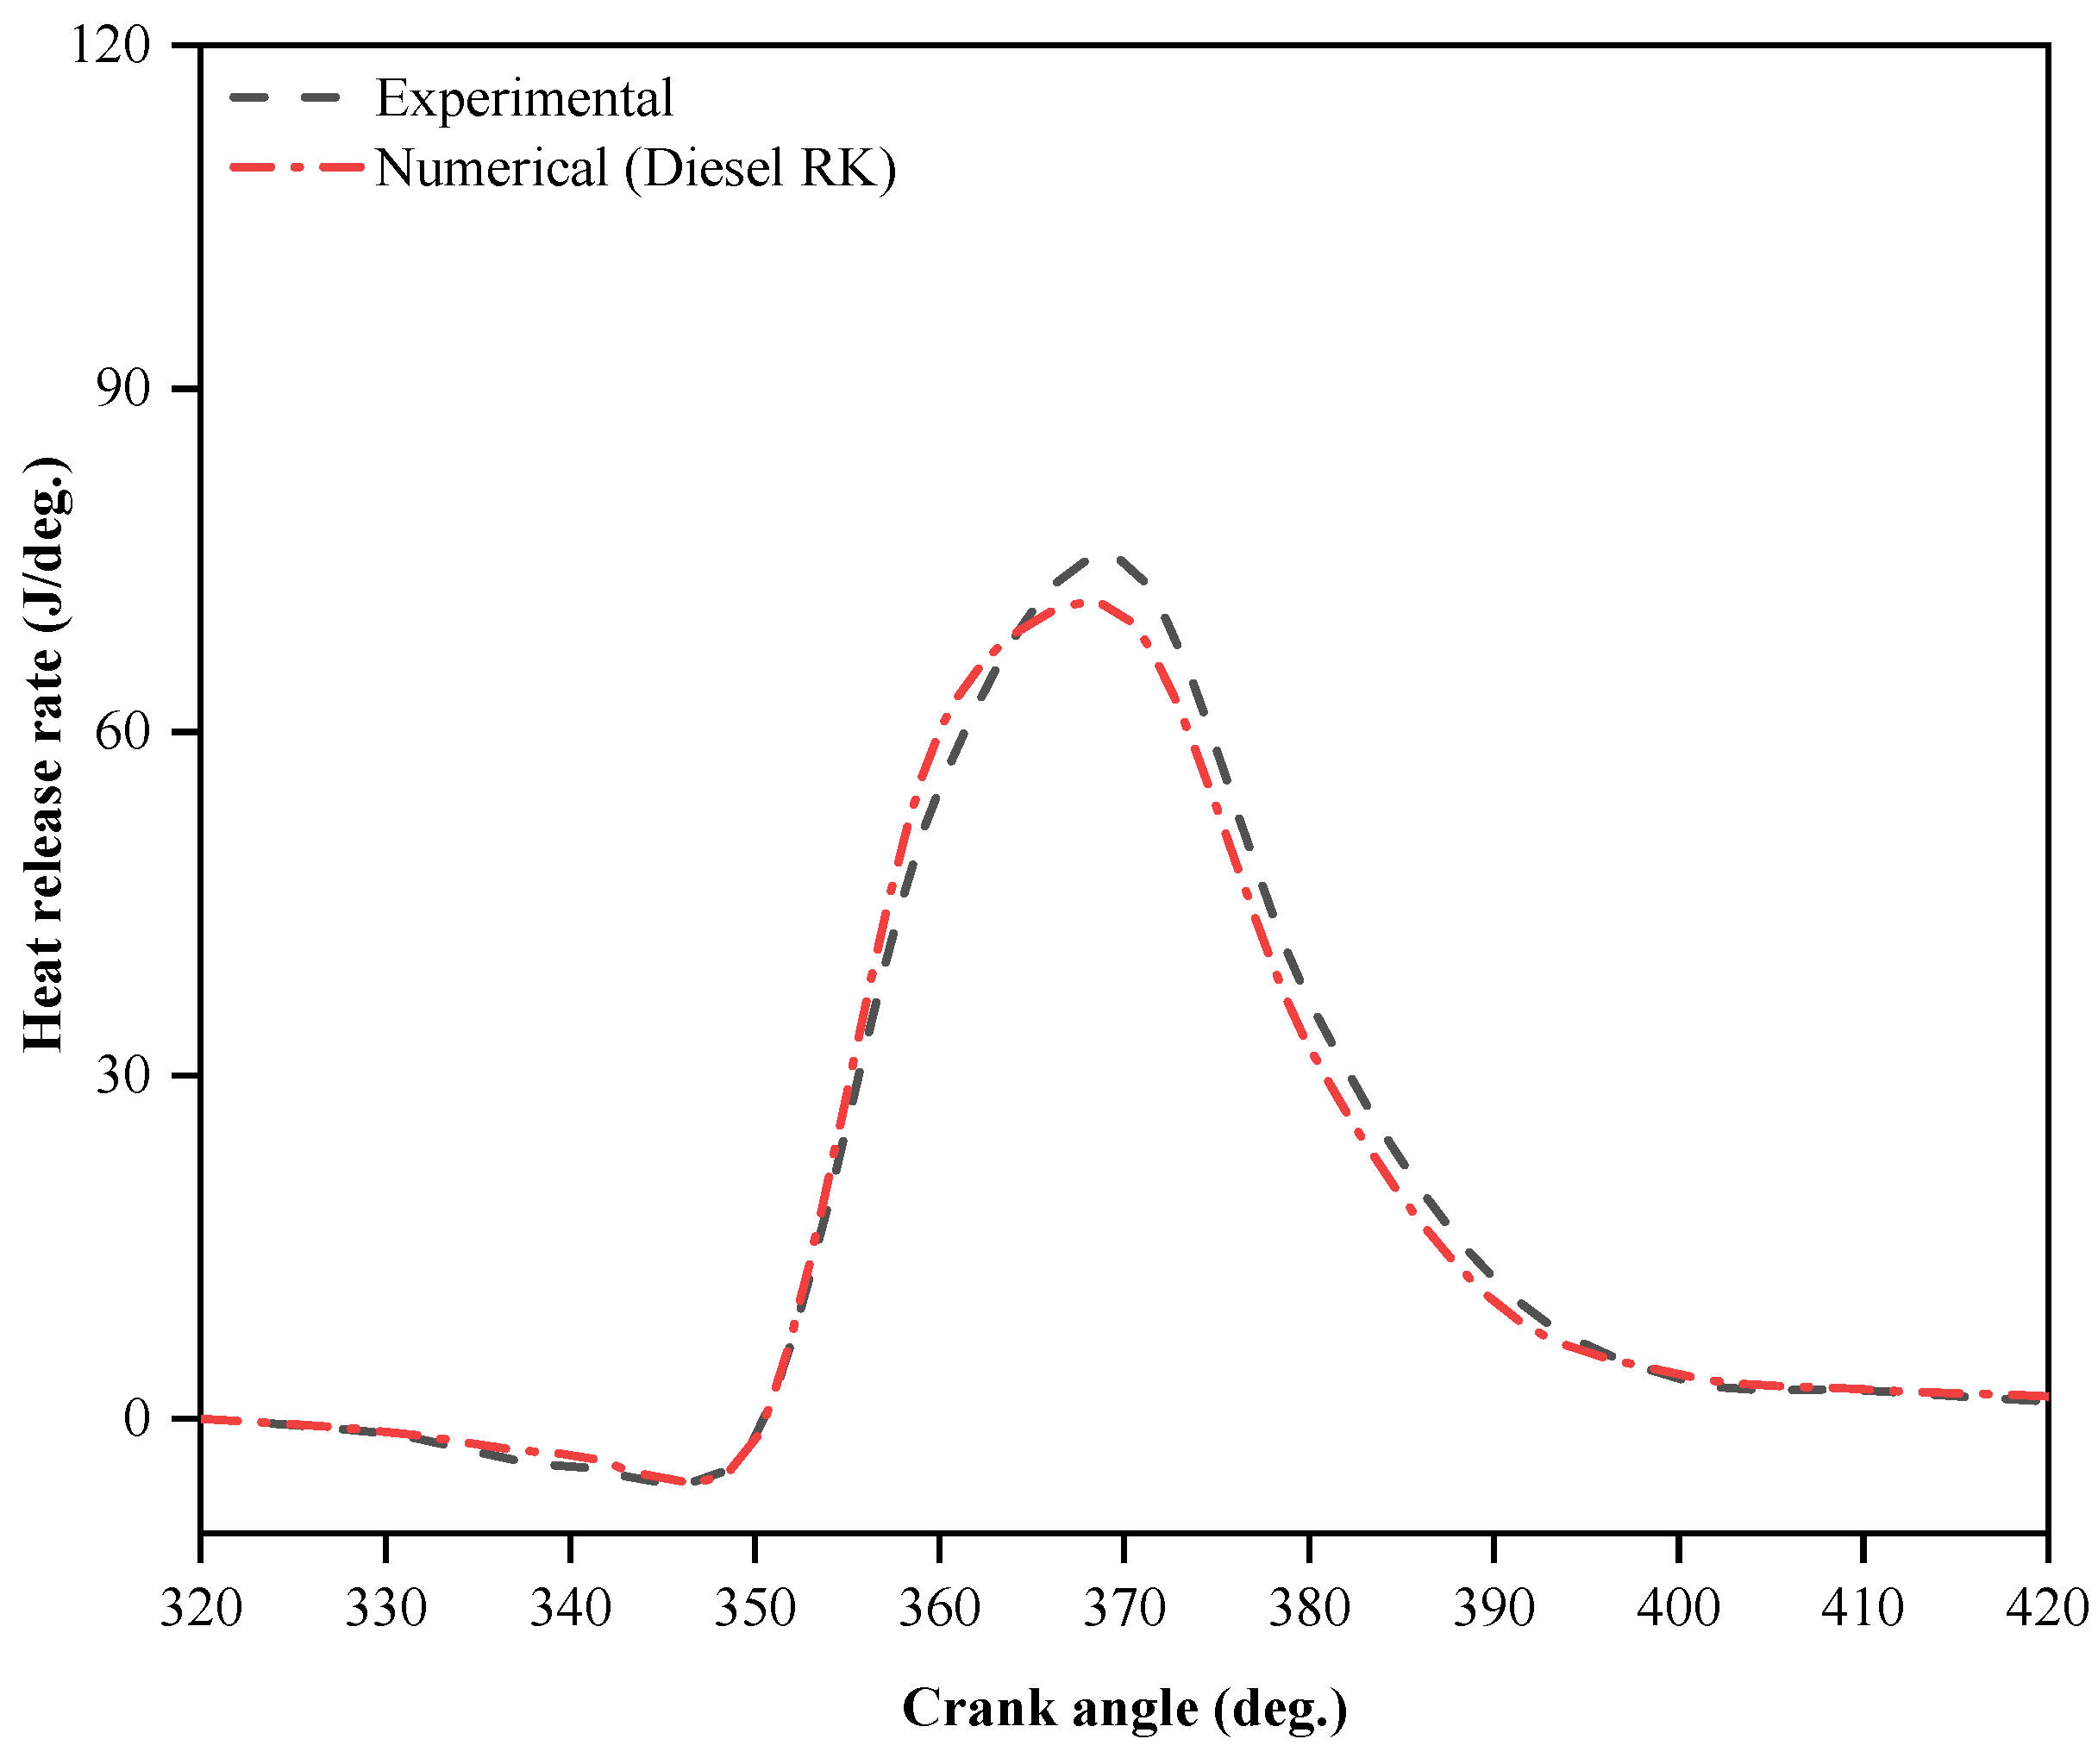
In this work, the D-RK tool was used to quantitatively evaluate the engine characteristics of a CI engine operating on CDF, TPOE as a substitute, and CeO2 with 50 and 100 ppm. The chamber pressure shown in Figure 3 and Figure 4 demonstrates the degree of concordance between simulation and experiment results (chamber pressure and heat release rate). The observed error deviation is a consequence of the interactions between the experimental and simulation hypotheses. Because the error deviation for in-chamber pressure was found to be 9.37% and for the in-heat release rate was found to be 7.18%, in the current investigation, as per the literature, the graph clearly demonstrates that the chamber pressure and heat release rate are operating under the same conditions as those listed in Table 5. The experimental findings of a single-chamber diesel engine working under identical circumstances are validated by comparing them to the predicted Diesel-RK results, as per [22]. At a higher load scenario (100%), the rate of heat escape decreased, and the discrepancy between the numerical and experimental chamber pressure values widened. The experimental and numerical data for in-chamber pressure (94.7 bar and 104.5 bar) and the heat release rate in the chamber (75.85 J/degree and 70.4 J/degree) are supplied as per the literature.

2.3.3. Optimization Results

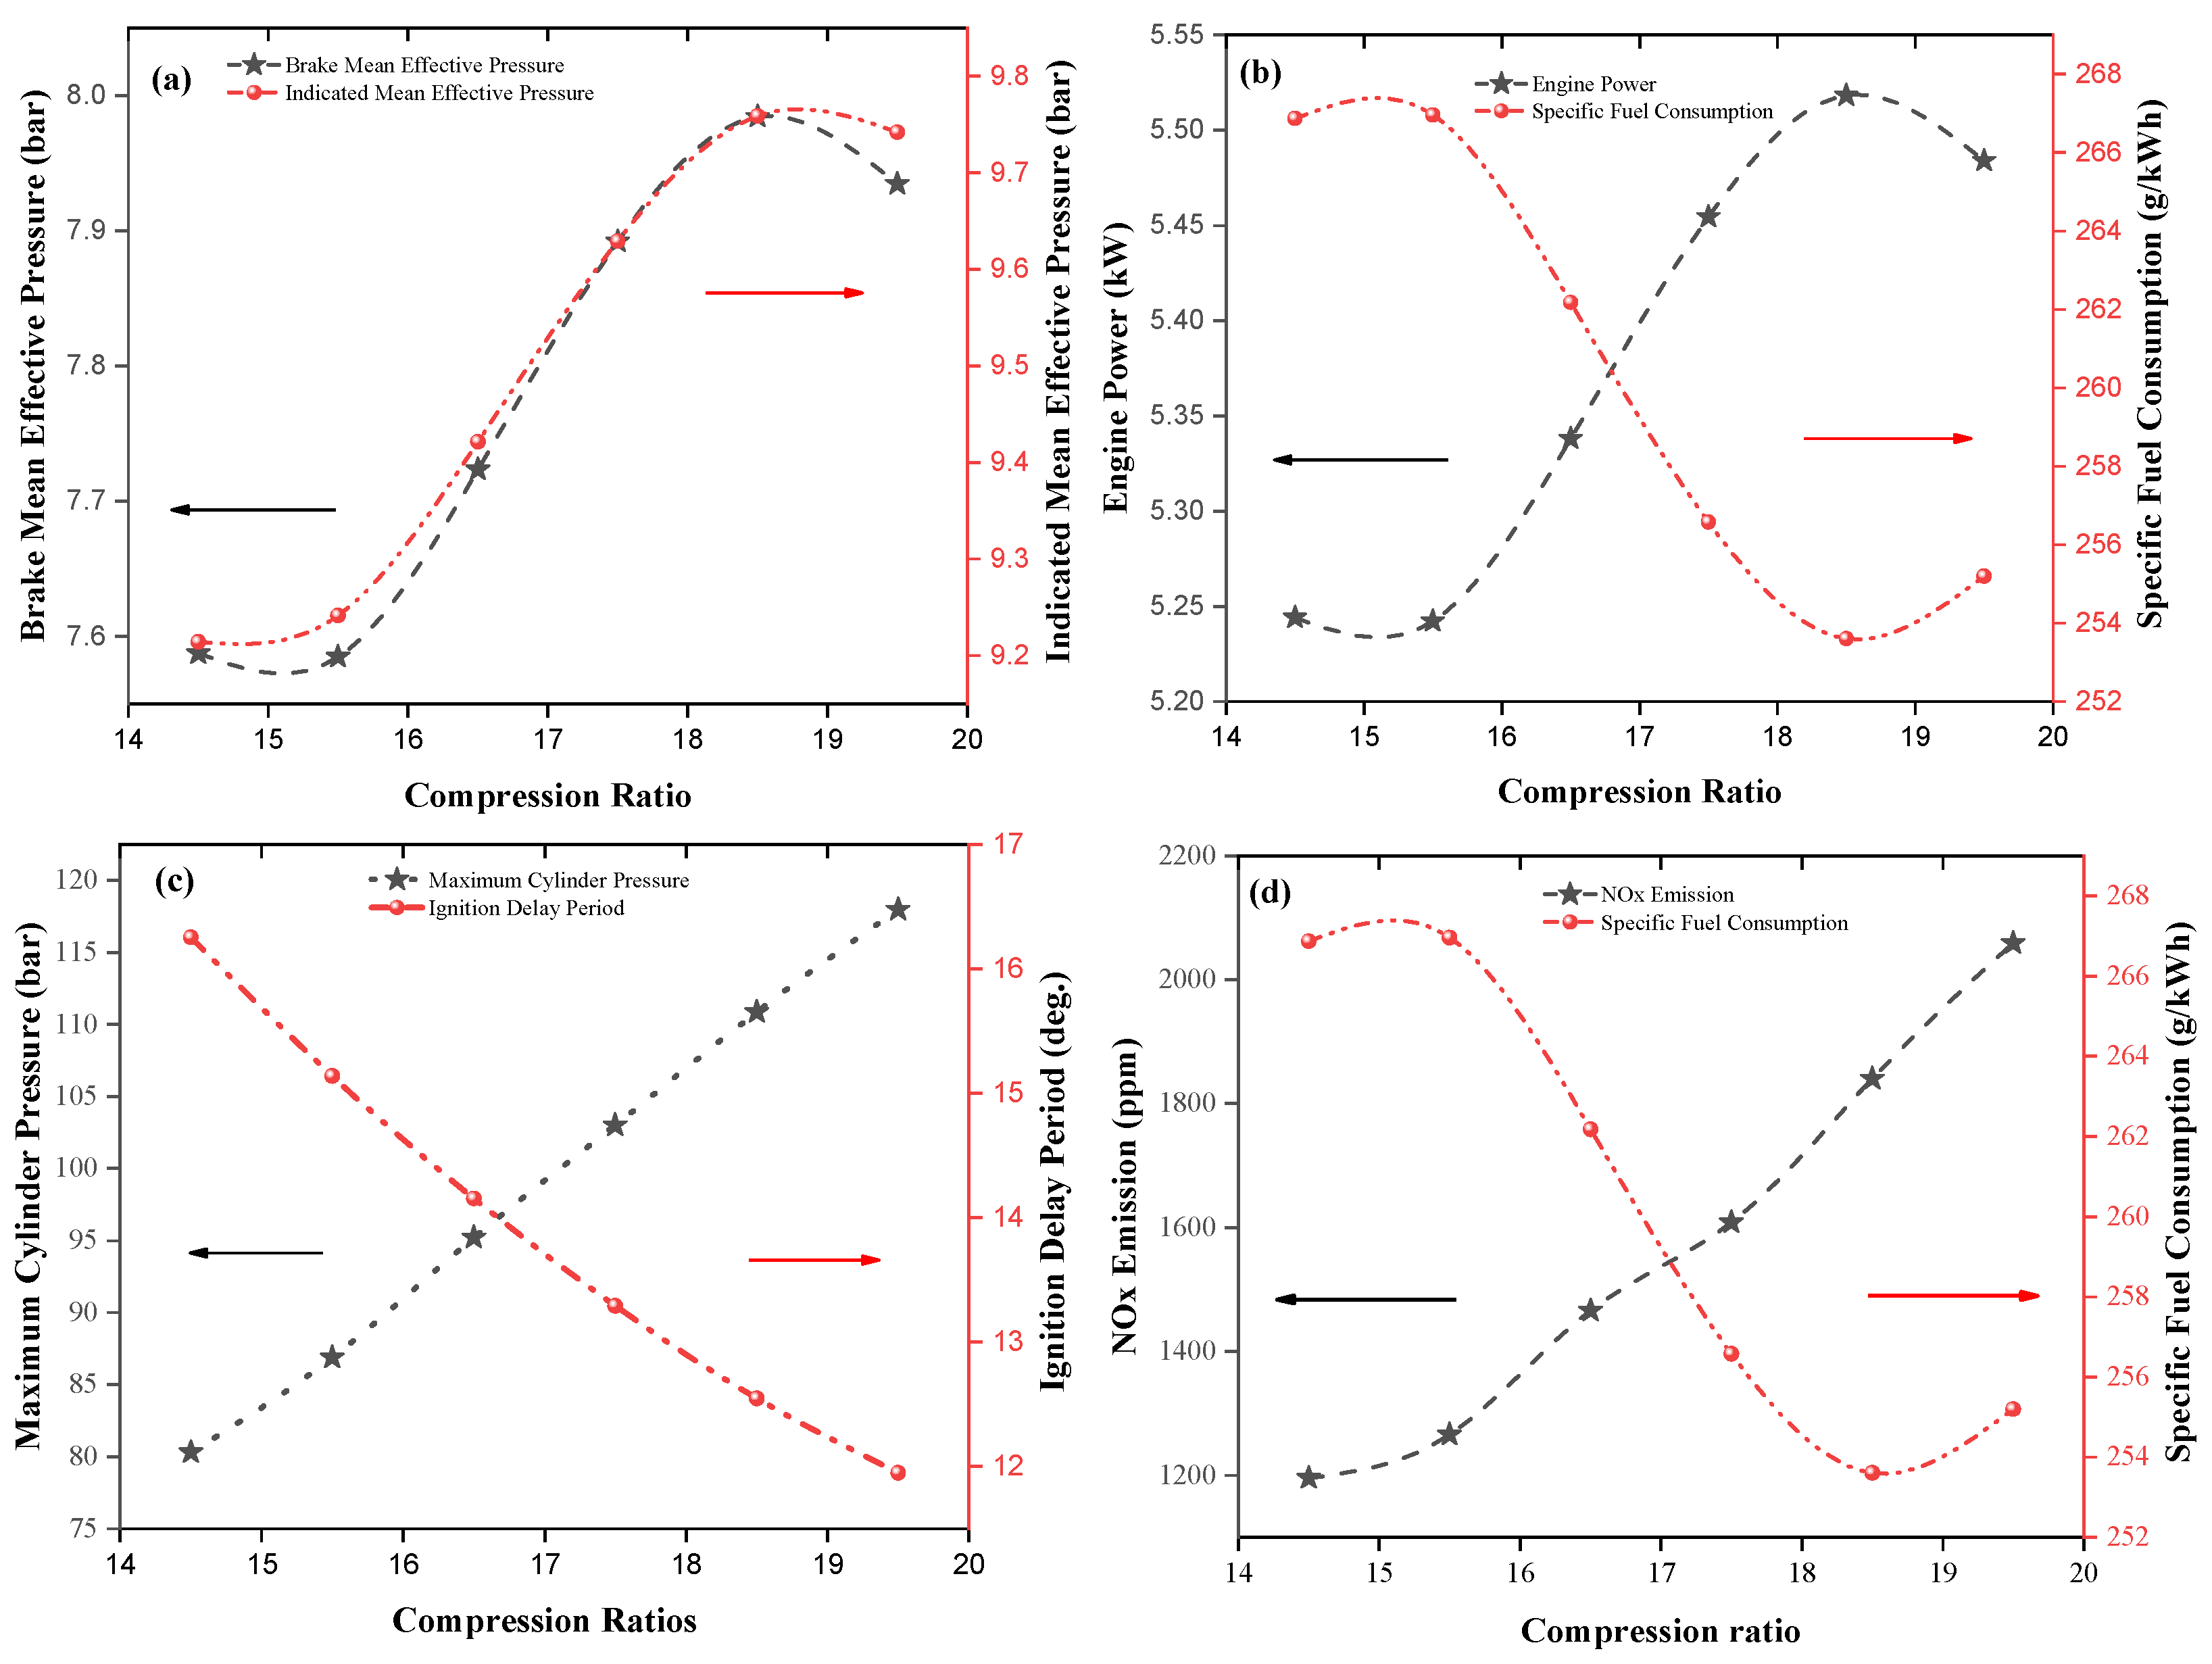
Using diesel–TPOE alternative–CeO2 ternary mixes, the engine characteristics of a CI engine were optimized with the use of the D-RK tool. As shown in Figure 5, compression ratios of 15.5, 16.5, 17.5, 18.5, and 19.5 yielded better outcomes than compression ratios of 18.5 (Figure 5a–d). The current investigation revealed that higher compression ratios led to higher chamber pressure, NOx discharges, and reduced ignition delay and fuel consumption. The graph in Figure 5 clearly illustrates these findings (Figure 5a–d). When compared to 15.5, 16.5, 17.5, 18.5. and 19.5, it was discovered that at a CR18.5 chamber pressure, engine power is higher and fuel consumption is lower. In comparison to 15.5, 16.5, 17.5, and 19.5, CR18.5 is an effective compression ratio. Using TPOE5D95, TPOE10D90, TPOE15D85, TPOE20D80, TPOE5D90 + nano-additives A, TPOE5D85 + nano-additives B, TPOE10D85 + nano-additives C, TPOE10D80 + nano-additives D, diesel fuel (CDF), and tyre oil (TPOE) fuel blends, CR18.5 was used to assess ignition, performance, and discharge characteristics.

3. Result and Discussion

3.1. Performance Characteristics

3.1.1. Specific Fuel Consumption

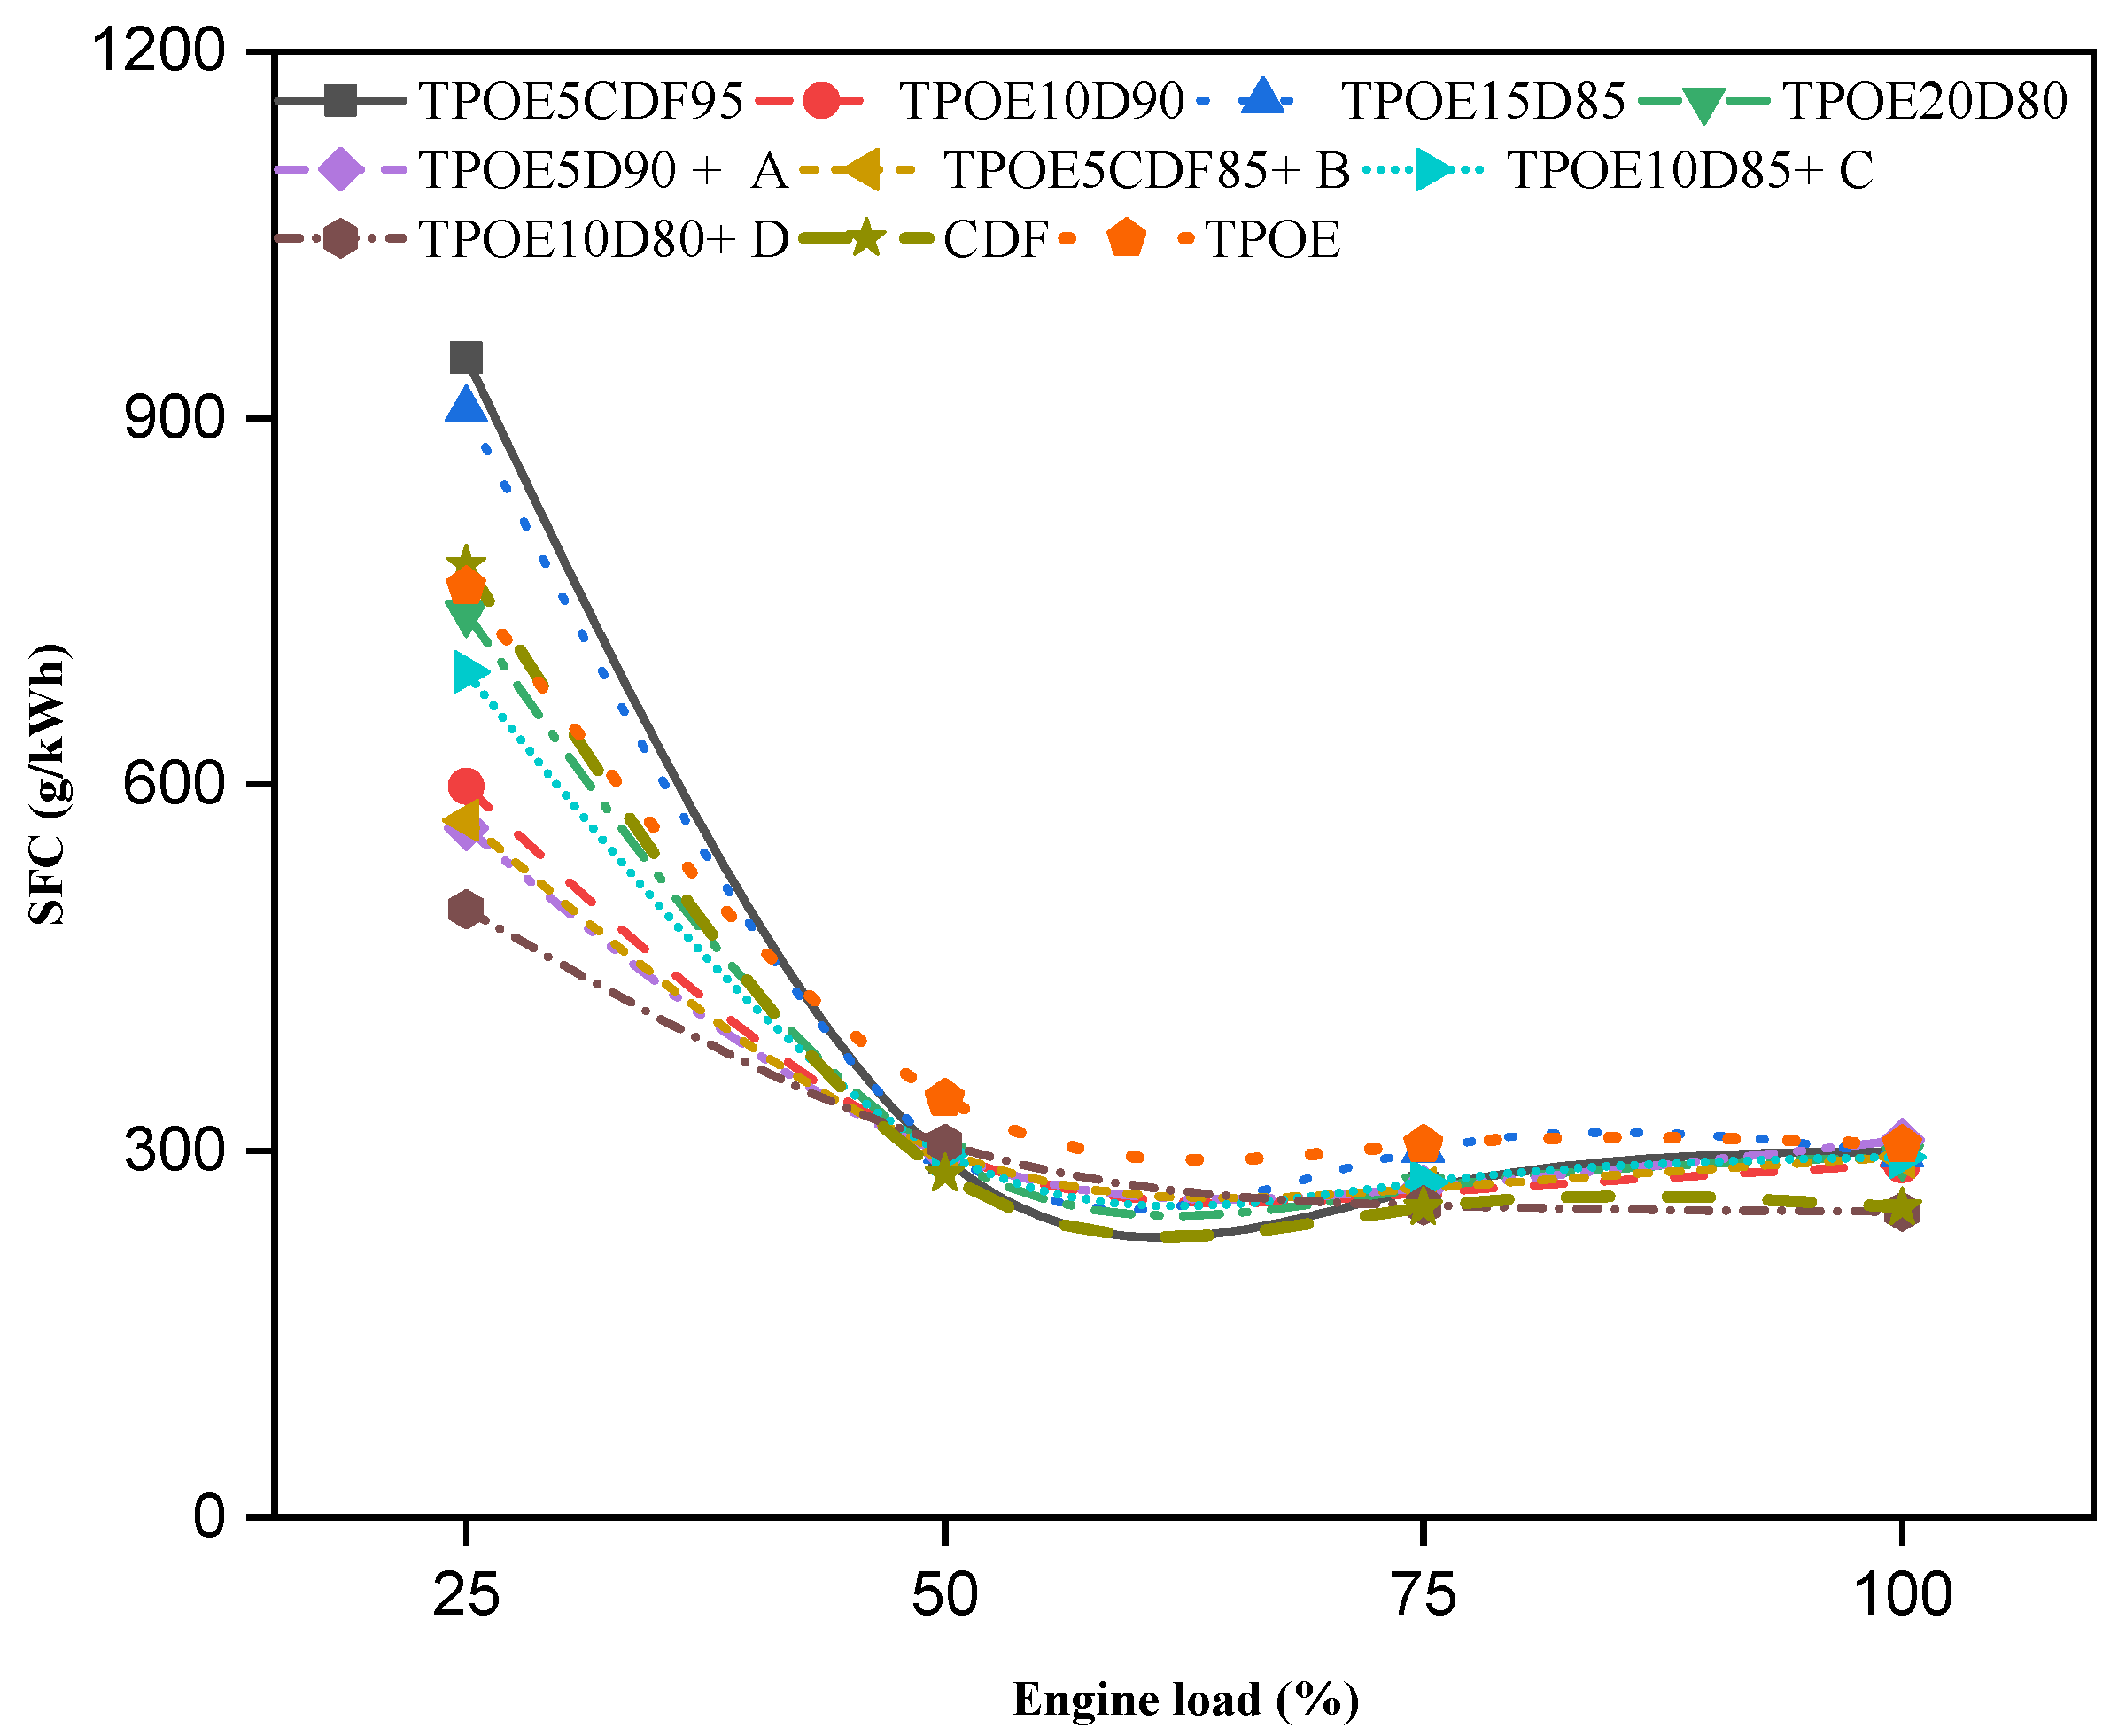
Figure 6 depicts the connection between specific fuel consumption (SFC) and load for the formulations TPOE5D95, TPOE10D90, TPOE15D85, TPOE20D80, TPOE5D90 + A, TPOE5D85 + B, TPOE10D85 + C, TPOE10D80 + D, CDF, and TPOE. Due to its lower calorific value than diesel and tyre oil (TPOE5D95, TPOE10D90, TPOE15D85, TPOE20D80, and TPOE), CeO2 nano-additions had a lower SFC. CeO2 nano-additions are slightly more expensive than diesel fuel. The viscosity and surface tension of the TPOE5D95, TPOE10D90, TPOE15D85, and TPOE20D80 blends rose as the fraction of alternatives increased. In this experiment, CeO2 (50–100 ppm) was combined with CDF-TPOE at a concentration of 10% by volume. SFC declines with load in all fuel mixtures with unmodified engine characteristics [21,23]. Increased fuel input to the chamber reduces oxygen for ignition [24,25]. Oxide nano-additions to blends lowered fuel usage at full load. At a 100% load, the SFC values of TPOE5D95, TPOE10D90, TPOE15D85, TPOE20D80, TPOE5D90 + A, TPOE5D85 + B, TPOE10D85 + C, TPOE10D80 + D, CDF, and TPOE were 299.4, 288.6, and 296.9.

3.1.2. Brake Thermal Efficiency

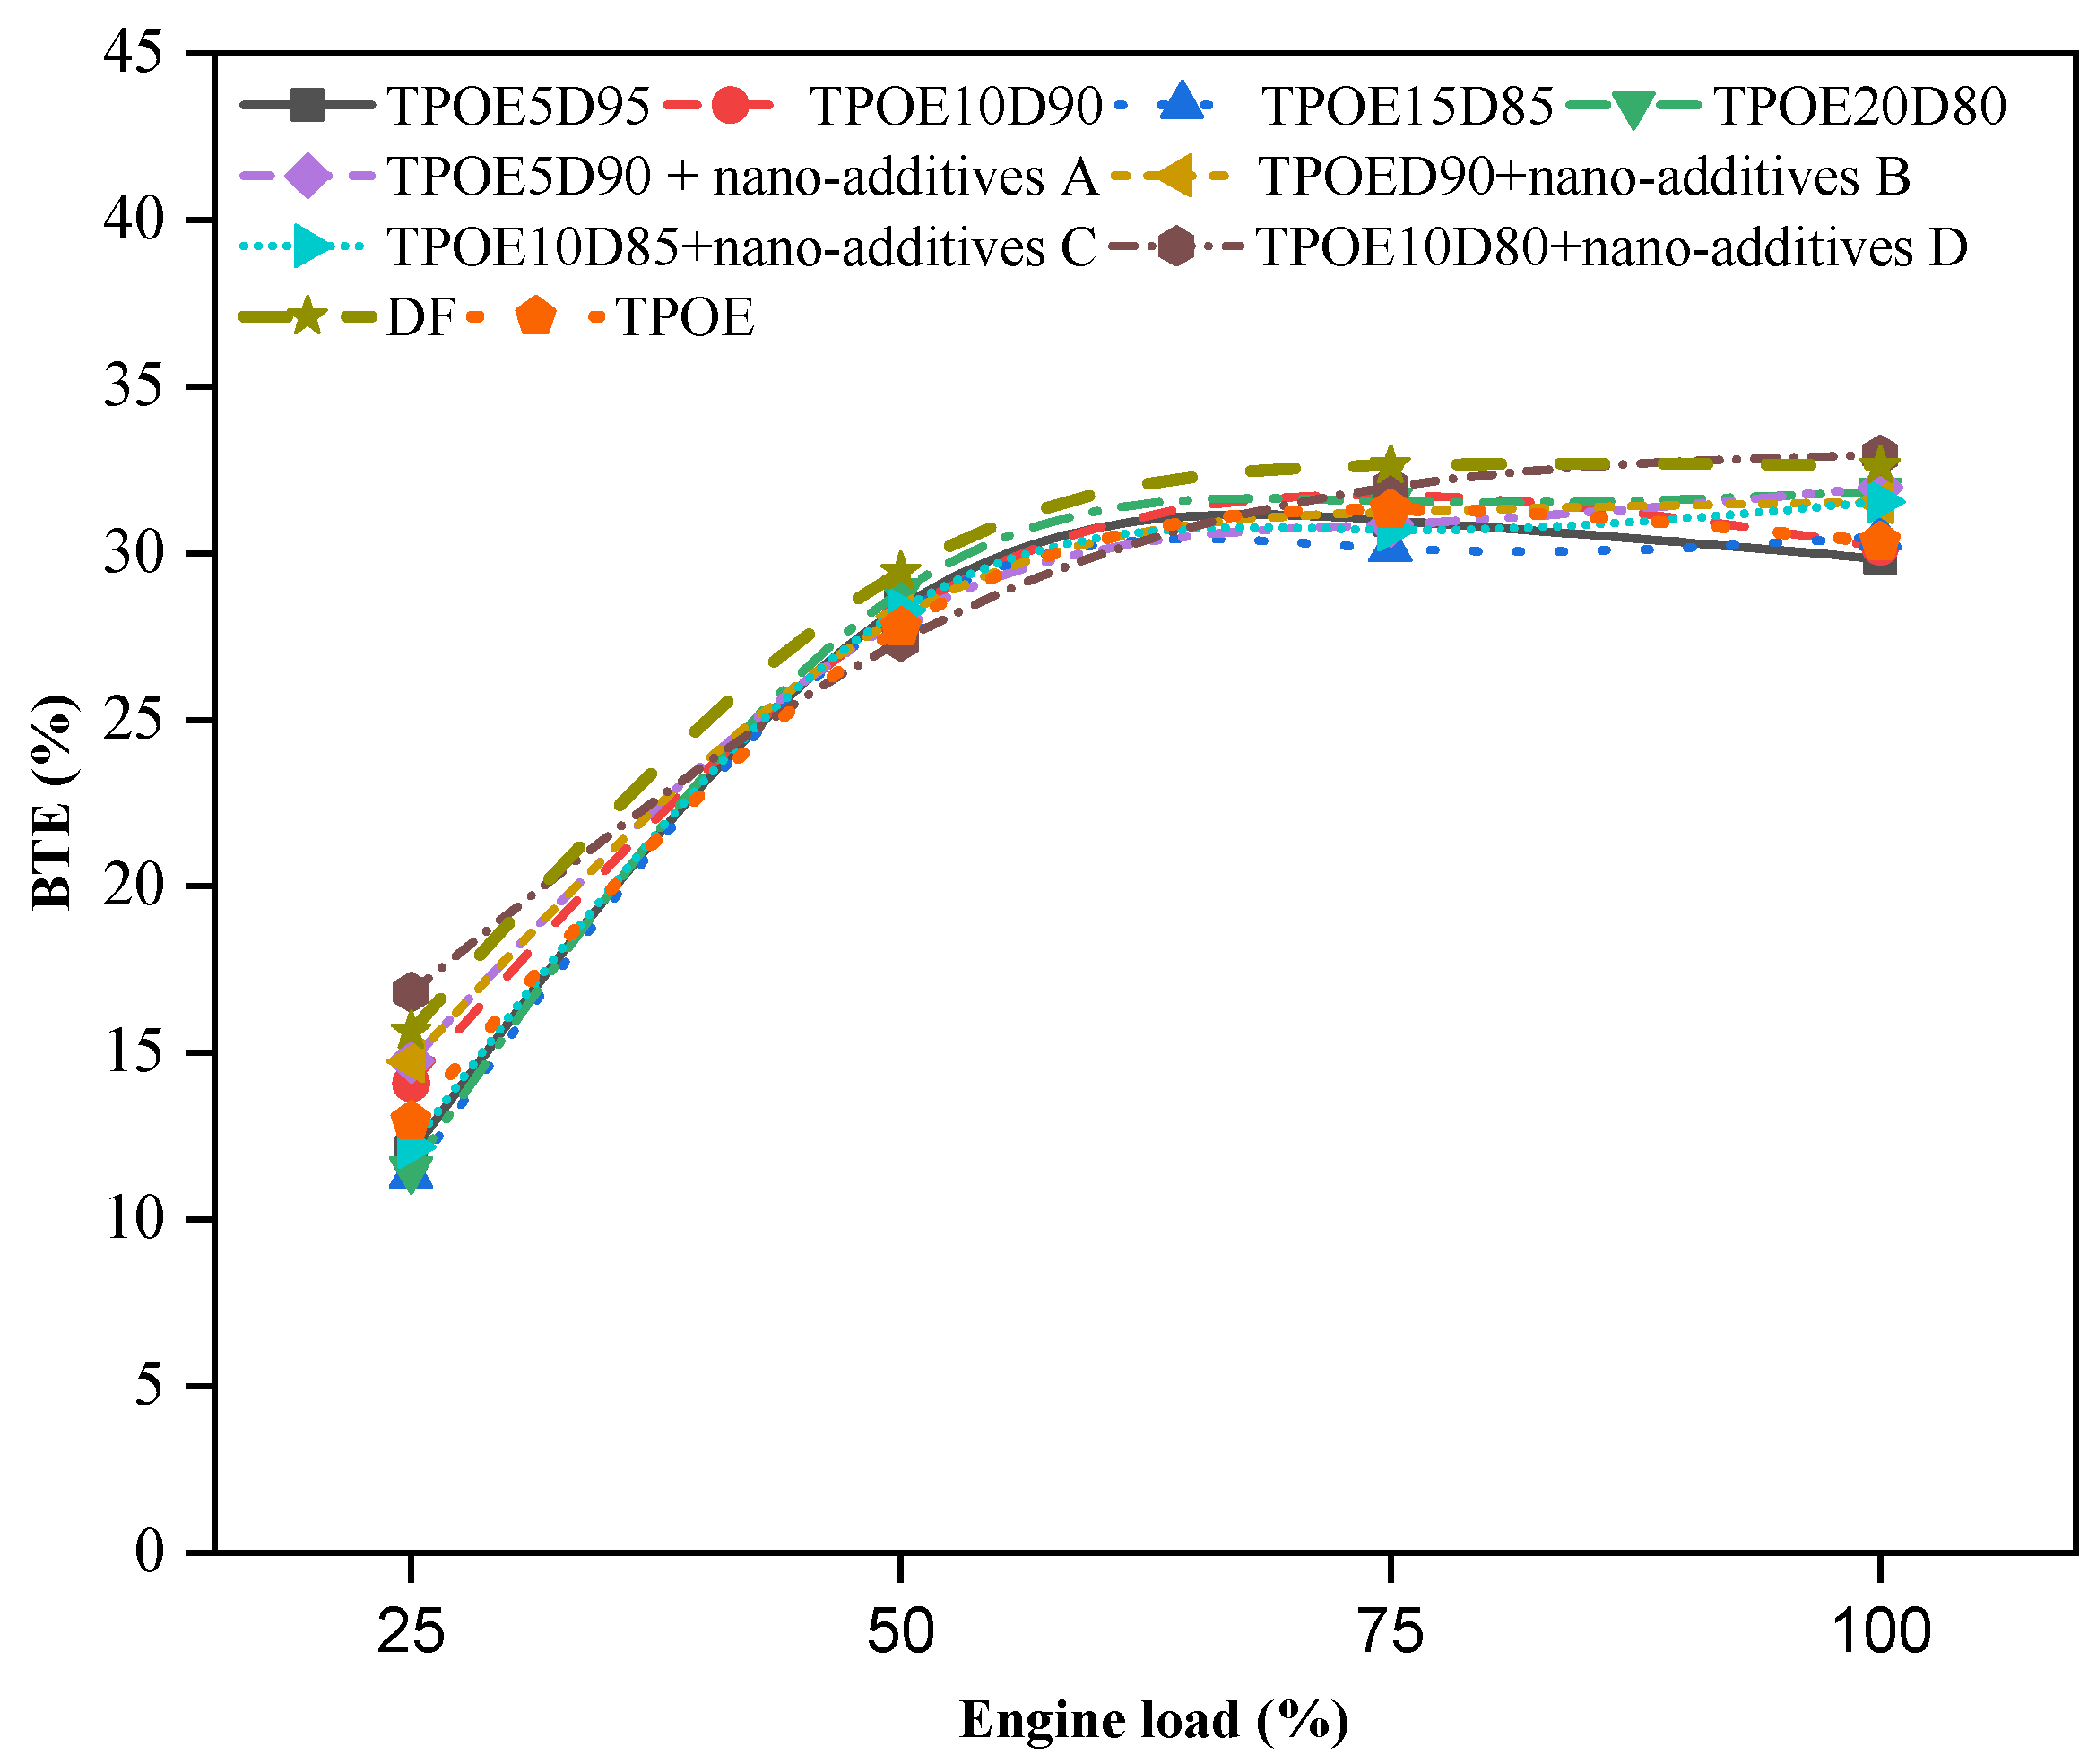
Figure 7 illustrates the brake thermal efficiency (BTE) as a function of load for the following materials: TPOE5D95, TPOE10D90, TPOE15D85, TPOE20D80, TPOE5D90 + A, TPOE5D85 + B, TPOE10D85 + C, TPOE10D80 + D, CDF, and TPOE. In published descriptions of diesel engines, the BTE is defined as the connection between braking force and the total amount of heat generated during fuel ignition [26,27]. Compared to diesel fuel, the TPOE5D90, TPOE5D85, TPOE10D85, and TPOE10D80 fuel combinations with nano-additives at 50 ppm and 100 ppm exhibited lower brake thermal efficiency. This effect is because adding nano-additives to the fuel mixture decreases the fuel’s calorific value. The presence of oxygen molecules in TPOE5D95, TPOE10D90, TPOE15D85, and TPOE20D80 improved ignition as the amount of alternative fuel increased in the blends. The properties of the spray are influenced by factors such as viscosity, surface tension, and the concentration of oxygen molecules [28]. In this experiment, CeO2 (50–100 ppm) was combined with CDF-TPOE up to 10% by volume. At an increasing load, the BTEs of diesel, tyre oil substitute, and TPOE10D80 + CeO2 100 ppm tested fuel mixes are greater. Adding more oxide nano-additives to the blends enhances the BTE at the full-load condition. At a 75.0% load, the BTE values for TPOE5D95, TPOE10D90, TPOE15D85, TPOE20D80, TPOE5D90 + A, TPOE5D85 + B, TPOE10D85 + C, TPOE10D80 + D, CDF, and TPOE were found to be 30.98 and 31.73. Although the direction of this increase is positive, it is as significant as earlier research employing fuels augmented with nano-additives. Increased oxygen availability, catalytic activity in soot oxidation, and improved atomization characteristics are the main reasons for the up to 1% BTE improvements reported in studies employing cerium oxide nanoparticles in diesel and alternative blends. This study’s comparatively modest improvement may be due to a number of factors: blend formulation limit, as it is possible that the CeO2 concentrations chosen were not the best for catalytic activity; and dispersion stability, as during burning, the agglomeration of nanoparticles may result in decreased surface activity. When compared to transitory or higher-load circumstances, the benefits of nanoparticles may not have been as evident in engine operating conditions, which are characterized by steady speed and a fluctuating load. Therefore, even though the findings support the ability of CeO2 to affect thermal efficiency, a higher dosage, dispersion, and operating strategy tuning are needed to produce gain on par with that reported in earlier studies.

3.1.3. Exhaust Gas Temperature

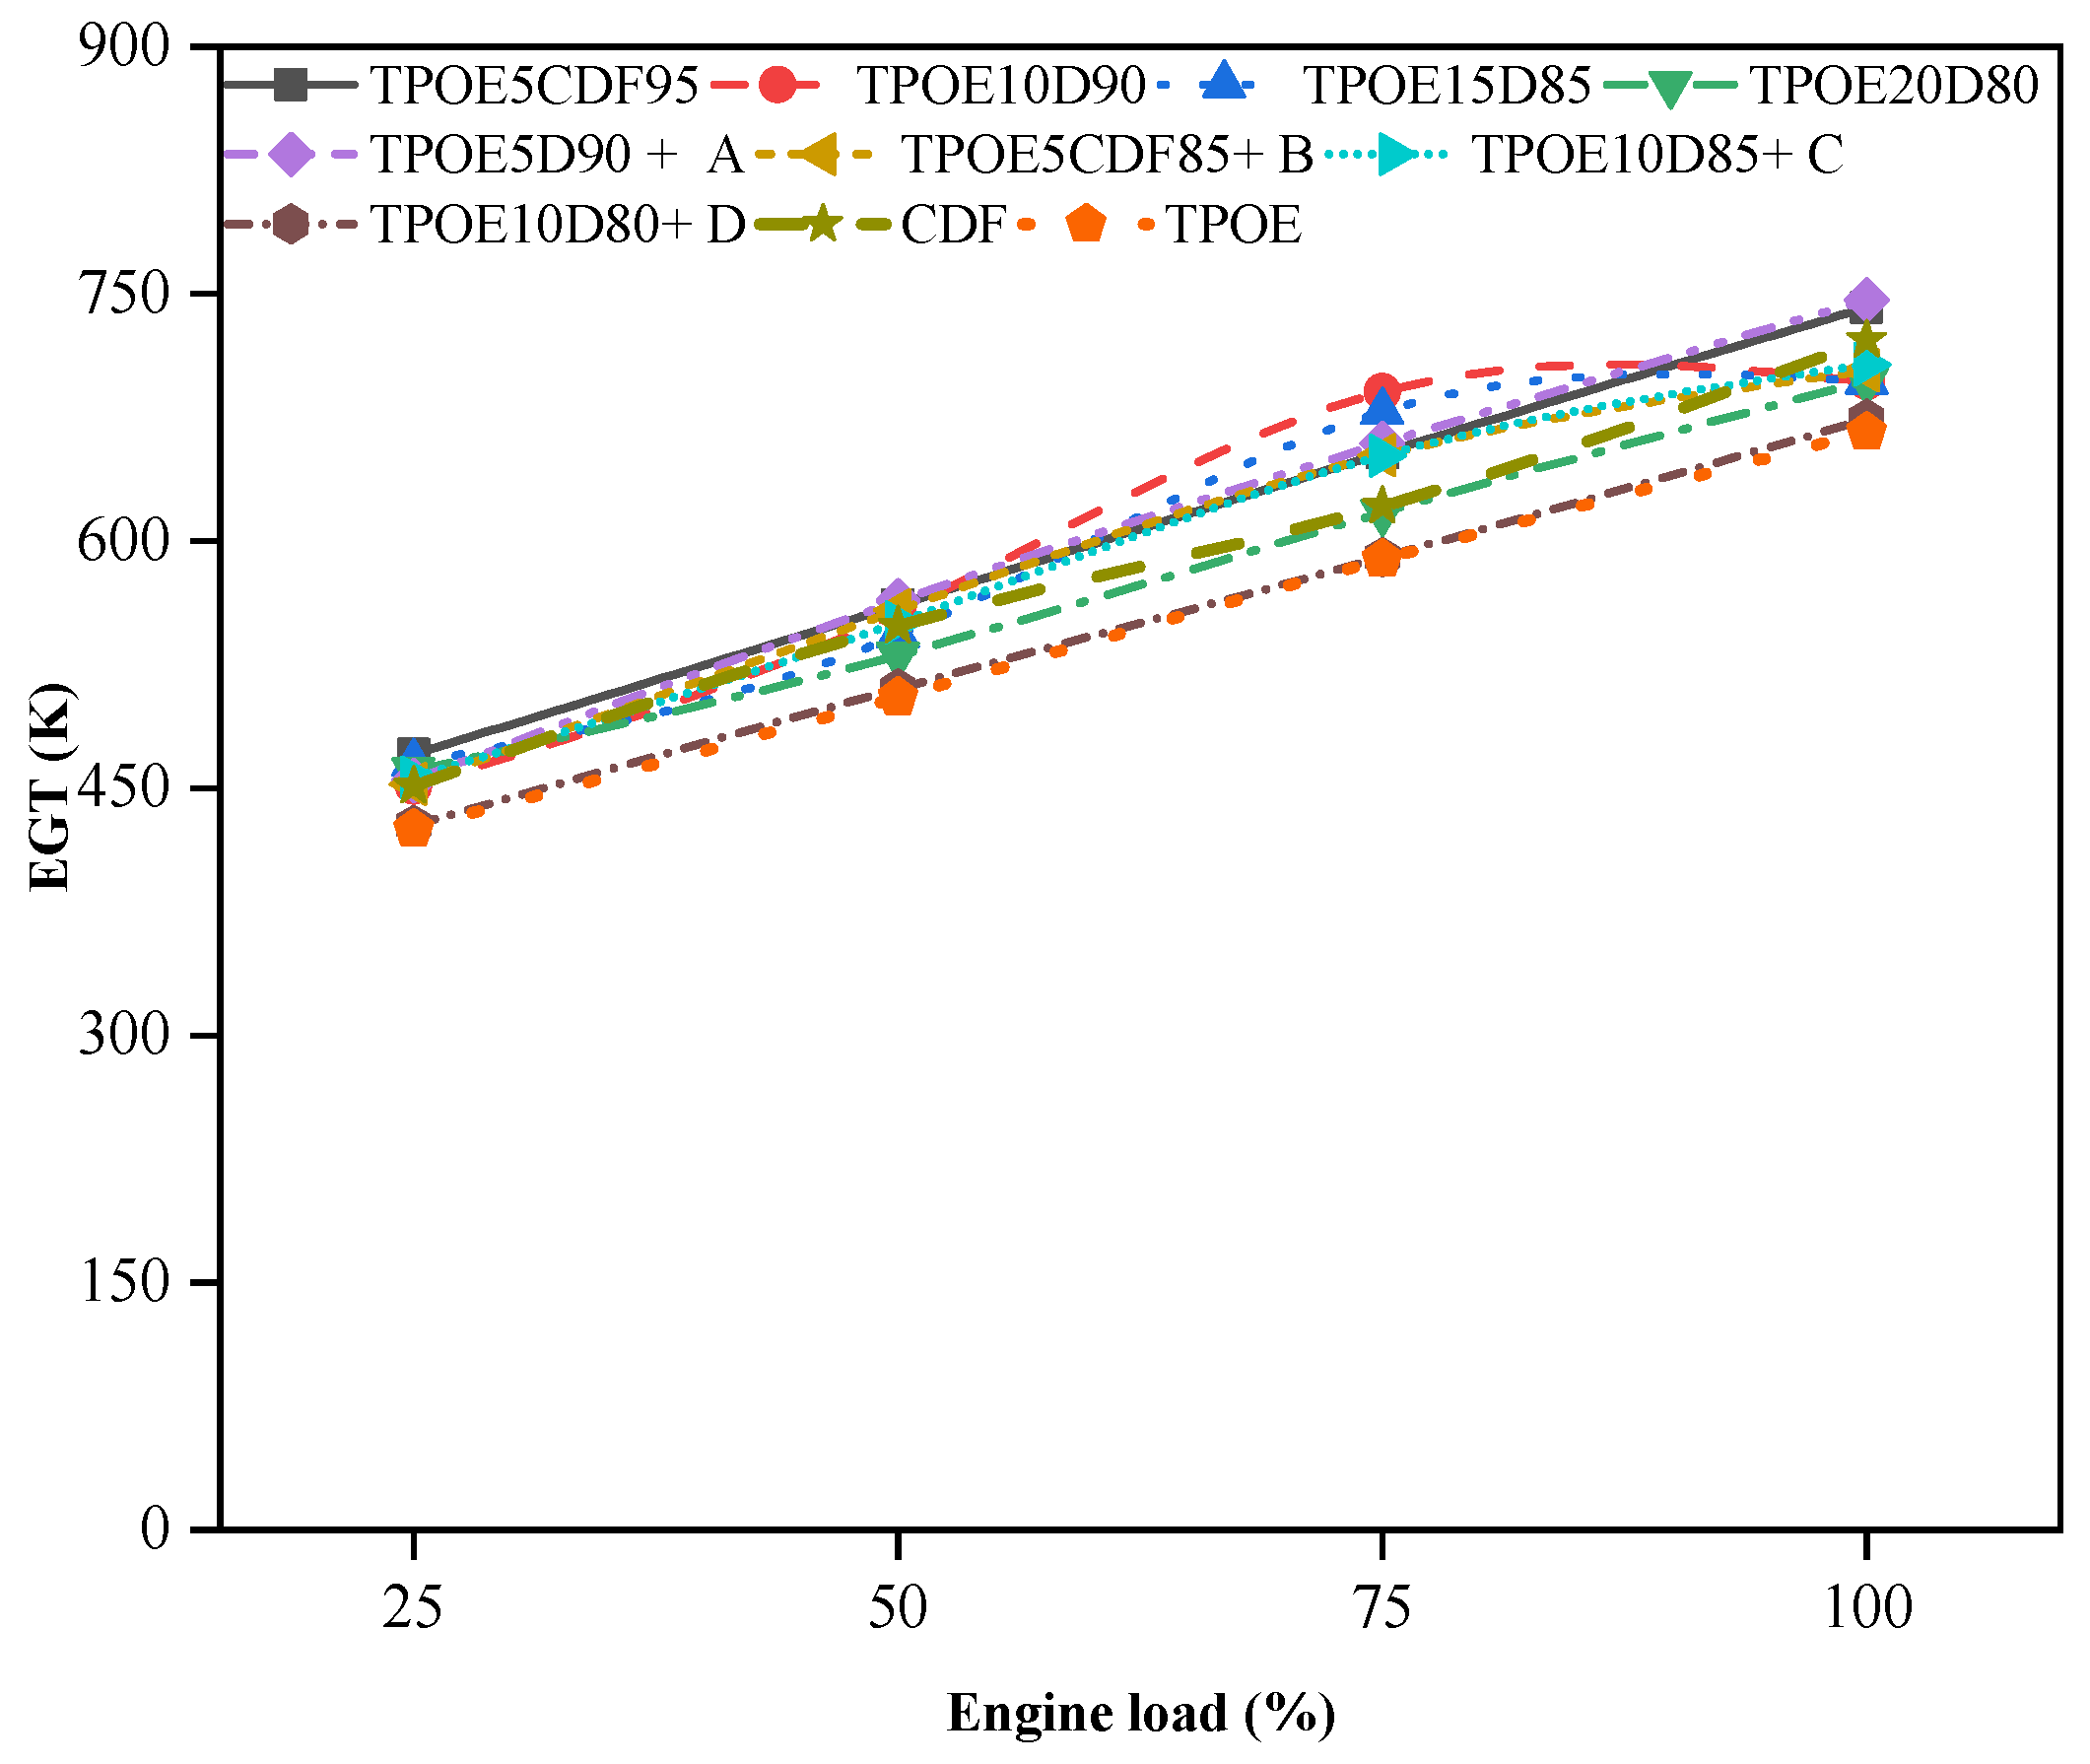
Figure 8 illustrates the exhaust gas temperature (EGT) vs. load for the following engines: TPOE5D95, TPOE10D90, TPOE15D85, TPOE20D80, TPOE5D90 + A, TPOE5D85 + B, TPOE10D85 + C, TPOE10D80 + D, CDF, and TPOE. The addition of more CeO2 nano-additives enhances the EGT at a full load compared to diesel fuel but less so for the TPOE10D80 + CeO2 100 ppm fuel blend. At 100% load, it was determined that the values of EGT for TPOE5D95, TPOE10D90, TPOE15D85, TPOE20D80, TPOE5D90 + A, TPOE5D85 + B, TPOE10D80 + C, TPOE10D80 + D, CDF, and TPOE were 741.6, 696.89, 696.79, 696.91, 746.1, 703.44, 706.88, 673.97, 721.9, and 666.01K. Due to an enhancement in ignition, the EGT reduced as the percentage of nano-additives in the blend increased. Due to improved ignition properties, the EGT falls for the entire load as the number of nano-additive particles in tyre oil–diesel fuel blends increase [29,30]. Because the chamber gas temperature was lower in the tyre oil alternative–diesel fuel blend than in the diesel fuel, the EGT was reduced [31].

3.2. Combustion Characteristics

3.2.1. Chamber Pressure

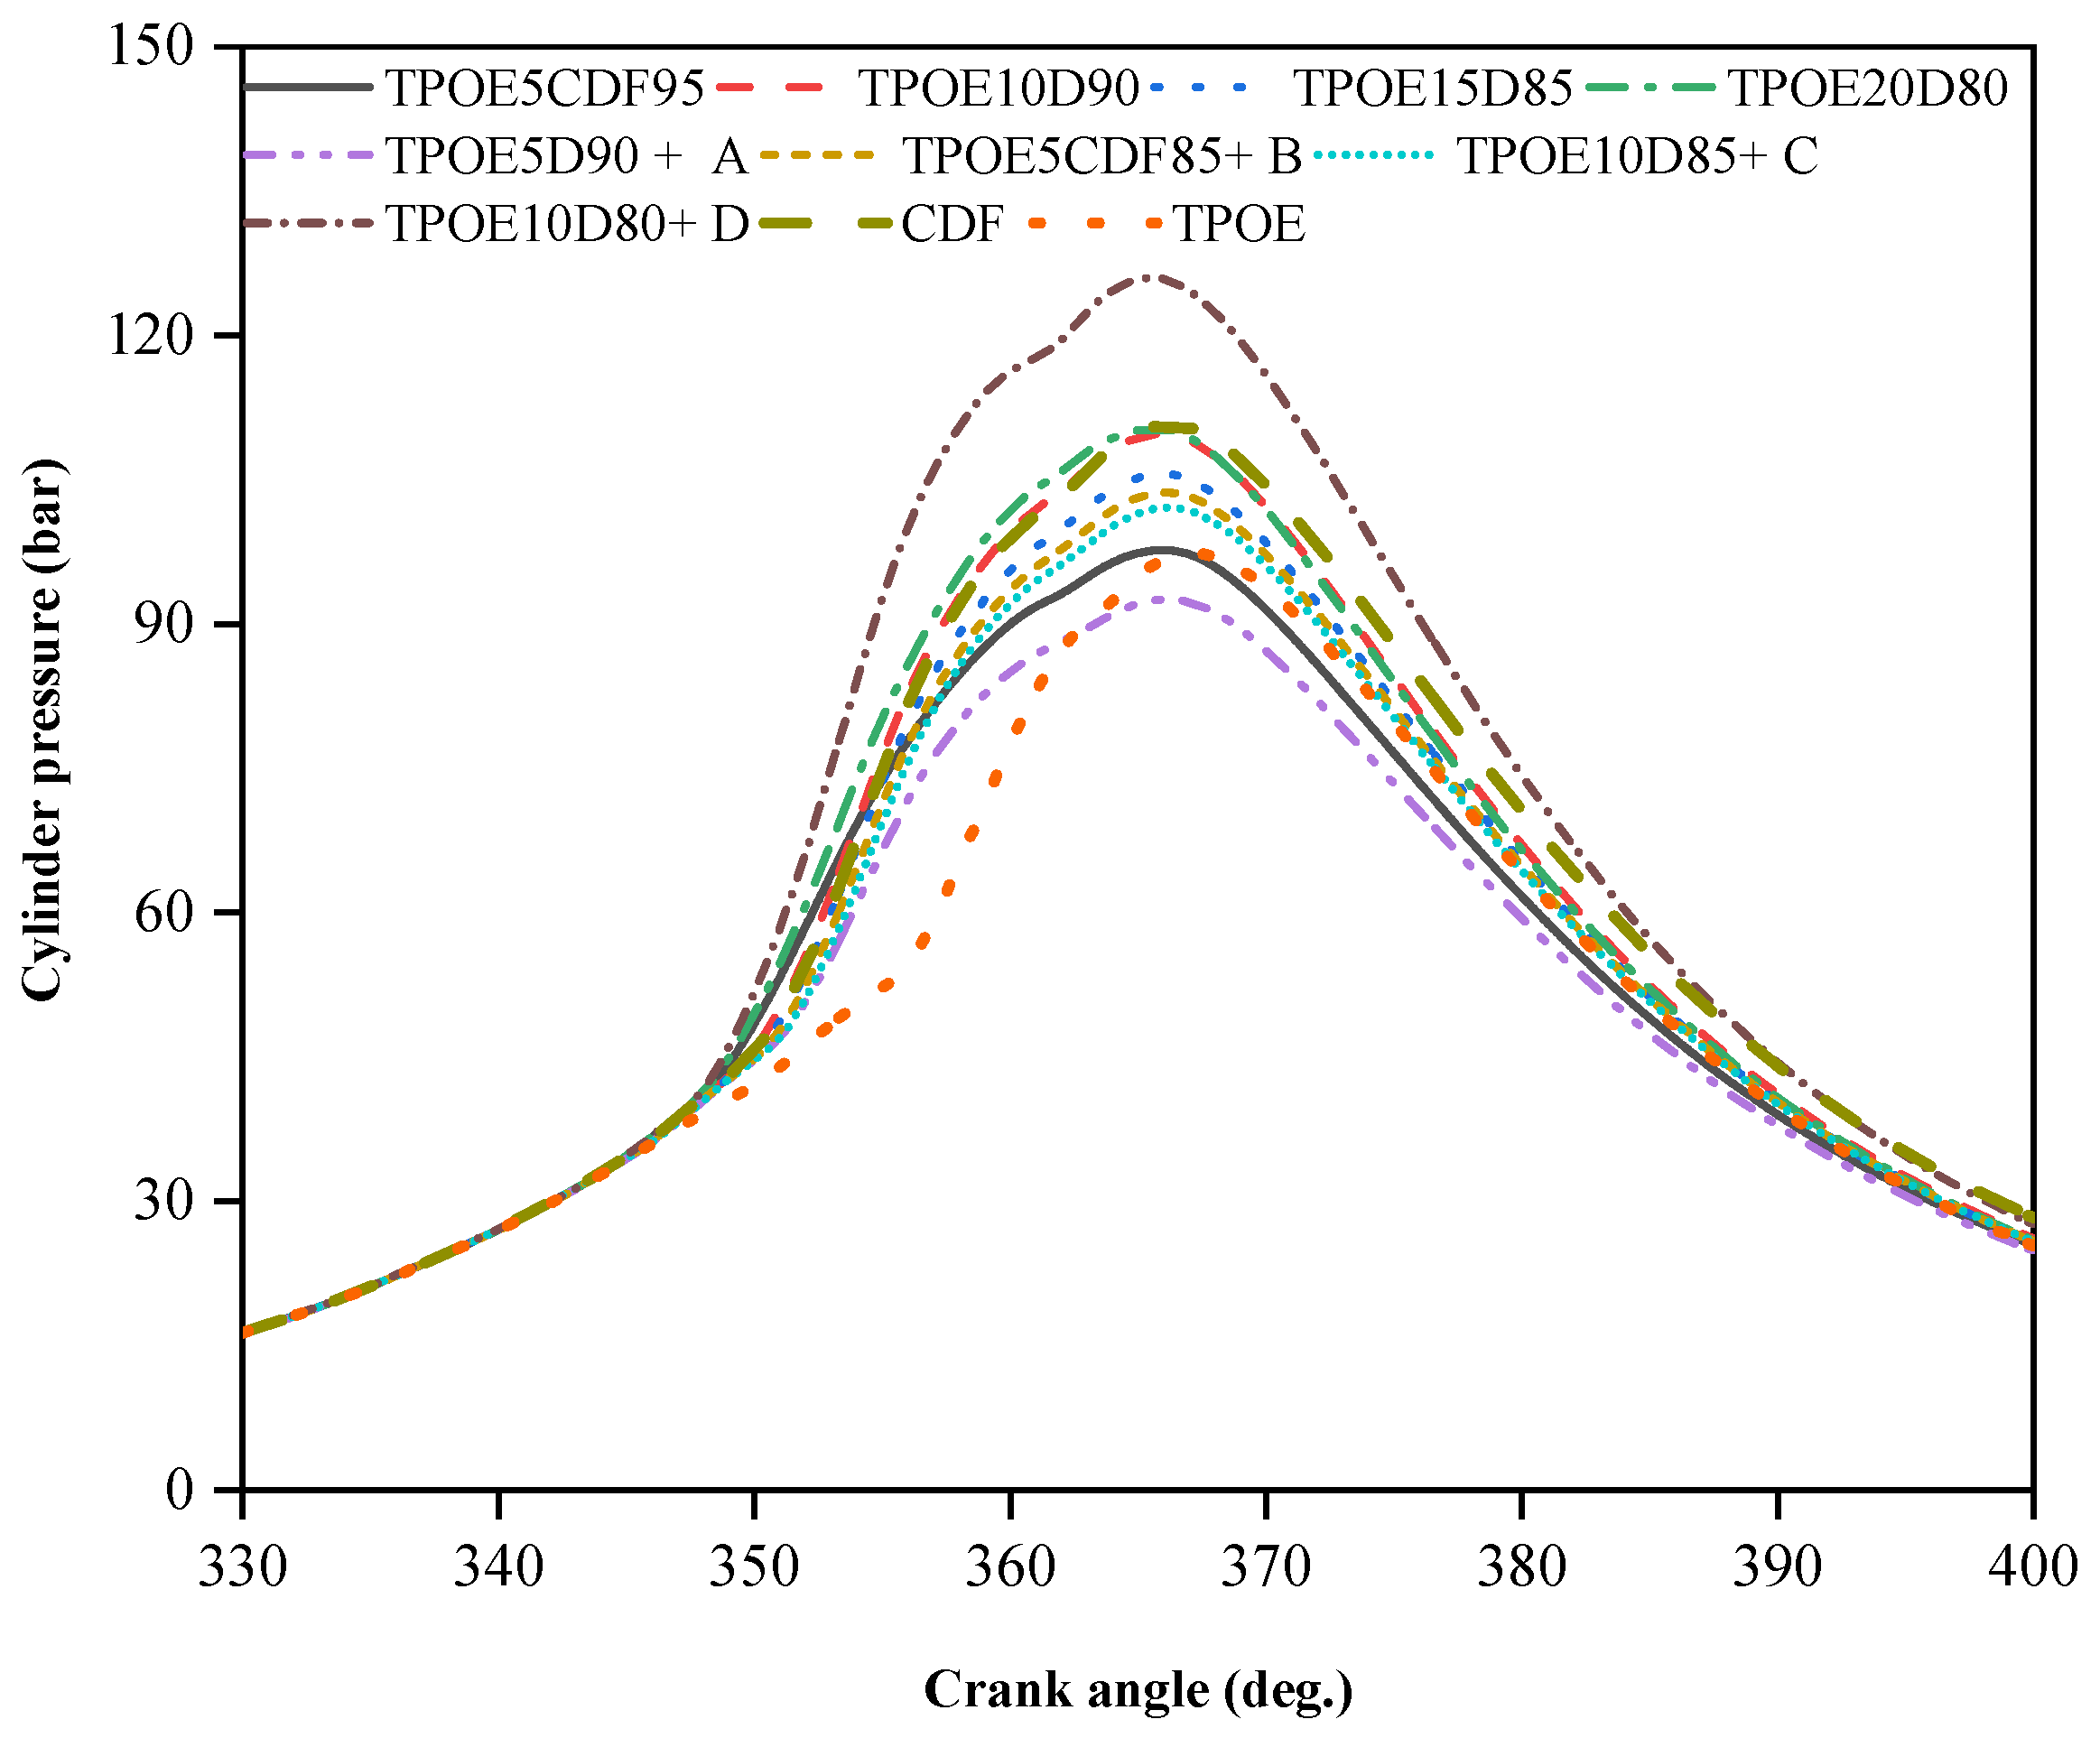
Figure 9 illustrates the relationship between in-chamber pressure (ICP) and the crank angle for the following: TPOE5D95, TPOE10D90, TPOE15D85, TPOE20D80, TPOE5D90 + A, TPOE5D85 + B, TPOE10D85 + C, TPOE10D80 + D, CDF, and TPOE. The heat value decreased with increased TPOE, and the peak chamber pressure was reduced. Because of enhanced ignition, the chamber pressure rises as the load rises [32,33]. The peak chamber pressure for TPOE5D95, TPOE10D90, TPOE15D85, TPOE20D80, TPOE5D90 + A, TPOE5D85 + B, TPOE10D85 + C, TPOE10D80 + D, CDF, and TPOE was found to be 97.85, 109.97, 105.8, 110.5, 92.72, 103.84, 102.3, 126.1, 110.88, and 97.58 bar. According to the graph, the chamber pressure for 10% of TPOE with 80% of CDF with CeO2 (100 ppm) is higher than that for TPOE, CDF, and their mixtures. The chamber pressure reduces by 0.34% (TPOE20D80) compared to diesel when the percentage of tyre oil fuel is increased from 0% to 20% but increases by 12.0% with TPOE10D80 + CeO2 (100 ppm). At higher loads, the peak cylinder pressure was lower with the tyre oil alternative than with diesel fuel due to the calorific value [34].

3.2.2. Heat Release Rate

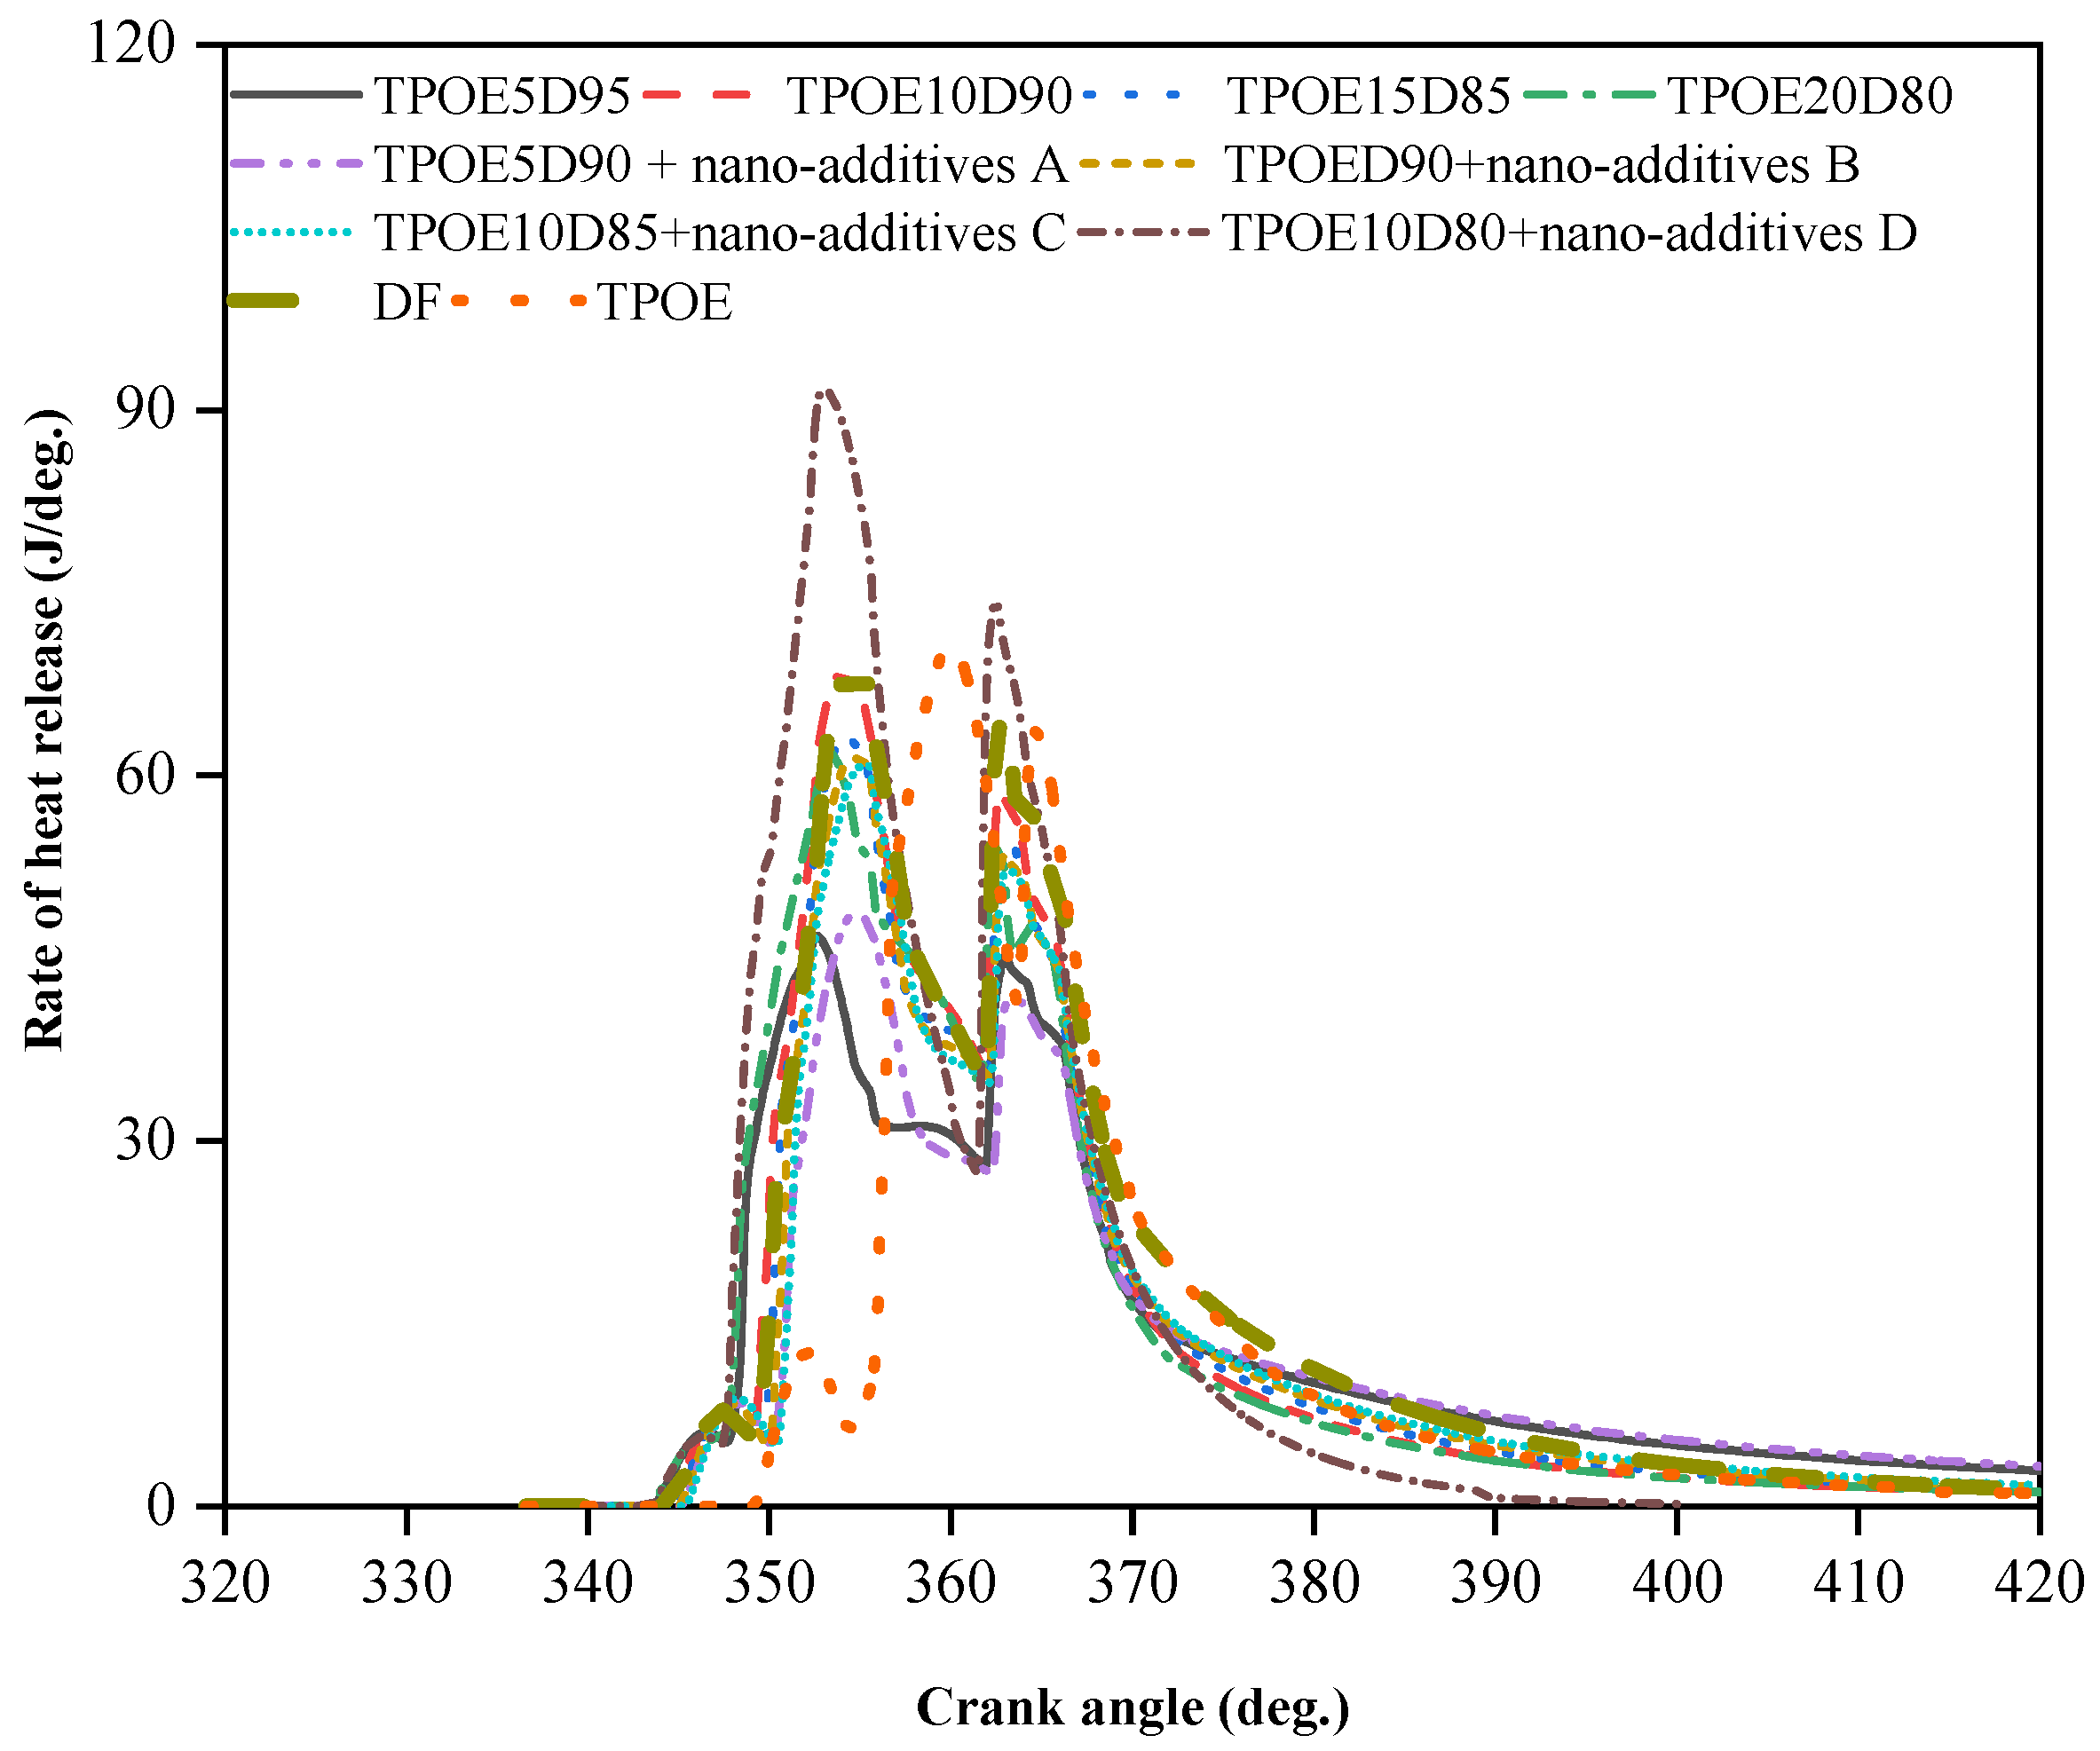
Figure 10 illustrates the relationship between the in-chamber heat release rate (ICHRR) and the crank angle for the following engine types: TPOE5D95, TPOE10D90, TPOE15D85, TPOE20D80, TPOE5D90 + A, TPOE5D85 + B, TPOE10D80 + C, CDF, and TPOE. At a full load, the peak ICHRR is enhanced in blends with higher oxide nano-additives compared to blends with tyre fuel. PCHRR values for TPOE5D95, TPOE10D90, TPOE15D85, TPOE20D80, TPOE5D90 + A, TPOE5D85 + B, TPOE10D85 + C, TPOE10D80 + D, CDF, and TPOE were determined to be 46.93, 68.4, 63.24, 62.8, 48.5, 61.2, 60.91, 89.97, 68.7, and 70.3 J/degree. When the amount of TPOE blending is enhanced from 0% to 20%, the chamber heat release rate (TPOE20D80) falls by 8.5% compared to CDF; however, it grows by 23.6% for TPOE10D80 + D. As the load increases, the peak chamber heat release rate rises faster with tyre oil replenishment than with diesel fuel [33,34].

3.2.3. Ignition Delay Period

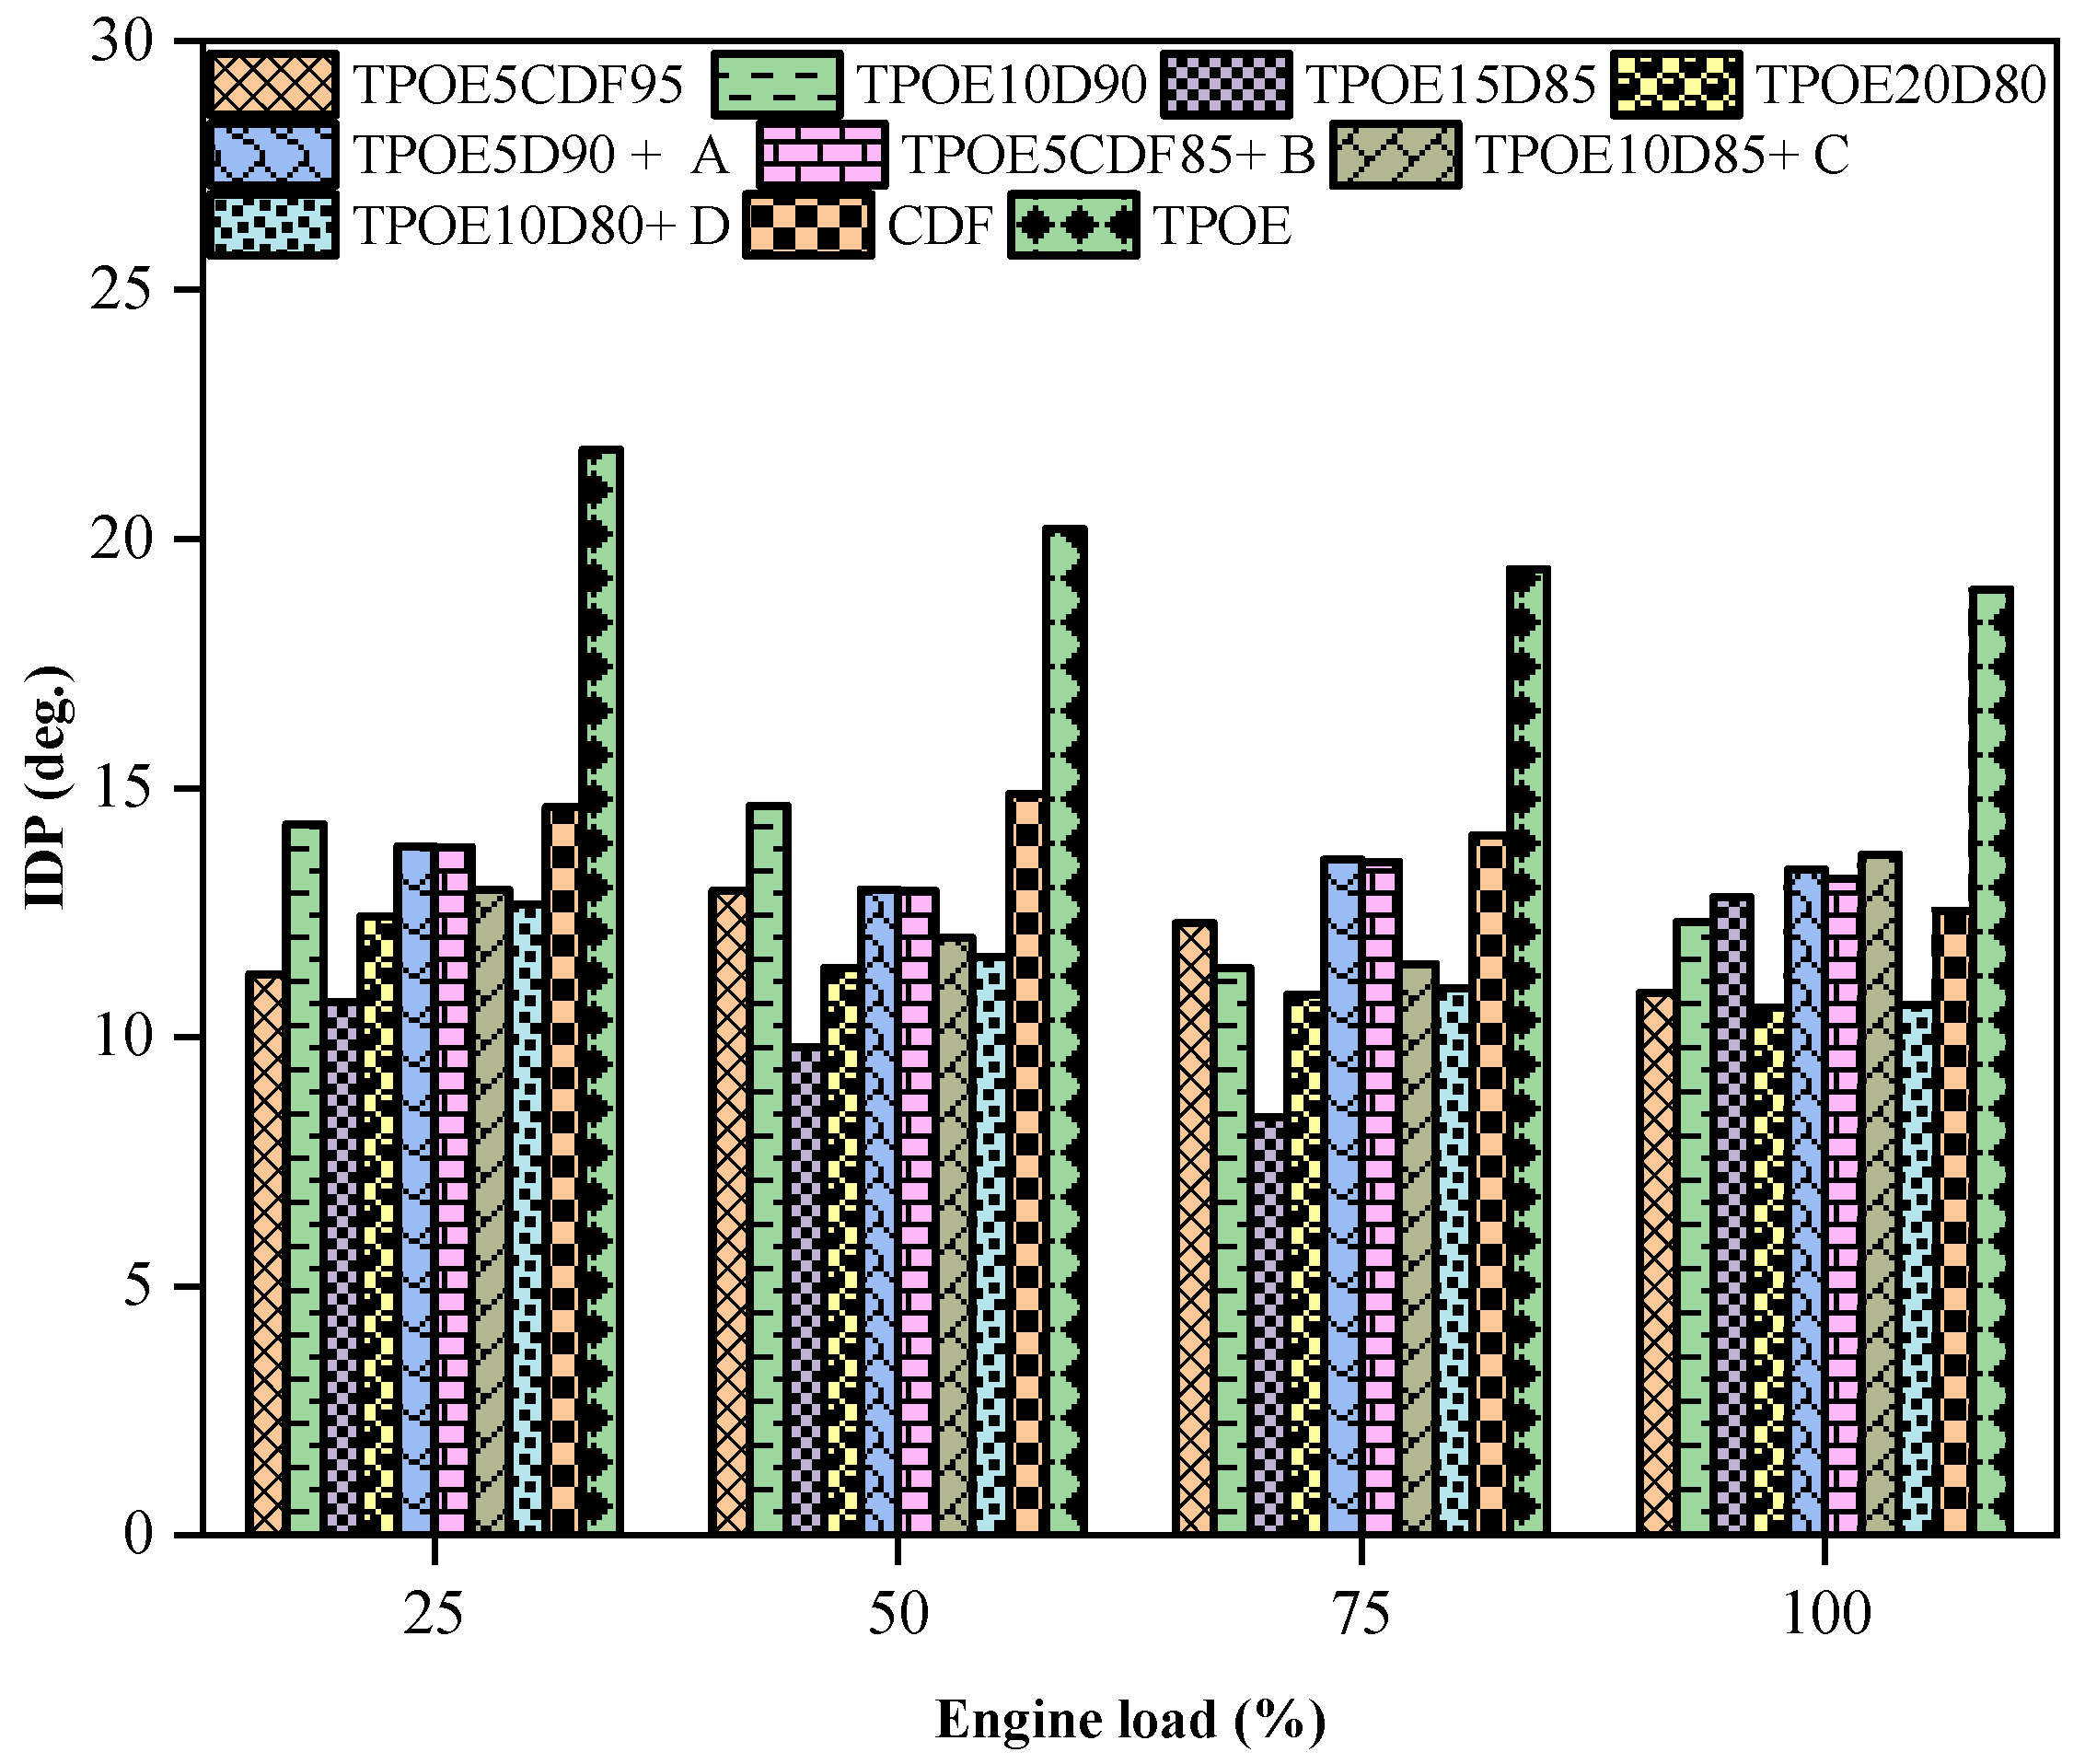
In Figure 11, the assessment of the ignition delay period (IDP) in relation to the loads for the following TPOEs is depicted: TPOE5D95, TPOE10D90, TPOE15D85, TPOE20D80, TPOE5D90 + A, TPOE5D85 + B, TPOE10D85 + C, TPOE10D80 + D, CDF, and TPOE. The use of more oxide nano-additives enhances the IDP at a full load, associated with fuel mixtures. At higher loads, it was determined that the values of IDP for TPOE5D95, TPOE10D90, TPOE15D85, TPOE20D80, TPOE5D90 + A, TPOE5D85 + B, TPOE10D85 + C, TPOE10D80 + D, CDF, and TPOE were 10.88, 12.32, 12.81, 10.9, 13.4, 13.2, 13.66, 10.65, 12.43, and 18.89 degree. The ignition delay increased by 9.0% for TPOE10D80 + D but by 7.23% for TPOE20D80 when the percentage of the tyre oil alternative fuel grew from 0% to 20%. The ignition delay rate increases more rapidly with the tyre oil alternative than with diesel fuel at higher loads [33,34].

3.3. Emission Characteristics

3.3.1. Oxides of Nitrogen Discharge

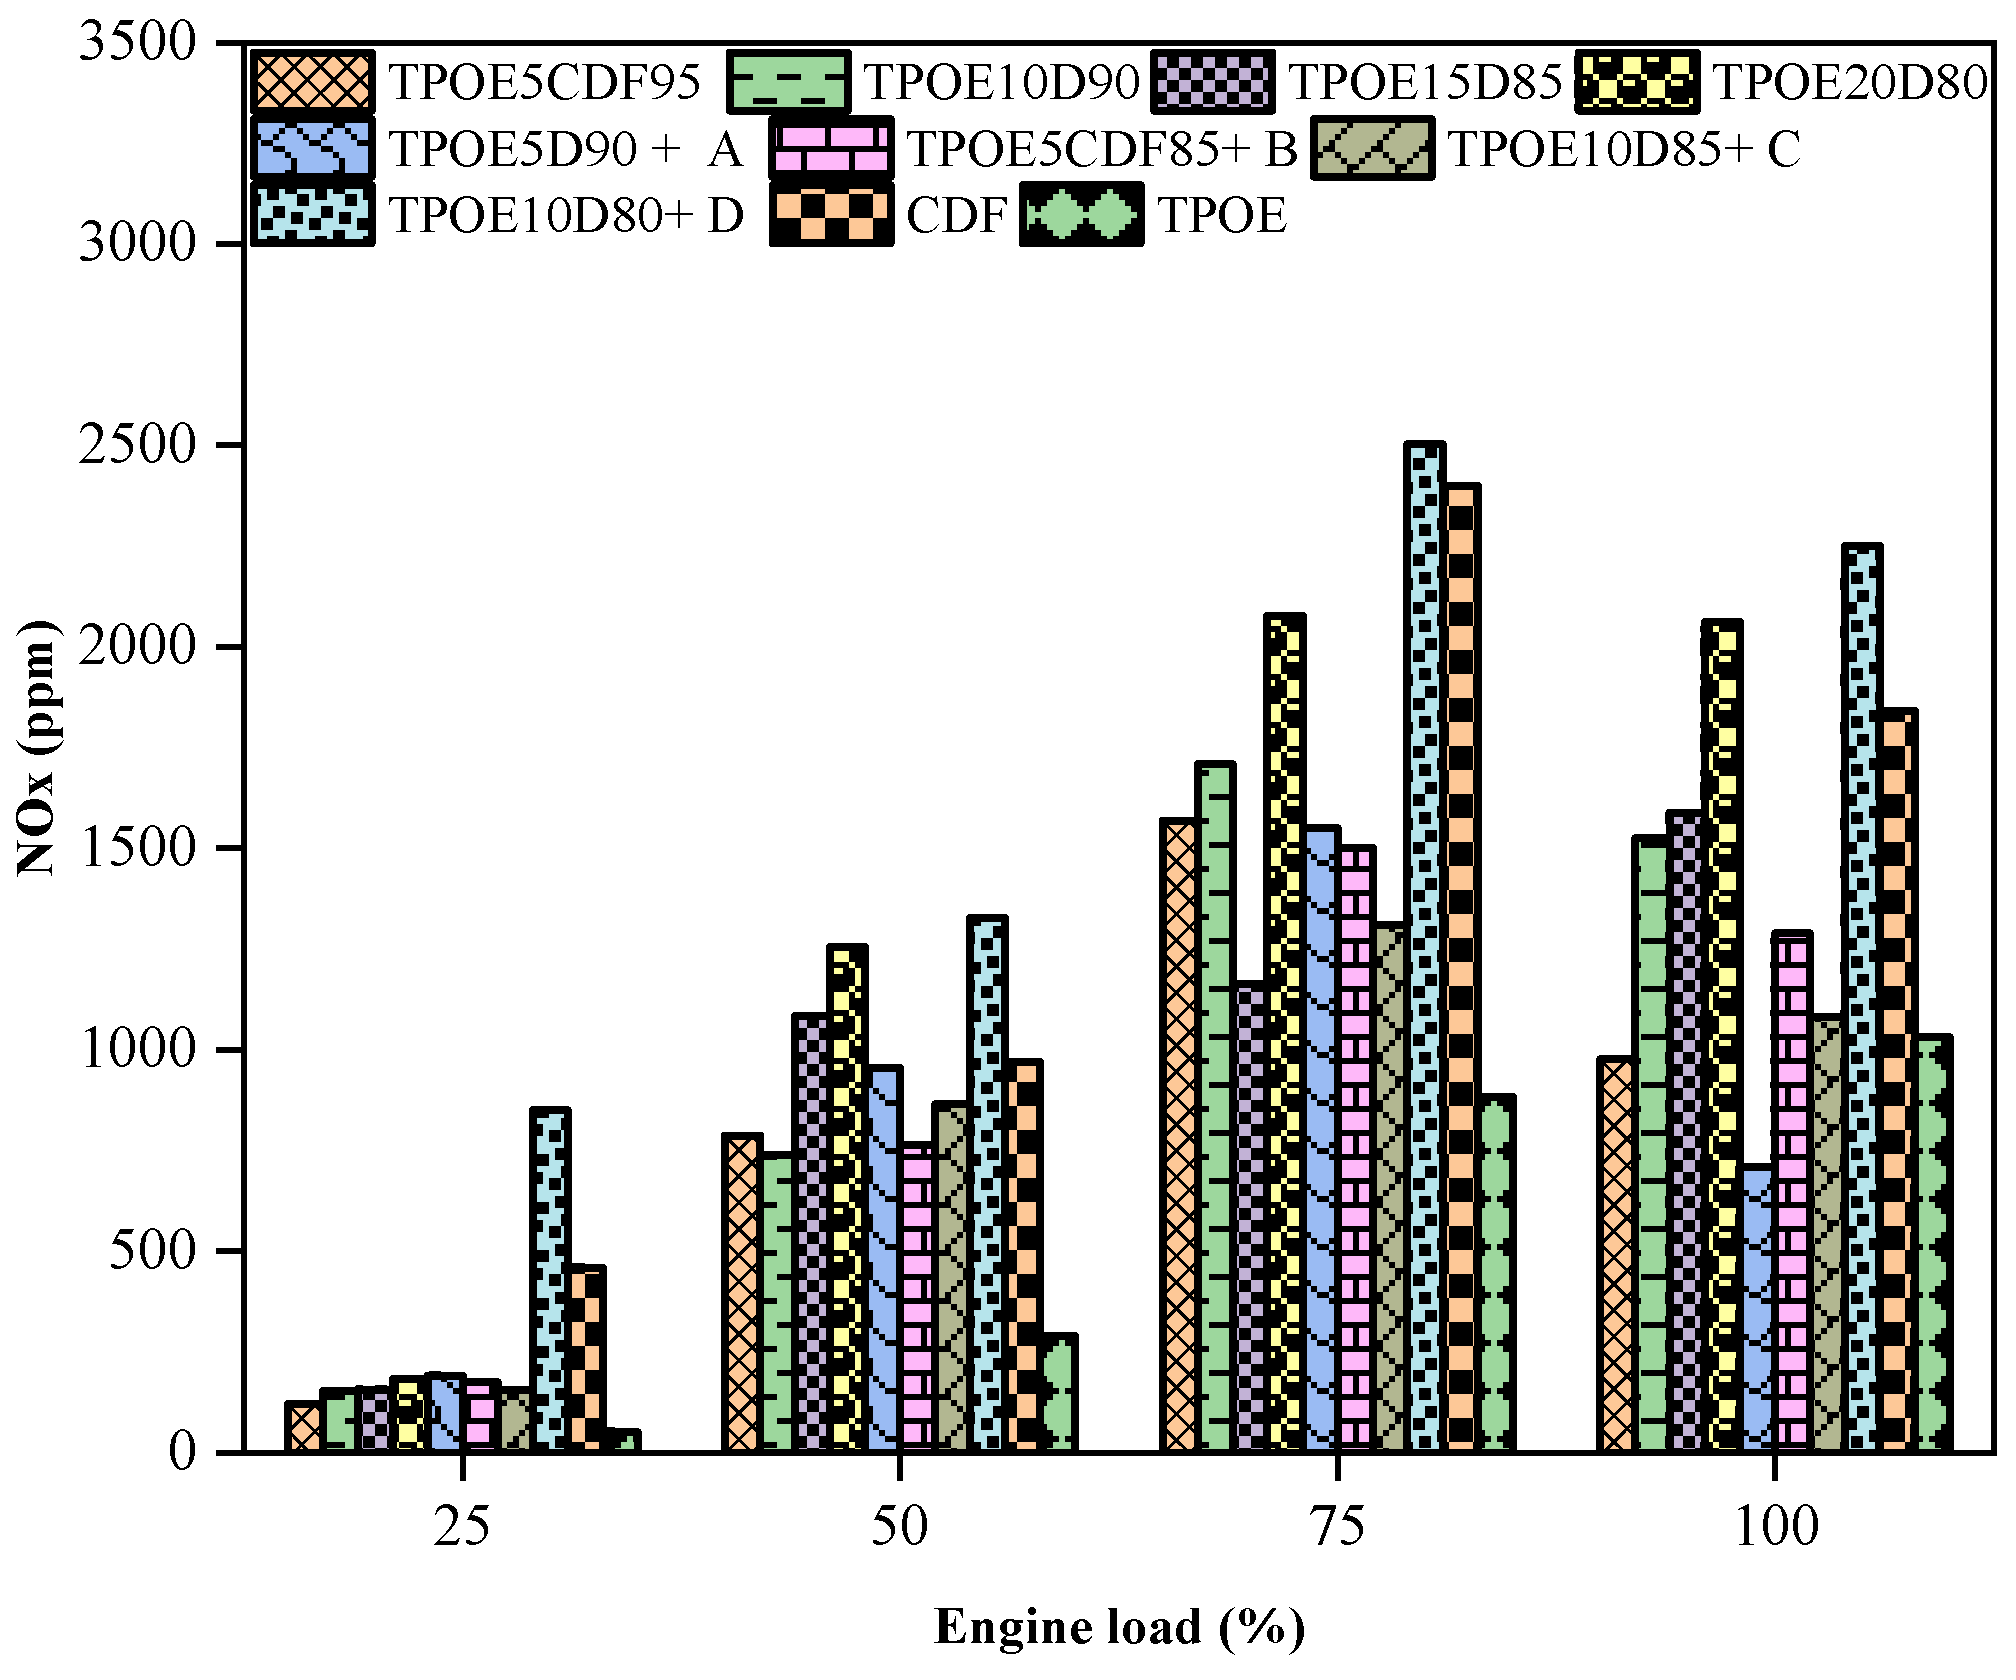
Figure 12 illustrates the relationship between load and the assessment of nitrogen oxide (NOx) discharge for TPOE5D95, TPOE10D90, TPOE15D85, TPOE20D80, TPOE5D90 + A, TPOE5D85 + B, TPOE10D85 + C, TPOE10D80 + D, CDF, and TPOE. When associated with CCDF and TPOE mixtures, NOx was reduced for TPOE5D90 + A, TPOE5D85 + B, and TPOE10D85 + C at the full load condition due to the increase in CeO2 in the mixtures. The decreased nitrogen is because the chemicals’ functional groups show that the firing process needs to be finished. NOx values were determined to be 6.04, 9.11, 9.75, 12.54, 4.53, 7.8, 6.61, 26.41, 9.61, and 6.52 g/kWh for TPOE5D95, TPOE10D90, TPOE15D85, TPOE20D80, TPOE5D90 + A, B, and C, TPOE10D80 + D, CDF, and TPOE, respectively, at a 100% load. Due to an increase in the ignition temperature, NOx discharges rose as the load increased [34,35,36]. The use of additives reduced the NOx discharges from the tyre oil–diesel fuel blends when compared to diesel engine discharges. The TPOE10D80 + nano-additive D emission had the greatest NOx emission at 26.41 g/kWh. In comparison to other test blend ratios, TPOE5D90 + A had the lowest NOx emission at 4.53 g/kWh. The shortest NOx discharges come from a combination of ceramic nano-additives, while the longest come from a combination of diesel that is almost identical to diesel. The main factors impacting NOx discharges are the fuel ignition temperature, load, and fuel mixtures [37,38,39]. The NOx emission figure with engine loads shows that the NOx emission rises as the engine load increases. The amount of gasoline pumped into the cylinder affects the combustion temperature, which rises with an increased engine load. NOx production is dynamically influenced by the temperature of combustion and the amount of oxygen present. Greater NO production rates are caused by greater combustion temperatures and the gases’ residence time at those temperatures.
Because cerium oxide (CeO2) serves as both a combustion catalyst and an oxygen buffer, its effects on NOx emissions in diesel and waste tyre oil mixes show a complex trend. By releasing active oxygen during combustion [40,41] CeO2 nanoparticles improve the oxidation of hydrocarbons and soot precursors through their Ce3+/Ce4+ redox cycle. In most cases, this results in lower emissions of CO, HC, and smoke. Because the catalyst facilitates effective oxidation without appreciably increasing in-cylinder temperatures, the enhanced combustion stability and reduced ignition delay at lower blending ratios of tyre oil with diesel (usually 5–10%) lead to decreased NOx emissions. However, CeO2 speeds up the oxidation of the heavier material [40].

3.3.2. Smoke Emission

Figure 13 depicts smoke emission (1/m) values as a function of load for TPOE5D95, TPOE10D90, TPOE15D85, TPOE20D80, TPOE5D90 + A, TPOE5D85 + B, TPOE10D85 + C, TPOE10D80 + D, CDF, and TPOE. The addition of CeO2 to the mixtures enhances the smoke output at a full load. At the full load condition, smoke was determined to be 1.42, 1.00, 0.972, 0.954, 1.511, 1.033, 1.091, 0.63, 3.65, and 1.06 1/m for TPOE5D95, TPOE10D90, TPOE15D85, TPOE20D80, TPOE5D90 + A, TPOE5D85 + B, TPOE10D85 + C, TPOE10D80 + D, CDF, and TPOE, respectively. Due to the oxide nano-additives and TPOE-CDF mixture, smoke emission grows with a greater load. The enhanced complete ignition and longer penetration duration of the blends, compared to diesel fuel, result in reduced smoke emissions. All fuel mixes investigated in the present experiment produce more smoke at higher loads due to TPOE’s enhanced ignition [38,42].

3.3.3. Summary of Emission

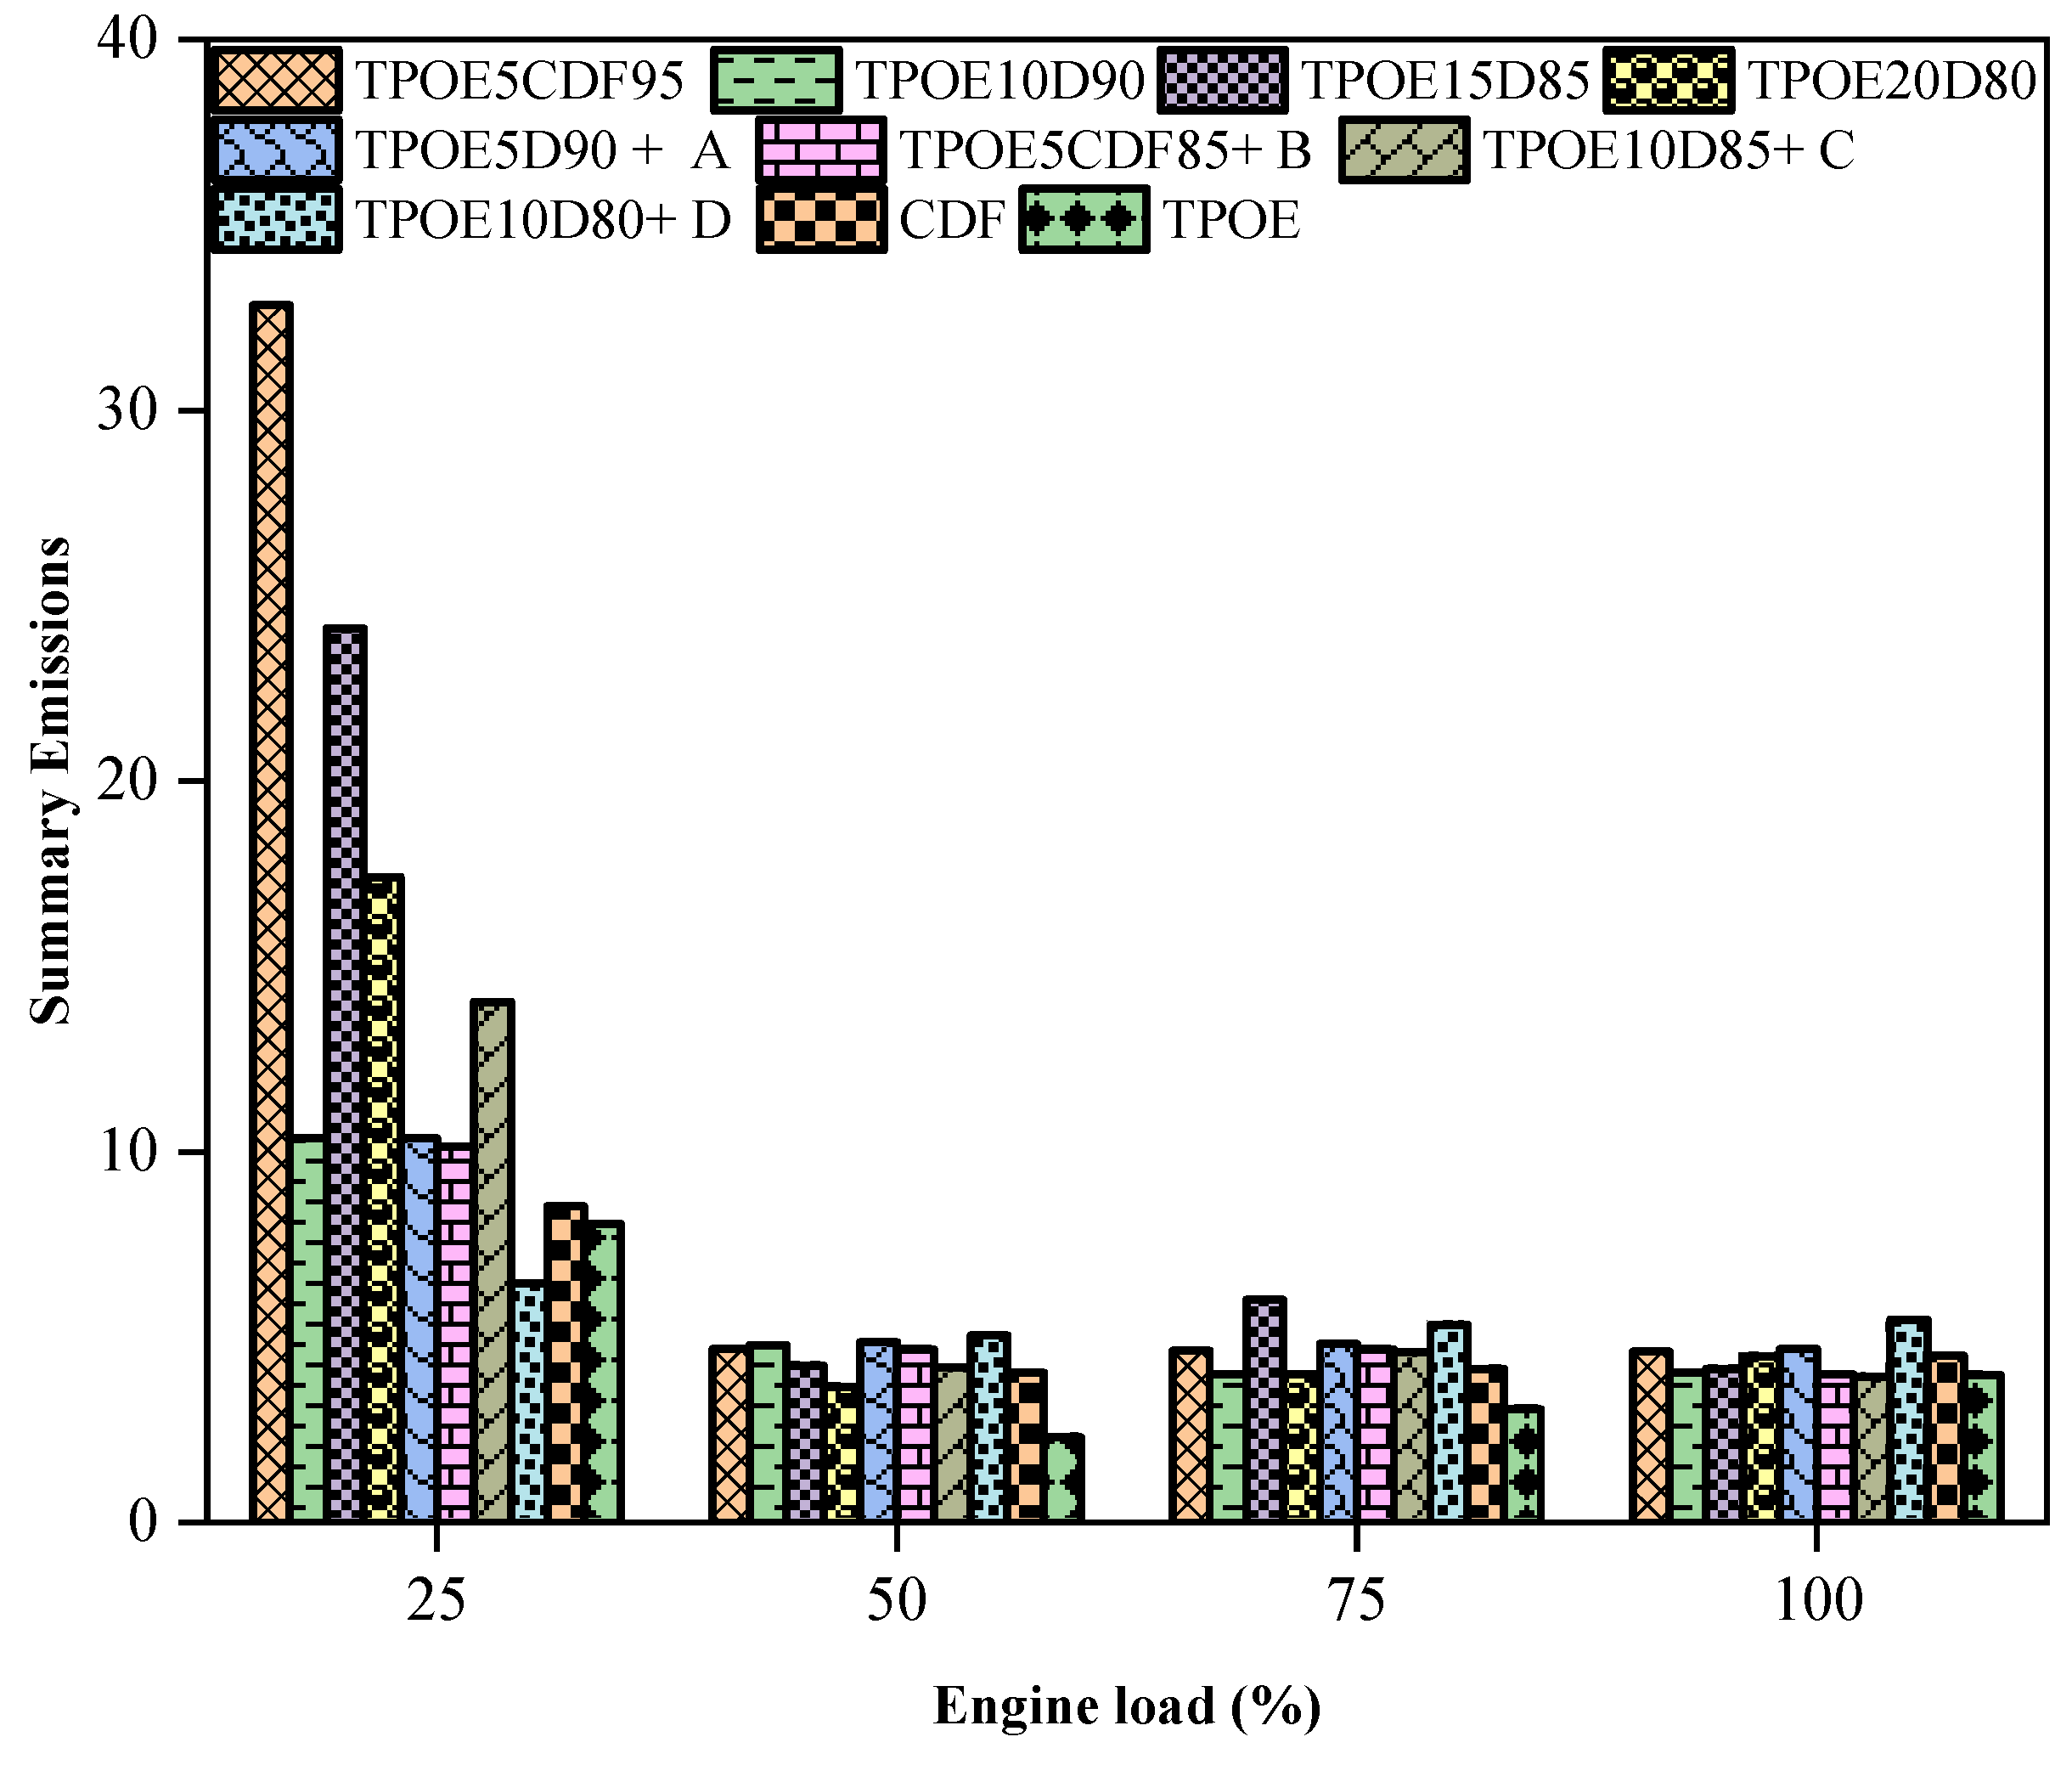
Figure 14 displays the value of the SOE (summary of emission) vs. load for the following compounds: TPOE5D95, TPOE10D90, TPOE15D85, TPOE20D80, TPOE5D90 + A, TPOE5D85 + B, TPOE10D85 + C, TPOE10D80 + D, CDF, and TPOE. The SOE is improved at a full load by the accumulation of more CeO2 in the mixtures. At a 100.0% load, it was determined that the values of BTE for TPOE5D95, TPOE10D90, TPOE15D85, TPOE20D80, TPOE5D90 + A, TPOE5D85 + B, TPOE10D85 + C, TPOE10D80 + D, CDF, and TPOE were 4.6, 4.04, 4.21, 4.48, 4.68, 3.93, and 5, respectively. Compared to 100% of diesel, the 100 ppm additive particle with tyre oil–alternative fuel has the shortest summary of discharges.

4. Conclusions

The impacts of CeO2 with 50 ppm and 100 ppm and a diesel–tyre pyrolysis oil substitute on engine characteristics were simulated numerically. The concise findings were the following:
  • Utilizing tyre pyrolysis oil for alternative production will contribute greatly to environmental compensations and provide an alternative to releasing the tyre pyrolysis oil into the environment.
  • Adding nano-additive (CeO2) particles to diesel–tyre pyrolysis oil enhances brake thermal efficiency and chamber pressure while reducing SFC.
  • Increasing the proportion of tyre pyrolysis oil in blends has negative effects, including lengthening the ignition delay duration, increasing SFC, and decreasing EGT.
  • With the TPOE10D80 + D nano-additive gasoline sample, reduced fuel consumption and enhanced thermal brake efficiency were observed (100 ppm).
  • As the amount of tyre pyrolysis oil in blends increases, emissions of nitrogen oxide and smoke are decreased. Additionally, the addition of CeO2 to TPOE blends demonstrates an inverse propensity for NOX emission.
  • When increasing volumes of tyre pyrolysis oil are added to blends, the total discharges are lower than when 50 ppm and 100 ppm CDF and ceramic oxide are added, respectively.
  • This research may increase the use of compression ignition engines and a unique mix that blends 100 ppm of tyre pyrolysis oil alternative with ceramic oxide.
The limitations of this study should be critically discussed. Specifically, the possibility of nanoparticle aggregation could impair combustion efficiency and decrease dispersion stability. Because nanoparticles are abrasive, they may hasten the wear of cylinder and fuel injector components, raising concerns about long-term engine durability. Furthermore, given the expenses of preparation, stabilization, and large-scale applications, it is still unclear if utilizing CeO2 additions is economically feasible. A more accurate and balanced evaluation of the study’s practical consequences will result from addressing these limitations.

Author Contributions

Conceptualization, investigation, K.S.M.; methodology, S.A.H.; investigation, resources, data curation, writing—original draft preparation; R.K.; software, validation, formal analysis, writing—original draft preparation, funding acquisition, U.R.; writing—review and editing, visualization, supervision; project administration, T.N.V. All authors have read and agreed to the published version of the manuscript.

Funding

This research received no external funding.

Conflicts of Interest

The authors declare no conflict of interest.

Nomenclature

BTEBrake thermal efficiency
BMEPBrake mean effective pressure
IMEPIndicated mean effective pressure
SFCSpecific fuel consumption
D-RKDiesel-RK
CDFConventional diesel fuel
CeO2Ceramic oxide
CICompression ignition
EGTExhaust gas temperature
SMDDiameter of drops
TPOE5D955% of TPOE + 95% CDF
TPOE10D9010% of TPOE and 90% CDF
TPOE15D8515% of TPOE and 85% CDF
TPOE20D8020% of TPOE and 80% CDF
TPOE5CDF90 + A5% of TPOE and 90% CDF + CeO2 50 ppm
TPOE5CDF85 + B5% of TPOE and 85% CDF + CeO2 100 ppm
TPOE10CDF85 + C10% of TPOE and 85% CDF + CeO2 50 ppm
TPOE10CDF80 + D10% of TPOE and 80% CDF + CeO2 100 ppm
TPOETyre pyrolysis oil energy
SOESummary of emission
A0, A2, A3Empirical factors
BSNBosch Smoke Number
BNBosh number
CCarbon
CNCetane number
EaActivation energy, kJ/k. mole
KTTemperature, K
mTotal mass, kg
m f ˙ Mass flow rate, kg/s
nSpeed, rpm
pPressure, bar
PbEngine power, kW
PmaxMaximum chamber pressure, bar
PMParticulate matter
qcCycle fuel mass
RGas constant, J/mole. K
TTemperature, K
TbBurnt gas zone, K
VVolume chamber, cm3
V p Mean velocity of piston, m/s
x0Fraction of burnt fuel (ignition delay)
xFraction of fuel burnt
α, β, λConstants
τTime, s
ξbAir charge usage efficiency
ρDensity, kg/m3
Φ0, Φ1, Φ2, Φ3Constant
σu, σudFuel fractions evaporated during ignition delay period
dx/dtHeat release rate, 1/degree
ωAngular crank velocity, rpm

References

  1. Kumar, K.; Kannan, M.; Nataraj, G. A study on performance, emission and combustion characteristics of diesel engine powered by nano-emulsion of waste orange peel oil biodiesel. Renew. Energy 2020, 146, 1781–1795. [Google Scholar] [CrossRef]
  2. Yaşar, A.; Keskin, A.; Yıldızhan, Ş.; Uludamar, E. Emission and vibration analysis of diesel engine fuelled diesel fuel containing metallic based nanoparticles. Fuel 2019, 239, 1224–1230. [Google Scholar] [CrossRef]
  3. Vinukumar, K.; Azhagurajan, A.; Vettivel, S.C.; Vedaraman, N.; Lenin, A.H. Biodiesel with nano additives from coconut shell for decreasing emissions in diesel engines. Fuel 2018, 222, 180–184. [Google Scholar] [CrossRef]
  4. Ghanbari, M.; Najafi, G.; Ghobadian, B.; Yusaf, T.; Carlucci, A.P.; Kiani, D.K.M. Performance and emission characteristics of a CI engine using nano particles additives in biodiesel-diesel blends and modeling with GP approach. Fuel 2017, 202, 699–716. [Google Scholar] [CrossRef]
  5. Ardebili, S.M.S.; Taghipoor, A.; Solmaz, H.; Mostafaei, M. The effect of nano-biochar on the performance and emissions of a diesel engine fueled with fusel oil-diesel fuel. Fuel 2020, 268, 117356. [Google Scholar] [CrossRef]
  6. Gharehghani, A.; Pourrahmani, H. Performance evaluation of diesel engines (PEDE) for a diesel-biodiesel fueled CI engine using nano-particles additive. Energy Convers. Manag. 2019, 198, 111921. [Google Scholar] [CrossRef]
  7. Khalife, E.; Tabatabaei, M.; Najafi, B.; Mostafa, S. A novel emulsion fuel containing aqueous nano cerium oxide additive in diesel—Biodiesel blends to improve diesel engines performance and reduce exhaust emissions: Part I—Experimental analysis. Fuel 2017, 207, 741–750. [Google Scholar] [CrossRef]
  8. Perumal, V.; Ilangkumaran, M. The influence of copper oxide nano particle added pongamia methyl ester biodiesel on the performance, combustion and emission of a diesel engine. Fuel 2018, 232, 791–802. [Google Scholar] [CrossRef]
  9. Örs, I.; Sar, S.; Atabani, A.E.; Ünalan, S.; Akansu, S.O. The effects on performance, combustion and emission characteristics of DICI engine fuelled with TiO2 nanoparticles addition in diesel/biodiesel/n-butanol blends. Fuel 2019, 234, 177–188. [Google Scholar] [CrossRef]
  10. Ettefaghi, E.; Ghobadian, B.; Rashidi, A.; Naja, G.; Hadi, M.; Rashtchi, M.; Sadeghian, S. A novel bio-nano emulsion fuel based on biodegradable nanoparticles to improve diesel engines performance and reduce exhaust emissions. Renew. Energy 2018, 125, 64–72. [Google Scholar] [CrossRef]
  11. Hasannuddin, A.K.; Yahya, W.J.; Sarah, S.; Ithnin, A.M.; Syahrullail, S.; Sidik, N.A.C.; Ramlan, N.A. Nano-additives incorporated water in diesel emulsion fuel: Fuel properties, performance and emission characteristics assessment. Energy Convers. Manag. 2018, 169, 291–314. [Google Scholar] [CrossRef]
  12. Dhanasekar, K.; Sridaran, M.; Arivanandhan, M.; Jayavel, R. A facile preparation, performance and emission analysis of pongamia oil based novel biodiesel in diesel engine with CeO2: Gd nanoparticles. Fuel 2019, 255, 115756. [Google Scholar] [CrossRef]
  13. Kumaravel, S.T.; Murugesan, A.; Vijayakumar, C.; Thenmozhi, M. Enhancing the fuel properties of tyre oil diesel blends by doping nano additives for green environments. J. Clean. Prod. 2019, 240, 118128. [Google Scholar] [CrossRef]
  14. Qi, D.H.; Ding, X.Q.; Zhao, W.B.; Yang, K. Spray characteristics and engine performance of vegetable oil–diesel–ethanol hybrid fuel. J. Energy Eng. 2021, 145, 04019011. [Google Scholar] [CrossRef]
  15. Datta, A.; Mandal, B.K. Engine performance, combustion and emission characteristics of a compression ignition engine operating on different biodiesel-alcohol blends. Energy 2017, 125, 470–483. [Google Scholar] [CrossRef]
  16. Kuleshov, A.; Mahkamov, K. Multi-zone diesel fuel spray combustion model for the simulation of a diesel engine running on biofuel. Part A: J. Power Energy 2016, 222, 309–321. [Google Scholar] [CrossRef]
  17. Mishra, S.; Anand, K.; Santhosh, S.; Mehta, P.S. Comparison of biodiesel fuel behavior in a heavy duty turbocharged and a light duty naturally aspirated engine. Appl. Energy 2017, 202, 459–470. [Google Scholar] [CrossRef]
  18. Khan, M.M.; Kadian, A.K.; Sharma, R.P.; Hasnain, S.M.M.; Mohamed, A.; Ragab, A.E.; Zare, A.; Pandey, S. Emission Reduction and Performance Enhancement of CI Engine Propelled by Neem Biodiesel-Neem Oil-Decanol-Diesel Blends at High Injection Pressure. Sustainability 2023, 15, 9084. [Google Scholar] [CrossRef]
  19. Karagöz, M.; Ümit, A.; Sar, S. Waste to energy: Production of waste tire pyrolysis oil and comprehensive analysis of its usability in diesel engines. Fuel 2020, 275, 117844. [Google Scholar] [CrossRef]
  20. Kuleshov, A.S. Model for Predicting Air-Fuel Mixing, Combustion and Emissions in DI Diesel Engines over Whole Operating Range (No. 2005-01-2119); SAE Technical Paper; SAE International: Warrendale, PA, USA, 2005. [Google Scholar]
  21. Sharma, A.; Murugan, S. Investigation on the behaviour of a DI diesel engine fueled with Jatropha Methyl Ester (JME) and Tyre Pyrolysis Oil (TPO) blends. Fuel 2013, 108, 699–708. [Google Scholar] [CrossRef]
  22. Rajak, U.; Nashine, P.; Chaurasiya, P.K.; Verma, T.N.; Dasore, A.; Pathak, K.K.; Dwivedi, G.; Shukla, A.K.; Saini, G. The effects on performance and emission characteristics of DI engine fuelled with CeO2 nanoparticles addition in diesel/tyre pyrolysis oil blends. Environ. Dev. Sustain. 2022. [Google Scholar] [CrossRef]
  23. Zheng, F.; Cho, H. Combustion and Emission of Castor Biofuel Blends in a Single-Cylinder Diesel Engine. Energies 2023, 16, 5427. [Google Scholar] [CrossRef]
  24. Rehman, M.; Kesharvani, S.; Dwivedi, G. Numerical Investigation of Performance, Combustion, and Emission Characteristics of Various Microalgae Biodiesel on CI Engine. Fuels 2023, 4, 132–155. [Google Scholar] [CrossRef]
  25. Venu, H.; Subramani, L.; Raju, V.D. Emission reduction in a DI diesel engine using exhaust gas recirculation (EGR) of palm biodiesel blended with TiO2 nano additives. Renew. Energy 2019, 140, 245–263. [Google Scholar] [CrossRef]
  26. Nanthagopal, K.; Ashok, B.; Raj, R.T.K. Influence of fuel injection pressures on Calophyllum inophyllum methyl ester fuelled direct injection diesel engine. Energy Convers. Manag. 2016, 116, 165–173. [Google Scholar] [CrossRef]
  27. Sidhu, M.S.; Roy, M.M.; Wang, W. Glycerine emulsions of diesel-biodiesel blends and their performance and emissions in a diesel engine. Appl. Energy 2018, 230, 148–159. [Google Scholar] [CrossRef]
  28. Mikky, Y.A.; Bhran, A.A.; El-Araby, R.Y.; Mohamed, A.M.A.; Gadallah, A.G.; Shoaib, A.M. Optimization of Biodiesel–Nanoparticle Blends for Enhanced Diesel Engine Performance and Emission Reduction. Processes 2024, 12, 2471. [Google Scholar] [CrossRef]
  29. Srihari, S.; Thirumalini, S.; Prashanth, K. An experimental study on the performance and emission characteristics of PCCI-DI engine fuelled with diethyl ether-biodiesel-diesel blends. Renew. Energy 2017, 107, 440–447. [Google Scholar] [CrossRef]
  30. Zheng, Z.; Xia, M.; Liu, H.; Shang, R.; Ma, G.; Yao, M. Experimental study on combustion and emissions of n-butanol / biodiesel under both blended fuel mode and dual fuel RCCI mode. Fuel 2018, 226, 240–251. [Google Scholar] [CrossRef]
  31. Li, X.; Liu, Q.; Ma, Y.; Wu, G.; Yang, Z.; Fu, Q. Simulation Study on the Combustion and Emissions of a Diesel Engine with Different Oxygenated Blended Fuels. Sustainability 2024, 16, 631. [Google Scholar] [CrossRef]
  32. Ooi, J.B.; Ismail, H.M.; Tan, B.T.; Wang, X. Effects of Graphite Oxide and Single-Walled Carbon Nanotubes as Diesel Additives on the Performance, Combustion, and Emission Characteristics of a Light-Duty Diesel Engine. Energy 2018, 161, 70–80. [Google Scholar] [CrossRef]
  33. Nour, M.; Attia, A.M.A.; Nada, S.A. Combustion, performance and emission analysis of diesel engine fuelled by higher alcohols (butanol, octanol and heptanol)/ diesel blends. Energy Convers. Manag. 2019, 185, 313–329. [Google Scholar] [CrossRef]
  34. Koc, A.B.; Abdullah, M. Performance of a 4-cylinder diesel engine running on tire oil—Biodiesel—Diesel blend. Fuel Process. Technol. 2014, 118, 264–269. [Google Scholar] [CrossRef]
  35. Petranovic, Z.; Edelbauer, W.; Duic, N.; Vujanovic, M. Modelling spray and combustion processes in diesel engine by using the coupled Eulerian—Eulerian and Eulerian—Lagrangian method. Energy Convers. Manag. 2016, 125, 15–25. [Google Scholar] [CrossRef]
  36. Kumar, M.; Tsujimura, T.; Suzuki, Y. NOx model development and validation with diesel and hydrogen/diesel dual-fuel system on diesel engine. Energy 2018, 145, 496–506. [Google Scholar] [CrossRef]
  37. Rangabashiam, D.; Logesh, K.; Yashvanth, U.; Subbiah, G. Detailed study on the effect of nano-particle size on emission characteristics of diesel engine. Pet. Sci. Technol. 2019, 37, 2018–2024. [Google Scholar] [CrossRef]
  38. Dhinesh, B.; Annamalai, M. A study on performance, combustion and emission behaviour of diesel engine powered by novel nano nerium oleander biofuel. J. Clean. Prod. 2018, 196, 74–83. [Google Scholar] [CrossRef]
  39. Malik, M.A.I.; Kalam, M.A.; Abbas, M.M.; Silitonga, A.S.; Ikram, A. Recent advancements, applications, and technical challenges in fuel additives-assisted engine operations. Energy Convers. Manag. 2024, 313, 118643. [Google Scholar] [CrossRef]
  40. Ulagarjun, U.; Varma, V.V.; Menon, A.K.; Gobinath, N.; Palanivelrajan, A.R.; Khan, T.Y.; Almakayeel, N. Investigation on effect of cerium oxide additive in waste plastic oil fueled CI engine. Heliyon 2024, 10, e26146. [Google Scholar] [CrossRef]
  41. Zheng, Y.; Cheng, P.; Li, Z.; Fan, C.; Wen, J.; Yu, Y.; Jia, L. Efficient removal of gaseous elemental mercury by Fe-UiO-66@ BC composite adsorbent: Performance evaluation and mechanistic elucidation. Sep. Purif. Technol. 2025, 372, 133463. [Google Scholar] [CrossRef]
  42. Qi, D.H.; Chen, H.; Geng, L.M.; Bian, Y.Z. Effect of diethyl ether and ethanol additives on the combustion and emission characteristics of biodiesel-diesel blended fuel engine. Renew. Energy 2011, 36, 1252–1258. [Google Scholar] [CrossRef]
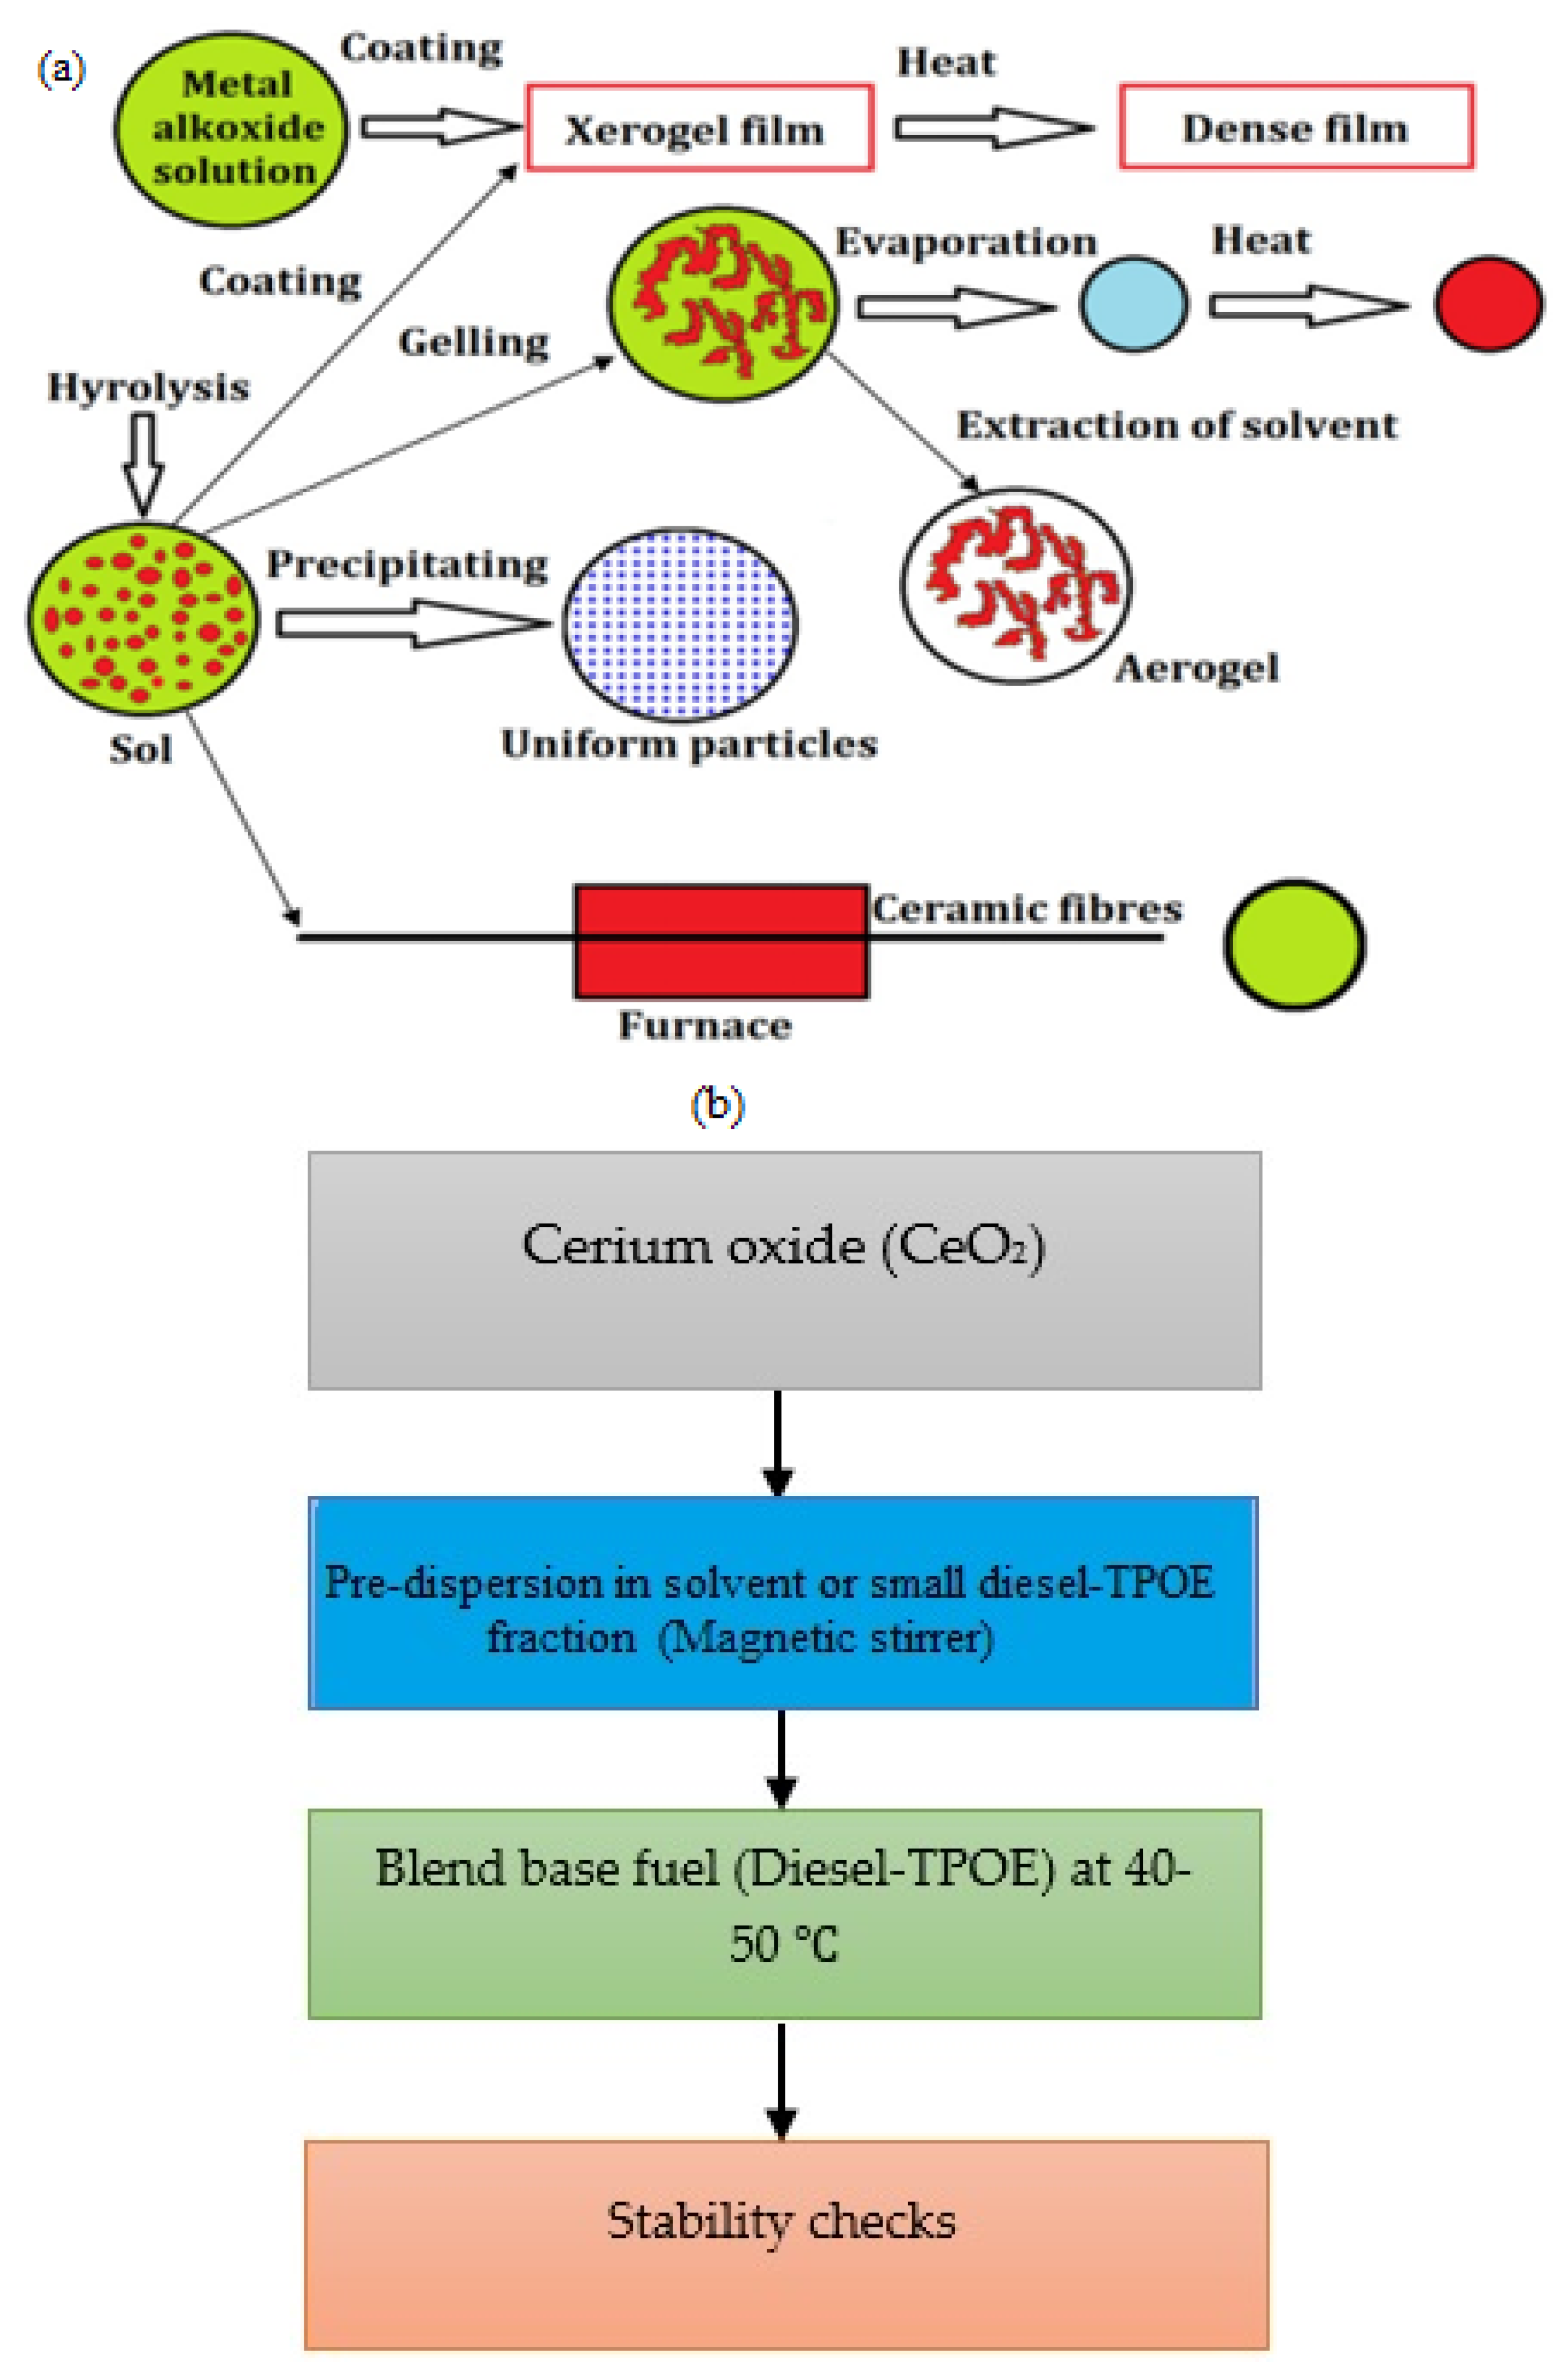
Figure 1. (a). displays a manufacturer of metal-based nanoparticles [13]. (b) Nanoparticles dispersion and fuel blending.
Fuels 06 00070 g001
Figure 2. Experiment setup.
Fuels 06 00070 g002
Figure 3. Cylinder pressure with crank angle.
Fuels 06 00070 g003
Figure 4. HRR with crank angle.
Fuels 06 00070 g004
Figure 5. Optimizing outputs by varying parameters vs compression ratios for (a) BMEP and IMEP, (b) Engine power and SFC, (c) Cylinder pressure and Ignition delay, and (d) NOx emission and SFC.
Fuels 06 00070 g005
Figure 6. Analysis of SFC under varying load conditions.
Fuels 06 00070 g006
Figure 7. Analysis of BTE under varying load conditions.
Fuels 06 00070 g007
Figure 8. Analysis of EGT under varying load conditions.
Fuels 06 00070 g008
Figure 9. Cylinder pressure with crank angle.
Fuels 06 00070 g009
Figure 10. Rate of heat release with crank angle.
Fuels 06 00070 g010
Figure 11. Analysis of IDP under varying load conditions.
Fuels 06 00070 g011
Figure 12. Analysis of NOx under varying load conditions.
Fuels 06 00070 g012
Figure 13. Analysis of smoke emission under varying load conditions.
Fuels 06 00070 g013
Figure 14. Analysis of summary of emissions under varying load conditions.
Fuels 06 00070 g014
Table 1. The findings of an earlier study that was conducted.
AuthorsNano-additivesPerformanceDischarge
PowerTorqueBTESFCCOHCNOxSmoke
Yaşar et al. [2]TiO2, (Cu(NO3)2), (Ce(CH3CO2)3·H2O)---Fuels 06 00070 i001Fuels 06 00070 i002Fuels 06 00070 i003Fuels 06 00070 i004-
Vinukumar et al. [3]Coconut shell (CS)Fuels 06 00070 i005Fuels 06 00070 i006-Fuels 06 00070 i007Fuels 06 00070 i008-Fuels 06 00070 i009-
Gharehghani et al. [6]Cerium oxide (CeO2)----Fuels 06 00070 i010Fuels 06 00070 i011 -
Ardebili et al. [5]Sugarcane nano-biochar (SNB)Fuels 06 00070 i012Fuels 06 00070 i013-Fuels 06 00070 i014Fuels 06 00070 i015Fuels 06 00070 i016Fuels 06 00070 i017-
Ghanbari et al. [4]Carbon nanotubes (CNTs)Fuels 06 00070 i018Fuels 06 00070 i019-Fuels 06 00070 i020Fuels 06 00070 i021Fuels 06 00070 i022Fuels 06 00070 i023-
Khalife et al. [7]Aqueous nano cerium oxide [7]--Fuels 06 00070 i024Fuels 06 00070 i025Fuels 06 00070 i026Fuels 06 00070 i027Fuels 06 00070 i028-
Perumal and Ilangkumaran [8]Copper oxide (CuO) [8]--Fuels 06 00070 i029Fuels 06 00070 i030Fuels 06 00070 i031-Fuels 06 00070 i032Fuels 06 00070 i033
Örs et al. [9]Titanium dioxide (TiO2)Fuels 06 00070 i034Fuels 06 00070 i035 Fuels 06 00070 i036-Fuels 06 00070 i037Fuels 06 00070 i038Fuels 06 00070 i039
Ettefaghi et al. [10]Carbon quantum dotsFuels 06 00070 i040Fuels 06 00070 i041-Fuels 06 00070 i042Fuels 06 00070 i043Fuels 06 00070 i044--
Hasannuddin et al. [11]Aluminium oxide (Al2O3)Fuels 06 00070 i045--Fuels 06 00070 i046Fuels 06 00070 i047 Fuels 06 00070 i048-
Dhanasekar et al. [12]CeO2 and CeO2----Fuels 06 00070 i049--Fuels 06 00070 i050
Kumaravel et al. [13] CeO2--Fuels 06 00070 i051---Fuels 06 00070 i052Fuels 06 00070 i053
Present investigation Cerium oxide (CeO2) with tyre oil–diesel fuel at different loads--Fuels 06 00070 i054Fuels 06 00070 i055--Fuels 06 00070 i056Fuels 06 00070 i057
Fuels 06 00070 i058 = Increase value of parameter and Fuels 06 00070 i059 = decrease value of parameter.
Table 2. Specifics of CeO2.
Sr. No.NameValues
1.Compound Cerium oxide (CeO2)
2.ColourPale yellow-white
4.ProducerM/s. Sigma–Aldrich (Burlington, MA, USA)
5.Purity99.97%
6.Surface area11–17 m2/g
Table 3. Properties of fuels derived from waste plastics and municipal solid waste.
Properties/FuelTPOEDiesel
Heating value (MJ/kg)36.543.5
Flash point (°C)3551
Fire point (°C)4056
Surface tension (N/m)0.04510.028
Density (kg/m3)910810
Viscosity (cSt.)12.745.665
Table 4. Properties of blends and combustion behaviour characteristics.
FuelTPOE5D90 + ATPOE5D85 + BTPOE10D85 + CTPOE10D80 + D
Density (kg/m3)817819822824
Flash point (°C)51525051
Fire point (°C)55565456
Heating value (MJ/kg)43.2843.2842.9442.98
Viscosity (cSt.)6.356.46.656.72
Table 5. Apparatus configuration summary.
ParameterValue
Engine typeSingle-cylinder, 4-stroke, DI diesel
Bore × stroke87.5 mm × 110 mm
Compression ratio18.5:1
Rated power5.2 kW @ 1500 rpm
Cooling systemWater-cooled
Injection pressure220 bars
Injection timing23.5° b TDC
speedConstant 1500 rpm
Load conditions25%, 50%, 75%, and 100% of rated load
Intake air temperature30 ± 2 °C
cooling water temperature80 ± 2 °C
Lubricating oil temperature75 ± 3 °C
Test repetitions3 per load condition
Table 6. Sources of uncertainty.
InstrumentUncertainty (%)
Air flow±1.0
Encoder±0.2
Dynamometer±0.15
Fuel consumption ±0.6
CO2
NOx
CO
±1.0
± 0.5
±1.2
Load cell±0.2
Pressure sensor±0.5
Smoke meter±1.0
Speed sensor±1.0
Temperature sensor±0.15
Thermal efficiency±0.9
Table 7. General structure of a model equation.
EquationEquation
(3) d m d t = j m ˙ j
(4) S F C = m f ˙ P b
(5) d ( m u ) d t = p d ν d t + d Q h t d t + j m ˙ j h j
(6) F M E P = α + β Ρ p m a x
(7) τ = 3.8 × 1 0 6 ( 1 1.6 × 1 0 4 × n ) T p exp E a 8.312 T 70 C N + 25
d x d τ = Φ 0 × A 0 m f v i × σ u d x 0 × 0.1 × σ u d + x 0 + Φ 1 × d σ u d τ
d x d τ = Φ 1 × d σ u d τ + Φ 2 × A 2 m f v c × σ u x × α x
d x d τ = Φ 3 A 3 K T 1 x ξ b α x
(8) O 2 2 O
N 2 + O N O + N       N + O 2 N O + O
d N O d θ = Ρ × 2.333 × 1 0 7 . e 38020 T b N 2 e . O e . 1 N O N O e 2 R . T b . 1 + 2365 T b . e 2365 T b . N O N O e . 1 ω
(9) d C d t K = 0.004 q c V d x d t
(10) H S L = 100 1 0.9545 exp 2.4226 C
(11) [ P M ] = 565 ln 10 10 B N 1.206
Disclaimer/Publisher’s Note: The statements, opinions and data contained in all publications are solely those of the individual author(s) and contributor(s) and not of MDPI and/or the editor(s). MDPI and/or the editor(s) disclaim responsibility for any injury to people or property resulting from any ideas, methods, instructions or products referred to in the content.