Article

Thermo-Kinetic Assessment of Ammonia/Syngas Combustion: Experimental and Numerical Investigation of Laminar Burning Velocity at Elevated Pressure and Temperature

by
Mehrdad Kiani
1,
Ali Akbar Abbasian Arani
2,
Ehsan Houshfar
1,
Mehdi Ashjaee
1 and
Pouriya H. Niknam
3,*
1
School of Mechanical Engineering, College of Engineering, University of Tehran, Tehran P.O. Box 11155-4563, Iran
2
Faculty of Mechanical Engineering, University of Kashan, Kashan P.O. Box 87317-53153, Iran
3
School of Engineering and Physical Sciences, University of Lincoln, Brayford Pool, Lincoln LN6 7TS, UK
*
Author to whom correspondence should be addressed.
Fuels 2025, 6(3), 59; https://doi.org/10.3390/fuels6030059
Submission received: 5 May 2025 / Revised: 24 June 2025 / Accepted: 23 July 2025 / Published: 12 August 2025

Abstract

The utilization of ammonia as a fuel for gas turbines involves practical challenges due to its low reactivity, narrow flammability limits, and slow laminar flame propagation. One of the potential solutions to enhance the combustion reactivity of ammonia is co-firing with syngas. This paper presents an experimental and numerical investigation of the laminar burning velocity (LBV) of ammonia/syngas/air mixtures under elevated pressures (up to 10 bar) and temperatures (up to 473 K). Experiments were conducted in a constant-volume combustion chamber with a total volume of 11 L equipped with a dual-electrode capacitive discharge ignition system. A systematic sensitivity analysis was conducted to experimentally evaluate the system performance under various syngas compositions and equivalence ratios from 0.7 to 1.6 and ultimately identify the factors with the most impact on the system. As a complement to the experiments, a detailed numerical simulation was carried out integrating available kinetic mechanisms—chemical reaction sets and their rates—to support advancements in the understanding and optimization of ammonia/syngas co-firing dynamics. The sensitivity analysis results reveal that LBV is significantly enhanced by increasing the hydrogen content (>50%). Furthermore, the LBV of the gas mixture is found to increase with the use of a rich flame, higher mole fractions of syngas, and higher initial temperatures. The results indicate that higher pressure reduces LBV by 40% but at the same time enhances the adiabatic flame temperature (by 100 K) due to an equilibrium shift. The analysis was also extended to quantify the impact of syngas mole fractions and elevated initial temperatures. The kinetics of the reactions are analyzed through the reaction pathways, and the results reveal how the preferred pathways vary under lean and rich flame conditions. These findings provide valid quantitative design data for optimizing the combustion kinetics of ammonia/syngas blends, offering valuable design data for ammonia-based combustion systems in industrial gas turbines and power generation applications, reducing NOₓ emissions by up to 30%, and guiding future research directions toward kinetic models and emission control strategies.

1. Introduction

Ammonia (NH3) is a promising fuel for gas turbines and could be used as an alternative to carbon-based fuels. However, despite its well-developed production, storage, and transportation infrastructure, NH3 has a low combustion intensity, a narrow flammability range, and slow flame propagation. Its practical use as a turbine fuel has been challenging for the energy industry [1,2]. It has been shown that the peak of the laminar burning velocity (LBV) of an ammonia/air mixture is 6.4–8.1 cm/s, much lower than that of H2, syngas, and carbon-based fuels [3,4,5]. Consequently, enhancing the reactivity of NH3-based combustion in gas turbines, usually through laminar flame propagation, has attracted significant research interest. Previous works indicate that two strategies, namely, fuel enhancement [6,7,8] and oxygen enrichment [7], can improve the flame speed. The first technique, i.e., fuel enhancement, adds reactive fuels to the mixture. Hydrogen (H2) is the most commonly used reactive fuel; however, materials such as methane (CH4) [8,9,10] and carbon monoxide (CO) [8] have also been used. Shu et al. [11] investigated the laminar flame speed of ammonia with enriched methane. Their results show that there is a linear correlation between the LBV of NH3/CH4/air and the amount of methane in the premixed fuel. Their experiments show that the mean value for flame speed of NH3/CH4/air is 7.8 cm/s, which is significantly lower than that of methane. In a similar study, Cavaliere da Rocha [12] explored the impact of hydrogen volume fraction in the mixture of NH3/H2/air on the LBV. They observed that LBV is strongly dependent on the amount of hydrogen in the fuel mixture.
Quite a few studies have explored combustion characteristics of alternative fuels, and synthesis gas has definite advantages among them because of its plentiful accessible resources. It is usually generated by gasifying carbon-based raw materials, including coal and biomass, and mainly contains hydrogen (H2) and carbon monoxide (CO) [13,14]. Syngas combustion can be considered a clean solution for power generation in gas turbines [15]. Syngas can also enhance the reactivity of less reactive fuels such as ammonia. In the work of Han et al. [16], the LBV of NH3/syngas/air mixtures was measured in the atmospheric temperature and under different equivalence ratios (φ). Their results show that, similarly to NH3/H2/air mixtures, adding ammonia to syngas/air mixtures improves the laminar flame propagation, specifically when the hydrogen proportion is high in the syngas. As mentioned, the initial pressure in this experiment was set to 1 atm, which is low compared to increased pressure in gas turbines, and there are fewer studies under higher pressure and temperature conditions for ammonia-based fuels.
Regarding the operation of industrial combustion chambers at high pressures, quite a few works have been conducted to clarify the flame characteristics of fuels under such conditions for the improvement of the efficiency of combustors. For NH3/syngas mixtures, Han et al. [16] examined laminar flame propagation for pressures up to 10 atm. Concerning conditions of elevated pressure connected to gas turbines, the characteristics of an ammonia/syngas/air premixed flame such as LBV and its kinetic model in a cylindrical combustion vessel at constant volume and high pressure were developed by Mei et al. [17]. It was concluded from their efforts that the chemical effect is the main source of increased laminar flame propagation, and the importance of H + O2 (+M) = HO2 (+M) becomes more dominant with the addition of syngas, leading to stronger pressure dependence. According to the literature, more extensive research is needed to further explore the development of kinetic models of the ammonia/syngas/air flame and ammonia/bio-syngas/air flame in boilers and gas turbines. Ammonia/air at different temperatures was investigated by Li et al. [18] to consider the influence of initial temperature on the LBV and emissions. They asserted that increasing the initial temperature enhances NO emissions. On the other hand, the NO emission level could be maintained at a moderate level for various initial temperatures because of the enhanced depletion reaction of NO with NH2, NH, and N radicals. Air-preheating technology has previously been employed using flue gas heat waste. Ultimately, NOx emissions are controlled; however, high-temperature conditions related to this technology have not been discussed in previous studies. Wang et al. [19] studied the influence of initial pressure on the LBV of an ammonia/hydrogen mixture. Their results showed that the LBV decreases non-linearly with the enhancing initial pressure, and this reduction becomes progressively slower as the initial pressure increases.
One of the most important parameters in designing burners is the flame temperature. Kiani et al. [13] investigated the flame temperature distribution of pure hydrogen in intersecting burners. They varied the inlet velocity and equivalence ratio of fuel to air. Their results show that the maximum flame temperature is strongly dependent on the equivalence ratio and independent of the inlet velocity, while the flame structure is drastically dependent on both of them. In another study, the peak value of the flame temperature for the mixture of ammonia/hydrogen/air was considered by Li et al. [20]. They realized that the maximum flame temperature for different equivalence ratios is strongly dependent on the OH×N radical. Information about the flame temperature for the mixture of ammonia/syngas/air under different conditions with higher pressures and temperatures is limited in the literature.
In this work, the LBV dynamics and kinetic model of ammonia/syngas mixtures are studied by considering both elevated pressure and temperature conditions. Also, the maximum flame temperature of the NH3/syngas/air under various conditions is considered using the Mach–Zehnder interferometry method. The ammonia/syngas/air mixtures are burned in a constant-volume combustion chamber at temperature up to 473 K and up to a pressure of 10 atm with different equivalence ratios and syngas compositions. Also, a kinetic model is developed for an ammonia/syngas/air flame under these conditions. The experimental results are compared with other studies and with numerical kinetic analysis performed using available and open-source software packages.
Reviewing the recent literature in the field, it emerges that there is an elevated pace of advancement in the field of ammonia/syngas co-firing, resulting in a large number of studies taking experimental or numerical approaches to explore different parameters. Looking at the literature, as shown in Figure 1, it can be observed that experimental studies are predominantly limited to low pressure, with a mean value of ~1.4 bar, as well as a temperature with the mean value of ~298 K (see Figure 1). Those that take numerical approaches address the barriers of experiments by evaluating higher pressures and initial temperatures, but still, the majority limit the lower pressure and temperatures to allow them to verify their results with experimental investigations. The current study marginally goes beyond the literature and presents a comprehensive experimental and numerical investigation into ammonia/syngas/air combustion in industrially relevant conditions, i.e., elevated-pressure and -temperature conditions. In particular, the pressure reaches up to 10 bar and the temperature up to 473 K, exceeding the average temperature in similar investigations in the literature. This study addresses the gaps in ammonia-based fuel research, with a focus on industrial applications such as gas turbines and power generation systems. Among other industries, the chemical, steel, and maritime sectors are discussed in the literature regarding the application of ammonia/syngas-based combustion systems.
Furthermore, experimental analysis, numerical modeling using multiple kinetic mechanisms, and reaction pathway analysis each contribute to the advancement of knowledge on ammonia/syngas combustion, identifying the operational boundaries for ammonia-based fuel systems. The study employs the Mach–Zehnder interferometry approach to enable precise, non-intrusive measurements of flame temperature fields, capturing temperature distributions under elevated pressure and temperature.

2. Experimental Setup

2.1. Experimental Facilities and Procedure
Before describing the combustion chamber and the experimental procedure, the fuel and air sources should be discussed. Two hydrogen and CO gas cylinders, with a purity higher than 99.99%, were used to produce a syngas composition ranging from 50 to 70%. After each cylinder, gas regulators were installed to adapt the high gas pressure to the pressure of the pipeline. An air compressor provided the combustion air, which was dehumidified using a vapor absorber before reaching the test section. A gas splitter was used to separately charge each gas stream into the combustion chamber.
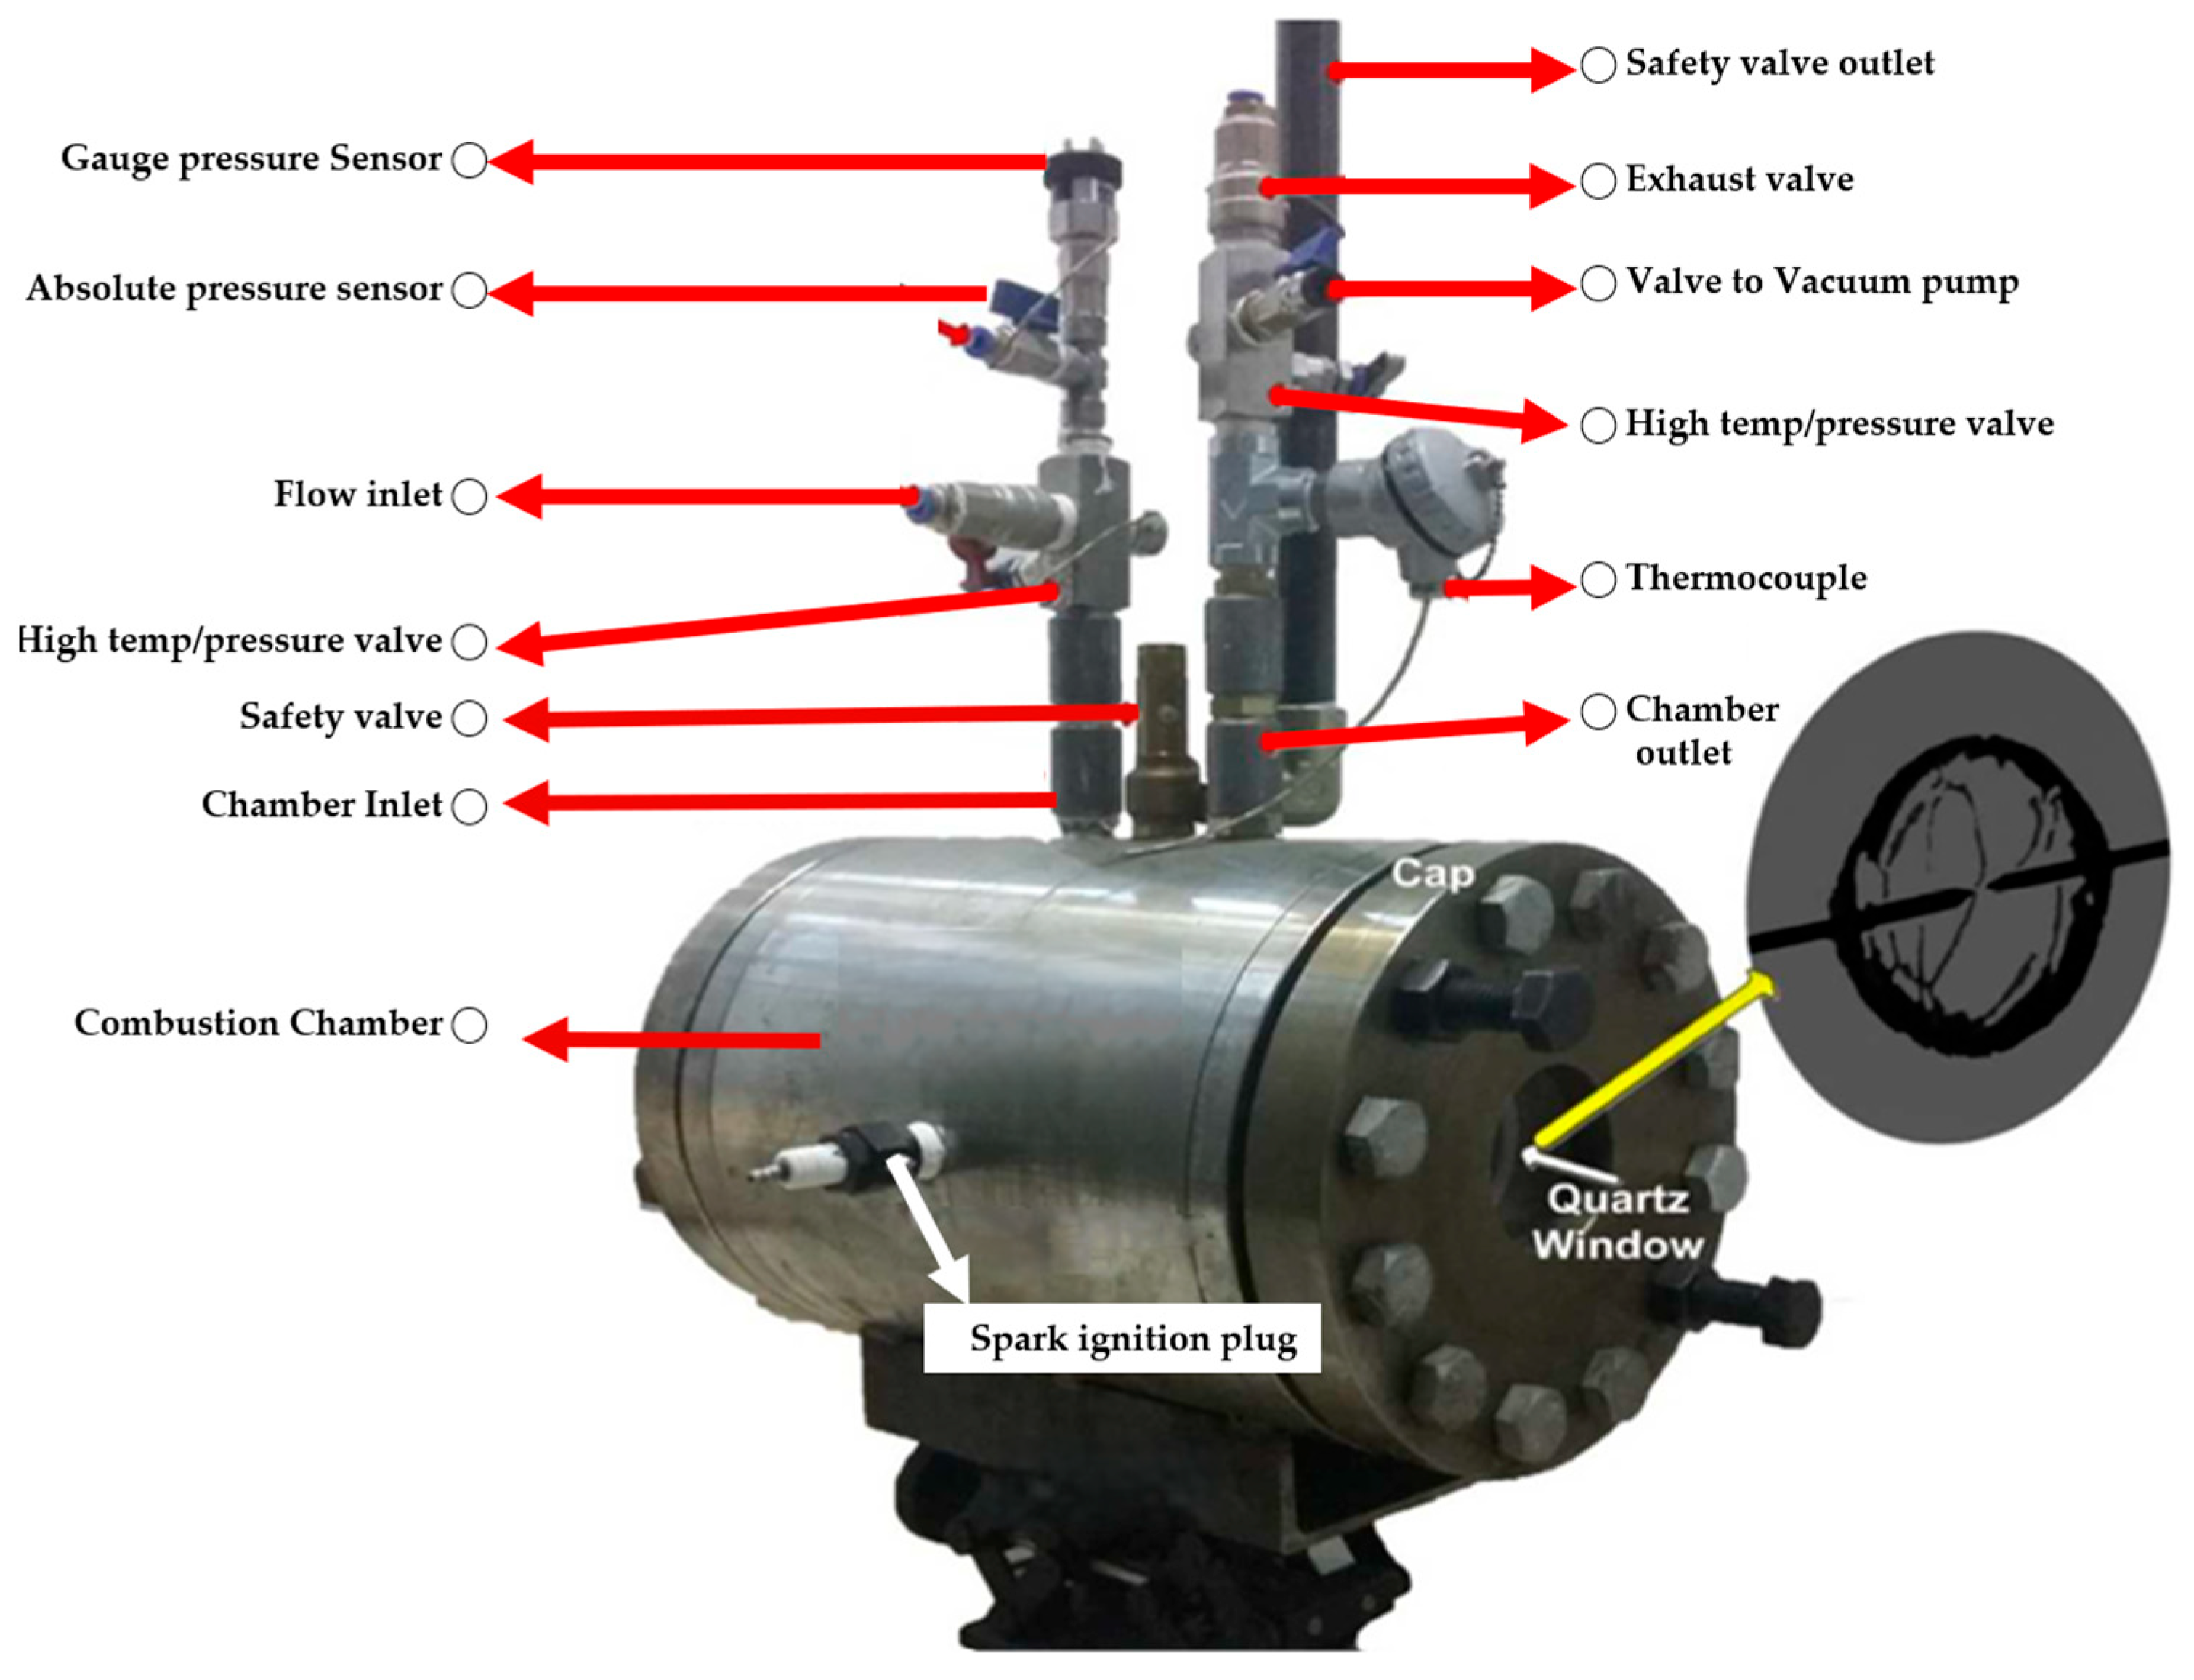
The steel cylindrical combustion chamber (Figure 2) has a capacity of ~11 L. The inner diameter and the chamber length are 225 and 280 mm, respectively. The ignition system takes advantage of electrodes with a 2 mm diameter, and a pair of spark plugs are placed in parallel on both sides of the chamber in concentric holes. Ignition is based on a capacitive spark discharge circuit where the voltage between the electrodes is 10 kV and the distance between the two electrodes can be adjusted from 0.5 to 2 mm. Two windows, each 80 mm in length and 100 mm in diameter, are installed on both sides of the combustion chamber and are secured with two pairs of parallel flanges to provide access to the laser rays needed for Schlieren imaging. There are three holes on top of the chamber that are designed to activate when the pressure inside the chamber exceeds 50 bars.
High pressure–temperature valves separate the inlet and outlet flow from the chamber’s interior. The constant pressure inside the chamber is monitored using two sensors positioned before the inlet valve. The first sensor is a pressure sensor working between 0 and 1.1 bar, and the other one is a gauge sensor that can measure the pressure between 0.87 and 10 bar, which is the highest pressure used in the experiment. The partial pressure, as well as the mixture characteristics, can be measured precisely using these two sensors (with a maximum error of less than 0.5% for pressure measurement). Using partial pressure readings from calibrated pressure transmitters, and knowing the chamber volume and temperature, the quantity of each gas is calculated, allowing precise control of the mixing ratio. The initial internal temperature is measured using a K-type thermocouple inserted through the exhaust port. A vacuum pump connected to the combustion chamber through a valve in the gas discharge path is used to evacuate the chamber before each experiment. After evacuation, using the partial pressure method, the chamber was filled with gases with the desired ratios. At the end of each test, the test section was filled with fresh air to ensure that the combustion products were evacuated. This was then discharged before starting the following experiment. After filling the chamber with gases and closing the valves, the mixture remained in the chamber for around 20 min. This delay ensures the homogeneous mixing of the gas and allows the mixture to settle [22]. The amount of time needed for resting was determined by considering the obtained LBV results for different resting times. It was observed that waiting beyond 20 min had no significant effect on flame speed. For statistical significance, each experiment was repeated four times, and the mean value was presented.
Figure 2. Combustion chamber used in the experimental setup [23].
Fuels 06 00059 g002

2.2. Interferometry Technique

2.2.1. The Schlieren System

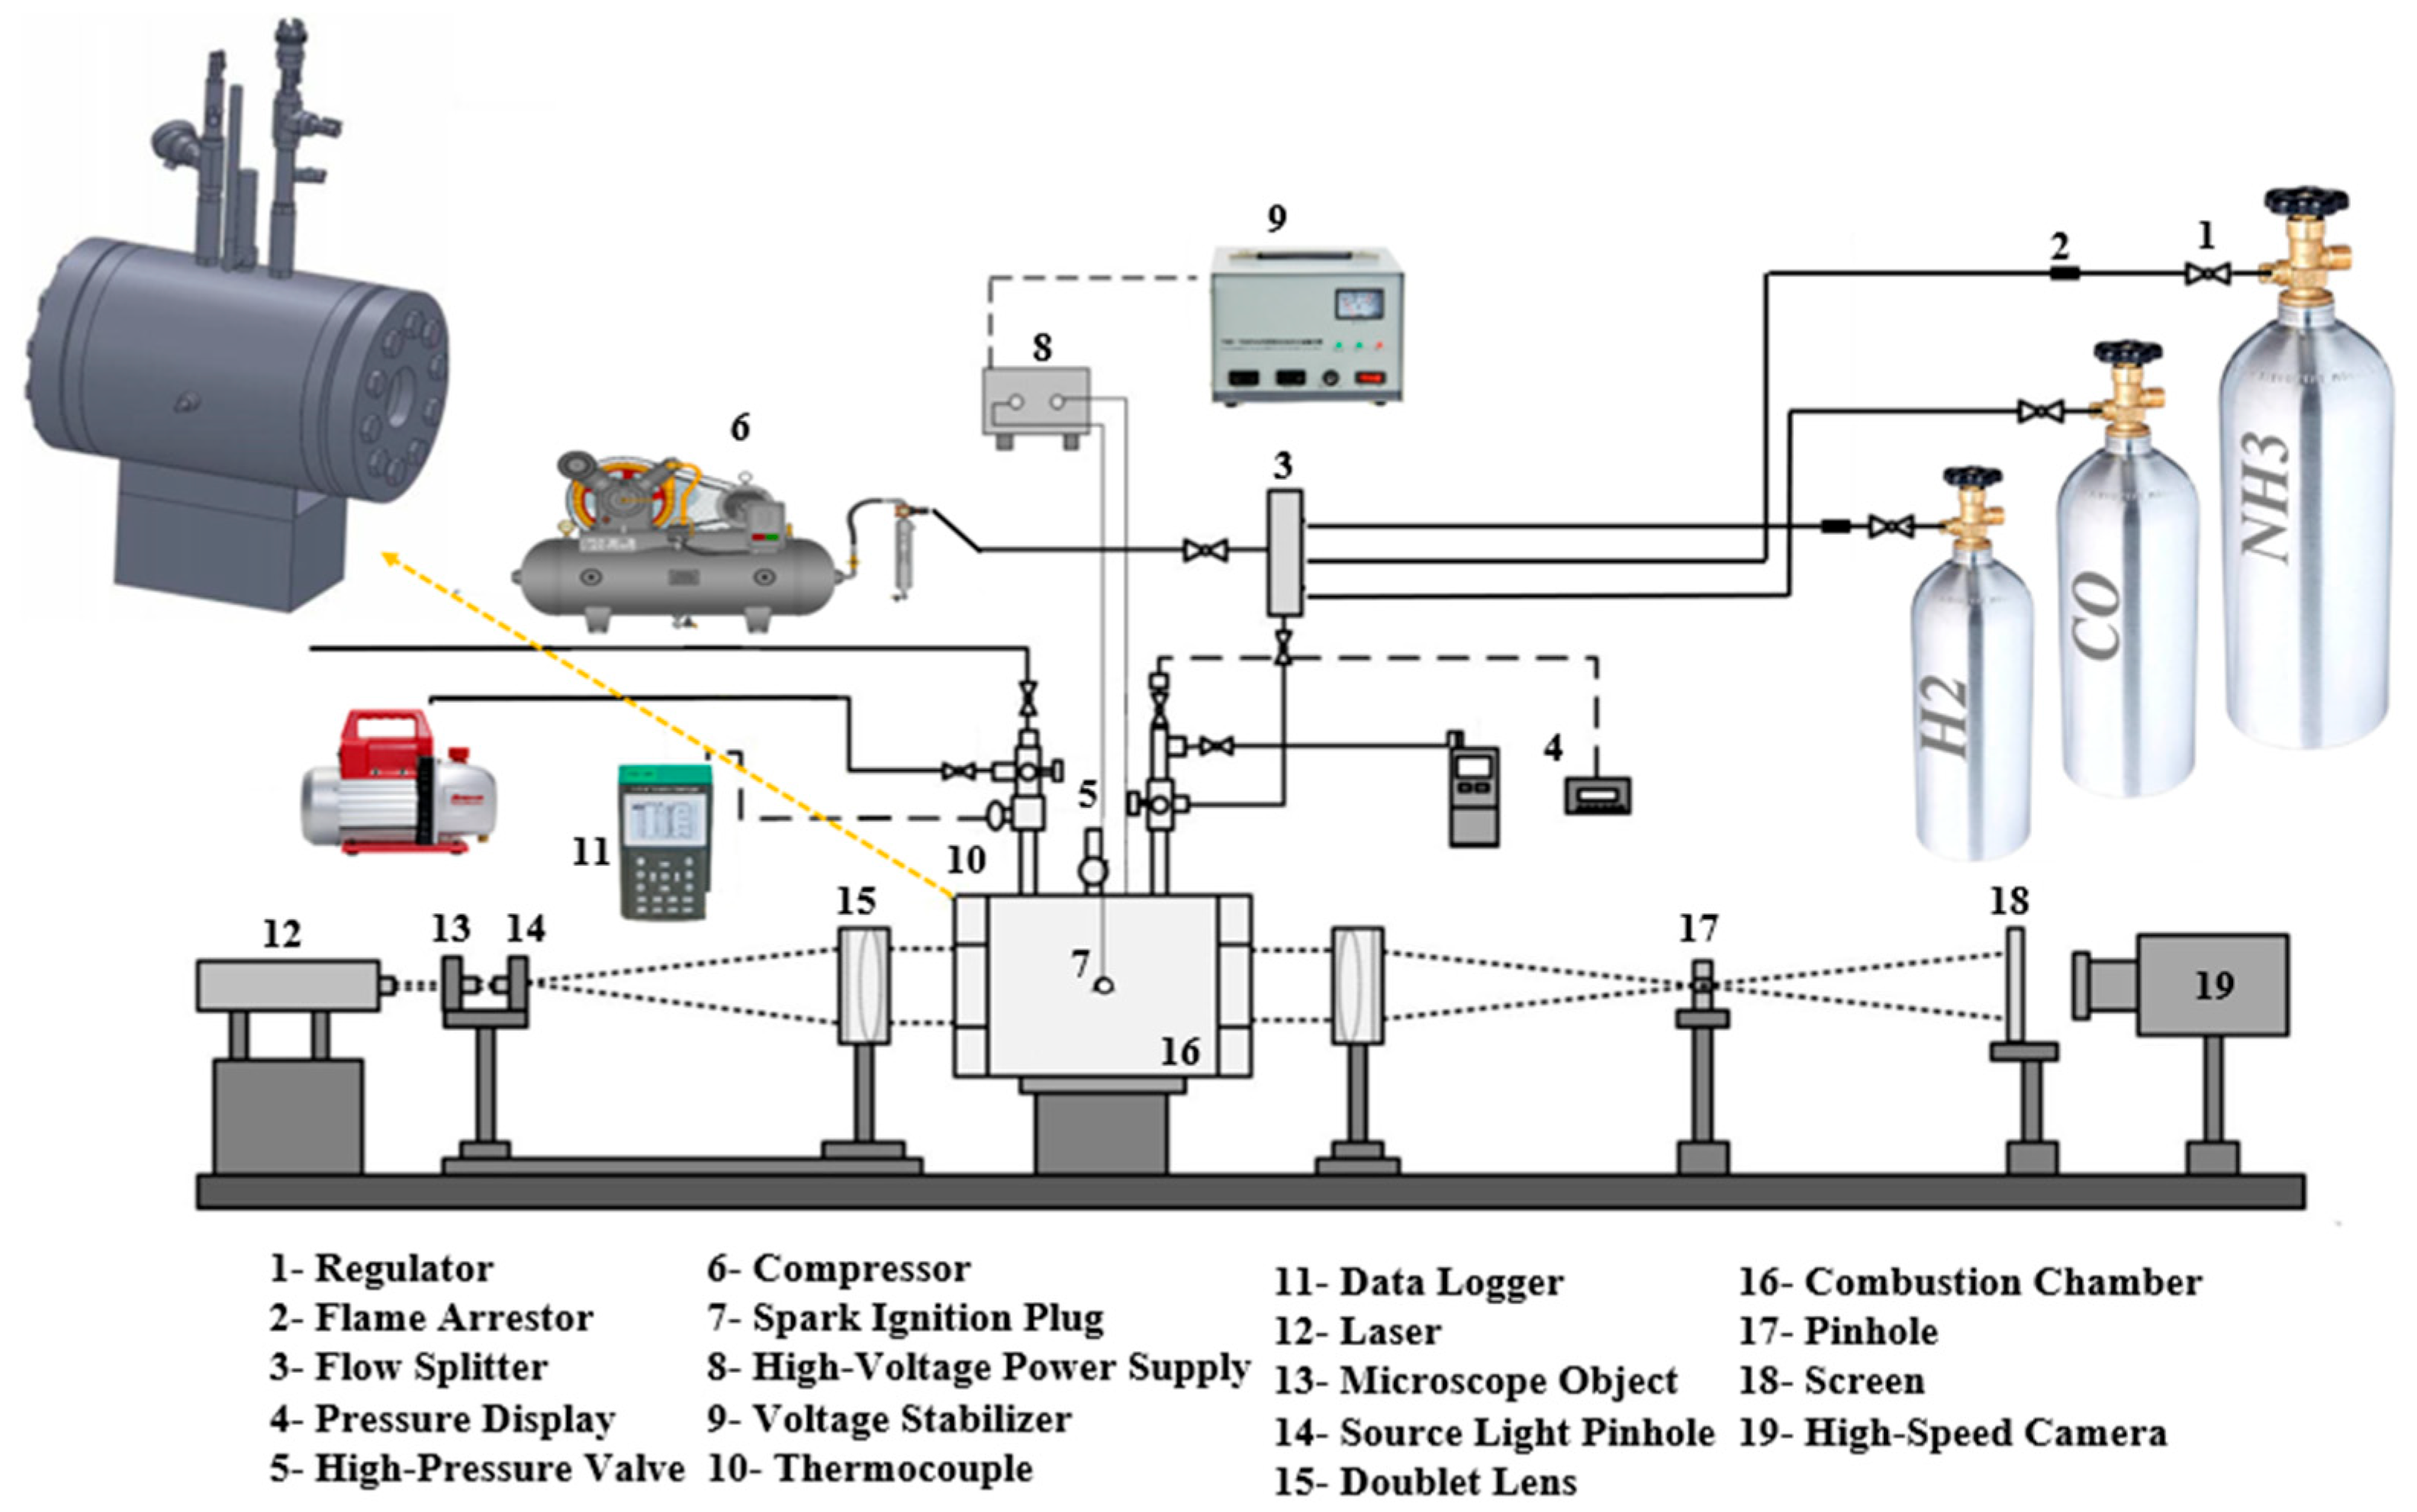
A green diode laser was used as the light source to set up the Schlieren imaging system. The laser had a power of 1000 mW and a wavelength of 520 nm. Figure 3 shows a high-level schematic of the setup and the Schlieren imaging equipment. Two doublet lenses with a 100 mm diameter and 500 mm focal length orthogonal to the laser were used to create parallel light beams. The combustion chamber was placed in the middle of the doublets. The doublet lens on the right side of the schematic in Figure 3 concentrates the light beam into a pinhole with an adjustable diameter. Afterward, the propagation of the flame was displayed on a screen and was captured by a camera with 10,000 fps with a 960 × 540 resolution.

2.2.2. Using the Mach–Zehnder Interferometry Technique to Measure the Flame Temperature

Mach–Zehnder interferometry is a well-known interferometry technique capable of visualizing combustion products to determine the peak value flame temperature along with the temperature distribution inside the heated zone.
The main equipment of the Mach–Zehnder installation is shown in Figure 3. In this investigation, to visualize the refractive index field of combustion, a laser source with a 5 mW He-Ne output and a wavelength of 632.8 nm was used. First, the emitted beam arrives at a pinhole and a microlens (see Figure 3). The light then spreads through the microlens, reaches a collimator with a 10 cm diameter specification and then reaches a half mirror. The half mirror plays a crucial role in this technique, as it splits the beam into two; half passes through the test section zone, while the other passes through the ambient environment without any change in its refractive index. Finally, the divided light beams recombine. The dark and bright lines on the transparent mirror result from the dissimilar phases of the two beams. A camera recording at 30 fps is used to capture the image. Further studies on the Mach–Zehnder technique can be found in the literature [24,25].

2.3. Determination of Laminar Burning Velocity

The flame propagates in a sphere after spark ignition at the chamber’s center. A circle was fitted on the front at each time step to calculate the radius of the flame front from the recorded flame propagation images obtained using the high-speed camera (Figure 4 shows a specific time step and the fitted circle). The spark rods may have an unwanted effect on the data reduction procedure. Therefore, a 30-degree circular area surrounding the spark rods was excluded when performing data reduction in the subsequent parts. Accordingly, the stretched rate (Sb) can be calculated using the flame radius values over time [23]:
S b = d R f d t ,
In which R f is the flame radius as it is in Figure 4, at a specific moment. Now, given the flame propagation speed, the burning velocity of the flame ( S u ) can be measured using the equation below (see Equation (2)):
S u = S b σ ,
where σ = ρ u ρ b is the gas expansion ratio, in which ρ u and ρ b are densities of the unburned and burned gases in the combustion chamber, respectively. The flame stretch rate of a flame ( κ ) is determined as below (see Equation (3)) [26,27]:
κ = 1 A d A d t ,
where A is the surface area of the flame front. Since the flame is expanding spherically, the stretch rate can be computed using the formula below (see Equation (4)):
κ = 1 A d A d t =   1 R f 2 d R f 2 d t = 2 R f d R f d t ,
Now, the effect of the flame stretch can be eliminated from the calculated flame propagation speed and the laminar flame speed at each time step can be obtained. There are two modification techniques, linear and non-linear, to calculate the unstretched burning velocity. In the former method [28,29,30], the flame speed with stretch correction can be calculated as follows:
S b = S b 0 L b · κ ,
Kelley and Law [31] proposed a non-linear logarithmic method for this correction, which is given below (see Equation (6)):
S b S b 0 2 ln S b S b 0 = L b κ S b 0 ,
In Equations (5) and (6), S b is the stretched (corrected) laminar flame velocity, S b 0 is the unstretched laminar flame velocity, and L b is the Markstein length, a constant indicating the effects of the flame characteristics on the flame speed [32] and is proportional to the flame thickness. In the present work, the non-linear methodology is utilized for calculating the unstretched flame propagation speed to obtain more accurate results.

2.4. Uncertainty

The combustible mixture quantities were prepared in the chamber according to the required partial pressures of the component gases using a GE UNIK 5000 silicon pressure sensor (with an accuracy of ±0.04% and full-scale repeatability of ±0.2%). For different conditions, uncertainties were calculated and presented with the S l results. For temperature, uncertainty was calculated using Equation (7):
u N = [ u c 2 +   ( 1 N 1 u i 2 ) ] 1 / 2 ,
Here, u c and u i represent the instrument error and first-order uncertainty, respectively. The main goals of u c and u i are to consider accidental components of the tool’s error and process instability.

3. Simulation

Ansys Chemkin-pro was used to consider premixed flames under different conditions. Chemkin, with the assistance of the PREMIX code, solved the steady-state conservation of mass, species, and energy using hybrid time integration. In addition to the experimental tests, a one-dimensional simulation was carried out using Ansys Chemkin. The prediction of the unstretched LBV and species concentration was carried out by Ansys Chemkin-Pro. Two important factors, thermal diffusion and mixture-averaged transport formulation, were involved in the calculations. Three well-known kinetic mechanisms were utilized to simulate the combustion: the Mei mechanism [17], which supports 39 species and 255 reactions, the San Diego mechanism [26] (including nitrogen chemistry), which contains 68 species and 311 reactions, and the Han model [8], which supports 35 species and 177 reactions (see Table 1). All simulation cases were aligned with the experimental pressure and temperature ranges, enabling comparison and validation. Boundary conditions included a fixed gas temperature of 473 K, a constant pressure ranging from 1 to 10 atm, and equivalence ratios of 0.8, 1.0, and 1.2.

4. Results and Discussion

The results obtained from the experiment and numerical analysis are presented in this section. Using the setup described in Section 2, the effect of different initial pressures and temperatures, fuel compositions, and equivalence ratios were investigated on the LBV of syngas, determining the rich and lean burn limits for each parameter configuration. Afterward, the simulations were carried out using the numerical tools described, and we compared the results with the experiments.
The variation ranges of investigated characteristics are listed in Table 2.
Here, SYN70: H 2 H 2 + [ C O ] = 0.7 , α = N H 3 [ N H 3 ] + [ C H 4 ] + [ C O 2 ] , β = H 2 H 2 + [ C O ] where N H 3 , [ H 2 ] , and C O represent the initial mole fraction.

4.1. Validation

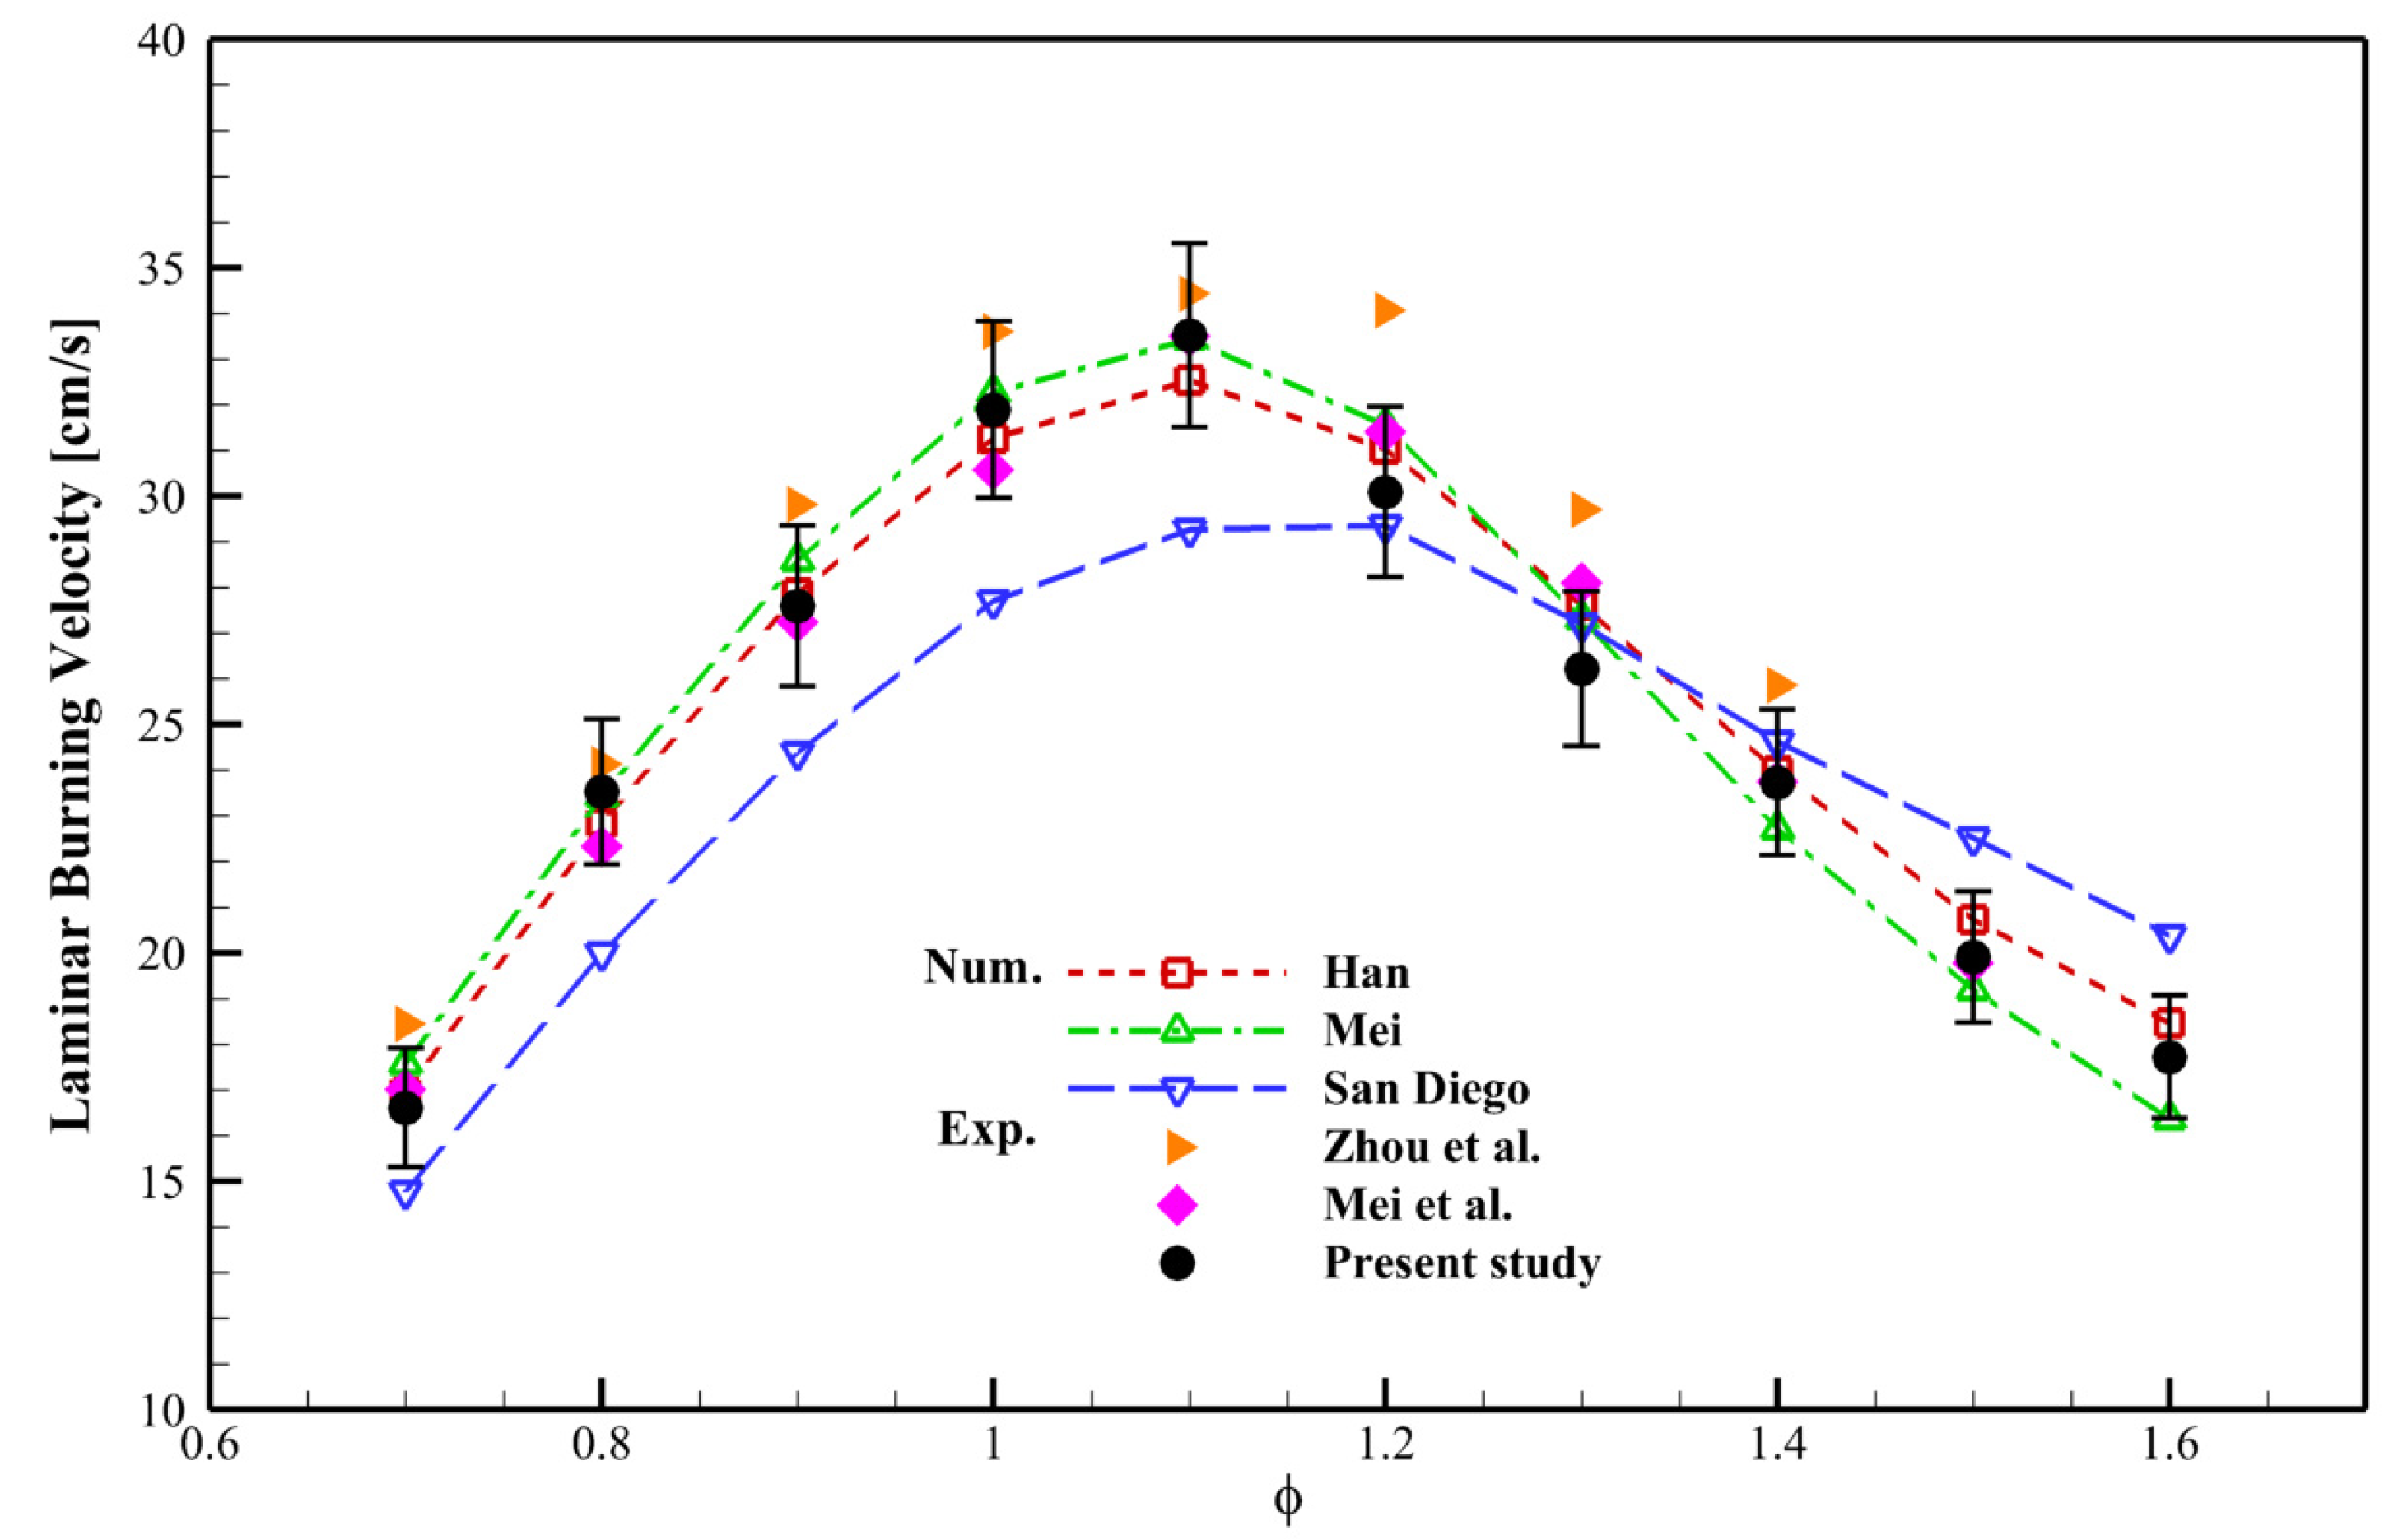
The kinetic models derived for predicting LBVs for different mixtures using simulation tools are validated in terms of rationality and accuracy with the help of the experimental data from this work and the literature [17,33,34,35]. The comparison between the results obtained with numerical simulations and the experiments is visualized in Figure 5. The plots are for different equivalence ratios of ammonia/syngas ( α = N H 3 s y n g a s + N H 3 = 0.5 , β = H 2 s y n g a s = 0.5 ) with a pressure and temperature of 1 atm and 300 K, respectively. These plots show that the experiments verify the numerical simulations; as seen from the plots, Han and Mei’s mechanisms have better accuracy in predicting LBV than the San Diego mechanism. Although both the Han and Mei mechanism simulations agree with the experimental data, the Han mechanism shows lower error in computing LBV with respect to the present experimental data. Hence, the following analysis and discussions are conducted based on the Han mechanism.

4.2. Markstein Length

The changes in stretched burning velocity (SBV) with the flame stretch rate ( κ ) should be considered to calculate the unstretched burning velocity (UBV). The derivative of stretched burning velocity (SBV) with respect to κ is the Markstein length. The UBV is calculated by continuing the line tangent to the experimental SBV vs. κ. The point corresponding to the zero stretch rate represents the UBV. Referring to Table 3, this process was applied to all of the experimental conditions to find the UBV and Markstein length ( L b ). It can be observed that in stoichiometric and lean-flame conditions, L b is near zero or negative, leading to an increase in the burning velocity as the stretch rate, κ , increases [36]. On the other hand, when L b is positive, the burning velocity increases as the stretch rate decreases. A positive L b corresponds to a stable flame, while a negative one means an unstable flame and a distorted cellular flame surface [37]. In the unstable flame condition, the appearance of a bulge or bump on the flame front causes the burning velocity to increase and amplifies the instability. These bulges are suppressed when L b > 0 and the flame is stable [38].

4.3. Flame Observation of Syngas/Ammonia/Air

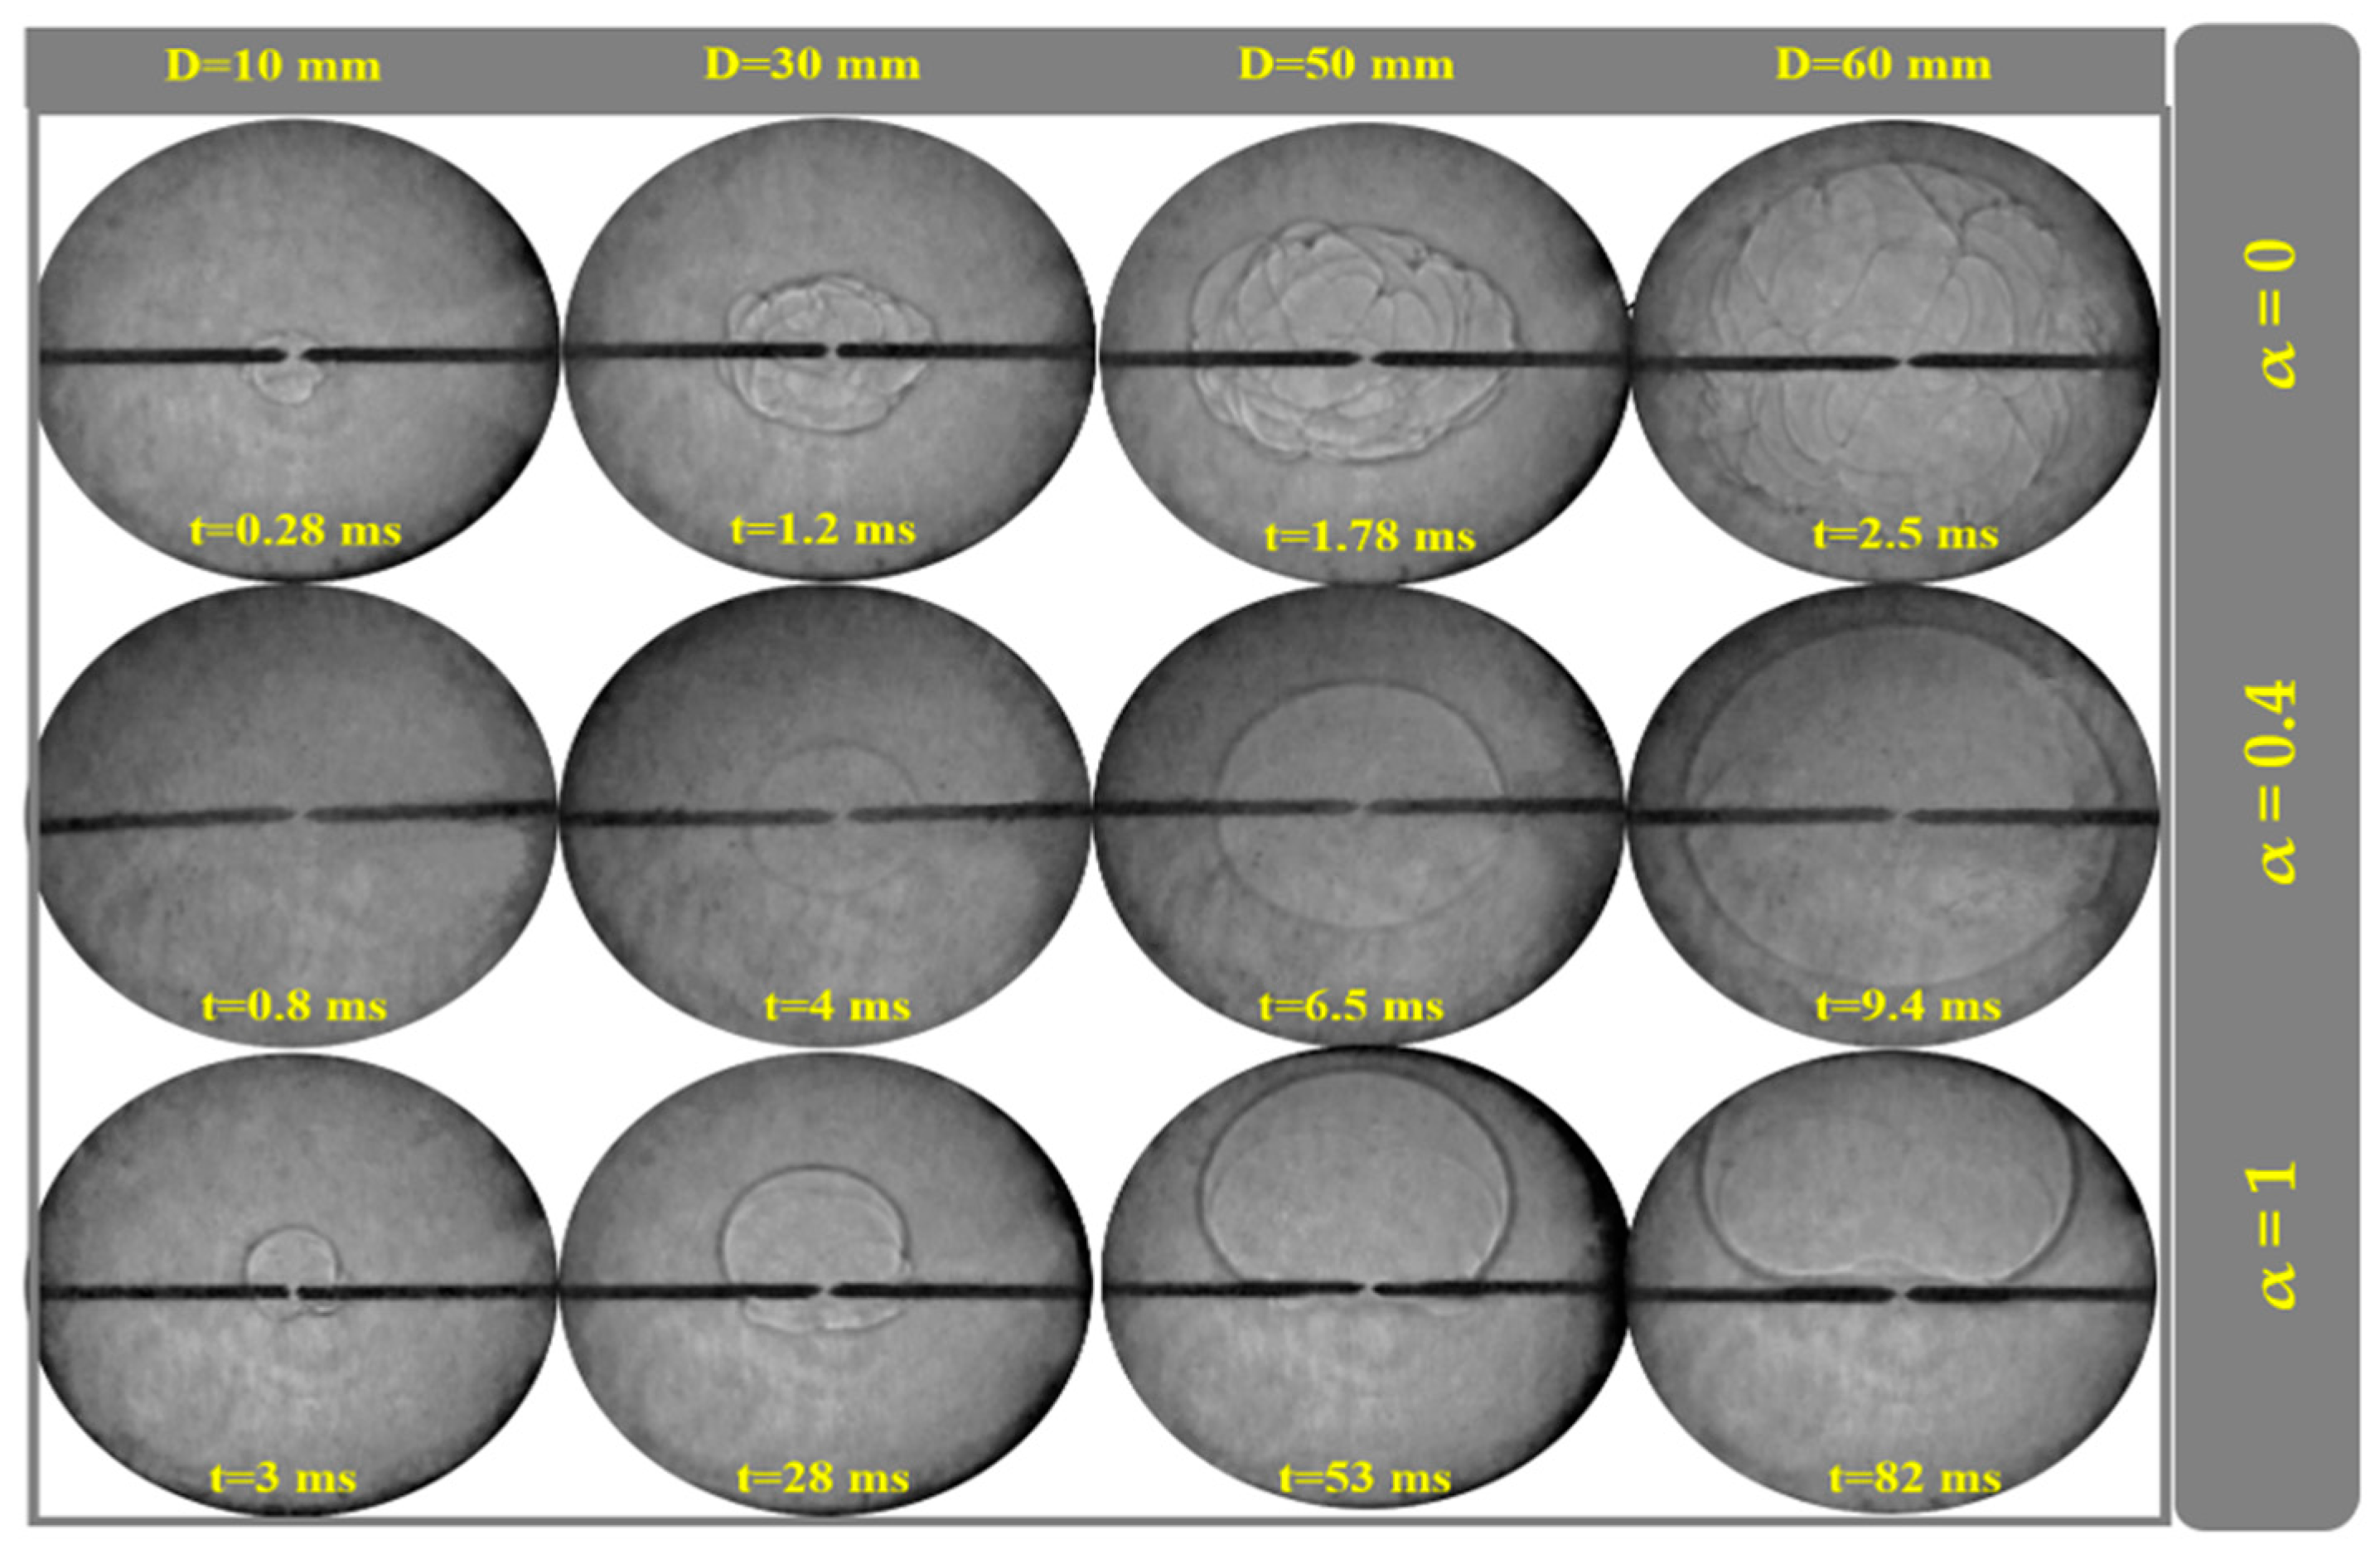
The explicit images obtained during the spherical flame propagation process of the syngas/air/ammonia mixtures can be seen in Figure 6 for four different ammonia content. Orange chemiluminescence was observed from ammonia/syngas/air premixed flames [31]. Hayakawa et al. [39] proposed that the orange chemiluminescence was caused by the NH2 ammonia band spectra [40] and the superheated H2O vapor spectra. NH2 increases as the ammonia increases, and orange chemiluminescence becomes clearer. The unstretched LBV at α = 1 is shallow.

4.4. Kinetic Analysis of Syngas/Ammonia/Air

Multiple factors increase the LBV, including chemical, thermal, and transport effects. A previous study has shown that the chemical composition of the fuel and the initial temperature have the most significant impacts on LBV, with the chemical factor being more dominant [17]. The peak of two important radicals, H and OH, strongly influences the chemical composition in determining the LBV.
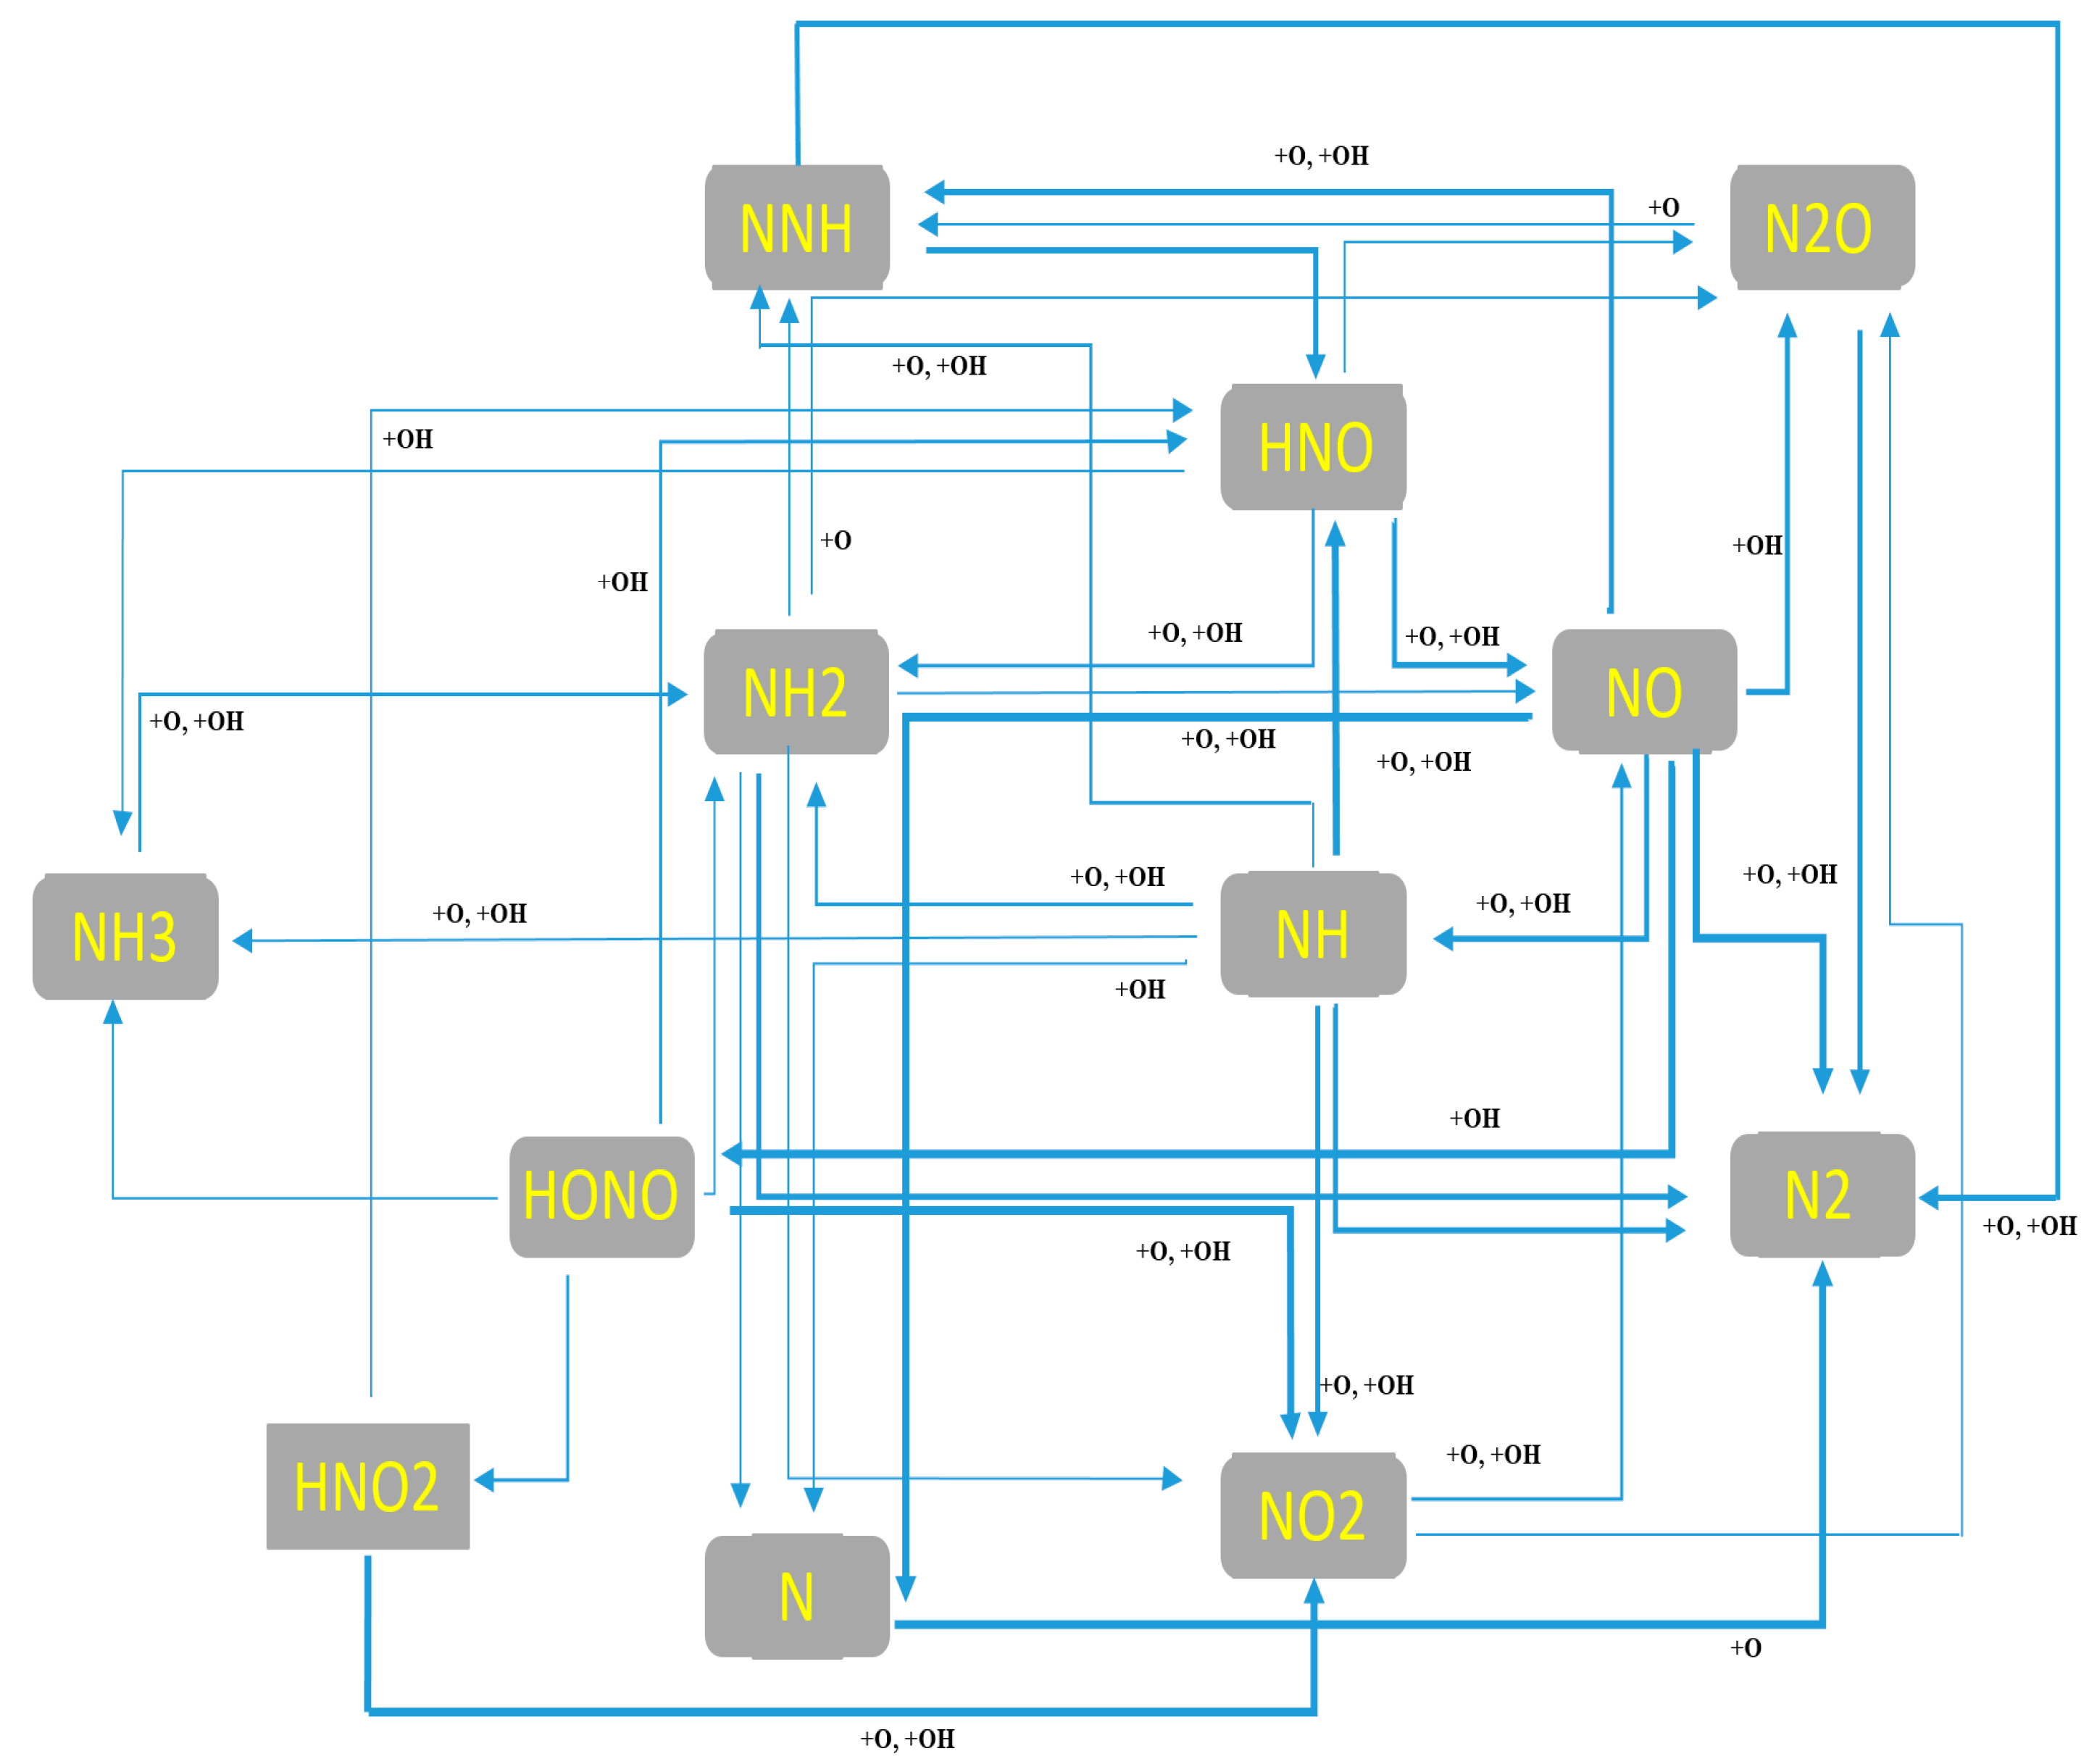
Furthermore, pollutant emissions are presented, and their variations are justified based on the combustion kinetics of the hydrogen–ammonia mixture [41,42,43,44,45,46]. The mixture’s chemical kinetics are investigated under variant equivalence ratio conditions to study the air content’s effect on emissions (see Table 2). The reaction paths of various syngas–ammonia mixtures are described in Figure 7.

4.5. Flame Propagation at Different Conditions

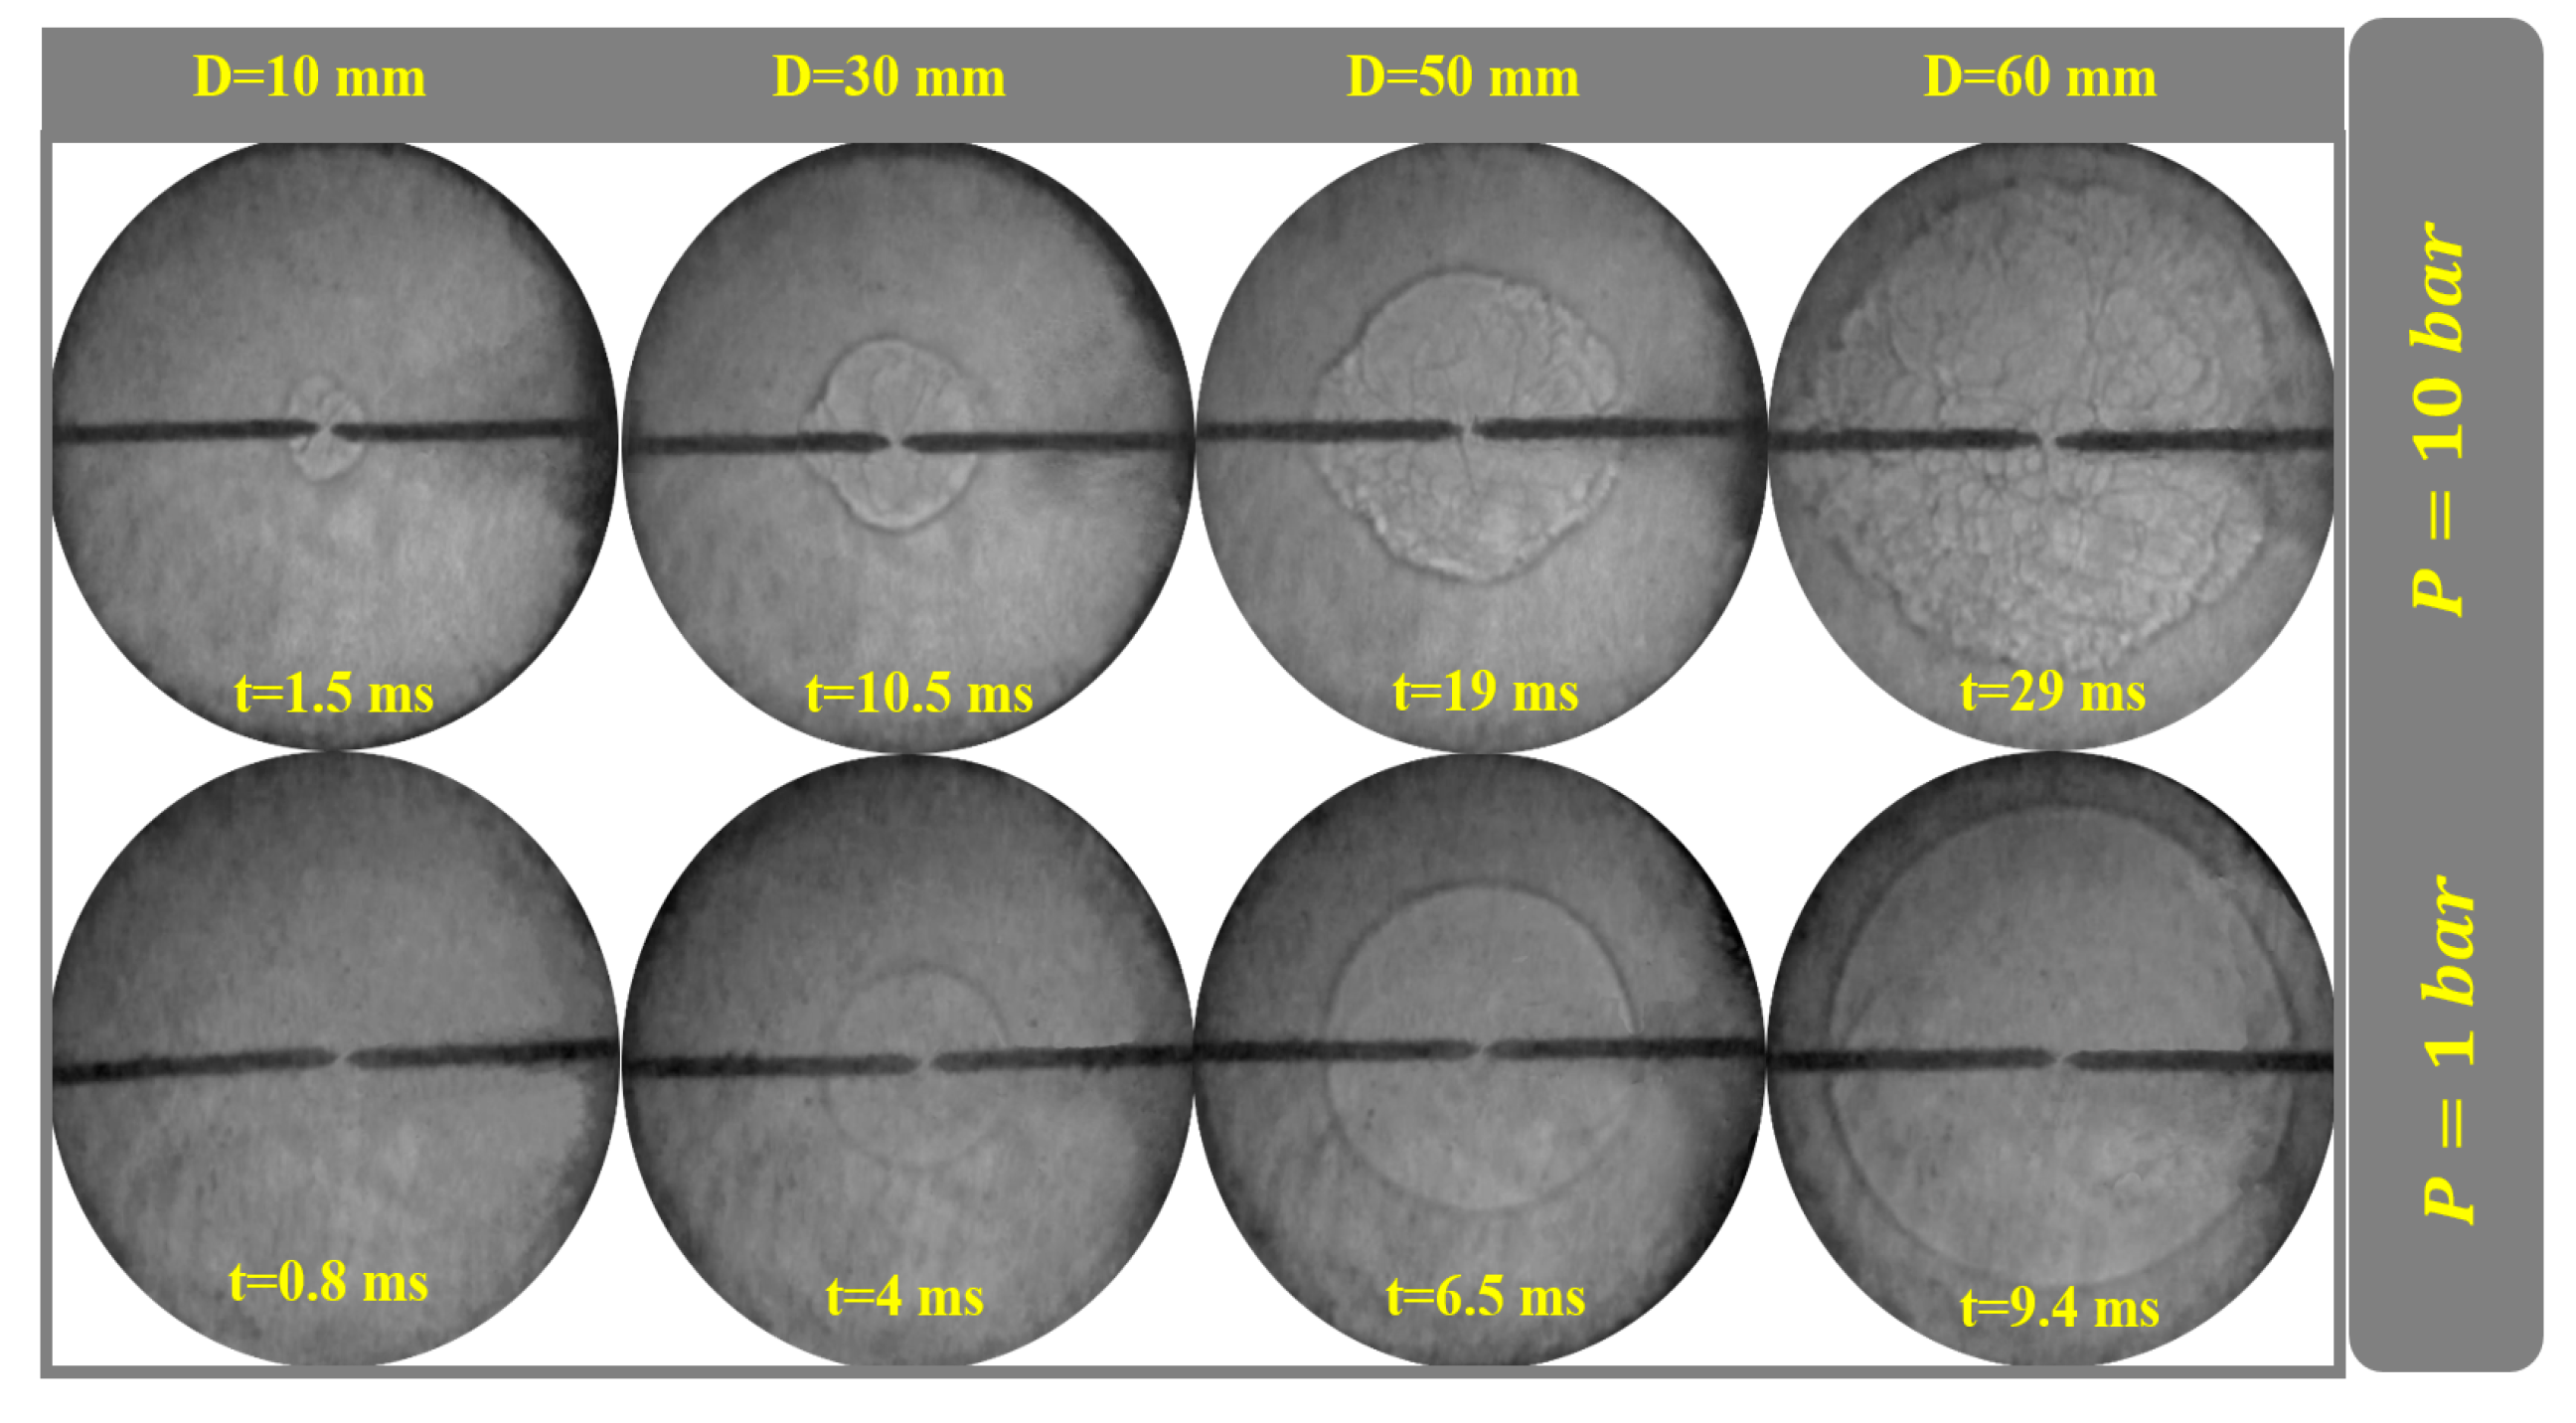
Ammonia/syngas/air mixtures spherically propagating flames under different conditions based on Table 2 were visualized using Schlieren photography, and the results are shown in Figure 8. Each image is explained in its corresponding section.

4.6. Examining the Pressure Effect

Mass and thermal diffusivity are highly affected by pressure and influence fuel burning velocity. Thermal diffusivity ( D T ) is defined by
D T = k ρ u C p = k R u T u P u C p = f k , R u , C p × T u P u ,
where T u is the absolute temperature (K) and P u is the pressure (atm). Mass diffusivity for a mixture of two gases that is related to the temperature and pressure of the gas mixture can be defined based on the Chapman–Enskog theory [47]:
D =   1.858 × 10 3 × T u 1.5 × 1 M 1 + 1 M 2 P u σ 12 2 Ω = f ( M ,   σ ,   Ω ) × T u 1.5 P u ,
where M 1 and M 2 are the molar masses of two gas molecules present in the mixture (g/mol), σ 12 = 0.5 ( σ 1 + σ 2 ) is the mean collision diameter of gas molecules, and Ω is a dimensionless number representing the collision integral dependent on temperature. It can be observed that both of these diffusivity coefficients have a negative correlation with pressure. Since the burning rate ( S u ) of the mixture is, in a sense, a consequence of the thermal and mass diffusivity coefficients, increasing the pressure causes a decrease in S u .
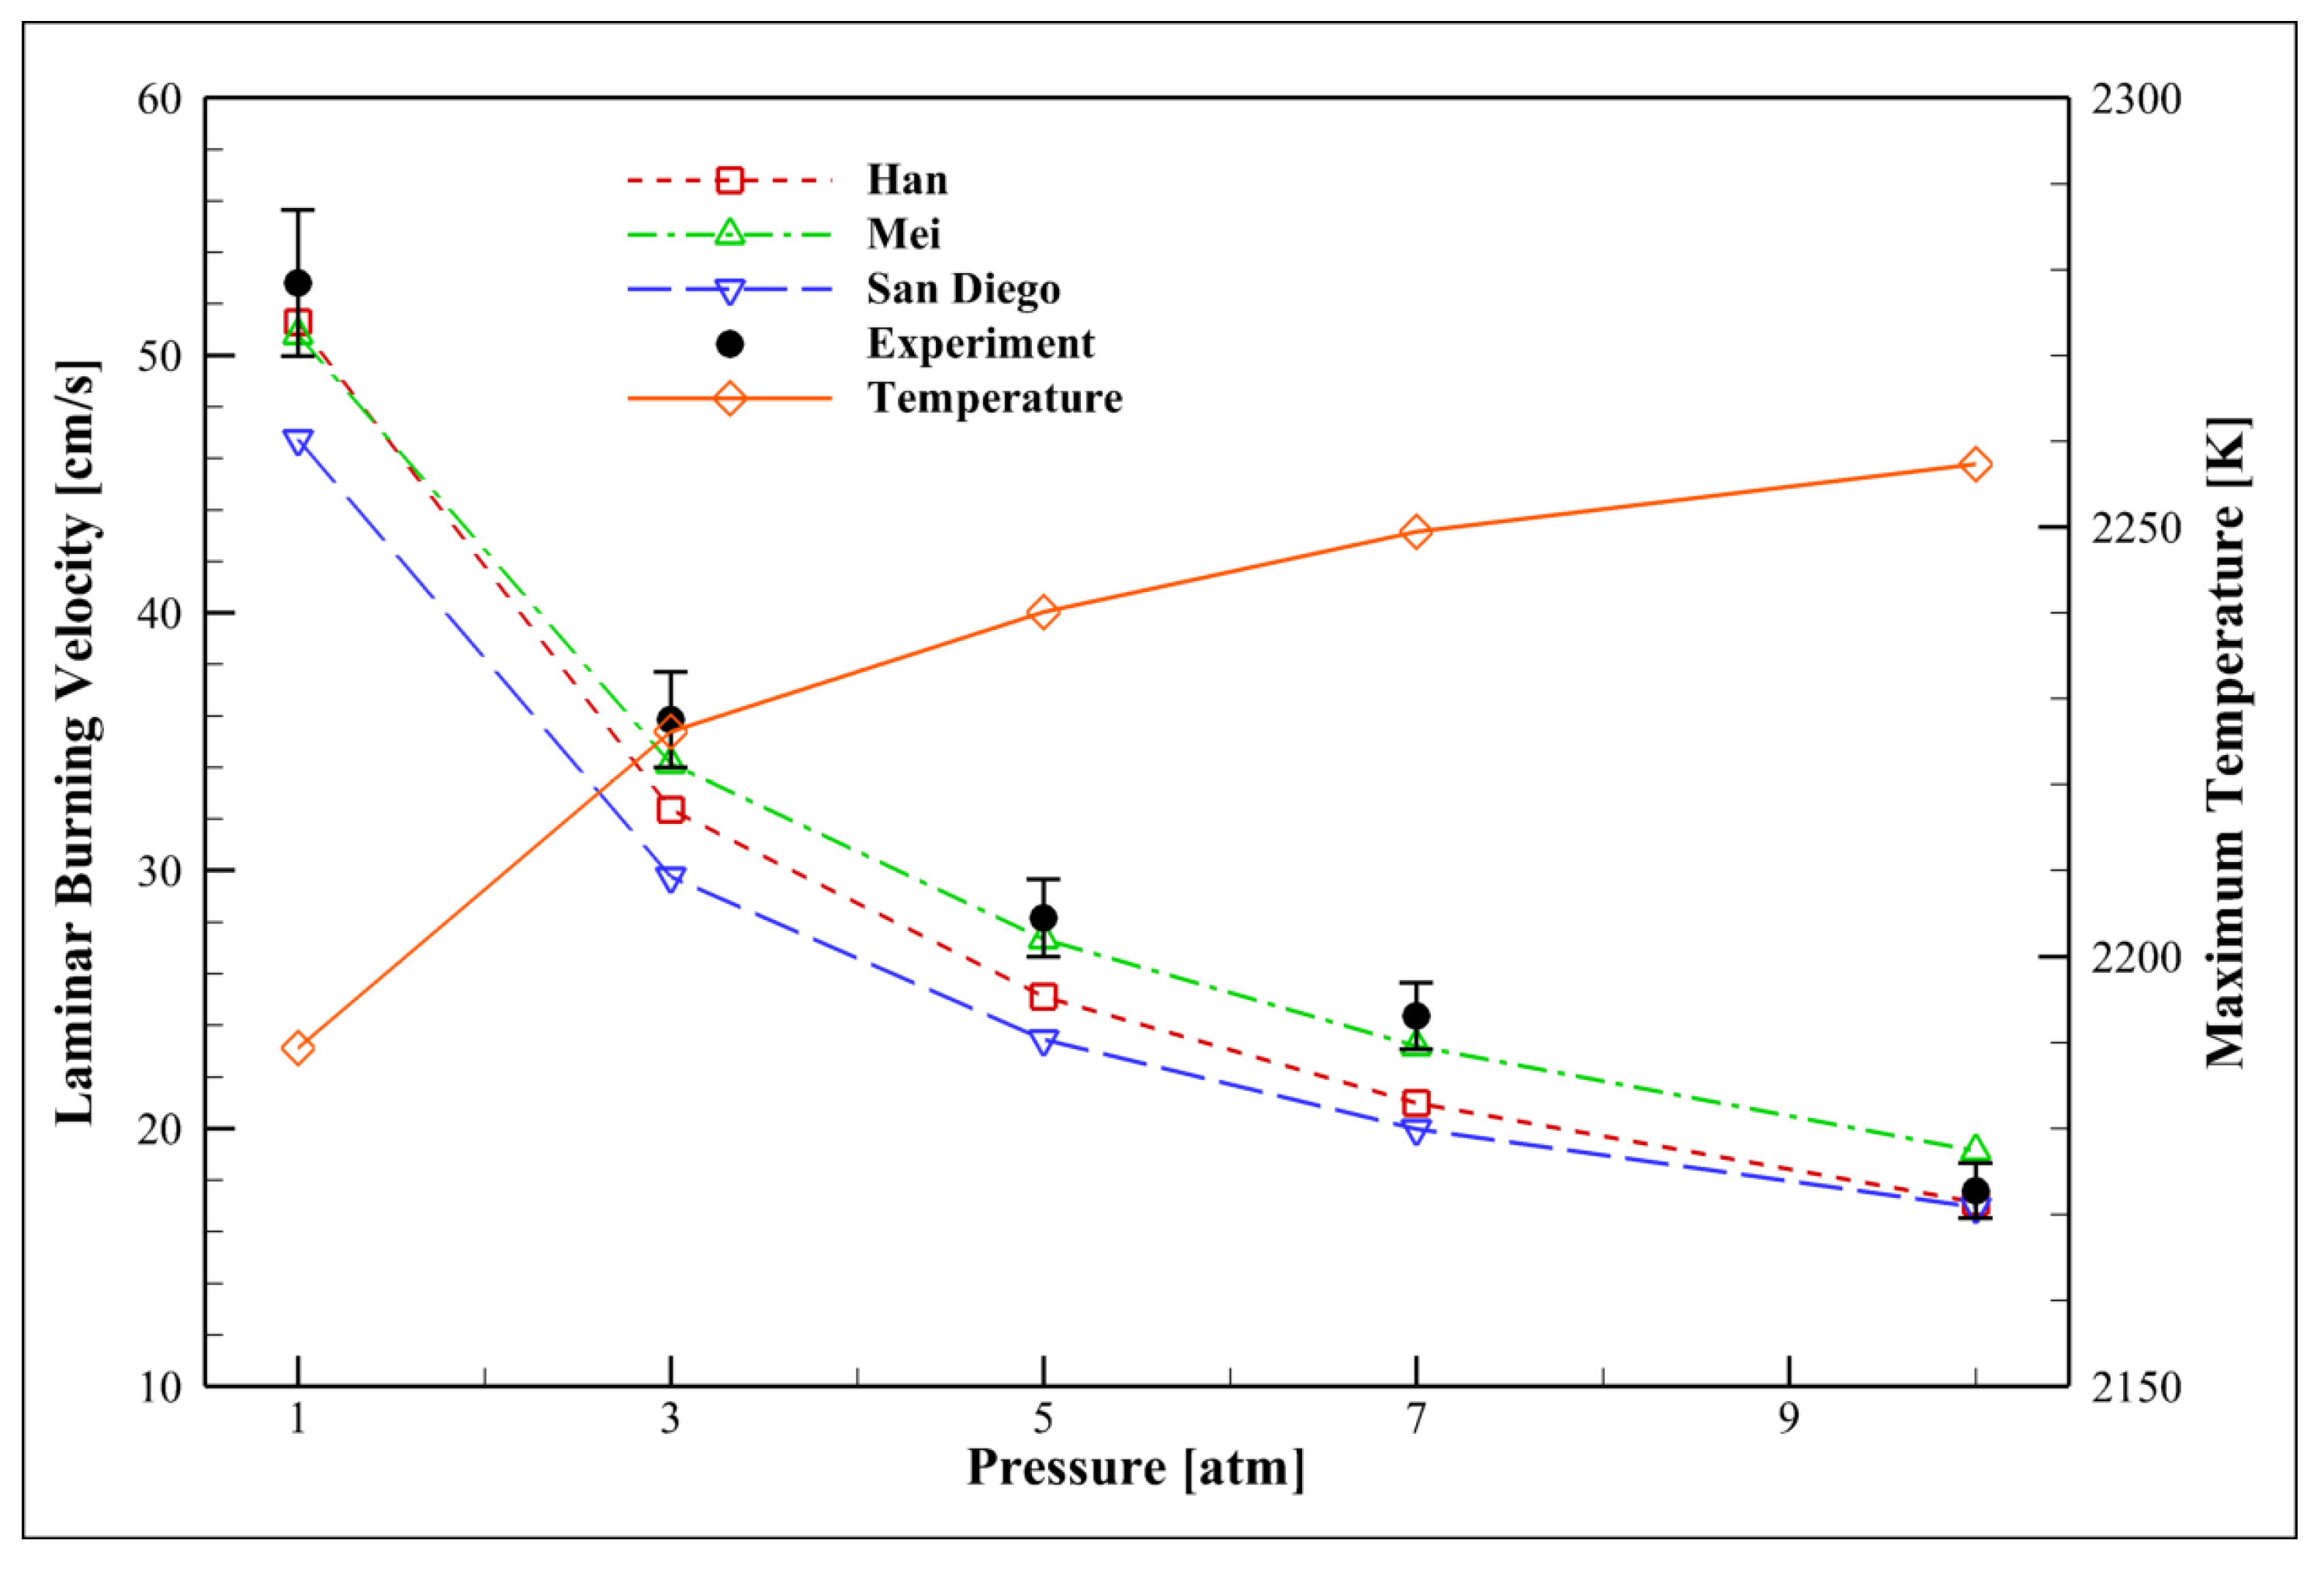
Figure 9a shows the significant effect of the pressure on the flame propagation of ammonia/syngas/air mixtures. Increasing pressure causes the LBV to drop quickly. This reverse dependence has been validated experimentally in the form l n ( S u S u 0 ) l n ( P u 0 P u ) [48,49], where S u 0 is the LBV at the reference pressure P u 0 , which is usually the atmospheric pressure.
Chamber’s pressure history throughout the flame propagation at φ = 1.0 for various pressures is depicted in Figure 9a. It is evident that the flame surface was very smooth when P u was equal to atmospheric pressure. When P u was increased to 10 atm, it turned out to be more wrinkled, making it unstable and prone to cellular instabilities [50]. The spherical flame’s size became smaller, and the speed of the flame decreased as the mixture’s initial pressure increased.
From a kinetic point of view, increasing the pressure increases chemical reactions. By examining Figure 9a, it can be seen that the pressure has a strong reverse influence on the radical pool level (high pressure → low radical). Under such conditions, radicals are generated and destroyed suddenly. As a result, a higher pressure results in a lower radical pool level.
As shown in Figure 9b, increasing pressure leads to decreasing NO formation. Le Chatelier’s principle states that the equilibrium goes toward neutralizing change [51]. Therefore, by the increment of pressure, the system goes toward decreasing the mole number.
The decrement of NO formation is expected due to the following reaction:
4 N H 3 + 5 O 2 4 N O + 6 H 2 O
Similarly, CO decreases, and CO2 increases with pressure.
2 C O + O 2 2 C O 2
Due to the high reactivity of NH3 (compared to CO), NO (R1) concentration changes much more than CO and CO2 (R2).
As shown in Figure 10, with the increase in pressure, the maximum flame temperature obtained increases due to the interaction of species. It is expected that increasing pressure increases concentration, leading to the chemical effect. As a result, the temperature increases when the pressure rises.

4.7. Examining the Equivalence Ratio

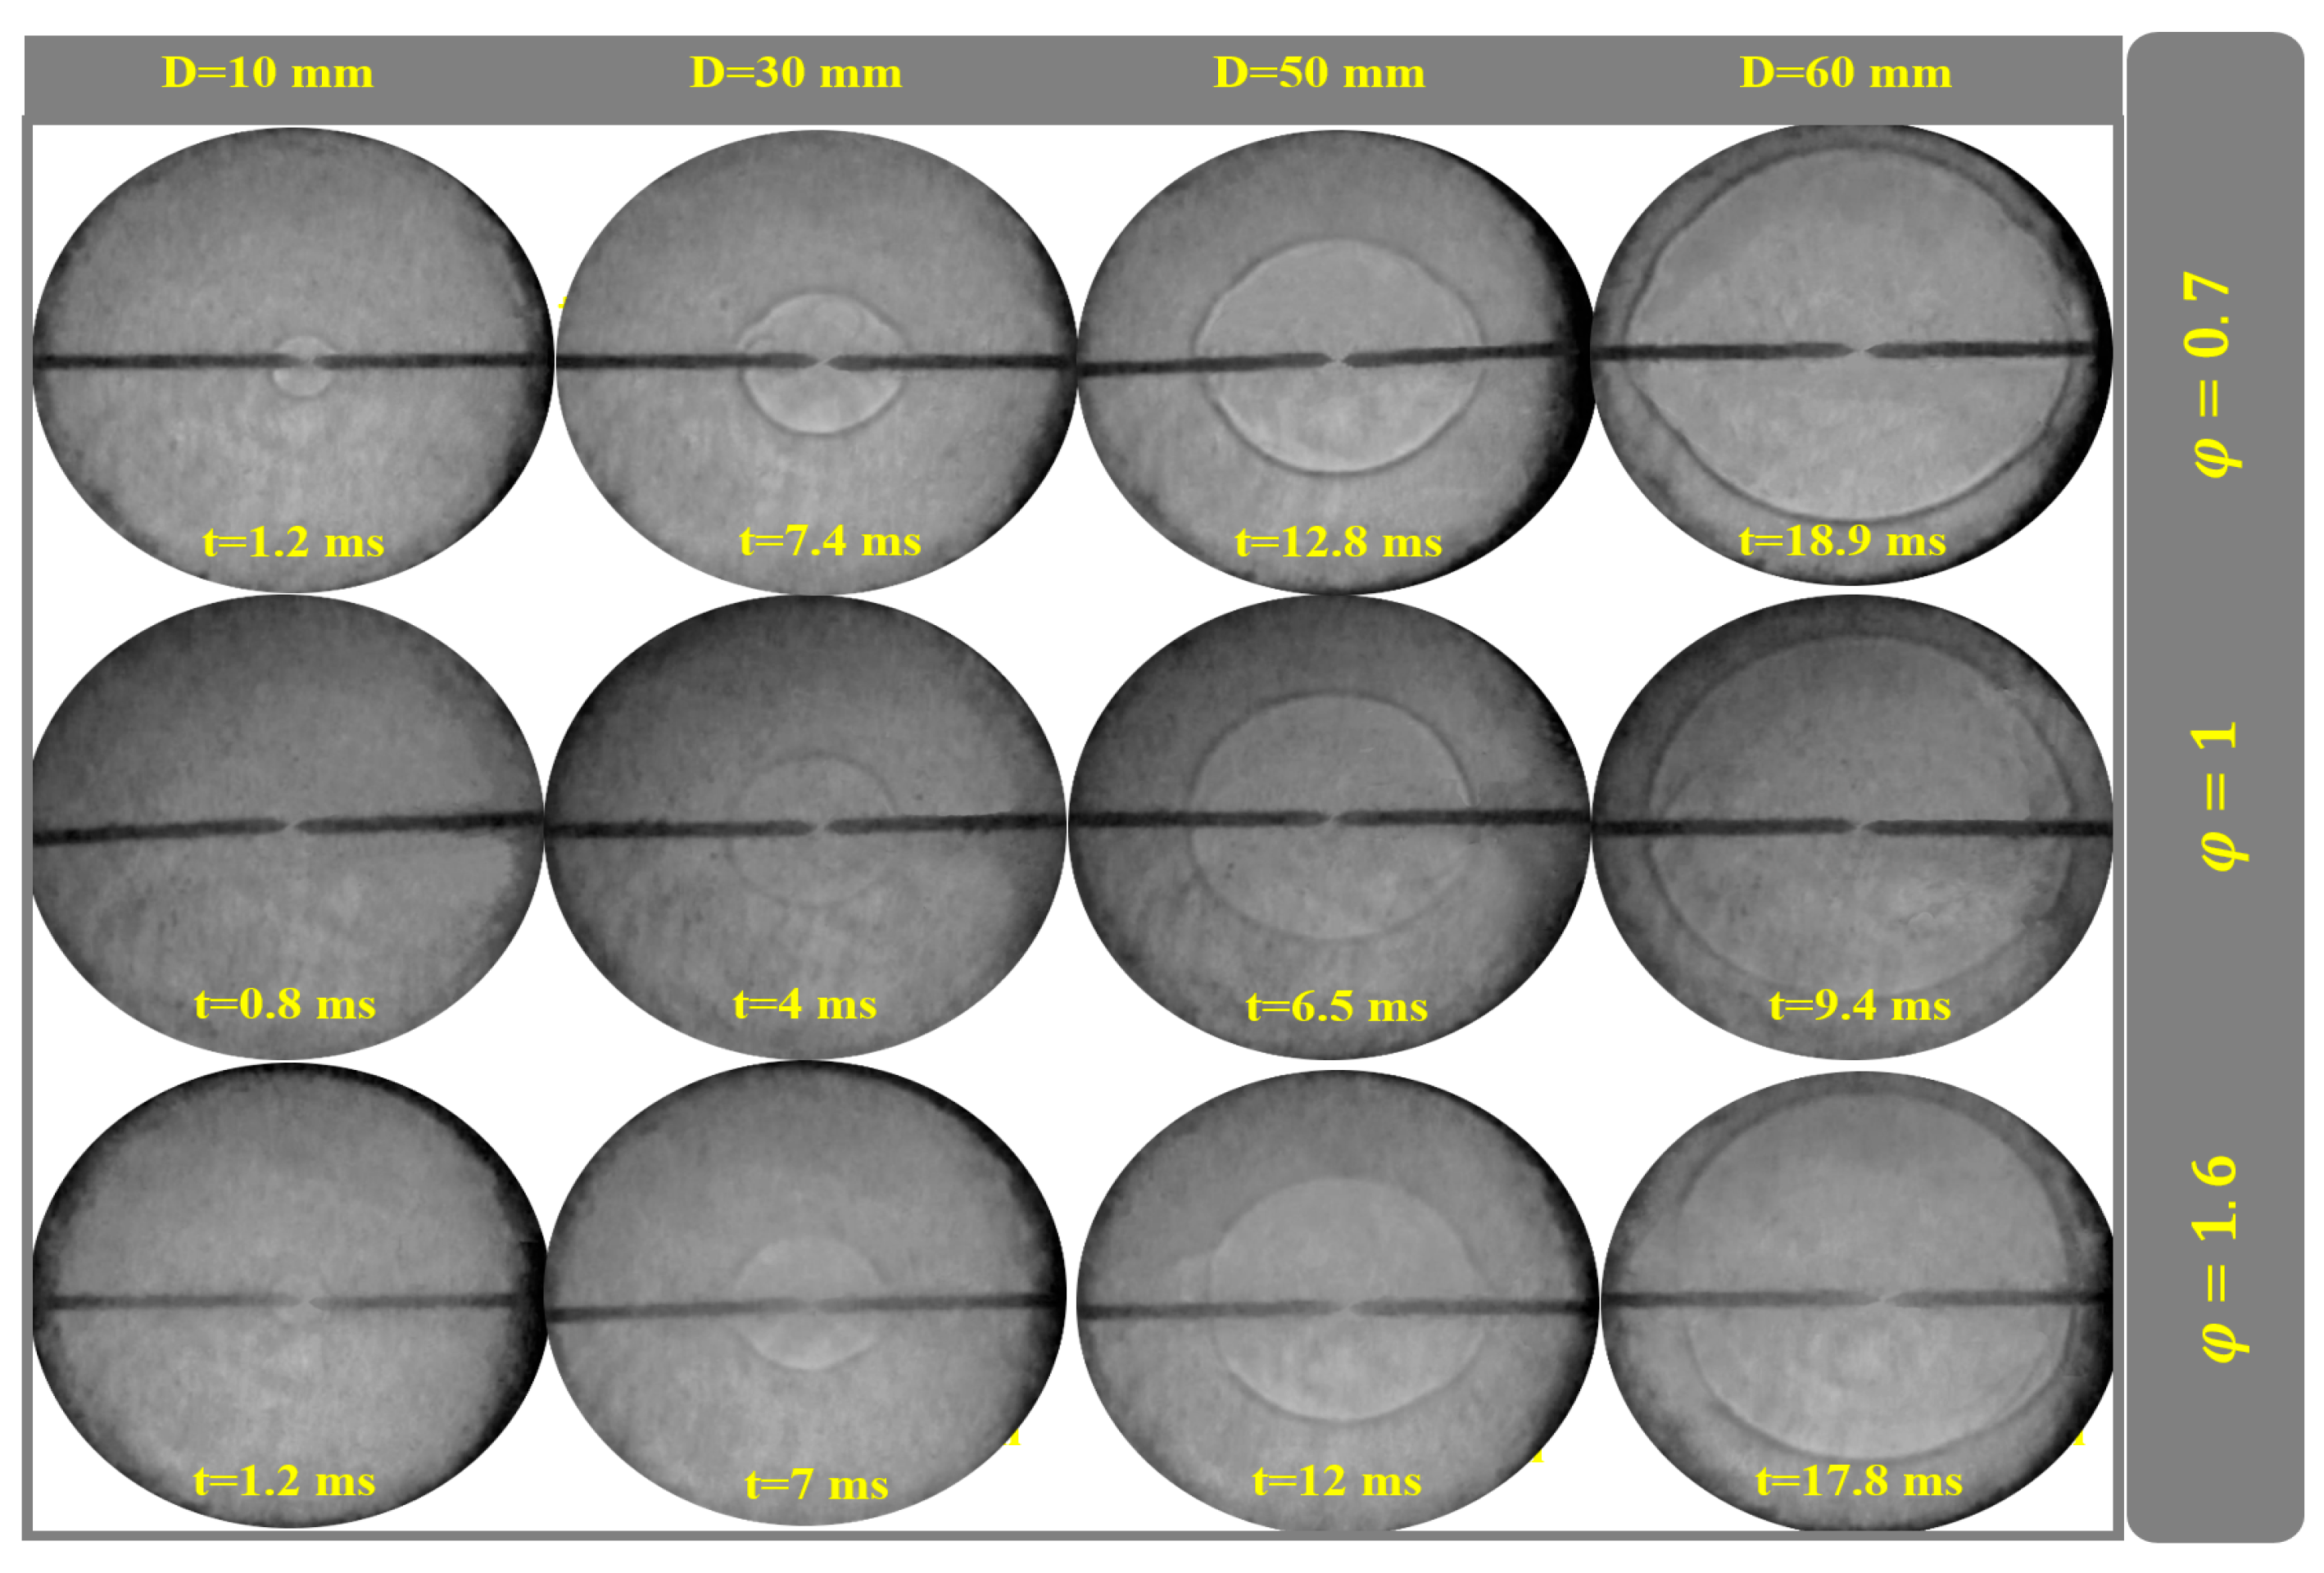
Ammonia/syngas/air mixture spherically propagating flames were visualized using Schlieren photography, and the results are shown in Appendix A (Figure A1) for different equivalence ratios. Compared to ammonia/air mixture spherically propagating flames, which exhibit an intense buoyancy effect, there is no such effect in ammonia/syngas/air flames, since the spherical nature of the flame surface is good enough. This behavior shows that these flames can propagate faster than the ammonia/air flames. The buoyancy effect can be alleviated by accelerated flame propagation [7]. Ronney and Wachman [52] reported that the effect of buoyancy on S l becomes considerable for the flame with S l less than 15 cm/s, and since there is no case with S l lower than 15 cm/s in the NH3/syngas/air flame, S l measurement is easy. In the case of φ = 0.7–1.5, the calculation of the equivalent flame radius was easy to carry out, as the edges of the flames were observed. On the other hand, the flame’s bottom boundary was not entirely visible in cases where φ was significantly lower than 0.7 or higher than 1.6.
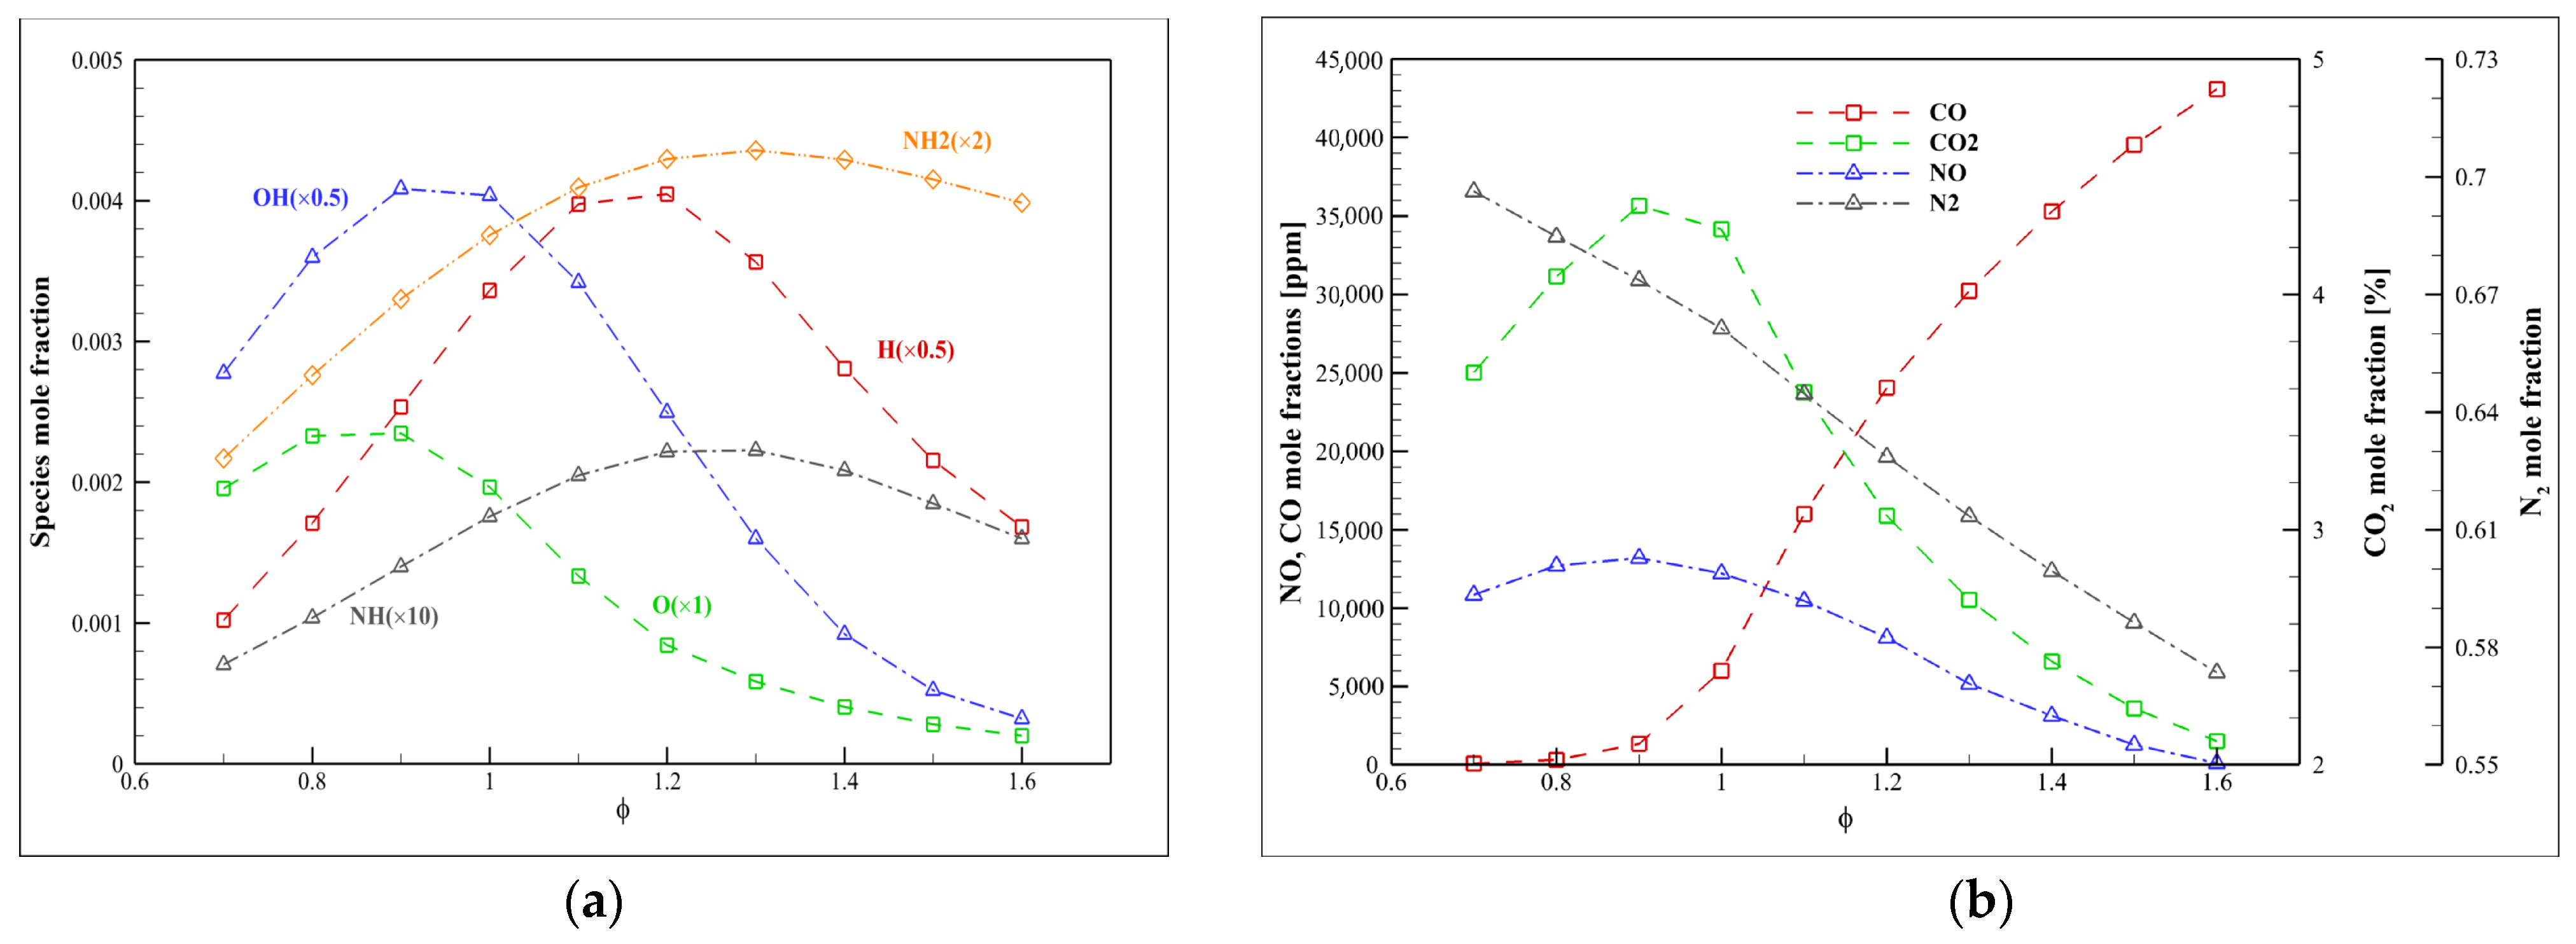
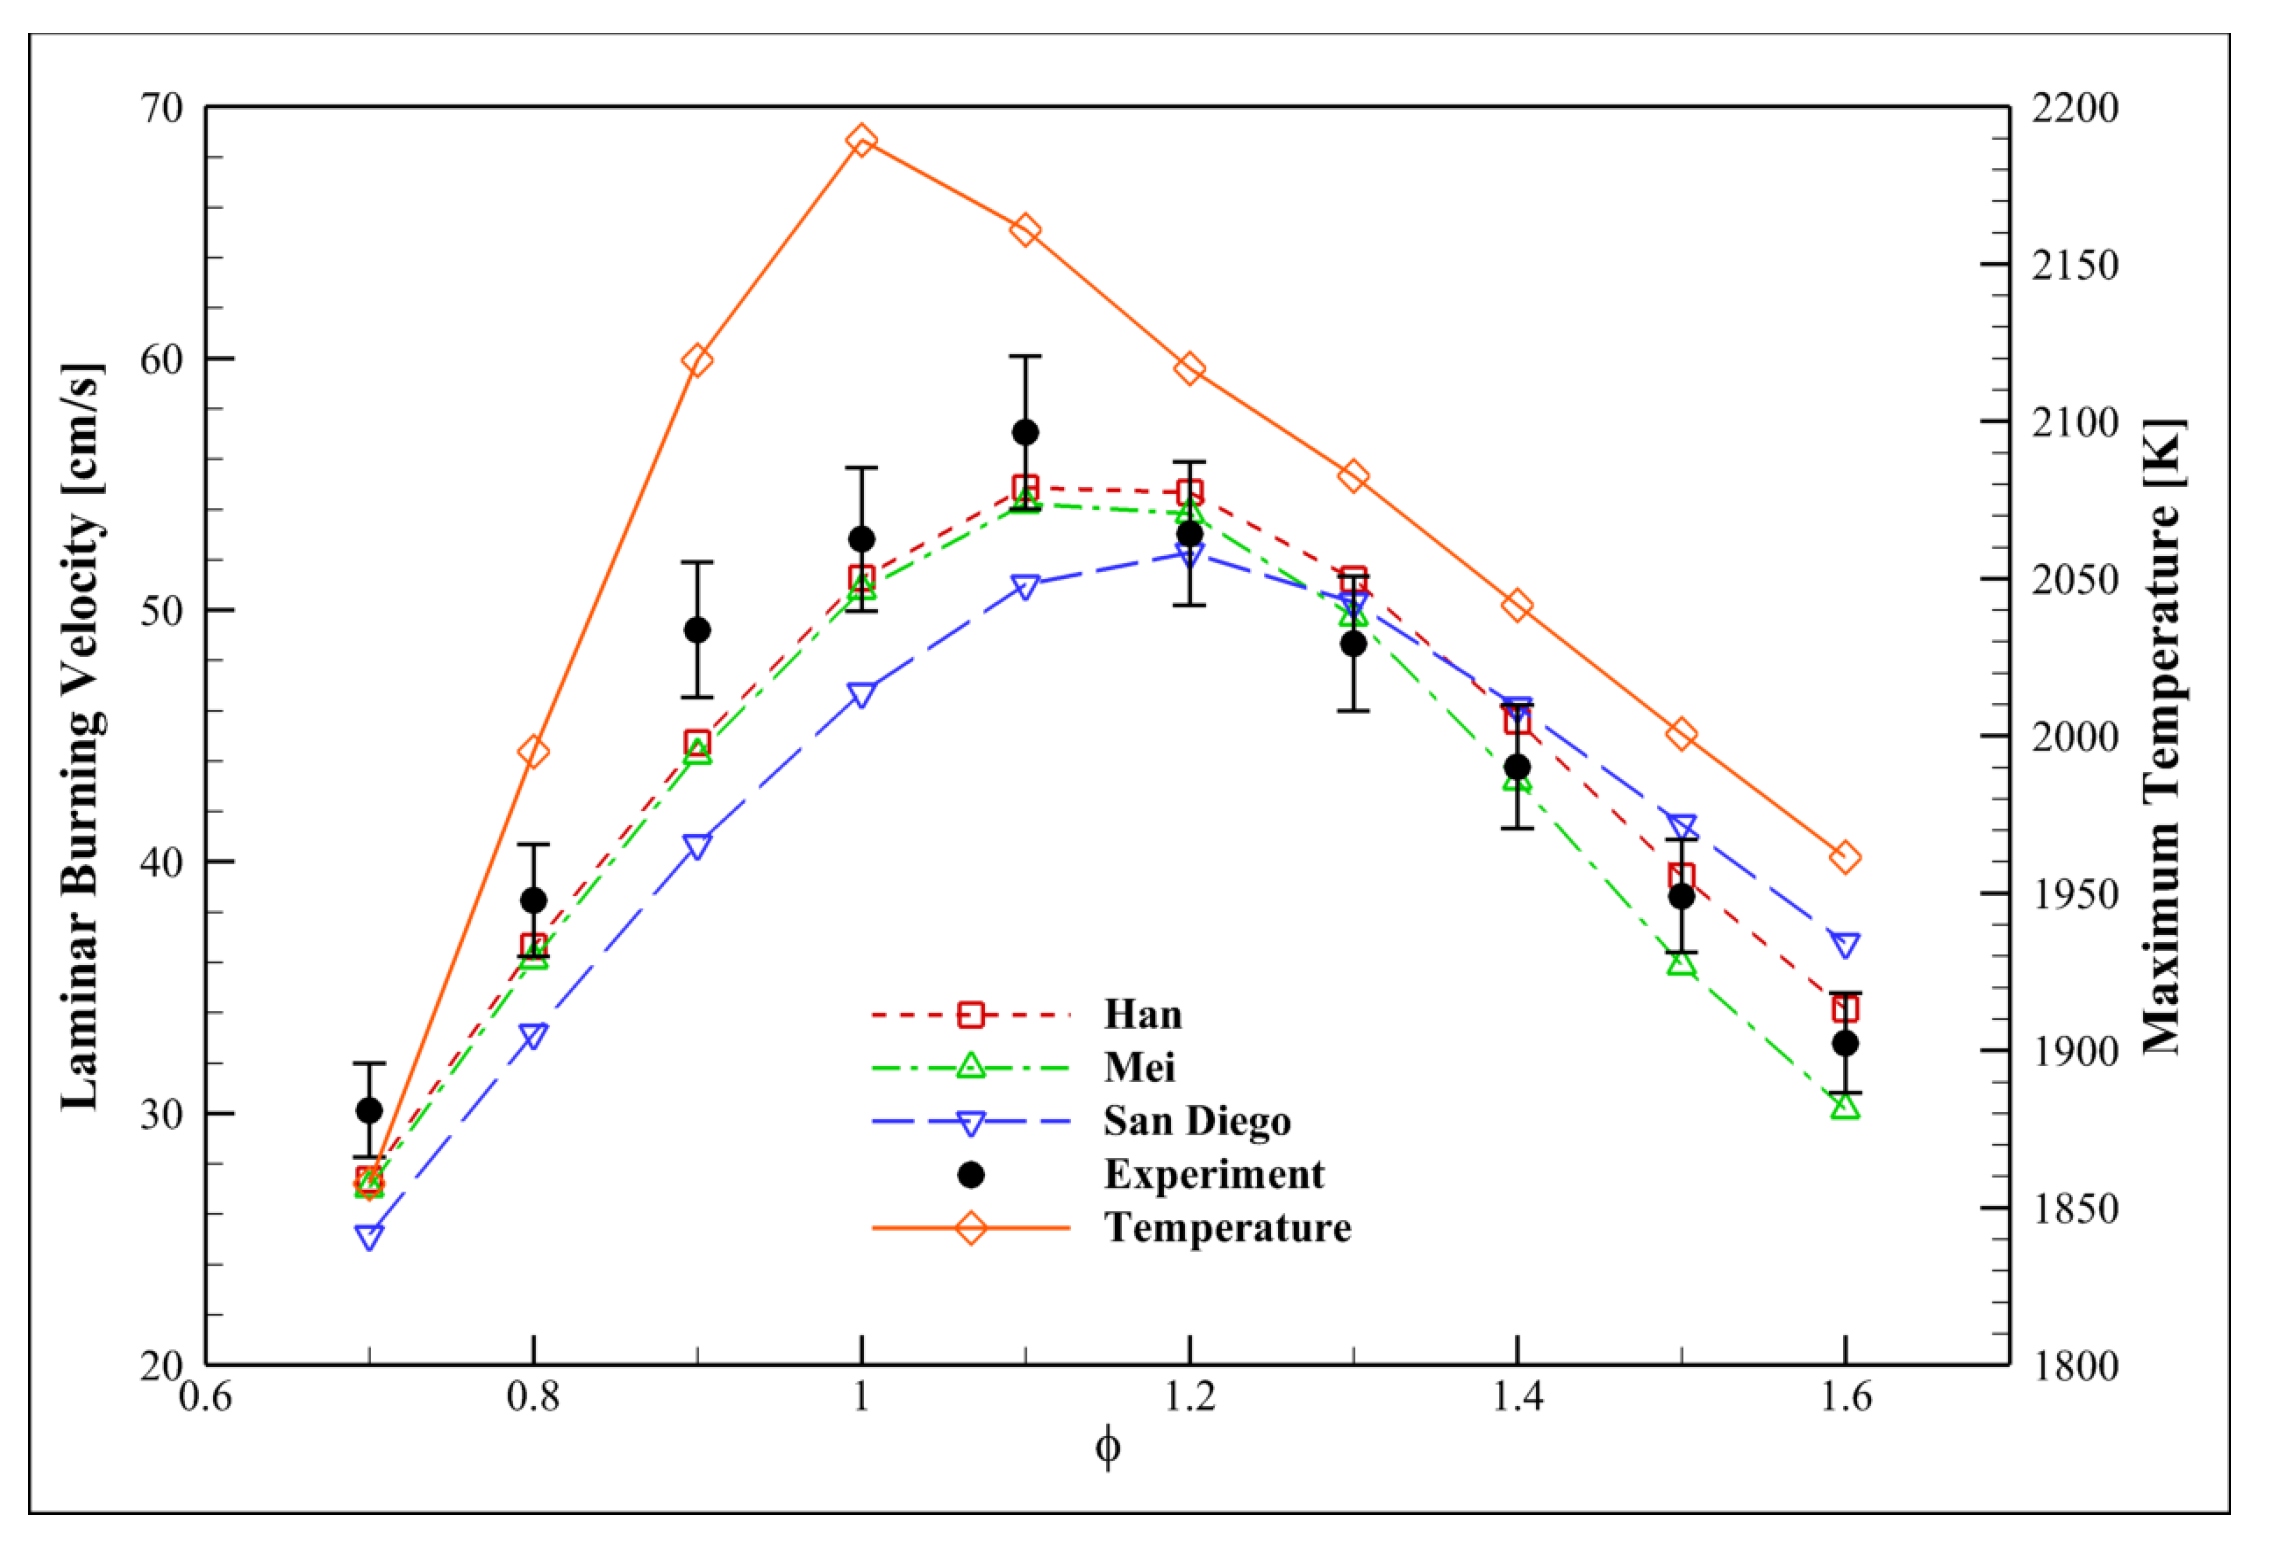
From Figure 11a, it can be seen that the peak value of temperature occurs around the stoichiometric condition. The temperature diagrams show that the temperature decreases drastically compared with the stoichiometric condition. In lean mode, quite a bit of energy is consumed to preheat excess air. On the other hand, the lower temperature in rich mode than the stoichiometric condition resulted from incomplete combustion.
As shown in Figure 11b, the NO concentration in the lean burn state is higher than in the rich burn case but less than in the stoichiometric condition.
Also, O2 is a significant factor in OH formation. O2 attacks the hydrogen of ammonia. This results in the production of more OH radicals.
  N H 3 + O 2 N H 2 + O H
A high oxygen presence in lean conditions results in high OH and O radicals.
Higher amounts of O2 molecules can explain this trend in lean burn combustion. Highly reactive molecules of O2 do not allow CO2 and CO molecules to react with ammonia. Therefore, the ammonia is rapidly converted to NO through the reaction chain (R4 and R5) by consuming O and OH radicals:
N H 3 + O , + O H N H 2 + O H N N H H N O + O , + O H N O
N H 3 + O , + O H N H 2 + O H N N H H N O + O , + O H N O 2 + O H , + O N O
The other key role in NO generation under lean conditions belongs to a loop shown in Figure 7.
The chain reaction listed below (R6 to R9) shows how radicals can be converted to NO emissions.
As can be seen in Figure 7, N O 2 plays a crucial species in NO formation under lean conditions.
The loop of NO is as follows:
N O + O H H N O + O ,   + O H N O
N O + O H H N O N O 2 + O , + O H N O
  N O + O H H O N O + O H , + O N O 2 N O
N O + O H H O N O H N O 2 + O H , + O N O 2 N O
Under these circumstances, lower concentrations of CO in the lean burn condition increase the chance of NH2 molecules reacting and generating HNO (the most important radical in NO formation).
Based on the results, the peak value of NO occurs at φ = 0.9. By evaluating the diagram path of NO formation, it can be concluded that NO formation diagrams have a loop of NO formation.
N H 3 + O , + O H N H 2 N O
N H 3 + O , + O H N H 2 N O 2 + O , + O H N O
N H 3 + O , + O H N H 2 + O , + O H N H + O , + O H N O
The loop of NO is as follows:
  N O + O H H O N O + O H , + O N O 2 N O
  N O + O H H O N O + O H H N O N O
N O + O H H O N O H N O 2 + O H , + O N O 2 N O
  N O + O H , + O N N H H N O + O H , + O N O
In rich combustion mode, because of the low O2 content, O2 becomes selective and reacts with NHi, which has weaker bonds than CO and H2. The reaction of NHi with oxygen leads to the formation of NH, NH2, and H radicals. This path causes NH, NH2, and H to become dominant species, unlike in lean conditions, in which OH and O were significant players. All of these make a reaction chain in the following stages:
N H 3 + O , + O H N H 2 + H , + O H N H + H , + O H N + N O , + N H 2 N 2
N H 3 + O , + O H N H 2 + N H N 2 H 3 N 2 H 2 + H , + O H N N H N 2
N H 3 + O , + O H N H 2 + H , + O H N H N H 2 N 2 H 2 + H , + O H N N H N 2
As mentioned before, NH and NH2 radicals’ concentration in the rich burn state is high, so the two reactions above are more important than the first one. Also, most of the NO reactions move toward N2.
N H 3 + O , + O H N H 2 N O
  N H 3 + O , + O H N H 2 + O , + O H H N O + O , + O H N O
  N H 3 + O , + O H N H 2 + O , + O H N H + O , + O H N H O + O , + O H N O
N H 3 + O , + O H N H 2 + O , + O H N H + O , + O H N O
N O + O , + O H N 2
The amount of CO emission released under lean conditions is much lower than in other cases. The main reason for this is related to the higher reactivity of oxygen molecules, which prevents CO2 from decomposing.
Under such conditions, CO tends toward CO2 formation as follows (R25):
  C O + O 2 C O 2 + O
In lean conditions, O2 species are consumed by CO to produce CO2. However, CO species are not consumed in rich conditions because of low oxygen. Therefore, in rich mode, CO would be a significant species. By evaluating the rich fuel combustion, it can be found that more CO is generated in this case compared with lean combustion. This trend may be attributed to the fact that in the rich mode, the CO2 concentration is much higher than O2. Therefore, CO2 has many more chances to react with the hydrogen radicals produced from ammonia reactions. The mentioned reaction generates CO and OH as follows (R26):
  C O 2 + H C O + O H
Evaluation of the rich combustion kinetics also reveals that lower amounts of CO2 are produced compared to the stoichiometric case. Since the mixture fuel goes through a complete combustion reaction under stoichiometric conditions, lower CO2 concentrations in rich-fuel conditions seem reasonable.
Figure 12 shows the effect of the equivalence ratio on the LBV. The LBV increases with the equivalence ratio in the lean flammability range. On the opposite side, it decreases on the rich side of the flammability range. The maximum recorded LBV occurs at ϕ = 1.05 for all cases and is higher than 25 cm/s for every condition under atmospheric pressure. As mentioned before, the presence of radicals such as O, OH, and H plays an essential role in increasing the burning velocity, and their peak level after combustion can be seen in Figure 11a.
LBV is strongly related to maximum flame temperature—large quantities of heat increase radicals’ pool level and accelerate the species decomposition rates. The LBVs increase with the equivalence ratio on the lean side, they decrease on the rich side, and the peak measured LBVs are found in the stoichiometric condition.
In lean flame conditions, large quantities of oxygen result in large amounts of O and OH radicals. OH is mainly produced in reactions between N H 3 + O 2 , H 2 + O 2 , and C O + H , while O can be produced under lean conditions in reactions involving CO.
C O + O 2 C O 2 + O
Considering the reaction path of syngas/ammonia oxidation under various equivalence ratios is useful. Note that all conditions considered are consistent with the base case condition. NH3 is almost totally consumed through H-atom abstraction reactions by H ( N H 3 + H N H 2 + H 2 ), OH ( N H 3 + O H N H 2 + H 2 O ), and O ( N H 3 + O N H 2 + O H ) to form the NH2 radical at both equivalence ratios. The other preferred products of NH2 are different at different equivalence ratios, i.e., HNO ( H N O + H N H 2 + O ), NNH ( N H 2 + N O N N H + O H ), and N2 ( N H 2 + N O N 2 + H 2 O ) in the lean flame and N2H2 ( N H 2 + N H N 2 H 2 + H ) and N2H3 ( N H 2 + N H N 2 H 3 ) in the rich flame. The lean and rich flame significantly differ in the H-abstraction reactions of NH2.
The insufficient amount of oxygen in rich flames causes the reaction N H 2 + N H N 2 H 2 + H to take place and produce H radicals, which in turn causes the LBV to increase. This reaction and those involving NHi compounds are more significant in the rich flame range. On the other hand, N2H2 significantly decreases the LBV. This component is produced by N H 2 + N H N 2 H 2 + H or by N H 2 + N H 2 N 2 H 2 + H 2 , a self-recombining reaction. This is because in rich flames, NH2 and H2 compete to react with O radicals in reactions N H 2 + O H N O + H and O + H 2 H + O H , and the former plays a vital role in increasing LBV; the acceleration of NH2 + O = HNO + H would hinder the fast expansion of the flame.
Furthermore, NH3-related flames are highly influenced by NH2; therefore, the uncertainty associated with elementary reactions involving O and OH radicals and NH2 makes the prediction of the LBV in lean flame conditions difficult [52].
From a thermodynamic point of view, since flame propagation is a function of temperature, a higher maximum flame temperature causes a higher LBV.

4.8. Examining the Fuel Composition Effect

Ammonia/syngas/air premixed mixtures were visualized using Schlieren images, and the corresponding spherically propagating flames are shown in Appendix A (Figure A2 and Figure A3), during which the initial mixture pressure was 0.1 MPa. As the ratio of hydrogen, β , was increased, the time for reaching a specific radius, i.e., the flame propagating speed decreased. Also, when this ratio was above 0.4, some wrinkles induced by diffusive–thermal instability at the flame front could be observed. As this ratio was increased along with the increase in initial mixture pressure, a thinning in the laminar flame thickness was observed. This observation is a crucial parameter for flame front wrinkling. Thus, the wrinkling of the flame front was visible at high hydrogen ratios.

4.9. Syngas

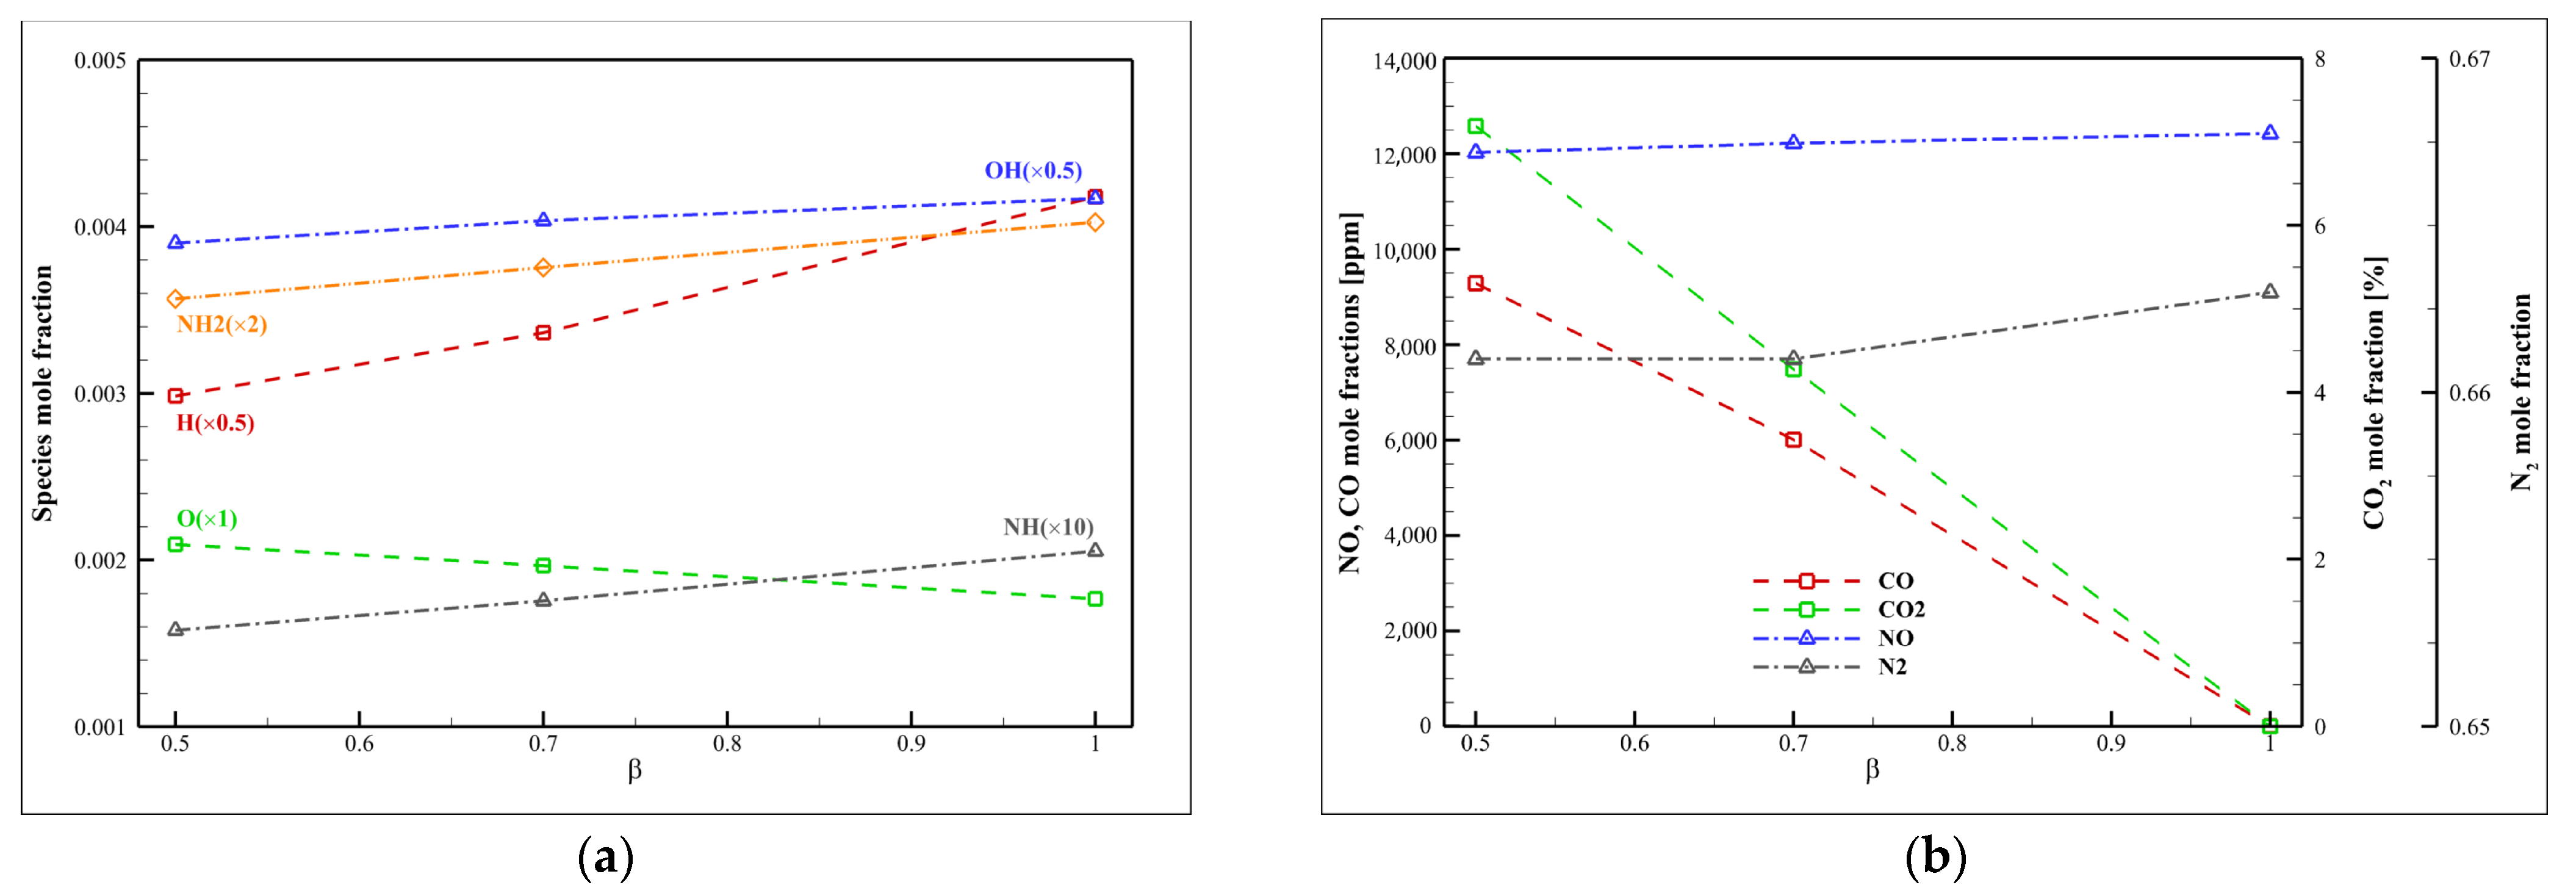
The LBV of NH3/syngas/air flames enhances with an increase in H2. Chemical, thermal, and transport effects usually cause the augmentation of S l . Furthermore, it expresses that the LBV of ammonia–air flames is more sensitive to hydrogen addition than to carbon monoxide. More clearly, hydrogen has the most significant effects on enhancing the LBV of ammonia–air flames. Thus, the addition of syngas to fuel mixtures can strongly increase the laminar flame speed of ammonia in air. Therefore, by the increment of hydrogen, the LBV of NH3/syngas/air mixtures tend to reach higher values.
It is worth noting that Han et al. [8] realized that the radical’s pool value in the NH3/CO/air flame has a strong reliance on S l . As shown in Figure 13a, the radical’s pool level increases as hydrogen increases in the mixture. Furthermore, the addition of hydrogen causes increasing hydrogen radical levels, therefore considerably improving the significance of the two elementary reactions H + O 2 O + O H and O + H 2 H + O H , which eventually elevates the production of the OH radical. The pathway of H + O 2 O + O H is the main source of the O radical’s generation. The generated oxygen radical is used up through the four pathways of O + H 2 H + O H , N H 3 + O N H 2 + O H , N N H + O N H + N O , and N H 2 + O H N O + H . Over time, the contest between generation and use gradually diminishes the maximum mole fraction of the oxygen radical’s level. Two important reactions, N H 3 + O H N H 2 + H 2 O and N H 2 + N H N 2 H 2 + H , play crucial roles in relation to S l .
Regarding the pollutant emissions, it can be concluded that increasing H2 has little effect on NO and NO2 emissions (Figure 13b). Indeed, just negligible increases in NO and small decrements in NO2 pollutants were observed. First, it can be concluded that H2 and CO have approximately the same effect on NOx emission. Second, because of the higher reactivity of H2 than CO, increasing the H2/CO ratio causes more O radical formation. The chain reactions may be expected to continue as follows, to generate a little more NO:
N H 3 + O , + O H N H 2 + H , + O H N H + O N O
N H 3 + O , + O H N H 2 + O H N O + O , + O H N O
With a decrease in the fuel’s CO concentration, the results are expected to show a decrement in CO emission and CO conversion to CO2. Subsequently, CO2 emissions decrease similarly.
From a thermodynamic point of view, it is evident that CO species need more activation energy than hydrogen, which has been noted as a drawback of carbon monoxide compared with hydrogen. Therefore, the increment in H2 compared to CO leads to an increase in the LBV mixture.
It is visible in Figure 14 that the maximum flame temperature decreases with the increase in H2. However, the S l is constantly increasing. It indicates that the influence of the thermal effect on the rise in S l is declining. Due to the higher adiabatic flame temperature of carbon monoxide than hydrogen, it is expected that with the increment in hydrogen in the mixture, the flame temperature will decrease.

4.10. Ammonia

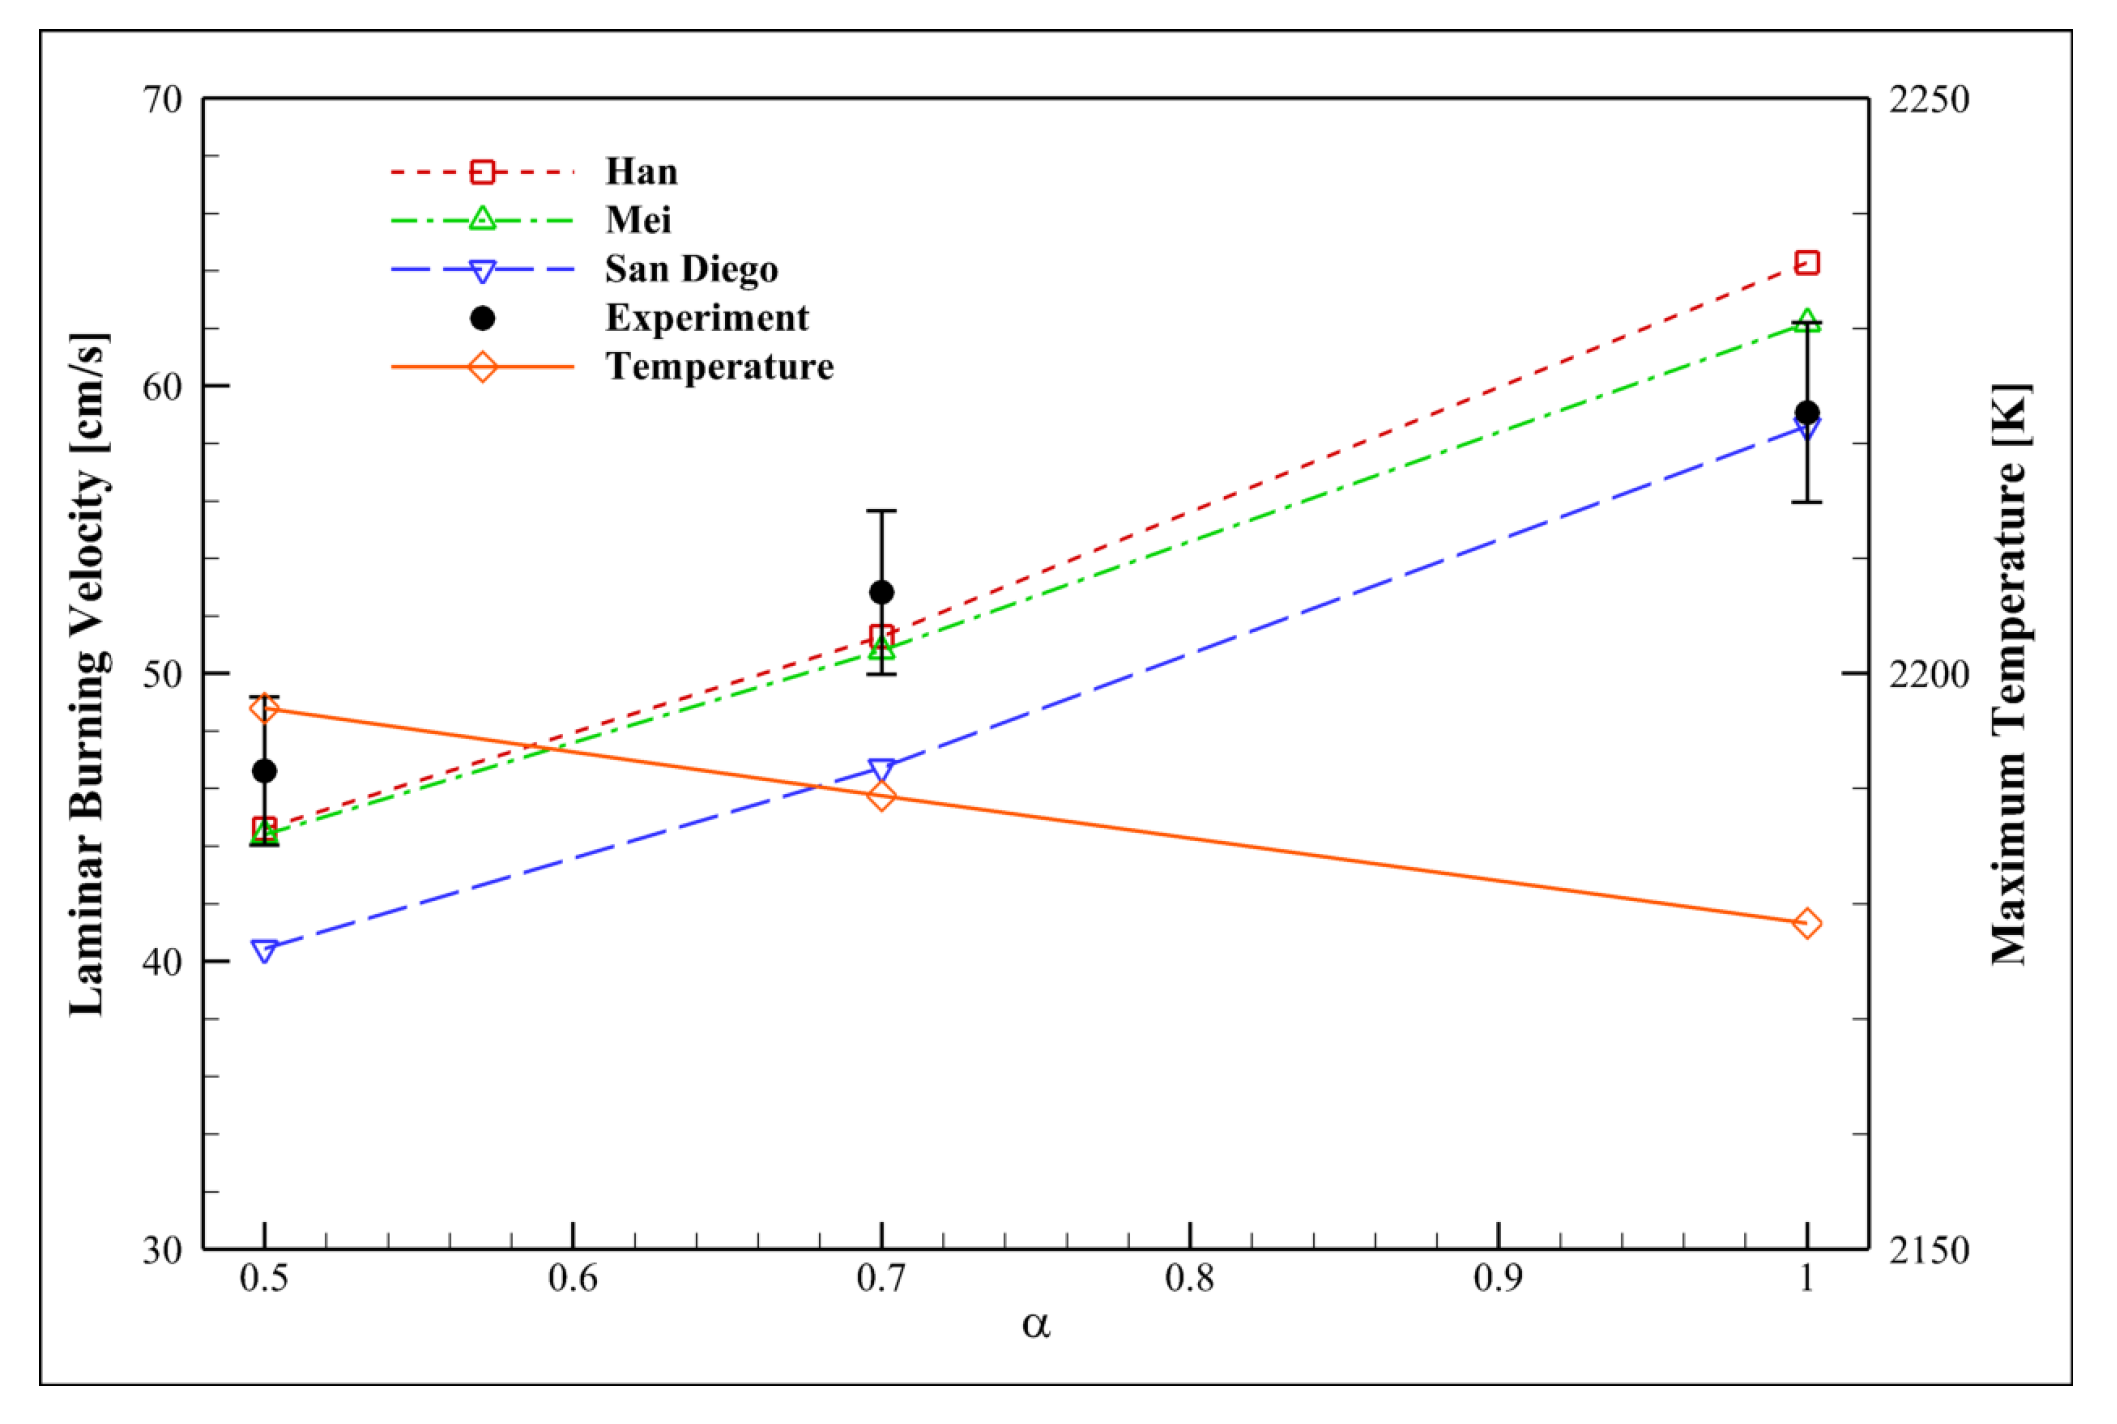
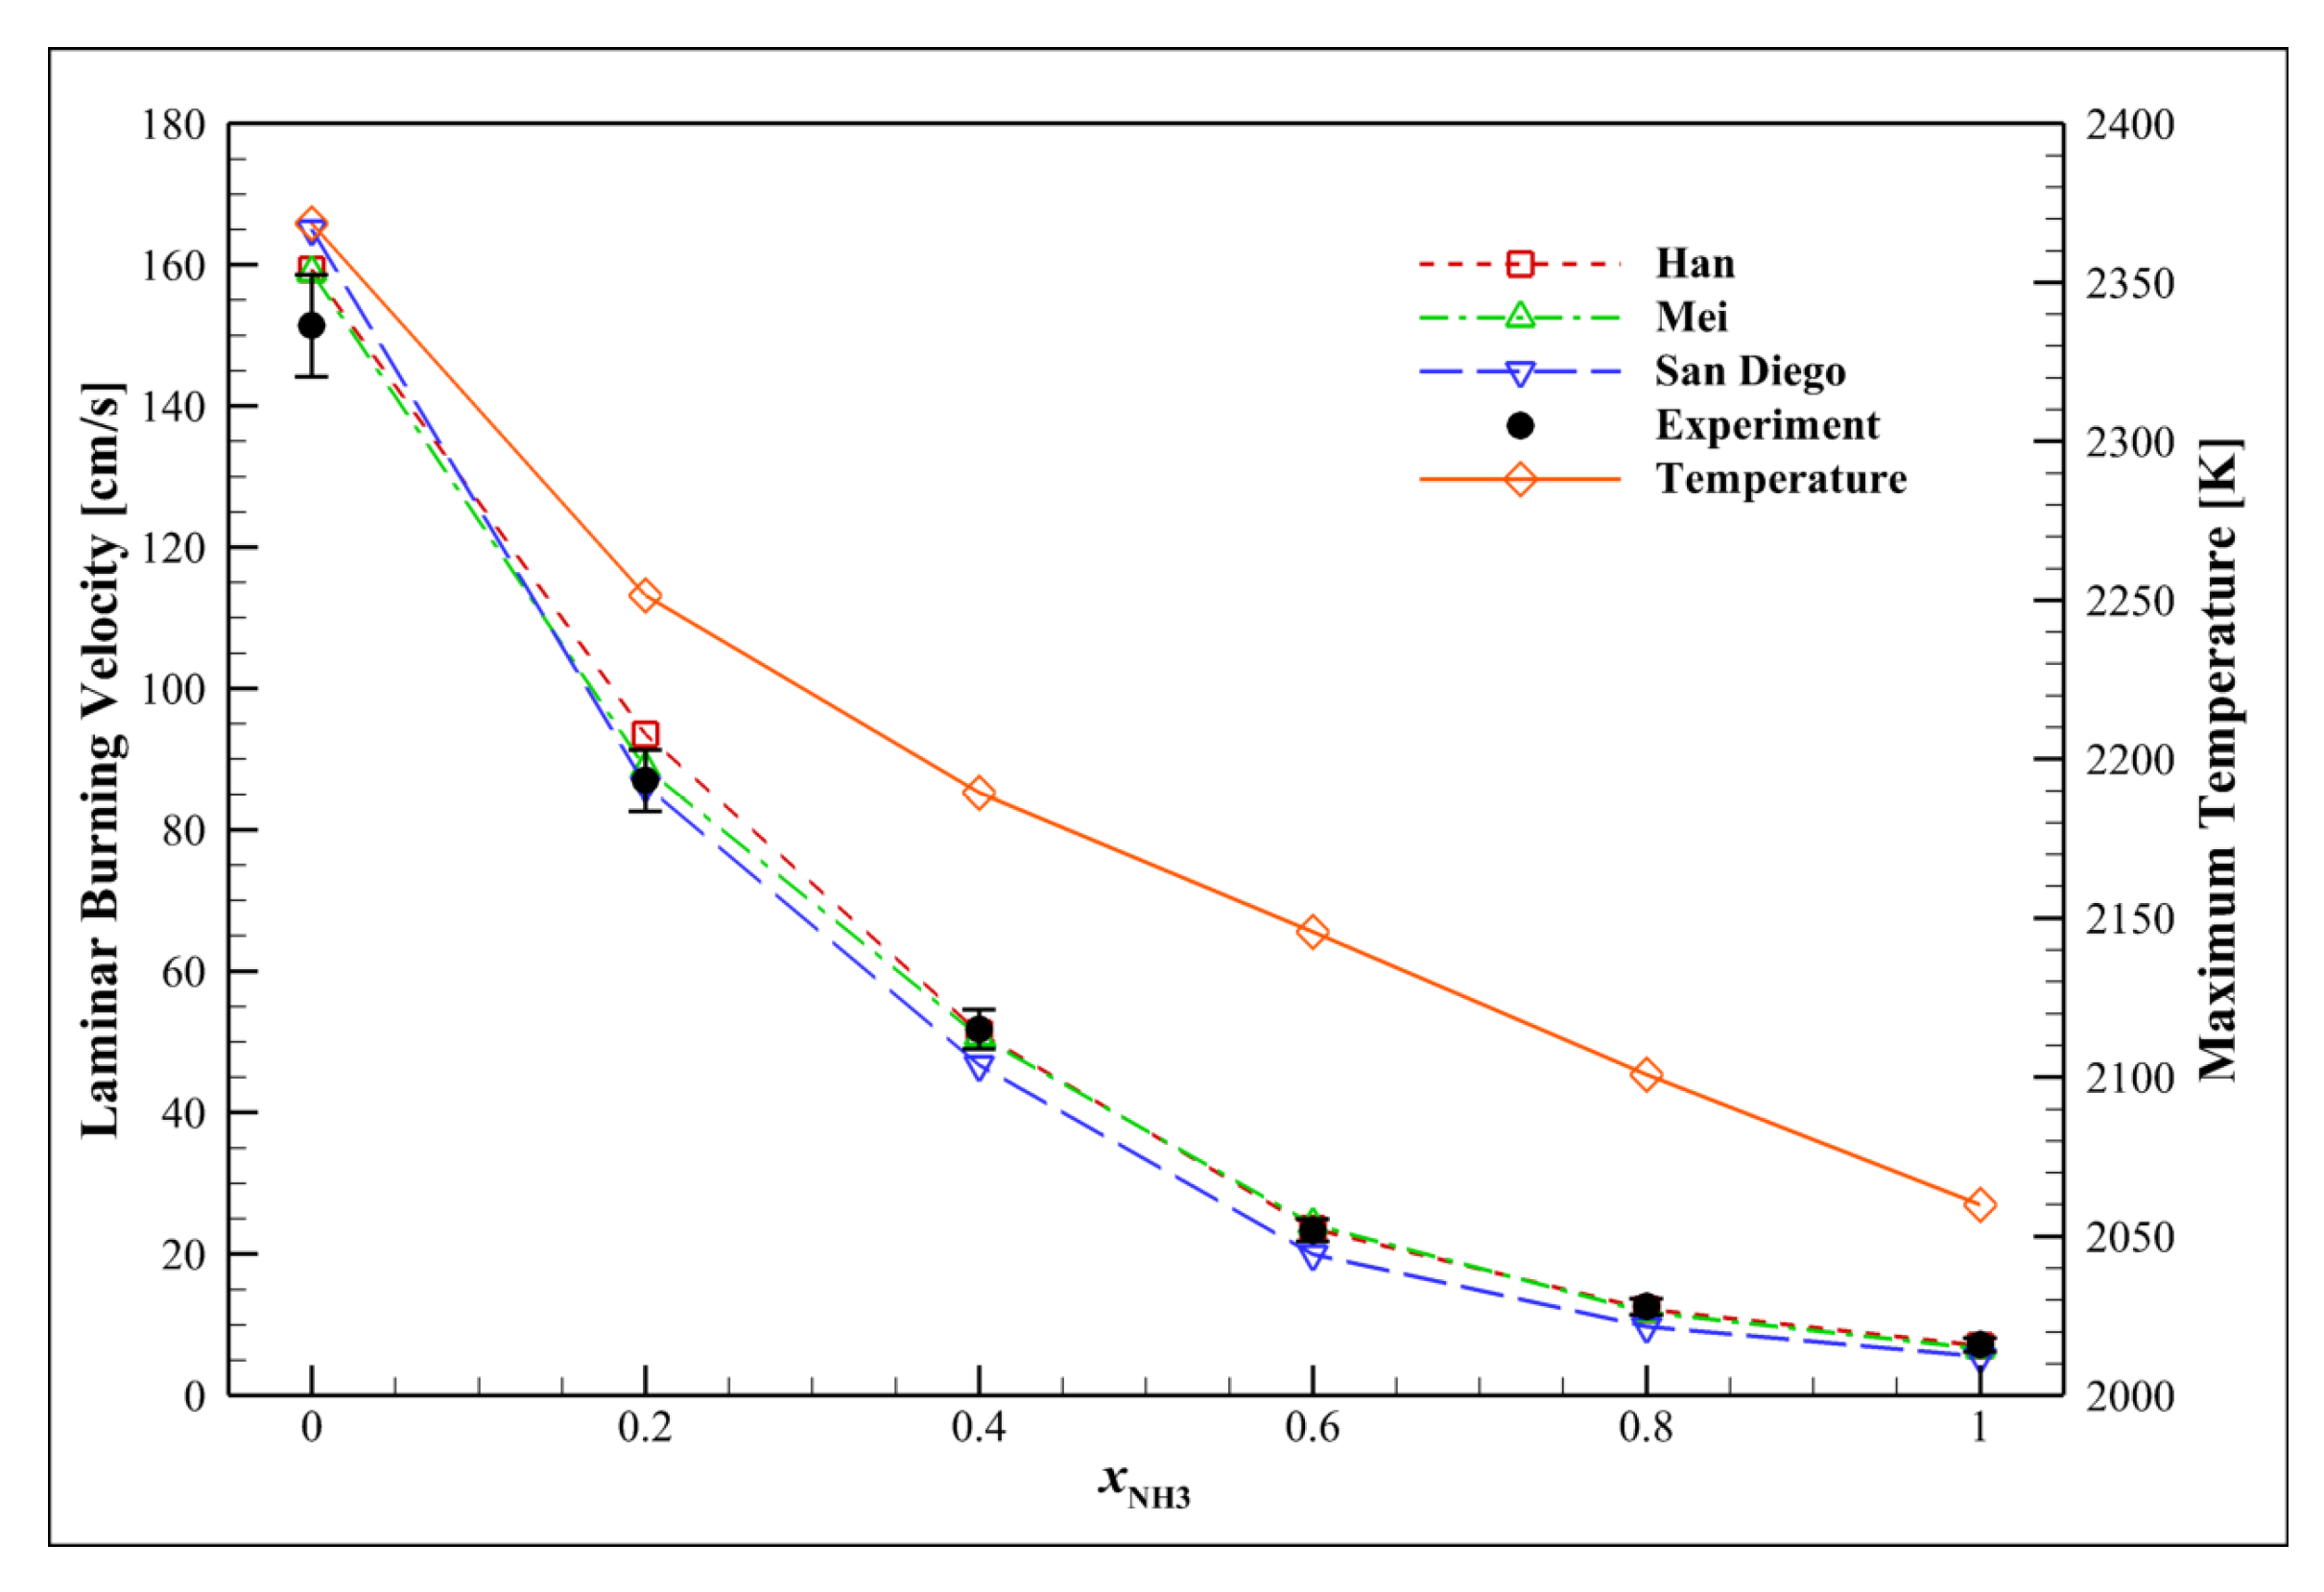
The burning rate of ammonia is highly dependent on the addition ratio of NH3 ( α ). A near-zero ammonia addition ratio results in a higher LBV, while a ratio near 1 causes the burning rate to be minimal. The addition of ammonia to the mixture causes a decrease in the radicals’ pool due to the reaction of radicals with NH3 (Figure 15a).
In examining the effect of ammonia, it should be noticed that ammonia increases NOx emissions. According to the reaction paths shown in Figure 7, increasing the ammonia concentration augments NH2 production, which is one of the main factors in NO emission generation. Therefore, the increment of NO emissions may be justified due to the addition of ammonia. Most NO emissions occur at α = 0.2 , with both thermal and fuel NOx attributed to NO formation. The turning point in Figure 15b can be justified by the fact that the thermal NOx effect, which is the essential NOx production route, decreases with the increase in NH3 in the fuel blend. Also, by reducing CO and H2 in the fuel blend, O radical production, which ultimately leads to the production of NO, decreases. In addition, increasing NH3 causes NH3 to be dominant. It leads to the generation of more OH, NH2, and NH radicals that can direct reactions to the production of N2 instead of NO. With a decrease in the fuel’s CO concentration, the results are expected to show a decrement in CO emissions and CO conversion to CO2. Subsequently, CO2 emissions decrease similarly.
N H 3 + O , + O H N H 2 + H , + O H N H + H , + O H N + N H 2 N 2
  N O + N H , + N H 2 N 2
From a thermodynamic point of view, because of the lower LBV of ammonia, the rising concentration of ammonia in the fuel mixture brings down the mixture’s LBV.
Increasing the NH3 concentration in the mixture decreases the maximum flame temperature, as shown in Figure 16. The combustion enthalpy of ammonia is lower than syngas, which causes lower heat release. As a result, more products lead to a lower maximum flame temperature. With higher α , the curve of flame speed converges to a determined value, which is clarified by the fact that the N2 route producing mechanism becomes dominant instead of the NO route mechanism.

4.11. Examining the Initial Temperature Effect

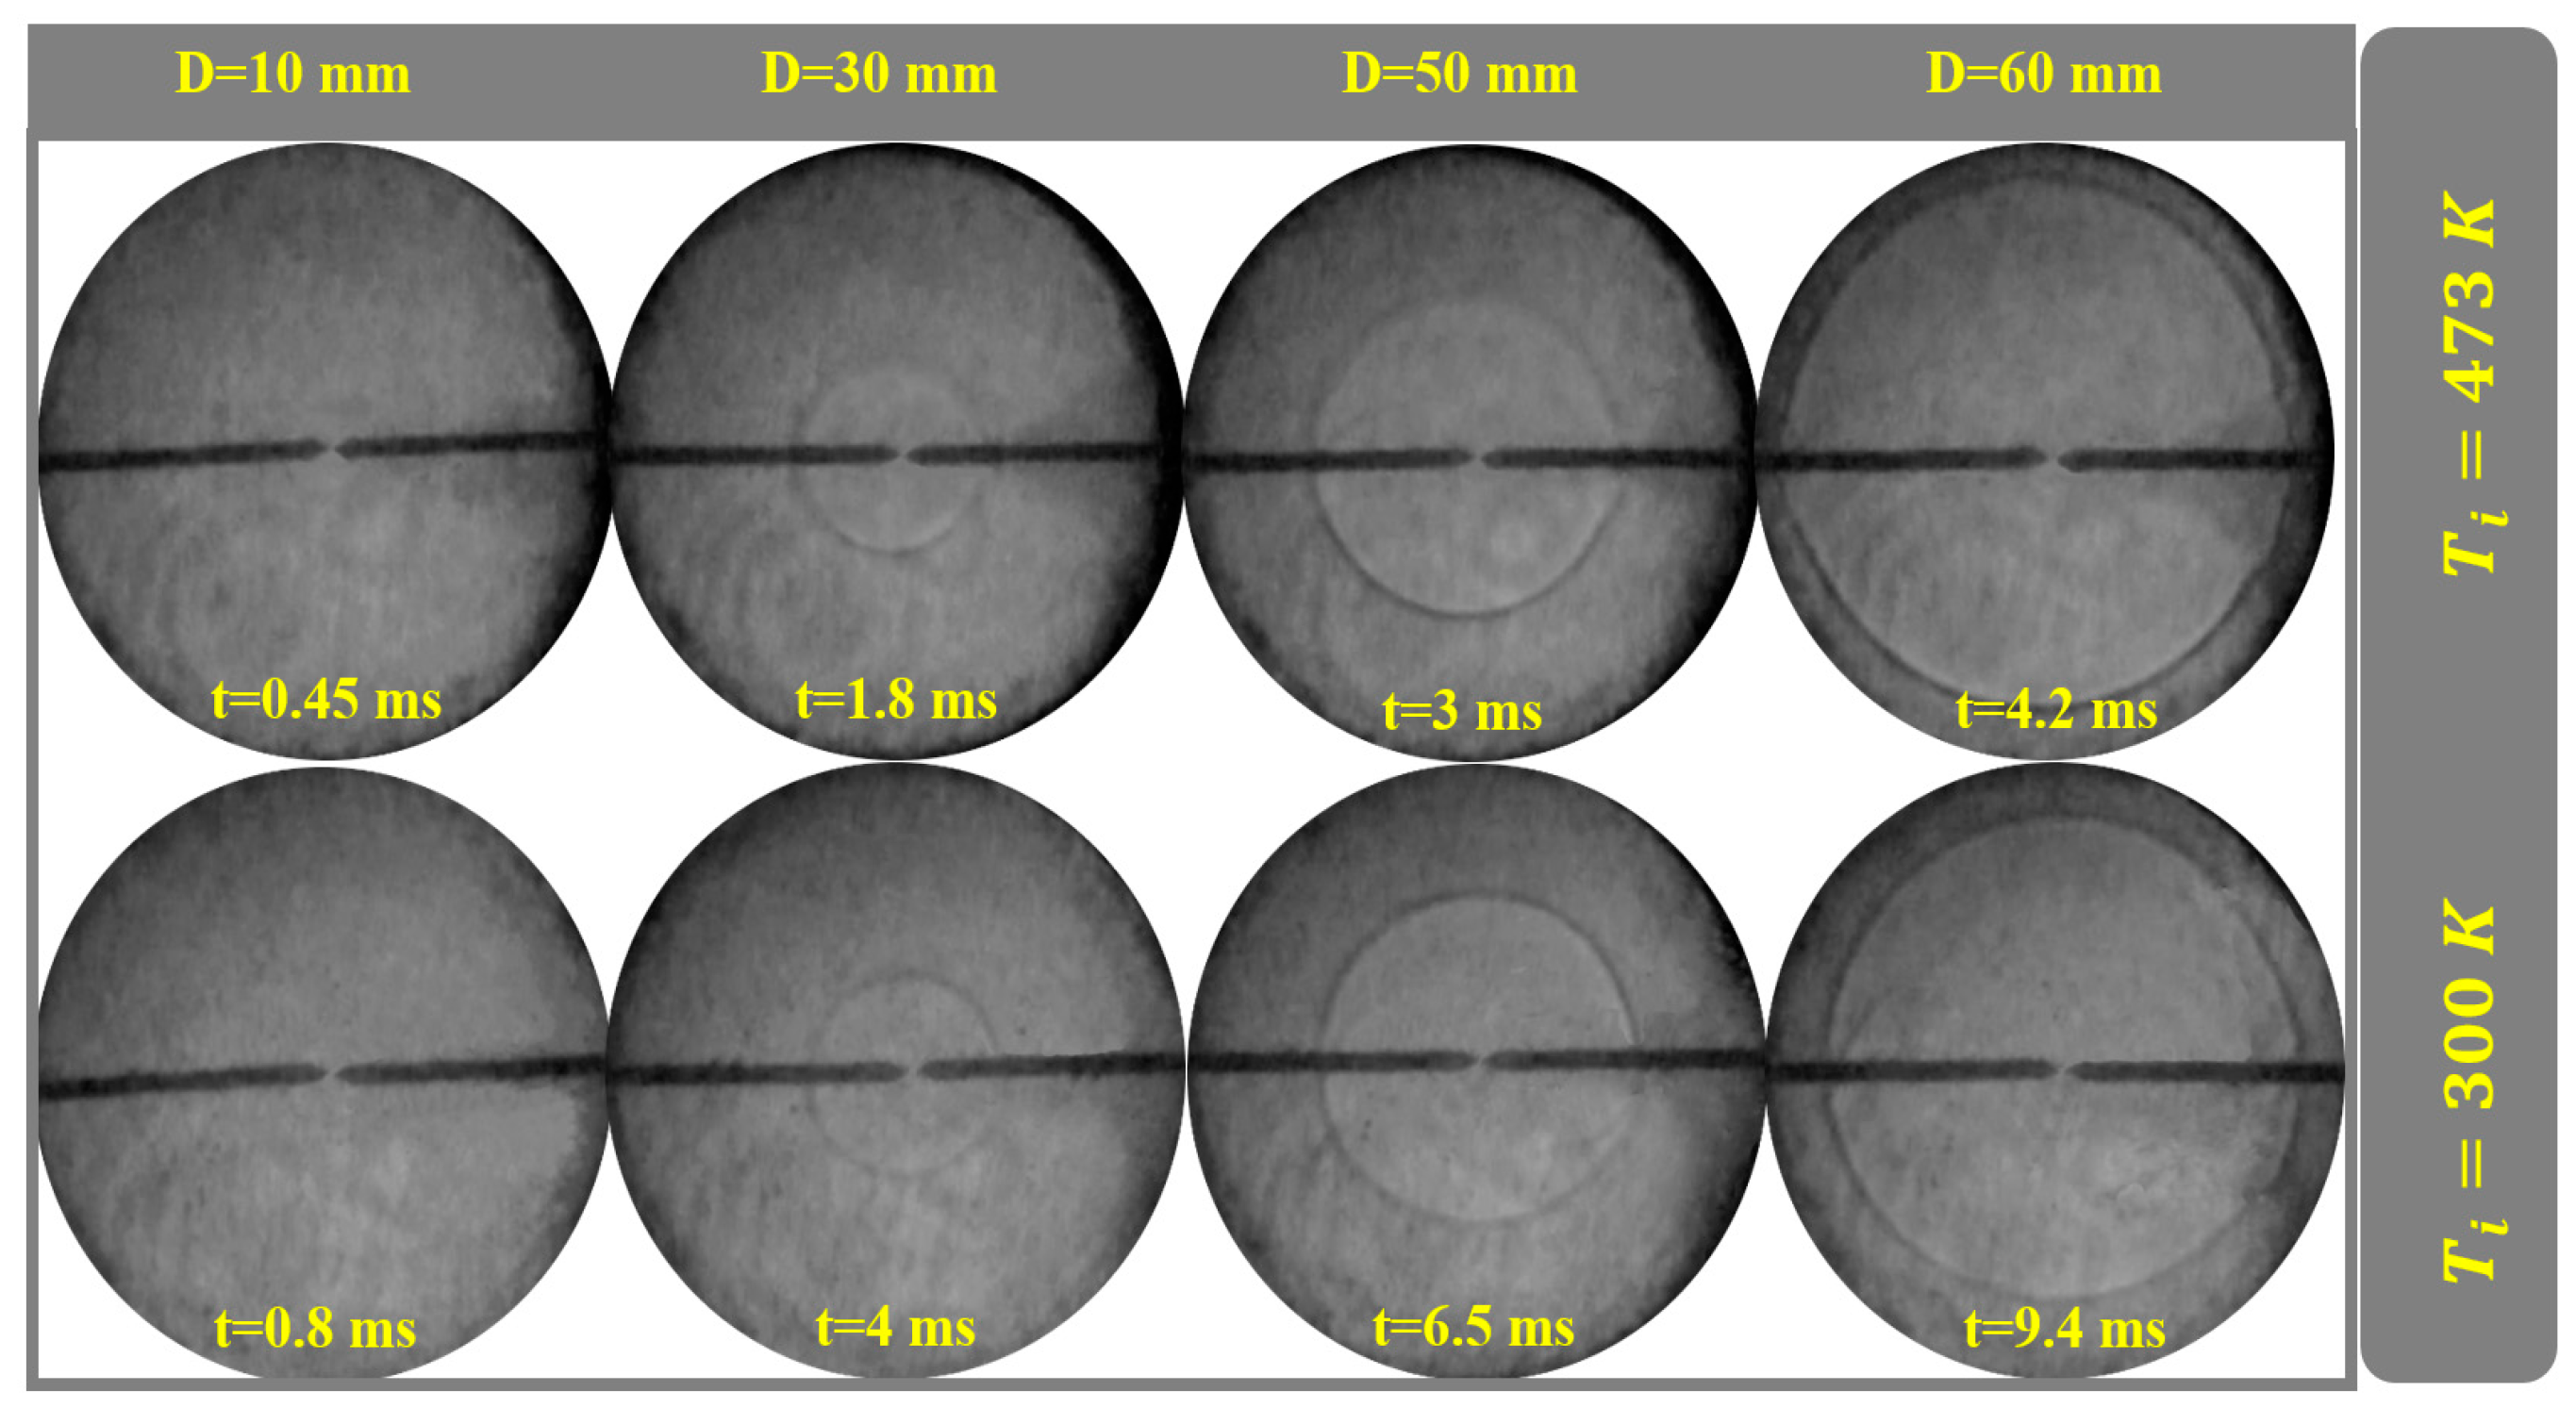
Ammonia/syngas/air premixed mixtures at an initial temperature of 300 K and 473 K were also visualized using Schlieren photography. The corresponding images of spherically propagating flames are shown in Figure 17. By increasing the initial mixture temperature ( T i ), it was observed that the time taken to reach a specific flame radius (representative of the flame propagation speed), decreased with the same flame radius and hydrogen ratio. Additionally, the number of flame front wrinkles decreased as the initial mixture temperature increased.
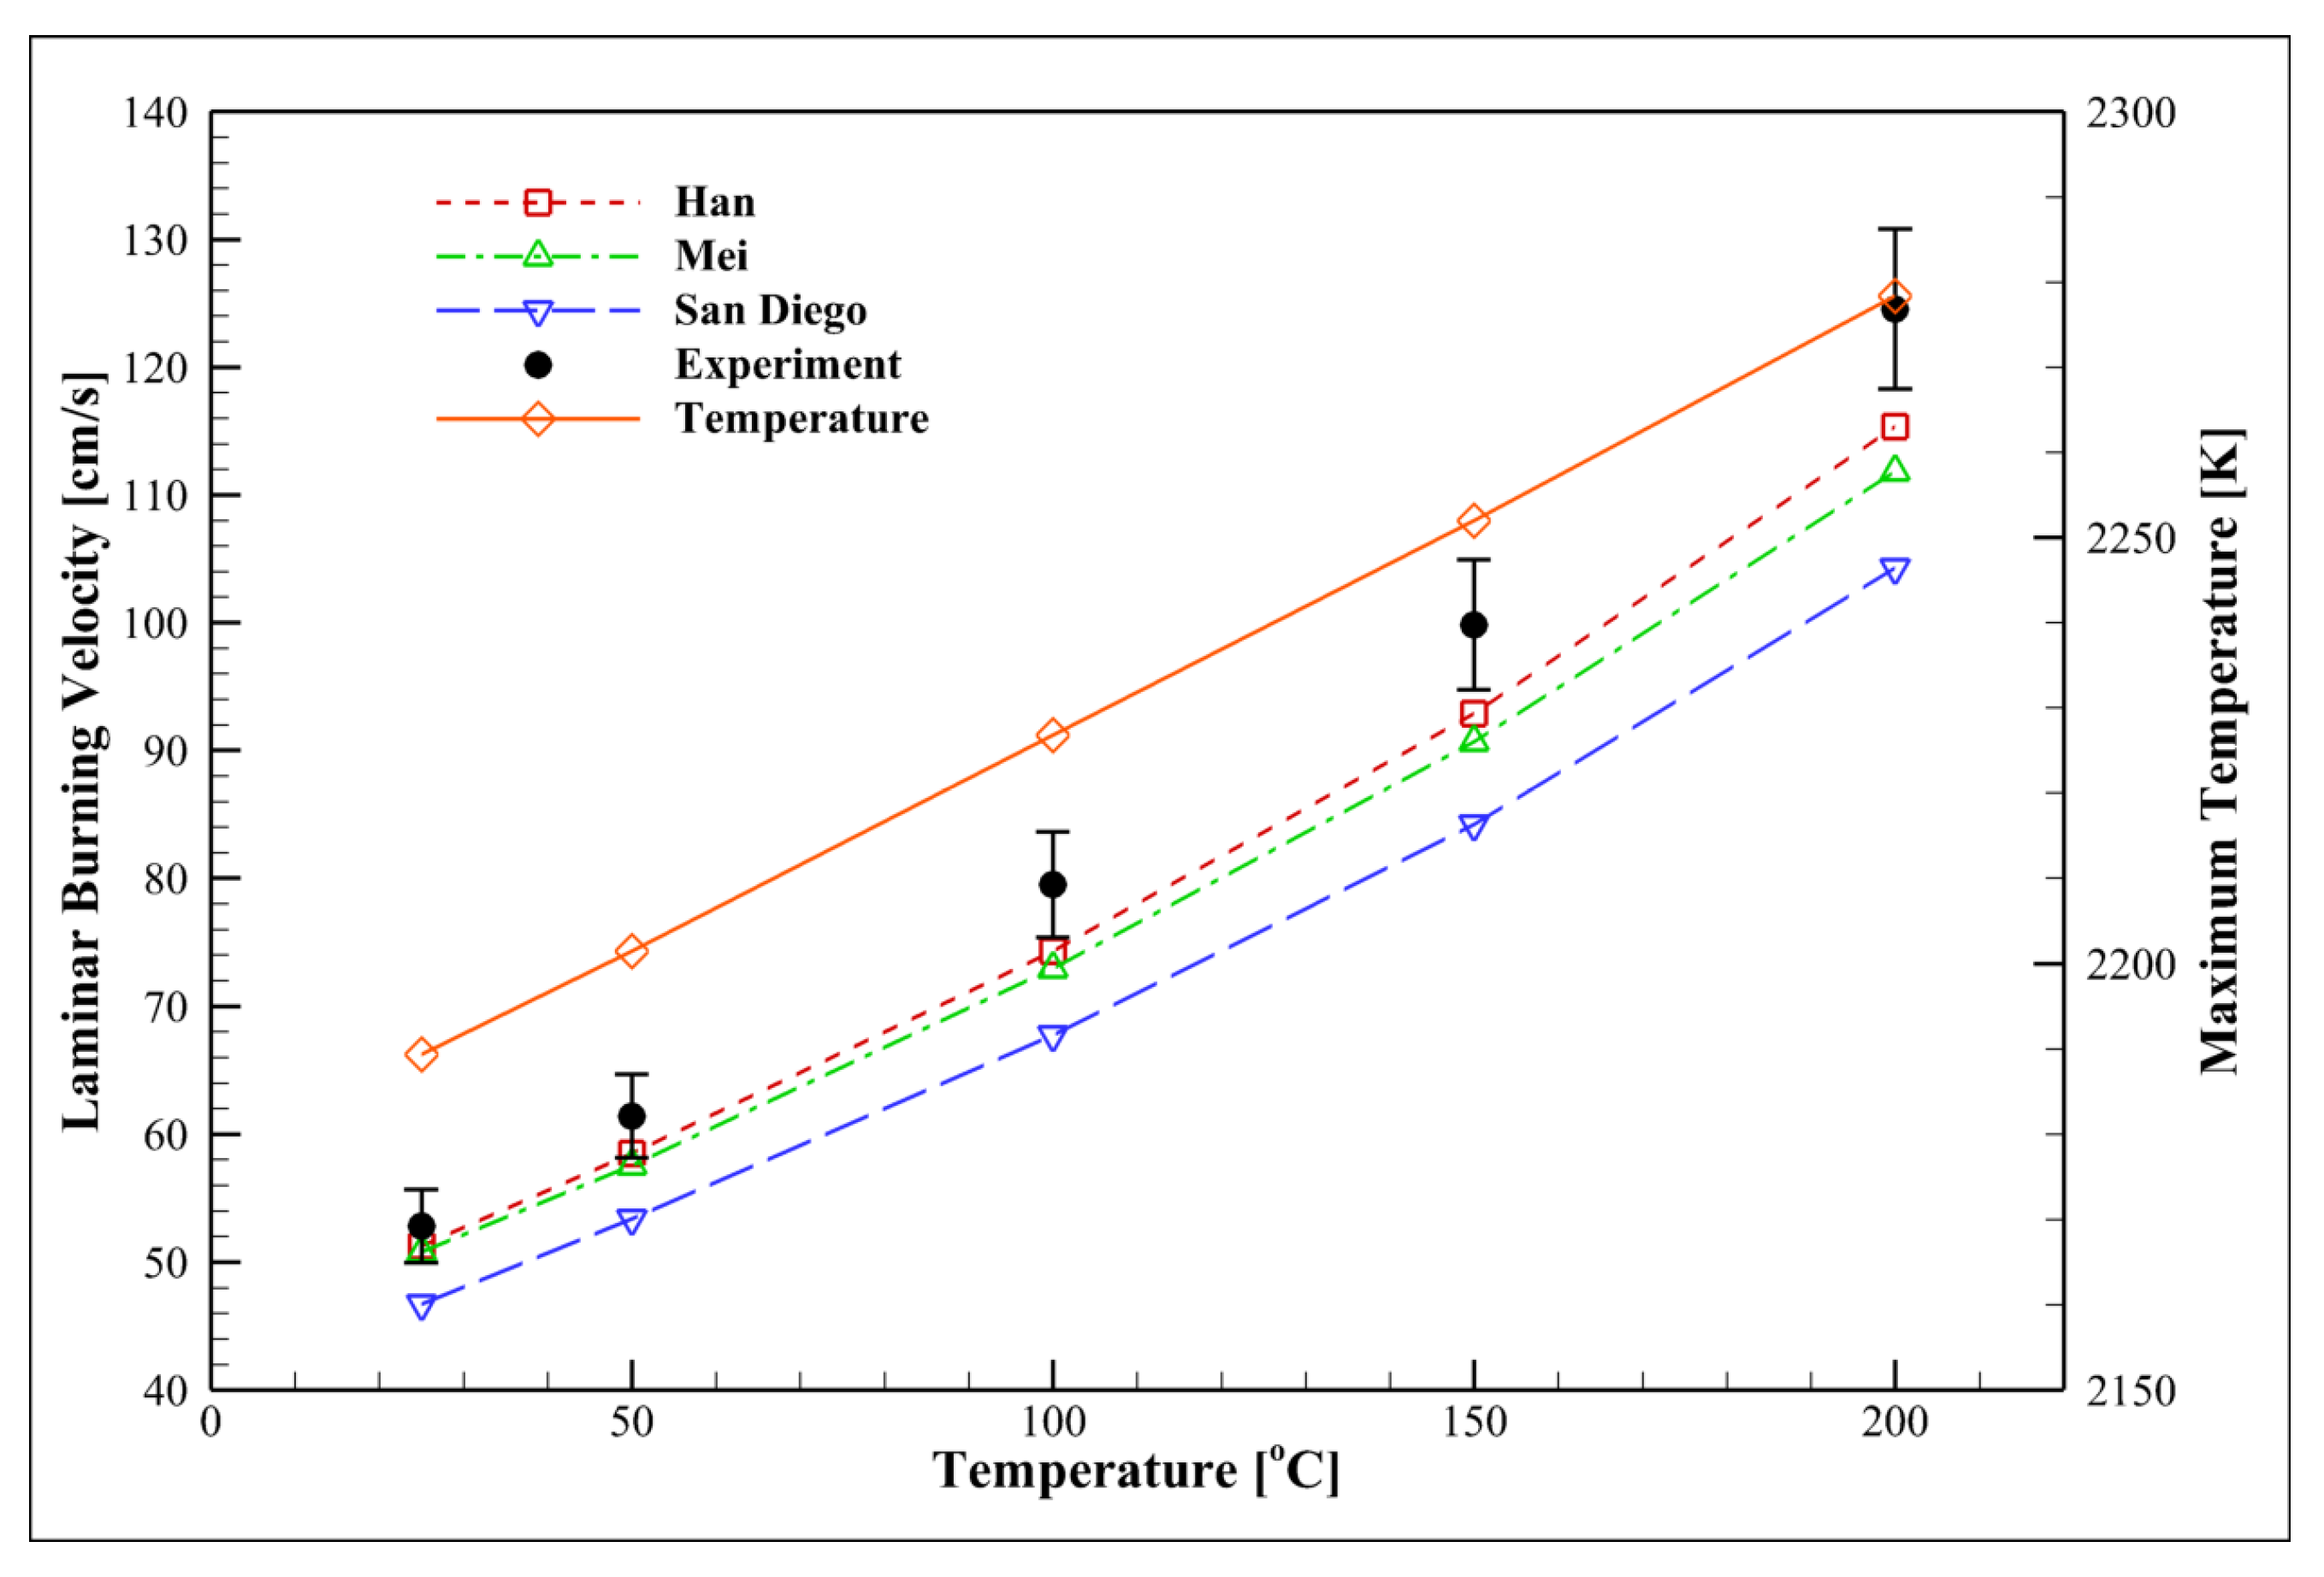
The effect of initial temperature on S u can be seen in Figure 17 for the syngas/NH3/air gas mixture at ϕ = 1 and P u = 1 atm with syngas70, α = 0.4, and the temperature range between 300 and 473 K. The LBV increases with Ti almost linearly, and the temperature dependence relation can be written as follows [53,54]:
S L S L 0 = T i T i 0 α T ,
where S u 0 is the LBV at the reference pressure T u 0 , which is usually the room temperature, and α T is the dependence coefficient and can be expressed as the slope of the curve in [55]. The less-than-one slope indicates that the LBV increase is slower than that at higher temperatures.
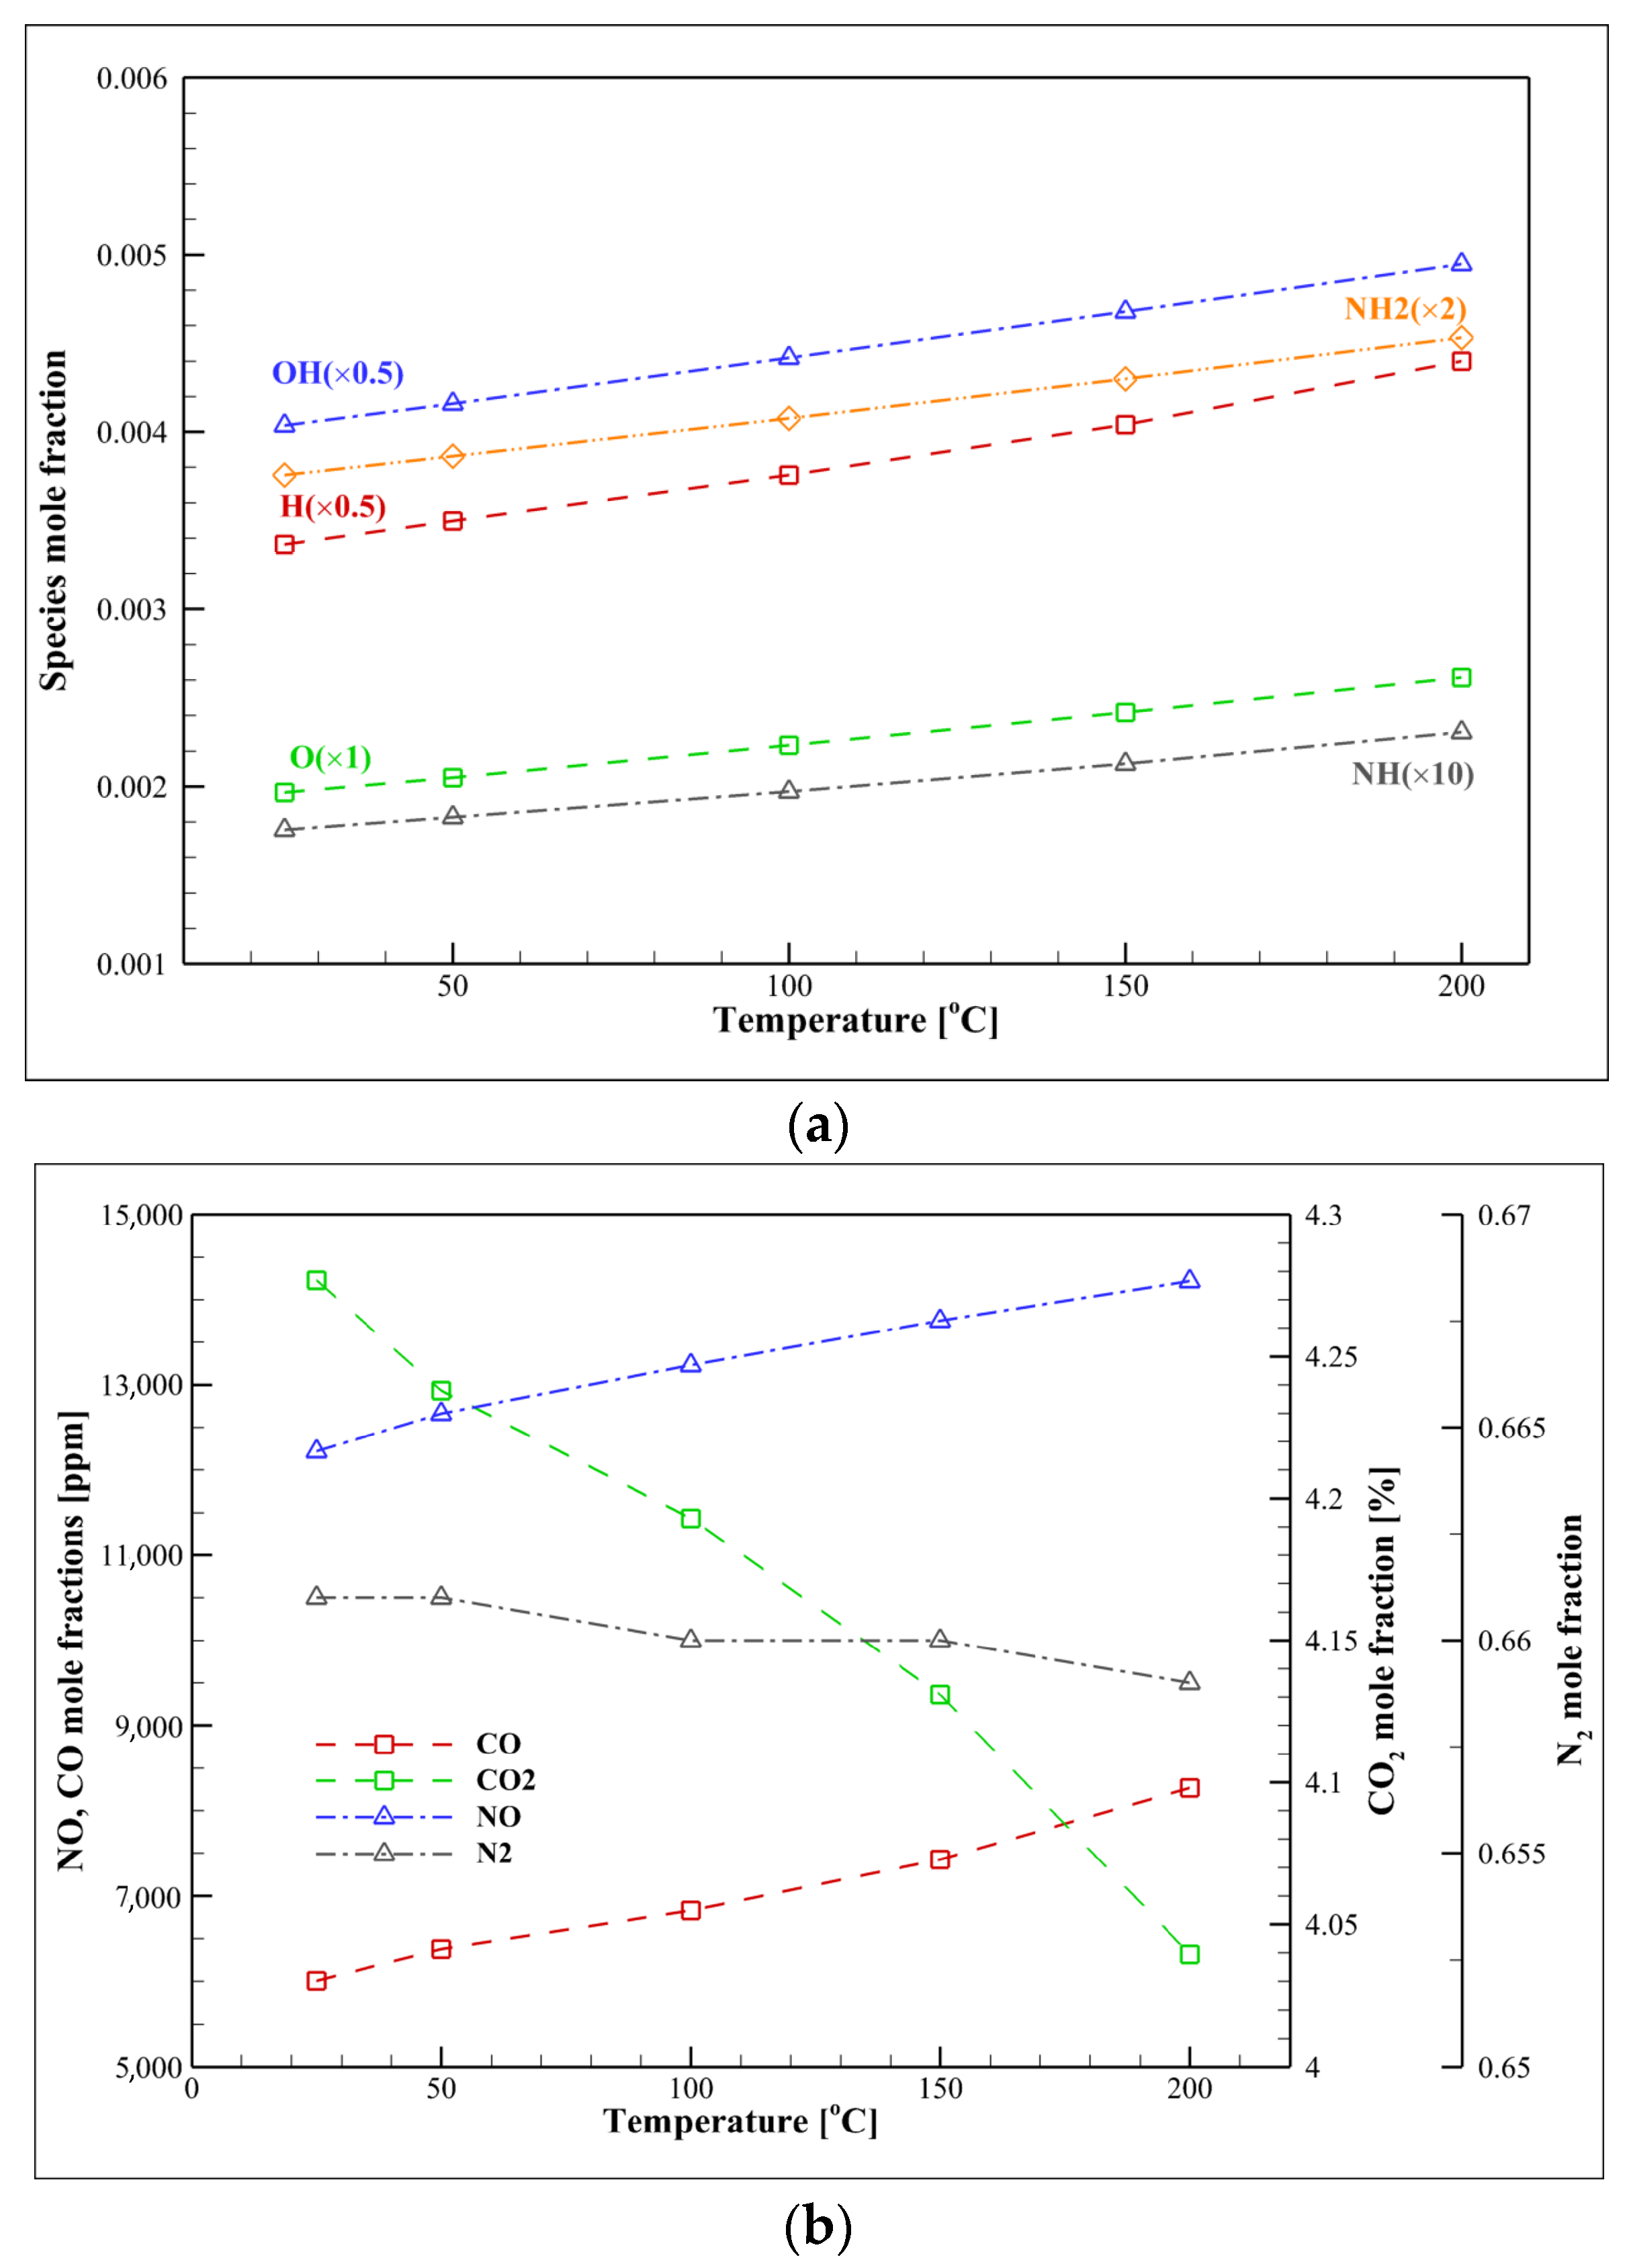
From a kinetic point of view, preheating provides energy and weakens the bonds. It also increases the radical pool (O, H, and OH), as shown in Figure 18a. According to what was said earlier, the presence of O and OH radicals increases chemical reactions.
The amount of CO produced increases with the increment of initial temperature from 300 to 473, while the amount of CO2 decreases.
In addition, increasing the initial temperature provides the required activation energy and helps to generate a higher pool level of radicals. This promotes the direct reaction of ammonia and O2, i.e., without the need for intermediate species such as H2 or CO. Therefore, CO increases as the temperature increases, while CO2 decreases.
Preheating increases the kinetic energy (the higher number of interactions between molecular and sufficient intermolecular energy for reaction), increasing the process’s efficiency.
It can be seen from Figure 18b that with the increment of the initial temperature from 300 to 473, NO formation increases due to two significant factors. Higher temperatures lead to the higher reactivity of NH3 and amines, which play a crucial role in producing NO. The preheating approach increases the kinetic energy (the higher number of molecular collisions and sufficient intermolecular energy for reaction), which increases the efficiency of the process. Therefore, it is expected that preheating will result in a temperature increase, which is shown in Figure 19. It is attributed to increasing thermal NO formation. The LBV range is strongly aligned with the literature on ammonia/hydrogen/air mix combustion [56,57].

5. Conclusions

This study aimed to contribute to the advancement of combustion kinetics of ammonia/syngas/air mixture combustion under elevated-pressure (up to 10 atm) and -temperature (up to 473 K) conditions, determining the combustion characteristics necessary for industrial application. In this study, the flame characteristics were investigated with a focus on the LBV, and the relations and interactions between the flame Markstein length, LBV, and adiabatic flame temperature were thoroughly investigated. The experiments backed by simulations confirmed that LBV decreases with pressure due to reduced radical concentrations and enhanced molecular interactions, but the presence of hydrogen in syngas significantly offsets this effect.
(a)
LBV generally decreases with increasing pressure (falling below 10 cm/s at 10 atm) due to enhanced molecular interactions and reduced radical concentrations.
(b)
Increasing the pressure shifts the equilibrium point and consequently increases the adiabatic flame temperature (e.g., from ~1900 K at 1 atm to over 2100 K at 10 atm).
(c)
According to Le Chatelier’s principle, increasing pressure decreases the mole number of radicals. Thus, pressure variation has an inverse effect on NO formation.
(d)
LBV increases from ~65 cm/s at 300 K to ~125 cm/s at 473 K. However, higher initial temperatures ( T i ) reduce the dependence of the flame on the temperature.
(e)
The chemical effect (especially H2) is more dominant than the thermal effect. Increasing the mole fraction of specific gases in syngas (such as H2 and CO) can reduce the thermal impact and the NH3/syngas/air flame temperature dependence.
The obtained results and analysis could guide future researchers and provide critical insights for ammonia-based combustion systems, particularly in industrial-scale combustion chambers and burners. The study offers valuable insights, while at the same time pointing out that further research is necessary to (a) develop specific chemical kinetic models for ammonia and syngas mixtures and (b) develop further NOx reduction strategies, as well as enhancing the efficiency of combustion systems while considering safety concerns.

Author Contributions

Conceptualization, M.K., A.A.A.A., E.H. and M.A.; methodology, M.K.; software, M.K.; validation, M.K.; formal analysis, M.K.; investigation, M.K. and P.H.N.; writing—original draft preparation, M.K.; writing—review and editing, A.A.A.A., E.H., M.A. and P.H.N.; visualization, M.K. and P.H.N.; supervision, A.A.A.A., E.H. and M.A.; project administration, A.A.A.A., E.H. and M.A.; All authors have read and agreed to the published version of the manuscript.

Funding

This research received no external funding.

Data Availability Statement

The data supporting the findings of this study are available within the article.

Conflicts of Interest

The authors declare no conflict of interest.

Abbreviations

The following abbreviations are used in this manuscript:
LBVLaminar burning velocity
S l Flame speed
Tot Total
T i Initial temperature
P i Initial pressure
S b Stretched flame propagation speed
R f Flame front radius
S u Stretched laminar flame speed
tTime
A Flame front’s surface area
PPressure [bar]
R radius
L b Markstein length
S b 0 Unstretched laminar flame speed
u c Instrument error
u i First-order uncertainty
u n Total uncertainty
P u Pressure of unburned gas
T u Temperature of unburned gas
DMass diffusivity
D T Thermal diffusivity
C p Specific heat capacity
kthermal conductivity
α T Temperature coefficient reflecting the temperature dependence
φEquivalence ratio
α α = [ N H 3 ] [ T o t ]
β β = [ H 2 ] [ S y n g a s ]
λWavelength of the laser beam [m]
ρDensity [kg/m3]
σ Expansion ratio of the gas
ρ u Density of the unburned gas
ρ b Density of the burned gas
κ Spherical flame’s stretch rate
iMixture component comprising syngas fuel and air

Appendix A

Figure A1. Flame propagation images at different equivalence ratio values.
Fuels 06 00059 g0a1
Figure A2. Flame propagation images at different Syngas compositions.
Fuels 06 00059 g0a2
Figure A3. Flame propagation images at different Ammonia Compositions.
Fuels 06 00059 g0a3

References

  1. Al-Dawody, M.F.; Al-Obaidi, W.; Aboud, E.D.; Abdulwahid, M.A.; Al-Farhany, K.; Jamshed, W.; Eid, M.R.; Raizah, Z.; Iqbal, A. Mechanical engineering advantages of a dual fuel diesel engine powered by diesel and aqueous ammonia blends. Fuel 2023, 346, 128398. [Google Scholar] [CrossRef]
  2. Herbinet, O.; Bartocci, P.; Dana, A.G. On the use of ammonia as a fuel–A perspective. Fuel Commun. 2022, 11, 100064. [Google Scholar] [CrossRef]
  3. Alvarez, L.F.; Shaffer, J.; Dumitrescu, C.E.; Askari, O. Laminar burning velocity of Ammonia/Air mixtures at high pressures. Fuel 2024, 363, 130986. [Google Scholar] [CrossRef]
  4. Zhang, Y.; Zhang, W.; Yu, B.; Li, X.; Zhang, L.; Zhao, Y.; Sun, S. Experimental and kinetic modeling study on laminar flame speeds and emission characteristics of oxy-ammonia premixed flames. Int. J. Hydrogen Energy 2024, 63, 857–870. [Google Scholar] [CrossRef]
  5. Eckart, S.; Zsély, I.G.; Krause, H.; Turányi, T. Effect of the variation of oxygen concentration on the laminar burning velocities of hydrogen-enriched methane flames. Int. J. Hydrogen Energy 2024, 49, 533–546. [Google Scholar] [CrossRef]
  6. Hayakawa, A.; Goto, T.; Mimoto, R.; Arakawa, Y.; Kudo, T.; Kobayashi, H. Laminar burning velocity and Markstein length of ammonia/air premixed flames at various pressures. Fuel 2015, 159, 98–106. [Google Scholar] [CrossRef]
  7. Mei, B.; Zhang, X.; Ma, S.; Cui, M.; Guo, H.; Cao, Z.; Li, Y. Experimental and kinetic modeling investigation on the laminar flame propagation of ammonia under oxygen enrichment and elevated pressure conditions. Combust. Flame 2019, 210, 236–246. [Google Scholar] [CrossRef]
  8. Han, X.; Wang, Z.; Costa, M.; Sun, Z.; He, Y.; Cen, K. Experimental and kinetic modeling study of laminar burning velocities of NH3/air, NH3/H2/air, NH3/CO/air and NH3/CH4/air premixed flames. Combust. Flame 2019, 206, 214–226. [Google Scholar] [CrossRef]
  9. Okafor, E.C.; Naito, Y.; Colson, S.; Ichikawa, A.; Kudo, T.; Hayakawa, A.; Kobayashi, H. Experimental and numerical study of the laminar burning velocity of CH4–NH3–air premixed flames. Combust. Flame 2018, 187, 185–198. [Google Scholar] [CrossRef]
  10. Okafor, E.C.; Naito, Y.; Colson, S.; Ichikawa, A.; Kudo, T.; Hayakawa, A.; Kobayashi, H. Measurement and modelling of the laminar burning velocity of methane-ammonia-air flames at high pressures using a reduced reaction mechanism. Combust. Flame 2019, 204, 162–175. [Google Scholar] [CrossRef]
  11. Shu, T.; Xue, Y.; Zhou, Z.; Ren, Z. An experimental study of laminar ammonia/methane/air premixed flames using expanding spherical flames. Fuel 2021, 290, 120003. [Google Scholar] [CrossRef]
  12. da Rocha, R.C.; Costa, M.; Bai, X.-S. Chemical kinetic modelling of ammonia/hydrogen/air ignition, premixed flame propagation and NO emission. Fuel 2019, 246, 24–33. [Google Scholar] [CrossRef]
  13. Kiani, M.; Houshfar, E.; Ashjaee, M. An experimental and numerical study on the combustion and flame characteristics of hydrogen in intersecting slot burners. Int. J. Hydrogen Energy 2018, 43, 3034–3049. [Google Scholar] [CrossRef]
  14. Kiani, M.; Houshfar, E.; Asli, A.E.N.; Ashjaee, M. Combustion of syngas in intersecting burners using the interferometry method. Energy Fuels 2017, 31, 10121–10132. [Google Scholar] [CrossRef]
  15. Lieuwen, T.; Yang, V.; Yetter, R. Yetter, Synthesis Gas Combustion: Fundamentals and Applications; CRC Press: Boca Raton, FL, USA, 2009. [Google Scholar]
  16. Han, X.; Wang, Z.; He, Y.; Zhu, Y.; Cen, K. Experimental and kinetic modeling study of laminar burning velocities of NH3/syngas/air premixed flames. Combust. Flame 2020, 213, 1–13. [Google Scholar] [CrossRef]
  17. Mei, B.; Ma, S.; Zhang, Y.; Zhang, X.; Li, W.; Li, Y. Exploration on laminar flame propagation of ammonia and syngas mixtures up to 10 atm. Combust. Flame 2020, 220, 368–377. [Google Scholar] [CrossRef]
  18. Li, J.; Huang, H.; Kobayashi, N.; He, Z.; Osaka, Y.; Zeng, T. Research on combustion and emission characteristics of ammonia under preheating conditions. J. Chem. Eng. Jpn. 2016, 49, 641–648. [Google Scholar] [CrossRef]
  19. Wang, N.; Li, T.; Guo, X.; Wu, Z.; Huang, S.; Zhou, X.; Li, S.; Chen, R. Laminar burning characteristics of ammonia and hydrogen blends at elevated initial pressures up to 2.5 MPa. Chem. Eng. J. 2024, 500, 157283. [Google Scholar] [CrossRef]
  20. Li, J.; Huang, H.; Deng, L.; He, Z.; Osaka, Y.; Kobayashi, N. Effect of hydrogen addition on combustion and heat release characteristics of ammonia flame. Energy 2019, 175, 604–617. [Google Scholar] [CrossRef]
  21. Kumar, L.; Sleiti, A.K. Systematic review on ammonia as a sustainable fuel for combustion. Renew. Sustain. Energy Rev. 2024, 202, 114699. [Google Scholar] [CrossRef]
  22. Hinton, N.; Stone, R. Laminar burning velocity measurements of methane and carbon dioxide mixtures (biogas) over wide ranging temperatures and pressures. Fuel 2014, 116, 743–750. [Google Scholar] [CrossRef]
  23. Askari, M.H.; Ashjaee, M. Experimental measurement of laminar burning velocity and flammability limits of landfill gas at atmospheric and elevated pressures. Energy Fuels 2017, 31, 3196–3205. [Google Scholar] [CrossRef]
  24. Hauf, W.; Grigull, U. Optical Methods in Heat Transfer. Adv. Heat Transf. 1970, 6, 133–136. [Google Scholar] [CrossRef]
  25. Flack, R.D. Mach-Zehnder interferometer errors resulting from test section misalignment. Appl. Opt. 1978, 17, 985–987. [Google Scholar] [CrossRef]
  26. Bardolf, R.; Winter, F. Comparison of chemical kinetic mechanisms for combustion simulation of treated biogas. Holist. Approach Environ. 2014, 4, 65–69. [Google Scholar]
  27. Dowdy, D.R.; Smith, D.B.; Taylor, S.C.; Williams, A. The use of expanding spherical flames to determine burning velocities and stretch effects in hydrogen/air mixtures. Symp. (Int.) Combust. 1991, 23, 325–332. [Google Scholar] [CrossRef]
  28. Sivashinsky, G.I. On a distorted flame front as a hydrodynamic discontinuity. Acta Astronaut. 1976, 3, 889–918. [Google Scholar] [CrossRef]
  29. Matalon, M.; Matkowsky, B.J. Flames as gasdynamic discontinuities. J. Fluid. Mech. 1982, 124, 239–259. [Google Scholar] [CrossRef]
  30. Clavin, P. Dynamic behavior of premixed flame fronts in laminar and turbulent flows. Proc. Combust. Inst. 1985, 11, 1–59. [Google Scholar] [CrossRef]
  31. Kelley, A.P.; Law, C.K. Nonlinear effects in the extraction of laminar flame speeds from expanding spherical flames. Combust. Flame 2009, 156, 1844–1851. [Google Scholar] [CrossRef]
  32. Annamalai, K.; Ryan, W. Interactive processes in gasification and combustion. Part I: Liquid drop arrays and clouds. Proc. Combust. Inst. 1992, 18, 221–295. [Google Scholar] [CrossRef]
  33. Zhou, S.; Yang, W.; Tan, H.; An, Q.; Wang, J.; Dai, H.; Wang, X.; Wang, X.; Deng, S. Experimental and kinetic modeling study on NH3/syngas/air and NH3/bio-syngas/air premixed laminar flames at elevated temperature. Combust. Flame 2021, 233, 111594. [Google Scholar] [CrossRef]
  34. Kiani, M.; Kohansal, M.; Masoumi, S.; Ashjaee, M.; Houshfar, E. An experimental investigation on non-preheated MILD combustion of syngas/ammonia/air. J. Therm. Anal. Calorim. 2023, 148, 11783–11797. [Google Scholar] [CrossRef]
  35. Kiani, M.; Kohansal, M.; Masoumi, S.; Afzalnia, A.; Inanlu, M.J.; Ashjaee, M.; Houshfar, E. An experimental investigation of ammonia/landfill/air mixtures’ pollutant emissions and temperature distribution under non-preheated moderate or intense low-oxygen dilution combustion. Environ. Sci. Pollut. Res. 2023, 30, 38333–38348. [Google Scholar] [CrossRef]
  36. Kobayashi, H.; Tamura, T.; Maruta, K.; Niioka, T.; Williams, F.A. Burning velocity of turbulent premixed flames in a high-pressure environment. Symp. (Int.) Combust. 1996, 26, 389–396. [Google Scholar] [CrossRef]
  37. Qiao, L.; Dahm, W.; Faeth, G.; Oran, E. Burning velocities and flammability limits of premixed methane/air/diluent flames in microgravity. In Proceedings of the 46th AIAA Aerospace Sciences Meeting and Exhibit, Reno, NV, USA, 7–10 January 2008; p. 959. [Google Scholar]
  38. Vu, T.M.; Song, W.S.; Park, J.; Bae, D.S.; You, H.S. Measurements of propagation speeds and flame instabilities in biomass derived gas–air premixed flames. Int. J. Hydrogen Energy 2011, 36, 12058–12067. [Google Scholar] [CrossRef]
  39. Hayakawa, A.; Goto, T.; Mimoto, R.; Kudo, T.; Kobayashi, H. NO formation/reduction mechanisms of ammonia/air premixed flames at various equivalence ratios and pressures. Mech. Eng. J. 2015, 2, 14-00402. [Google Scholar] [CrossRef]
  40. Pearse, R.W.B.; Gaydon, A.G. The Identification of Molecular Spectra; Chapman and Hall: London, UK, 1976. [Google Scholar]
  41. Mendiara, T.; Glarborg, P. Ammonia chemistry in oxy-fuel combustion of methane. Combust. Flame 2009, 156, 1937–1949. [Google Scholar] [CrossRef]
  42. Mikulčić, H.; Baleta, J.; Wang, X.; Wang, J.; Qi, F.; Wang, F. Numerical simulation of ammonia/methane/air combustion using reduced chemical kinetics models. Int. J. Hydrogen Energy 2021, 46, 23548–23563. [Google Scholar] [CrossRef]
  43. Xiao, H.; Valera-Medina, A.; Marsh, R.; Bowen, P.J. Numerical study assessing various ammonia/methane reaction models for use under gas turbine conditions. Fuel 2017, 196, 344–351. [Google Scholar] [CrossRef]
  44. Sabia, P.; Sorrentino, G.; Chinnici, A.; Cavaliere, A.; Ragucci, R. Dynamic behaviors in methane MILD and oxy-fuel combustion. Chemical effect of CO2. Energy Fuels 2015, 29, 1978–1986. [Google Scholar] [CrossRef]
  45. Yossefi, D.; Ashcroft, S.; Hacohen, J.; Belmont, M.; Thorpe, I. Combustion of methane and ethane with CO2 replacing N2 as a diluent. Modelling of combined effects of detailed chemical kinetics and thermal properties on the early stages of combustion. Fuel 1995, 74, 1061–1071. [Google Scholar] [CrossRef]
  46. Iliuta, I.; Tahoces, R.; Patience, G.S.; Rifflart, S.; Luck, F. Chemical-looping combustion process: Kinetics and mathematical modeling. AICHE J. 2010, 56, 1063–1079. [Google Scholar] [CrossRef]
  47. Cussler, E.L. Diffusion: Mass Transfer in Fluid Systems; Cambridge University Press: Cambridge, UK, 2009. [Google Scholar]
  48. Goswami, M.; Derks, S.C.R.; Coumans, K.; Slikker, W.J.; de Andrade Oliveira, M.H.; Bastiaans, R.J.M.; Luijten, C.C.M.; de Goey, L.P.H.; Konnov, A.A. The effect of elevated pressures on the laminar burning velocity of methane+ air mixtures. Combust. Flame 2013, 160, 1627–1635. [Google Scholar] [CrossRef]
  49. Varea, E.; Modica, V.; Renou, B.; Boukhalfa, A.M. Pressure effects on laminar burning velocities and Markstein lengths for isooctane–ethanol–air mixtures. Proc. Combust. Inst. 2013, 34, 735–744. [Google Scholar] [CrossRef]
  50. Loo, C.E.; Tame, N.; Penny, G.C. Effect of Iron Ores and Sintering Conditions on Flame Front Properties. ISIJ Int. 2012, 52, 967–976. [Google Scholar] [CrossRef]
  51. Bellamy, D.J.; Clarke, P.H. Application of the Second Law of Thermodynamics and Le Chatelier’s Principle to the Developing Ecosystem. Nature 1968, 218, 1180. [Google Scholar] [CrossRef]
  52. Ronney, P.D.; Wachman, H.Y. Effect of gravity on laminar premixed gas combustion I: Flammability limits and burning velocities. Combust. Flame 1985, 62, 107–119. [Google Scholar] [CrossRef]
  53. Lhuillier, C.; Brequigny, P.; Lamoureux, N.; Contino, F.; Mounaïm-Rousselle, C. Experimental investigation on laminar burning velocities of ammonia/hydrogen/air mixtures at elevated temperatures. Fuel 2020, 263, 116653. [Google Scholar] [CrossRef]
  54. Skreiberg, Ø.; Kilpinen, P.; Glarborg, P. Ammonia chemistry below 1400 K under fuel-rich conditions in a flow reactor. Combust. Flame 2004, 136, 501–518. [Google Scholar] [CrossRef]
  55. Han, X.; Wang, Z.; He, Y.; Liu, Y.; Zhu, Y.; Konnov, A.A. The temperature dependence of the laminar burning velocity and superadiabatic flame temperature phenomenon for NH3/air flames. Combust. Flame 2020, 217, 314–320. [Google Scholar] [CrossRef]
  56. Tamadonfar, P.; Karimkashi, S.; Zirwes, T.; Vuorinen, V.; Kaario, O. A numerical study on premixed laminar ammonia/air flames enriched with hydrogen: An analysis on flame–wall interaction. Combust. Flame 2024, 265, 113444. [Google Scholar] [CrossRef]
  57. Liu, B.; Zhang, Z.; Yang, S.; Yu, F.; Belal, B.Y.; Li, G. Experimental and chemical kinetic study for the combustion of ammonia-hydrogen mixtures. Fuel 2024, 371, 131850. [Google Scholar] [CrossRef]
Figure 1. Summary of studies on ammonia for combustion [21].
Fuels 06 00059 g001
Figure 3. Schematic diagram of the experimental setup.
Fuels 06 00059 g003
Figure 4. Flame front visualization and the fitted circle.
Fuels 06 00059 g004
Figure 5. Comparison between results obtained and other mechanisms.
Fuels 06 00059 g005
Figure 6. Direct images of ammonia/syngas/air premixed flames for different contents of ammonia at P i = 0.1 MPa, β = 0.7, φ = 1, and T = 300 K.
Fuels 06 00059 g006
Figure 7. Reaction path diagram at φ = 1 [8].
Fuels 06 00059 g007
Figure 8. Flame propagation images at different pressures.
Fuels 06 00059 g008
Figure 9. (a) Simulated mole fractions of major radicals and (b) predicted emission profile for different pressures at α = 0.4, β = 0.7, φ = 1, and T = 300 K.
Fuels 06 00059 g009
Figure 10. Measured and simulated flame speed and maximum flame temperature for different pressures at α = 0.4, β = 0.7, φ = 1, and T = 300 K.
Fuels 06 00059 g010
Figure 11. (a) Simulated mole fractions of major radicals and (b) predicted emission profiles for different equivalence ratios at α = 0.4, β = 0.7, P = 1 bar, and T = 300 K.
Fuels 06 00059 g011
Figure 12. Measured and simulated flame speed and maximum flame temperature for different equivalence ratios at α = 0.4, β = 0.7, P = 1 bar, and T = 300 K.
Fuels 06 00059 g012
Figure 13. (a) Simulated mole fractions of major radicals and (b) predicted emission profiles for different CO contents at β = 0.7, P = 1 bar, φ = 1, and T = 300 K.
Fuels 06 00059 g013
Figure 14. Measured and simulated flame speed and maximum flame temperature for different CO content at β = 0.7, P = 1 bar, φ = 1, and T = 300 K.
Fuels 06 00059 g014
Figure 15. (a) Simulated mole fractions of major radicals and (b) predicted emission profiles for different ammonia contents at P = 1 bar, φ = 1, and T = 300 K.
Fuels 06 00059 g015
Figure 16. Measured and simulated flame speed and maximum flame temperature for different ammonia contents at P = 1 bar, φ = 1, and T = 300 K.
Fuels 06 00059 g016
Figure 17. Flame propagation images at different initial temperatures.
Fuels 06 00059 g017
Figure 18. (a) Simulated mole fractions of major radicals and (b) predicted emission profiles for different temperatures with α = 0.4, β = 0.7, P = 1 bar, and φ = 1.
Fuels 06 00059 g018
Figure 19. Measured and simulated flame speed and maximum flame temperature for different temperatures at α = 0.4, β = 0.7, P = 1 bar, and φ = 1.
Fuels 06 00059 g019
Table 1. Comparison of kinetic mechanisms used in simulations.
MechanismKey FeaturesApplicabilityLimitations
Mei [17]Optimized for NH3/syngas at high pressures (up to 10 bar)High-pressure NH3/syngas/air flamesLimited validation at
T > 473 K
San Diego [26]Includes detailed nitrogen chemistryBroad range of fuels, including NH3Higher computational cost; less accurate for NH3/syngas LBV
Han [8]Tailored for NH3/H2/CO/air mixturesAccurate for NH3/syngas at 1–5 barFewer species, potentially missing minor pathways
Table 2. Summary of experimental test conditions.
CASE Syngas Composition [atm] [K]
1 (base case)1.0SYN700.41300
20.7:0.1:1.6SYN700.41300
31.0SYN100, SYN80, SYN70, SYN500.41300
41.0SYN700.0:0.2:1.01300
51.0SYN700.41, 3, 5, 7, 10300
61.0SYN700.41300, 323, 373, 423, 473
Table 3. Markstein length for different cases.
φ α β T i [K]p [bar]Markstein Length
0.70.40.73001−1.513
10.40.73001−0.319
1.60.40.730011.902
10.40.730010−0.423
10.40.74731−0.119
100.730011.573
110.730010.028
10.40.53001−0.2
10.413001−0.25
Disclaimer/Publisher’s Note: The statements, opinions and data contained in all publications are solely those of the individual author(s) and contributor(s) and not of MDPI and/or the editor(s). MDPI and/or the editor(s) disclaim responsibility for any injury to people or property resulting from any ideas, methods, instructions or products referred to in the content.