1. Introduction
The recent spark in interest in biochar has paved the way for numerous studies and practical applications that have established biochar as a valuable material. Biochar has been known for centuries and dates back more than 2500 years to the pre-Columbian era. The Brazilians in the Amazonian basin had long applied biochar to the soil to improve fertility, and it was known as Terra Preta (black earth) [
1]. Interest in biochar has been ignited by several factors, including the reduction of carbon footprints, the drive for alternative sources of energy to fossil fuels, the push for an environmentally friendly alternative to fertilizer, and the focus on sustainability and renewable sources of feedstock that offer substantial cost benefits [
2,
3].
Biochar has been defined loosely based on the source and method of production. The International Biochar Initiative (IBI) has defined biochar as a solid material obtained from the thermochemical conversion of biomass in oxygen-controlled conditions [
1]. The carbonaceous materials can include agricultural crop residues, animal waste, sewage sludge, and municipal wastes. Biochar has been produced simultaneously with energy-rich syngas and bio-oil during pyrolysis and gasification [
4,
5].
Many studies and practical approaches have identified biochar as a valuable material in various areas beyond soil amendment. However, the benefits of biochar can vary based on the feedstock, parameters, and variables, such as rate and residence time, heating temperatures, and the method of production; these factors can significantly affect the physical and chemical properties of biochar. Similarly, thermochemical processes such as gasification, fast and slow pyrolysis, microwave heating, torrefaction, hydrothermal, and kiln production techniques will significantly vary the properties of biochar [
1,
5,
6,
7,
8].
Gasification has been defined as a thermochemical process in which a high temperature above 650 °C is employed in the conversion of carbonaceous material into a combustible gas mixture under a limited amount of air or reducing conditions [
9,
10]. Gasification converts carbonaceous material such as biomass into syngas, tar, and biochar at high temperatures. The use of downdraft gasifiers provides the advantage of temperature control at 850 °C, which falls within the optimal range for high-quality biochar production, reduces tar formation, and ensures efficient graphitization and carbonization. The downward flow of the gases in the downdraft gasifier ensures heat transfer is optimized and efficiently transferred to the biomass hence achieving uniform carbonization of the produced biochar [
11,
12].
Gasification has been known since the 1650s, though early commercial gasification emerged briefly around the 1800s in Great Britain. By the 1920s, gasification was largely employed in the United States. The advent of petroleum products with high energy densities reduced the relevance of gasification. In recent times, gasification has garnered interest because of its environmentally benign process and its perceived sustainability. Gasifiers have been classified in several ways; however, one of the most useful classifications is based on the transport process of the feedstock and air. Based on that, entrained-flow reactors, bubble-fluidized-bed reactors, circulating fluidized-bed reactors, and fixed-bed reactors. The downdraft gasifier falls into the category of fixed-bed reactors; they are characterized by a stationary bed and air or oxygen flow into the bed via a specific direction [
9].
Oak biochar stands out as a material of great potential, attributed to the unique lignocellulosic structure of oak, which imparts high carbon content and excellent structural stability [
13,
14]. However, most research to date has concentrated on biochar derived from general feedstocks such as switchgrass, forest residues, wood chips, rice husks, corn stover, wheat straw, sugarcane bagasse, and a host of others, leaving a significant gap in the understanding of oak-specific biochar properties [
15]. Although biochar research often highlights its use in soil enhancement and carbon sequestration, comprehensive studies analyzing its physicochemical characteristics through advanced techniques remain limited. Bridging these gaps is crucial to refining biochar production and applications and supporting sustainable development initiatives.
Due to the lack of detailed studies of the characterization of biochar from oak produced from downdraft gasifiers and to address the gap in detailed studies on the quantification and characterization of oak biochar, the current study aims to comprehensively characterize oak biochar using different techniques.
A key unique aspect of this research will address the knowledge gap by thoroughly analyzing oak biochar generated using a downdraft gasifier at 850 °C. A range of advanced analytical methods, such as scanning electron microscopy (SEM), thermogravimetric analysis (TGA), X-ray photoelectron spectroscopy (XPS), Raman spectroscopy, X-ray diffraction (XRD), mean zeta potential, electrophoretic mobility, electrical conductivity, pH, and Brunauer–Emmett–Teller (BET) surface area analysis, is utilized to explore its properties. This in-depth investigation sheds light on the biochar’s morphological, structural, thermal, and chemical characteristics, providing valuable insights for customized applications. This study addresses the aforementioned knowledge gap by systematically evaluating the physicochemical properties of biochar obtained through downdraft gasification, providing new insights into its suitability for electrochemical applications, pollutant adsorption, and soil enhancement.
This study further adds valuable insights to the ongoing conversation on sustainable biochar production, highlighting the benefits of downdraft gasification. Compared to alternative techniques, this method generates biochar with minimal tar content and well-regulated characteristics, enhancing its consistency and practical utility [
16,
17]. By centering on oak-based biochar, the research deepens the understanding of how specific feedstocks influence biochar properties while supporting worldwide initiatives to make better use of lignocellulosic biomass.
Finally, this research not only advances the understanding of gasification-derived biochar, it also fills important gaps in biochar research by providing an in-depth analysis of oak biochar produced under defined conditions. It contributes knowledge essential for enhancing biochar properties for various uses, highlighting its role as a sustainable material with considerable environmental and industrial advantages. By advancing our understanding of biochar characterization, the research sets the stage for new applications and approaches to address environmental issues while supporting the use of renewable resources.
2. Materials and Methods of Characterization
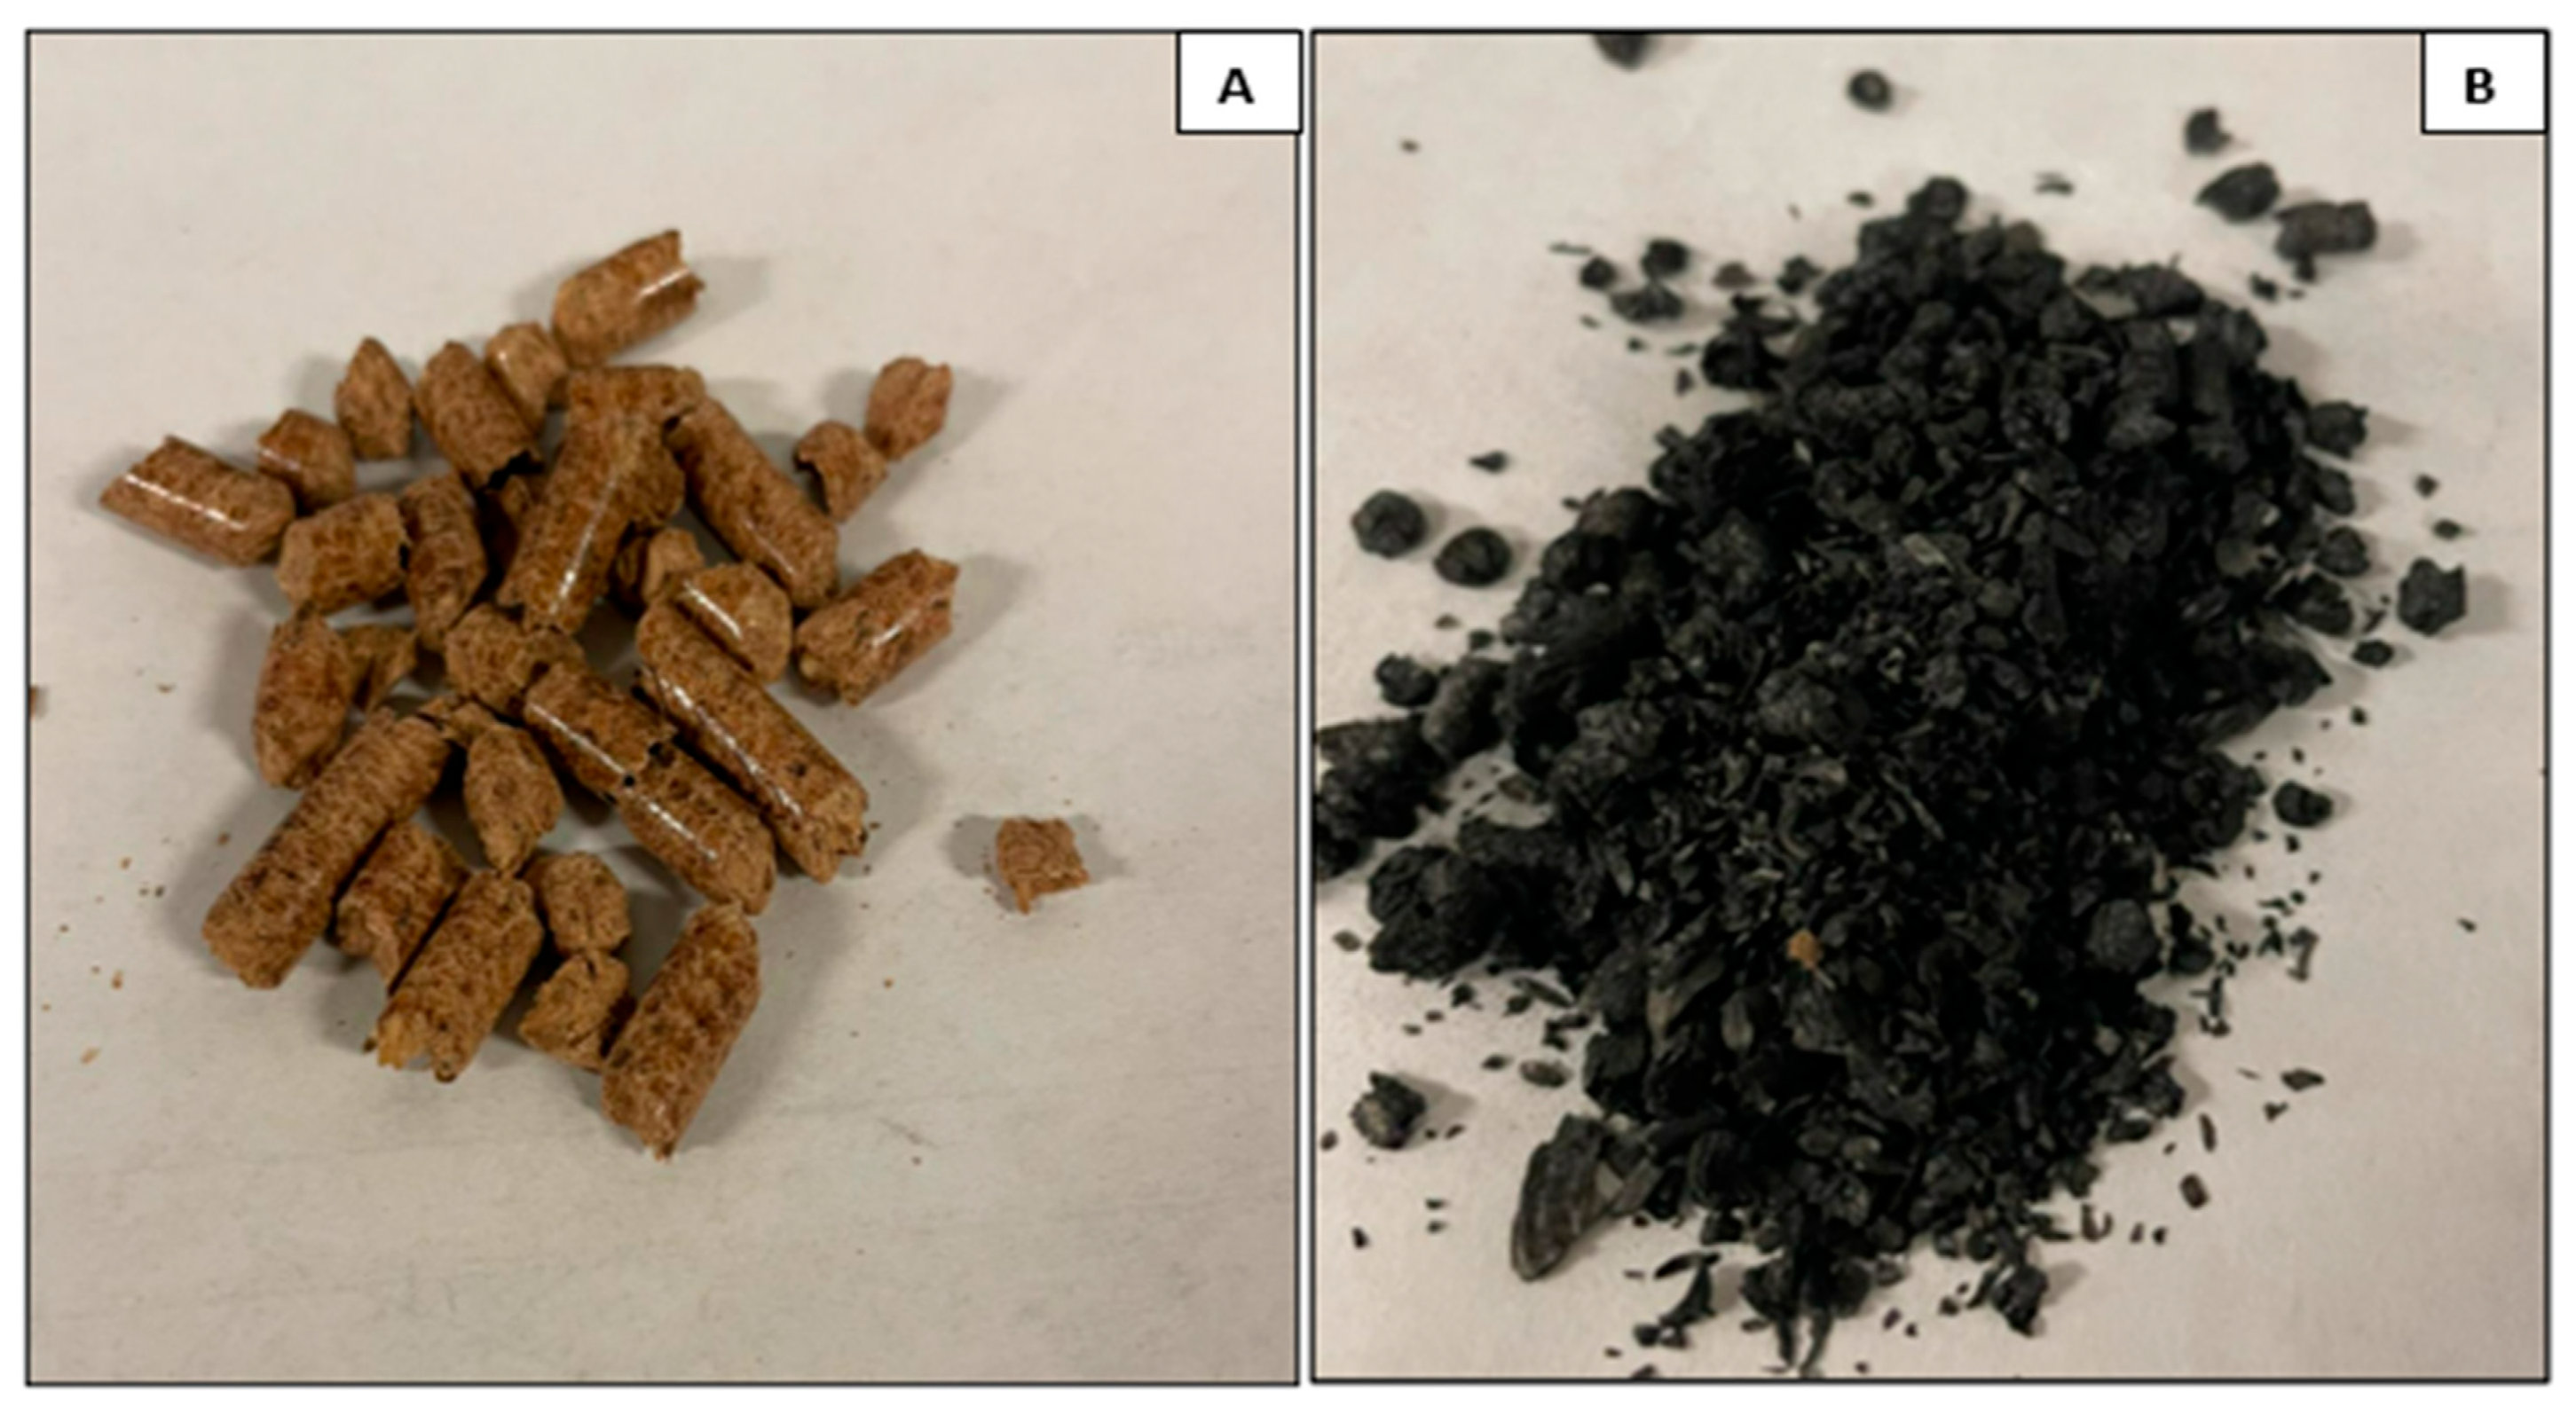
The biochar sample, “oak biochar”, was prepared in a downdraft gasifier using oak pellets as the feedstock sourced from Lowe’s home improvement store in Rolla, Missouri, USA. Oak pellets, often utilized as biomass fuel, are produced by compressing sawdust and wood shavings derived from oak trees. Pelletized oak feedstock and biochar are shown in
Figure 1. Moreover, different characterization techniques such as CHN analysis, electrical conductivity, electrophoretic mobility, and BET were conducted, taking into consideration that each test was repeated three times to ensure reproducibility.
2.1. Biochar Production via Gasification
Biochar was produced using a downdraft gasifier operating at a temperature of 850 °C. The feedstock was introduced at the top of the gasifier and moved downward through the four zones of the gasifier—drying, pyrolysis, combustion/oxidation, and reduction. Air, serving as the gasifying agent, was supplied at a superficial velocity of around 1.625–3.454 m/s; the superficial velocity is essential as it controls the rate of air going into the gasifier, which has a significant impact on the heat transfer and reaction rate of the combustion zone which peaks at a temperature of 850 °C. The superficial velocity helps to enhance pyrolysis, lower tar content, and produce high-quality syngas [
16].
Figure 2 shows a picture of a downdraft gasifier.
The use of a downdraft gasifier (see
Figure 2) offers several advantages in making biochar. The design of a downdraft gasifier makes it possible for the effective conversion of varieties of biomass, which includes straws, wood chips, and pellets [
16]. The downdraft fixed-bed reactor is designed with two cylindrical sections—an inner reactor core and an outer syngas plenum. The reactor core, made of carbon steel, has an internal diameter of 0.20 m and stands at 0.48 m tall. A wire mesh, fastened by a chain at the bottom, supports the biomass bed while allowing ash to be continuously discharged. The syngas plenum is created by the space between the two cylinders and is enclosed by a donut-shaped metal plate. The outer cylinder has a diameter of 0.5 m and a length of 0.9 m.
Airflow is introduced into the reactor via an induced draft fan that is fixed between the combustion chamber and the gasifier; this allows for an introduction of air into the reactor. Ash accumulates in the biomass bed and exits through a valve located at the base of the syngas plenum. The syngas produced moves through a transfer line equipped with tar collection devices and a helical heat exchanger for further processing. Positioned at the top, a hopper provides a steady feed of biomass into the reactor, while a separate inlet allows nitrogen to be introduced during shutdown to safely stop ongoing reactions. The reactor’s temperature was tracked using LabVIEW software, with thermocouples installed at different heights to monitor heat distribution. The upper thermocouple recorded temperatures in the drying zone between 65 °C and 121 °C. The middle thermocouple, which tracked the combustion zone, showed an average temperature of around 985 °C, while the bottom thermocouple indicated an average temperature of approximately 850 °C in the gasification zone.
This study explores a throated downdraft gasifier with a one-ton-per-day processing capacity, the throat design is essential to ensuring a regulated flow of biomass and gases, improving the uniformity of heat distribution, continuous gasification of biomass into biochar, enhanced tar cracking, and bio-oil and syngas production. It utilizes various biomass sources including waste-derived materials. Its design enhances thermal efficiency and reduces tar formation, making it an effective option for biochar production. Furthermore, the downdraft configuration optimizes better gas mixing, resulting in more thorough combustion.
Figure 1 presents an image of oak pellets and the gasified pellet.
2.2. Characterization Techniques
To comprehensively evaluate the physicochemical properties of the oak biochar, a collection of advanced analytical techniques was employed. Each method provided unique insights into the structural, chemical, and thermal characteristics essential for determining biochar’s potential applications in soil amendment, carbon sequestration, and environmental remediation.
2.2.1. Scanning Electron Microscopy
The morphology and physical structure of the biochar were investigated using a TESCAN Vega 3 scanning electron microscope (SEM), with an electron beam accelerating voltage range of 200 eV and 30 K eV and offers a magnification range between 2X and 1,000,000. The instrument was operated with VegaTC version 4.2.30 (TESCAN, Brno, Czech Republic). The biochar sample was ground and carefully mounted onto a gold-coated epoxy substrate using a sputter coater. This process was conducted to prevent any charging effects when exposed to the electron beam during the imaging process, ensuring high-quality analysis. The gold coating, which was applied according to standard procedures, also helps in enhancing the conductivity of the sample. This mounting method is in full compliance with the ASTM E986 standards [
1] for sample preparation in electron microscopy. The resulting image was captured at varying magnifications of 5 µm, 10 µm, and 20 µm, allowing for detailed examination of the biochar’s surface morphology and structural characteristics at different scales.
2.2.2. Thermogravimetric Analysis
Thermogravimetric analysis (TGA) was conducted in strict compliance with ASTM E1131 [
2] with a Netzsch STA 449 F5 Jupiter system, version 8.03, sourced from selb, Bayern, Germany. The temperature was ramped from 25 °C to 150 °C at 1, version 8.0. 30 °C/min, followed by an isothermal segment at 150 °C for 15 min, all under 50 mL/min nitrogen. This was followed by a ramp at 10 °C/min to 900 °C/min with a 15 min isothermal segment under 50 mL/min nitrogen. This was followed by a second isothermal segment for 30 min under 50 mL/min air.
2.2.3. X-Ray Diffraction Analysis
X-ray diffraction is a technique employed for the analysis and evaluation of the crystalline structure of materials including biochar. The analysis is conducted with the sample of the oak biochar grounded into a fine powder to ensure the uniformity of the bulk sample and also to allow for the maximum exposure of the sample to the X-rays. The finely powdered biochar is placed in a sample holder for X-ray diffraction (XRD) patterns; the analysis was obtained using a PANalytical X’Pert Multipurpose diffractometer, manufacted and sourced from malvern Panalytical, Geat Malvern, UK. It utilizes a Cu source and a PIXCel detector. The scan covers a wide range of angles, 5–90 degrees 2θ, ensuring the identification of various crystalline phases of the oak biochar sample at a scan rate of 3 degrees per minute using a Cu Kα radiation source.
2.2.4. Brunauer–Emmett–Teller (BET) Surface Area Analysis
Similarly, the Brunauer–Emmett–Teller (BET) surface area analysis, the pore characteristics, and the adsorption isotherms of the oak biochar were analyzed using an Anton Paar 600 physisorption analyzer instrument. Employing the ISO9277:2010 standard [
3], the biochar was degassed for three (3) hours at a temperature of 300 °C under nitrogen gs to ensure that the sample was purged of any residual moisture, volatile organic compounds, and contamination that could interfere with the analysis. This process ensured that the biochar surface was purified from any contamination and prepared for accurate gas adsorption analysis. After degassing, a 44-point analysis was conducted. Nitrogen N
2 gas was used as the adsorbate at −196 °C.
Density Functional Theory (DFT) was used to assess the pore size and structure of the biochar samples, with a particular focus on determining pore volume and width. DFT is a computational technique that predicts gas adsorption behavior on solid surfaces. In this case, DFT was applied to analyze nitrogen adsorption–desorption isotherms derived from the BET (Brunauer–Emmett–Teller) method. This analysis enabled a thorough evaluation of pore size distribution, including pore volume, width, and overall porosity of the biochar samples. The findings provided valuable insights into the surface characteristics, micropore, mesopore, and macropore distribution, as well as how these structural features could affect the material’s electrochemical properties and reactivity.
2.2.5. Fourier Transform Infrared Spectroscopy (FTIR)
The Fourier transform infrared spectroscopy analysis was conducted to identify and evaluate surface functional groups in the gasified oak biochar using the standard test method which is suitable for carbon analysis of materials similar to biochar. A Thermo Scientific Nicolet iS10 Fourier-Transform Infrared Spectrometer in transmission mode, the complete setup was assembled in Madison, mode, manufactured in Madison, WI, USA was used, and the biochar samples were prepared with KBr and pressed into pellets. The instrument operated over a spectral range of 4000–400 cm⁻1 with a resolution of 4 cm⁻1 and ran using Thermo Scientific OMNIC software version 9.13.1256 was used to analyze characteristic absorption spectra bands.
2.2.6. Raman Spectroscopy and X-Ray Photoelectron Spectroscopy (XPS) Analysis
The Thermo Scientific Nexsa system equipment, manufactered in East Grinstead, UK, offers a multi-technique capability. It comprises an X-ray photoelectron spectroscopy (XPS) and a Raman system. The Raman is a ThermoFisher iXR Raman Spectrometer, the complete setup was assembled in Madison, WI, USA. The Raman is an analytical tool used for molecular structure and vibrational properties of biochar. The Raman system of the Nexsa-stage automation uses a 532 nm (wavelength) source and Omnic Software version 9.11.706 for processing. The Raman procedure and analysis were in compliance with ISO/TS 21356-1:2021 [
4] to ensure accurate spectra for the biochar. The intensity ratio of the D- band to the G-band was analyzed to determine structural defects and disorder in the biochar matrix. Nexsa X-ray photoelectron spectroscopy uses Advantage software version 6.8.0 and operates under an ultra-high vacuum. It is capable of angle-resolved analysis and elemental surface mapping The excitation source is a monochromatic AI source. The system includes a charge neutralizer and an ion sputter gun for potentially more detailed sample analysis. Furthermore, to ensure accurate analysis, instrument calibration, and results interpretation, ISO 18115-1 [
5] was adopted for the surface chemistry analysis of the oak biochar sample.
2.2.7. Ultimate Analysis Using CHN Analyzer
The ultimate analysis of the oak biochar was conducted using the CNH Analyser 828 series instrument by LECO (Laboratory Equipment Corporation) St. Joseph, MI, USA. The biochar was weighed and wrapped into a tin foil capsule and loaded into the instrument for subsequent combustion in a ceramic crucible, the combusted sample was analyzed and measured via a thermal conductivity detector (TCD) to give the weight percentage compositions of nitrogen (N), carbon (C), and hydrogen (H). This analysis provides information on the energy/fuel composition of oak biochar and its carbon content. The methodology of the ultimate analysis was conducted following the ASTM D3176 and ISO 16948 standards [
6]. These standards govern the use of instruments like the LECO CHN analyzer, ensuring accurate determination of carbon, hydrogen, and nitrogen composition and also the estimation of oxygen by difference.
2.2.8. pH Analysis of the Oak Biochar
The pH analysis of the biochar was carried out following the ASTM D4972 guidelines utilizing a Mettler Toledo (ATC) instrument with a manufacturing origin in Changzhou, China [
7]. The Mettler Toledo instrument was calibrated following the manufacturer’s guidelines to ensure accurate results. The biochar sample was ground into particles less than 2 mm to achieve consistency and enhance the interaction of the bulk material with the solution of deionized water in a ratio of 1:10. The mixture was thoroughly agitated in a sonicator and allowed to stand for 30 min undisturbed. The instrument probe was inserted into the solution and measured accurately.
2.2.9. Electrochemical Analysis
Analysis of the zeta potential, electrophoretic mobility, and conductivity of the biochar sample were analyzed using the Lite Sizer 500 by Anton Paar, an advanced instrument assembled and manufactured in Graz, Austria. With the multi-functional capability of measuring electrophoretic mobility and zeta potential for precise colloidal analysis. The biochar sample was ground into a fine sample of 50 µm to ensure and achieve homogeneity and thoroughly dispersed in deionized water in a ratio of 1:10. To further ensure uniformity, the solution was sonicated for 1hr to prevent aggregation. Both the zeta potential and electrophoretic mobility analyses were conducted and evaluated in accordance and compliance with ISO 13099-2. To achieve a reliable result, the conductivity analysis was performed following ISO 7888: 1985 standards. The electrical conductivity of the sample suspension was evaluated and measured using built-in electrodes in the Litesizer 500 instrument [
8,
9].
By adhering to internally recognized ISO standards, this study and characterization of the biochar are reliable and can be reproduced.
3. Results and Discussion
The oak biochar sample in this study was investigated using several analyses. The research employed a range of comprehensive techniques to detail and examine its unique and potential properties and applications. Refer to
Section 2.2.
3.1. Morphological Characterization of Oak Biochar via Scanning Electron Microscopy (SEM)
The scanning electron microscope (SEM), an important tool in assessing the biochar qualitatively, that is very reliable in examining the micro-pores, was used to investigate the morphology of the oak biochar [
4,
18]. The SEM was used to evaluate porosity, an important physical property of biochar’s soil amendment capabilities, potential microbe habitation, and water-holding capacity, another property that is applied in soil remediation [
19].
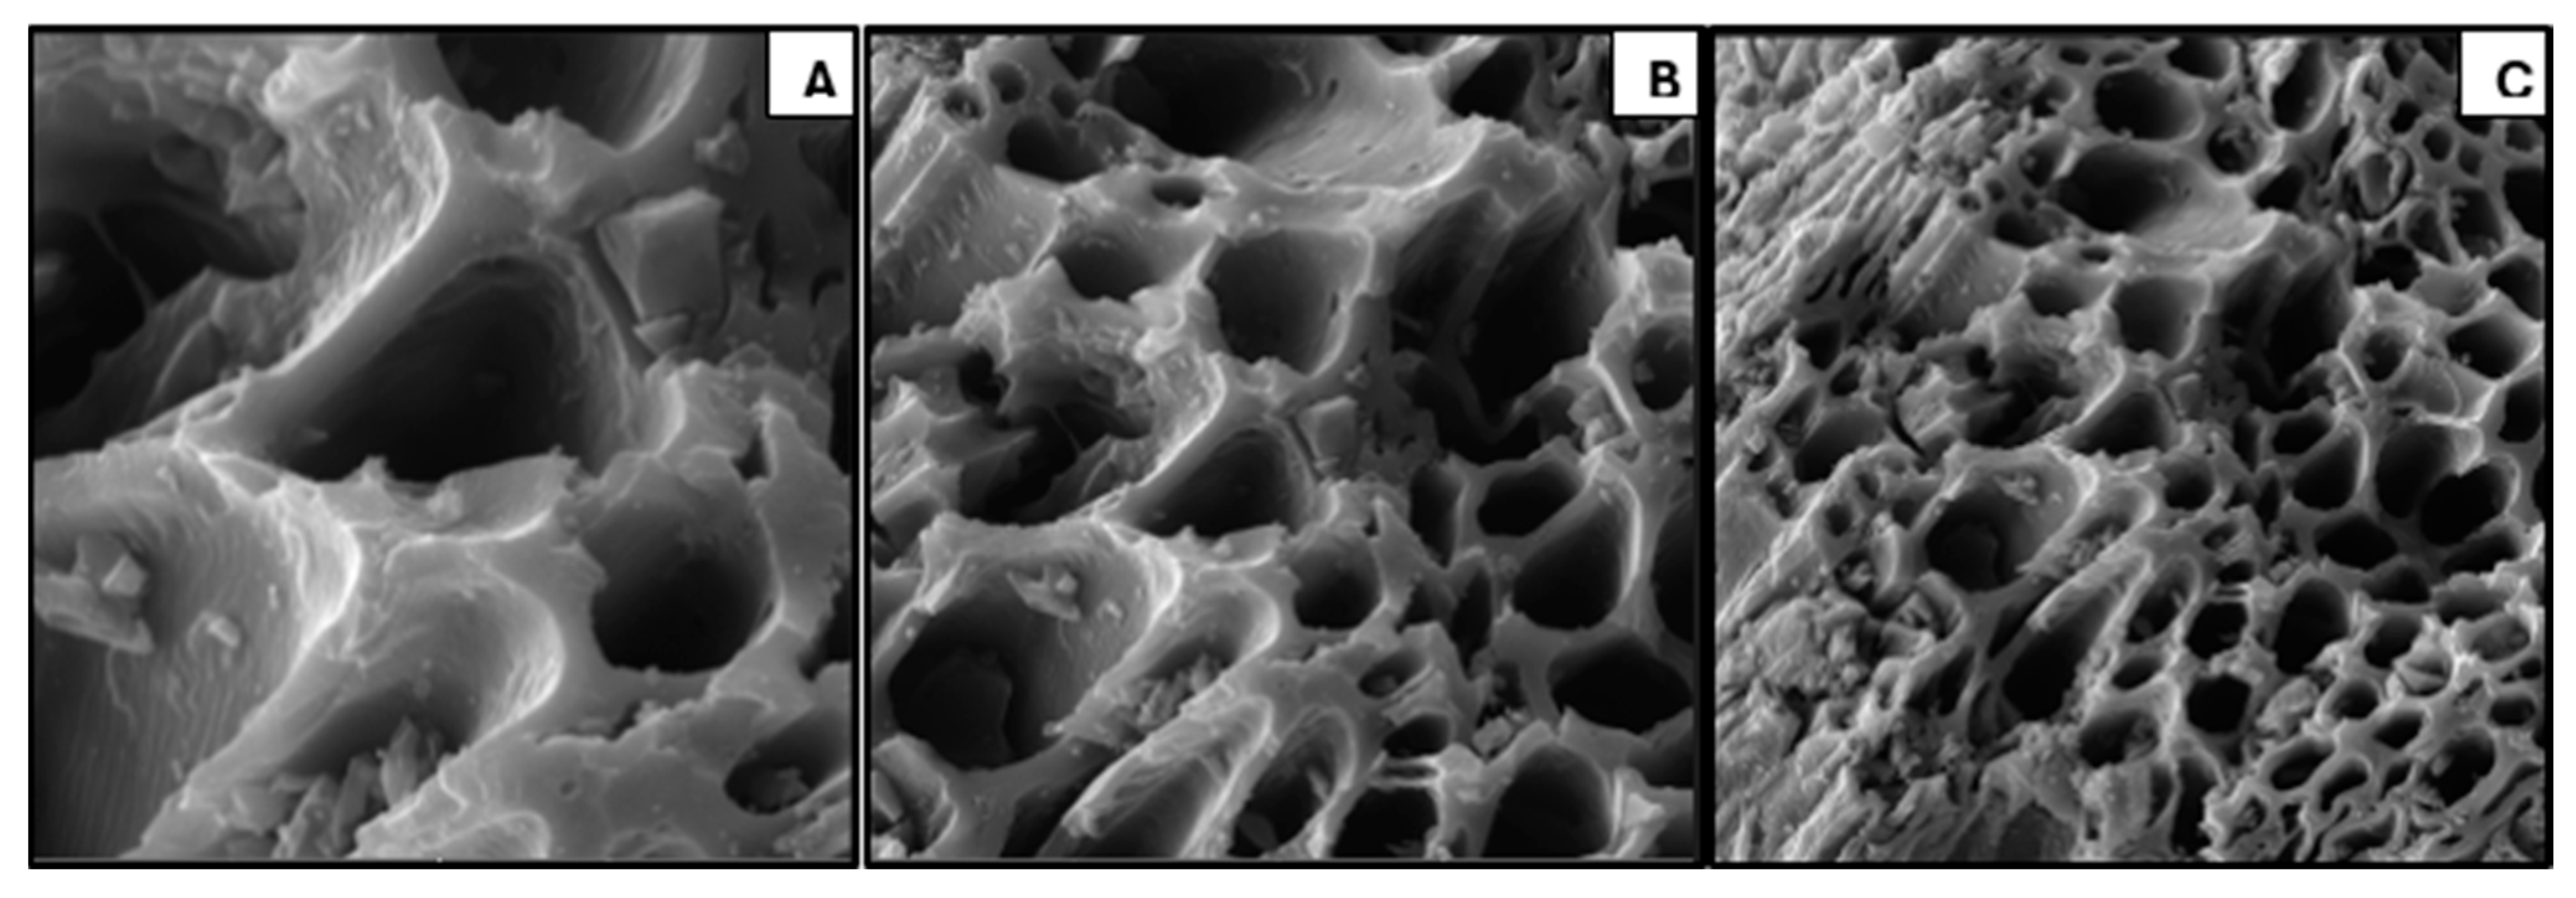
Figure 3 shows the SEM image of the oak biochar sample at 5 µm, 10 µm, and 20 µm.
The SEM image of the oak biochar sample was observed to have retained the fibrous structure of the oak feedstock. The studies by Jiang, Tasi-Jung et al. [
20], and Luo, Qing et al. [
21] show that a high-temperature thermochemical process opens up pores and makes them fibrous. Furthermore, the image shows a porous structure that is very suitable in terms of water-holding capacity and as a habitat for microbes that will facilitate soil amendment and show potential for microbial colonization. Finally, the image shows a complex network of channels and pores which evidently will contribute to the sample’s surface area and potential for catalytic applications.
3.2. Surface Area and Pore Structure Analysis via BET Technique
The Brunauer–Emmett–Teller (BET) analysis was used to quantify and analyze the porous structure and surface properties of the oak biochar. This provided crucial information on the physicochemical properties and the probable potential applications based on the analysis. Understanding the adsorption of nitrogen by oak biochar, its surface area, and the pore width distribution is essential to tailoring oak biochar to its specific applications.
Table 1 and
Figure 4 and
Figure 5 emphasize these properties.
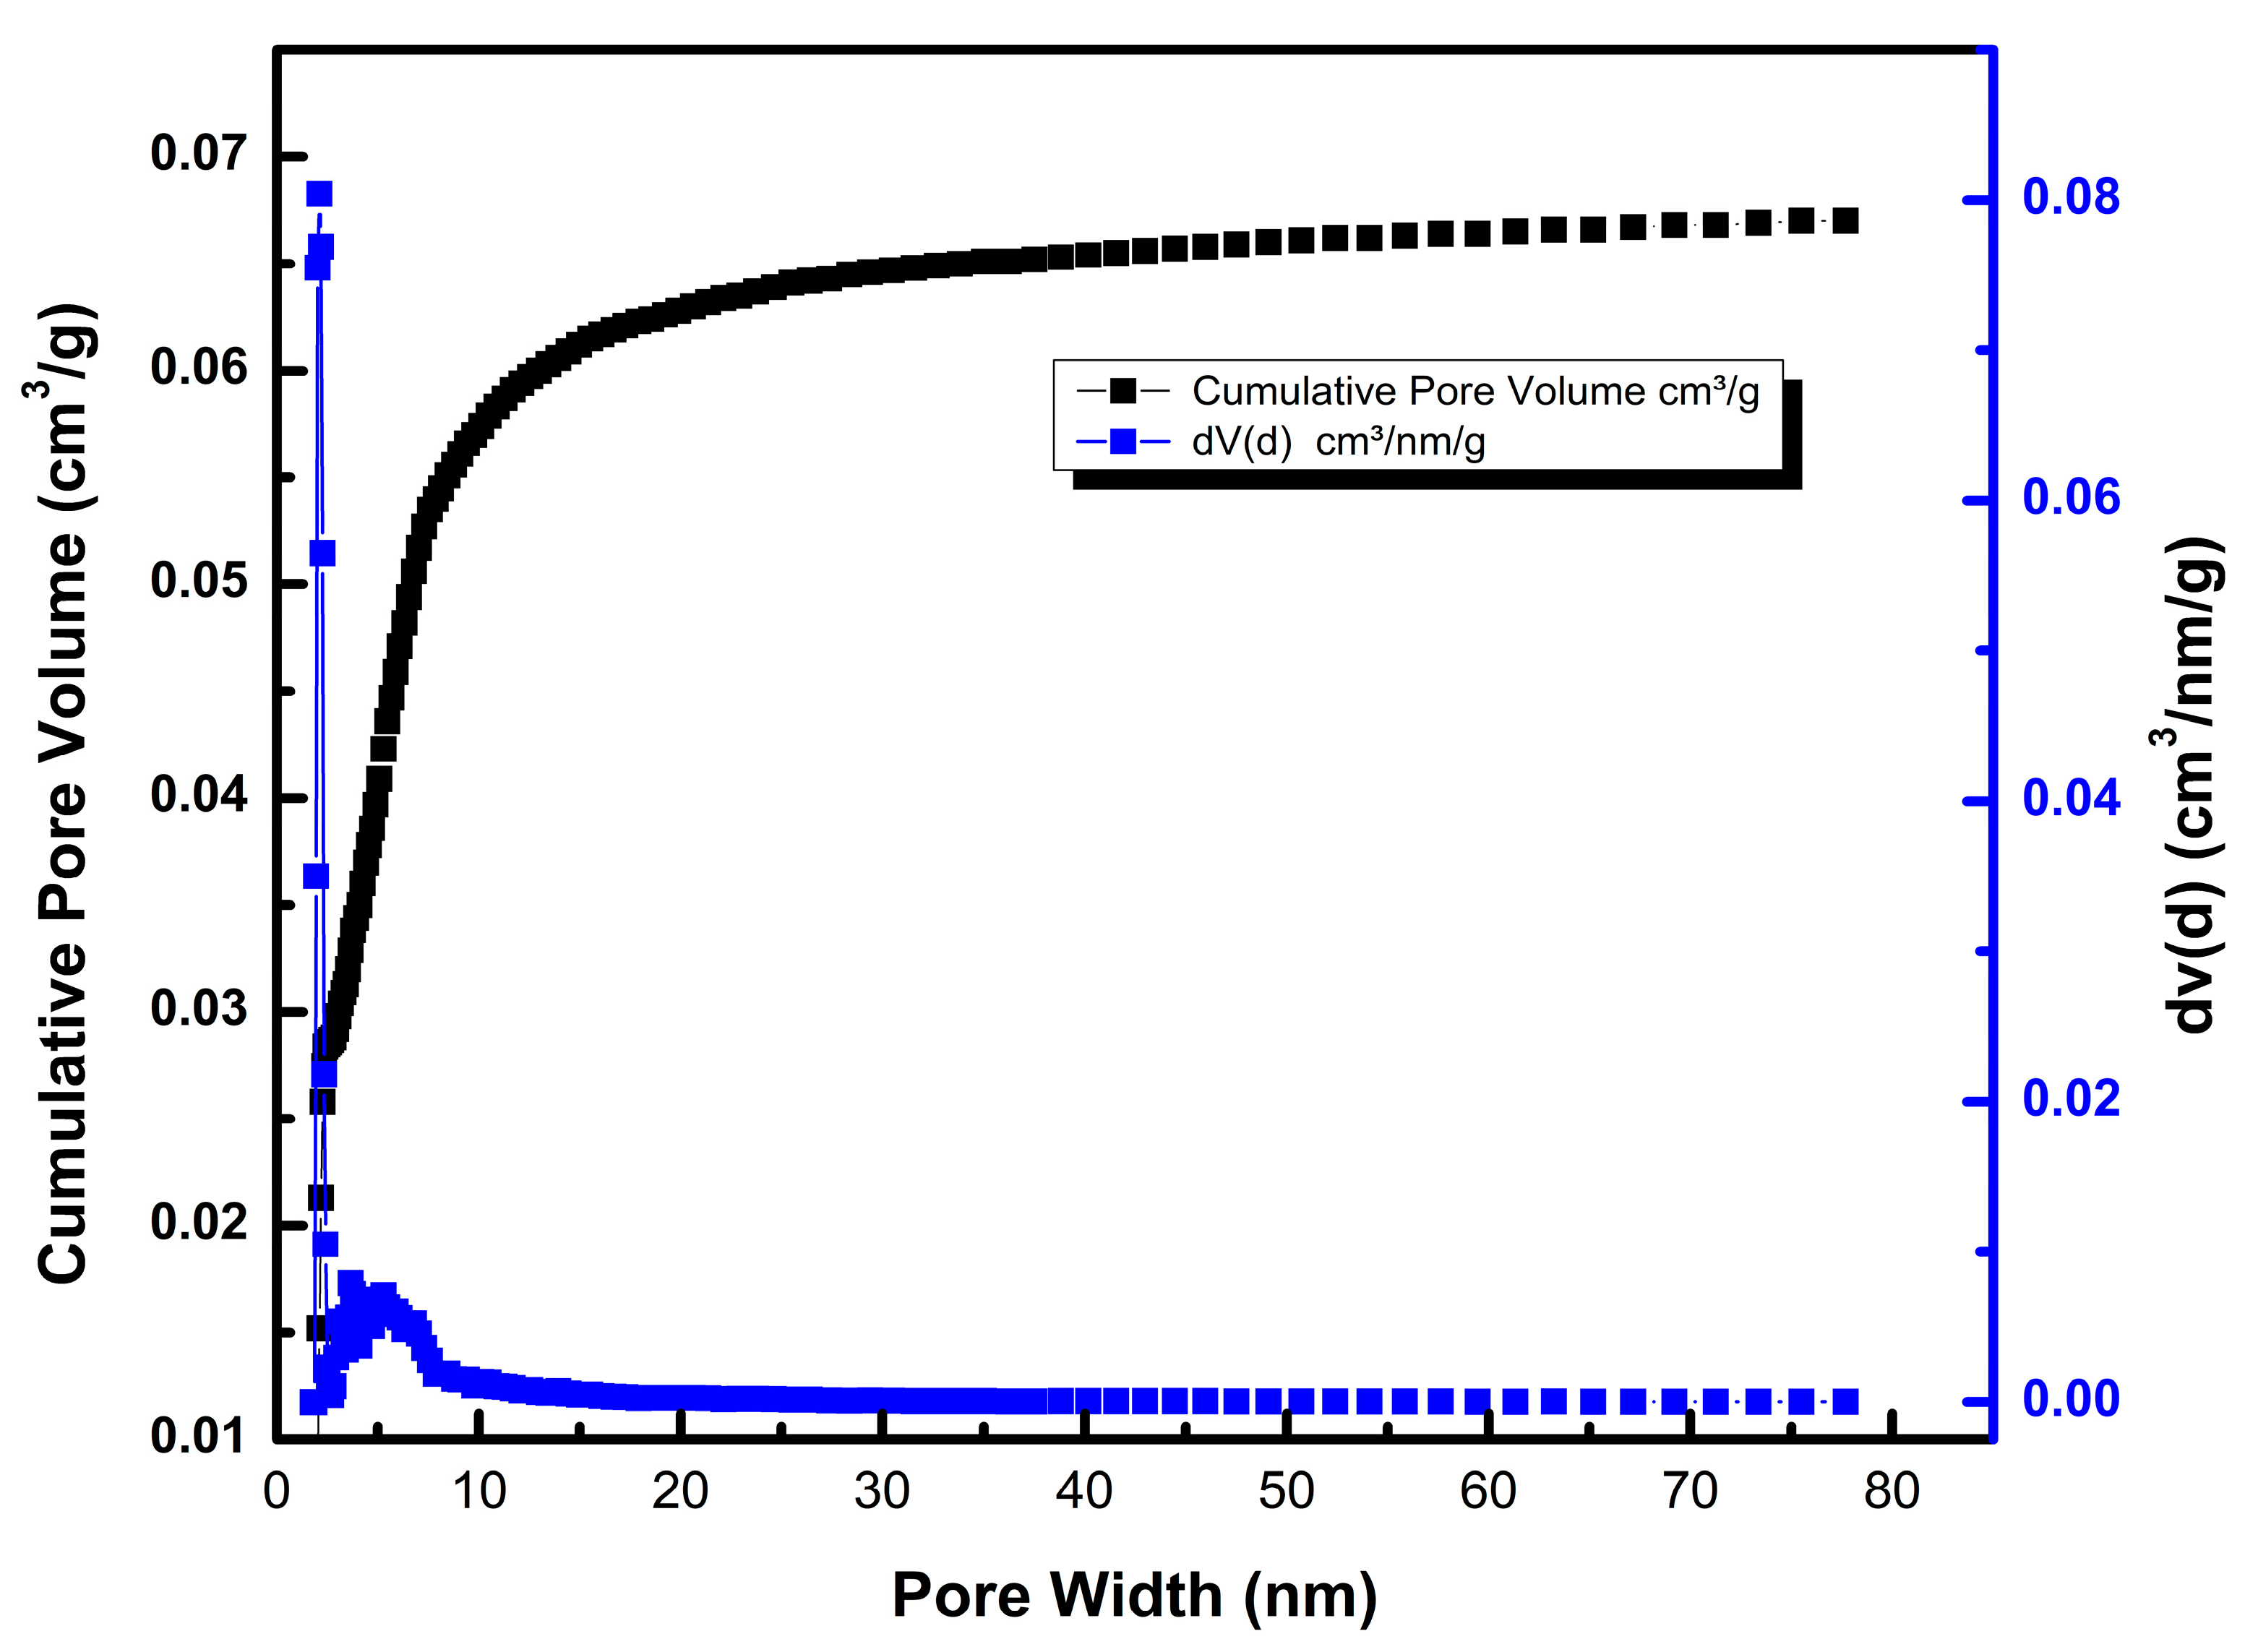
Table 1 shows the surface area and particle morphology, and
Figure 4 and
Figure 5 show the nitrogen absorption isotherm and the particle morphology graph, respectively.
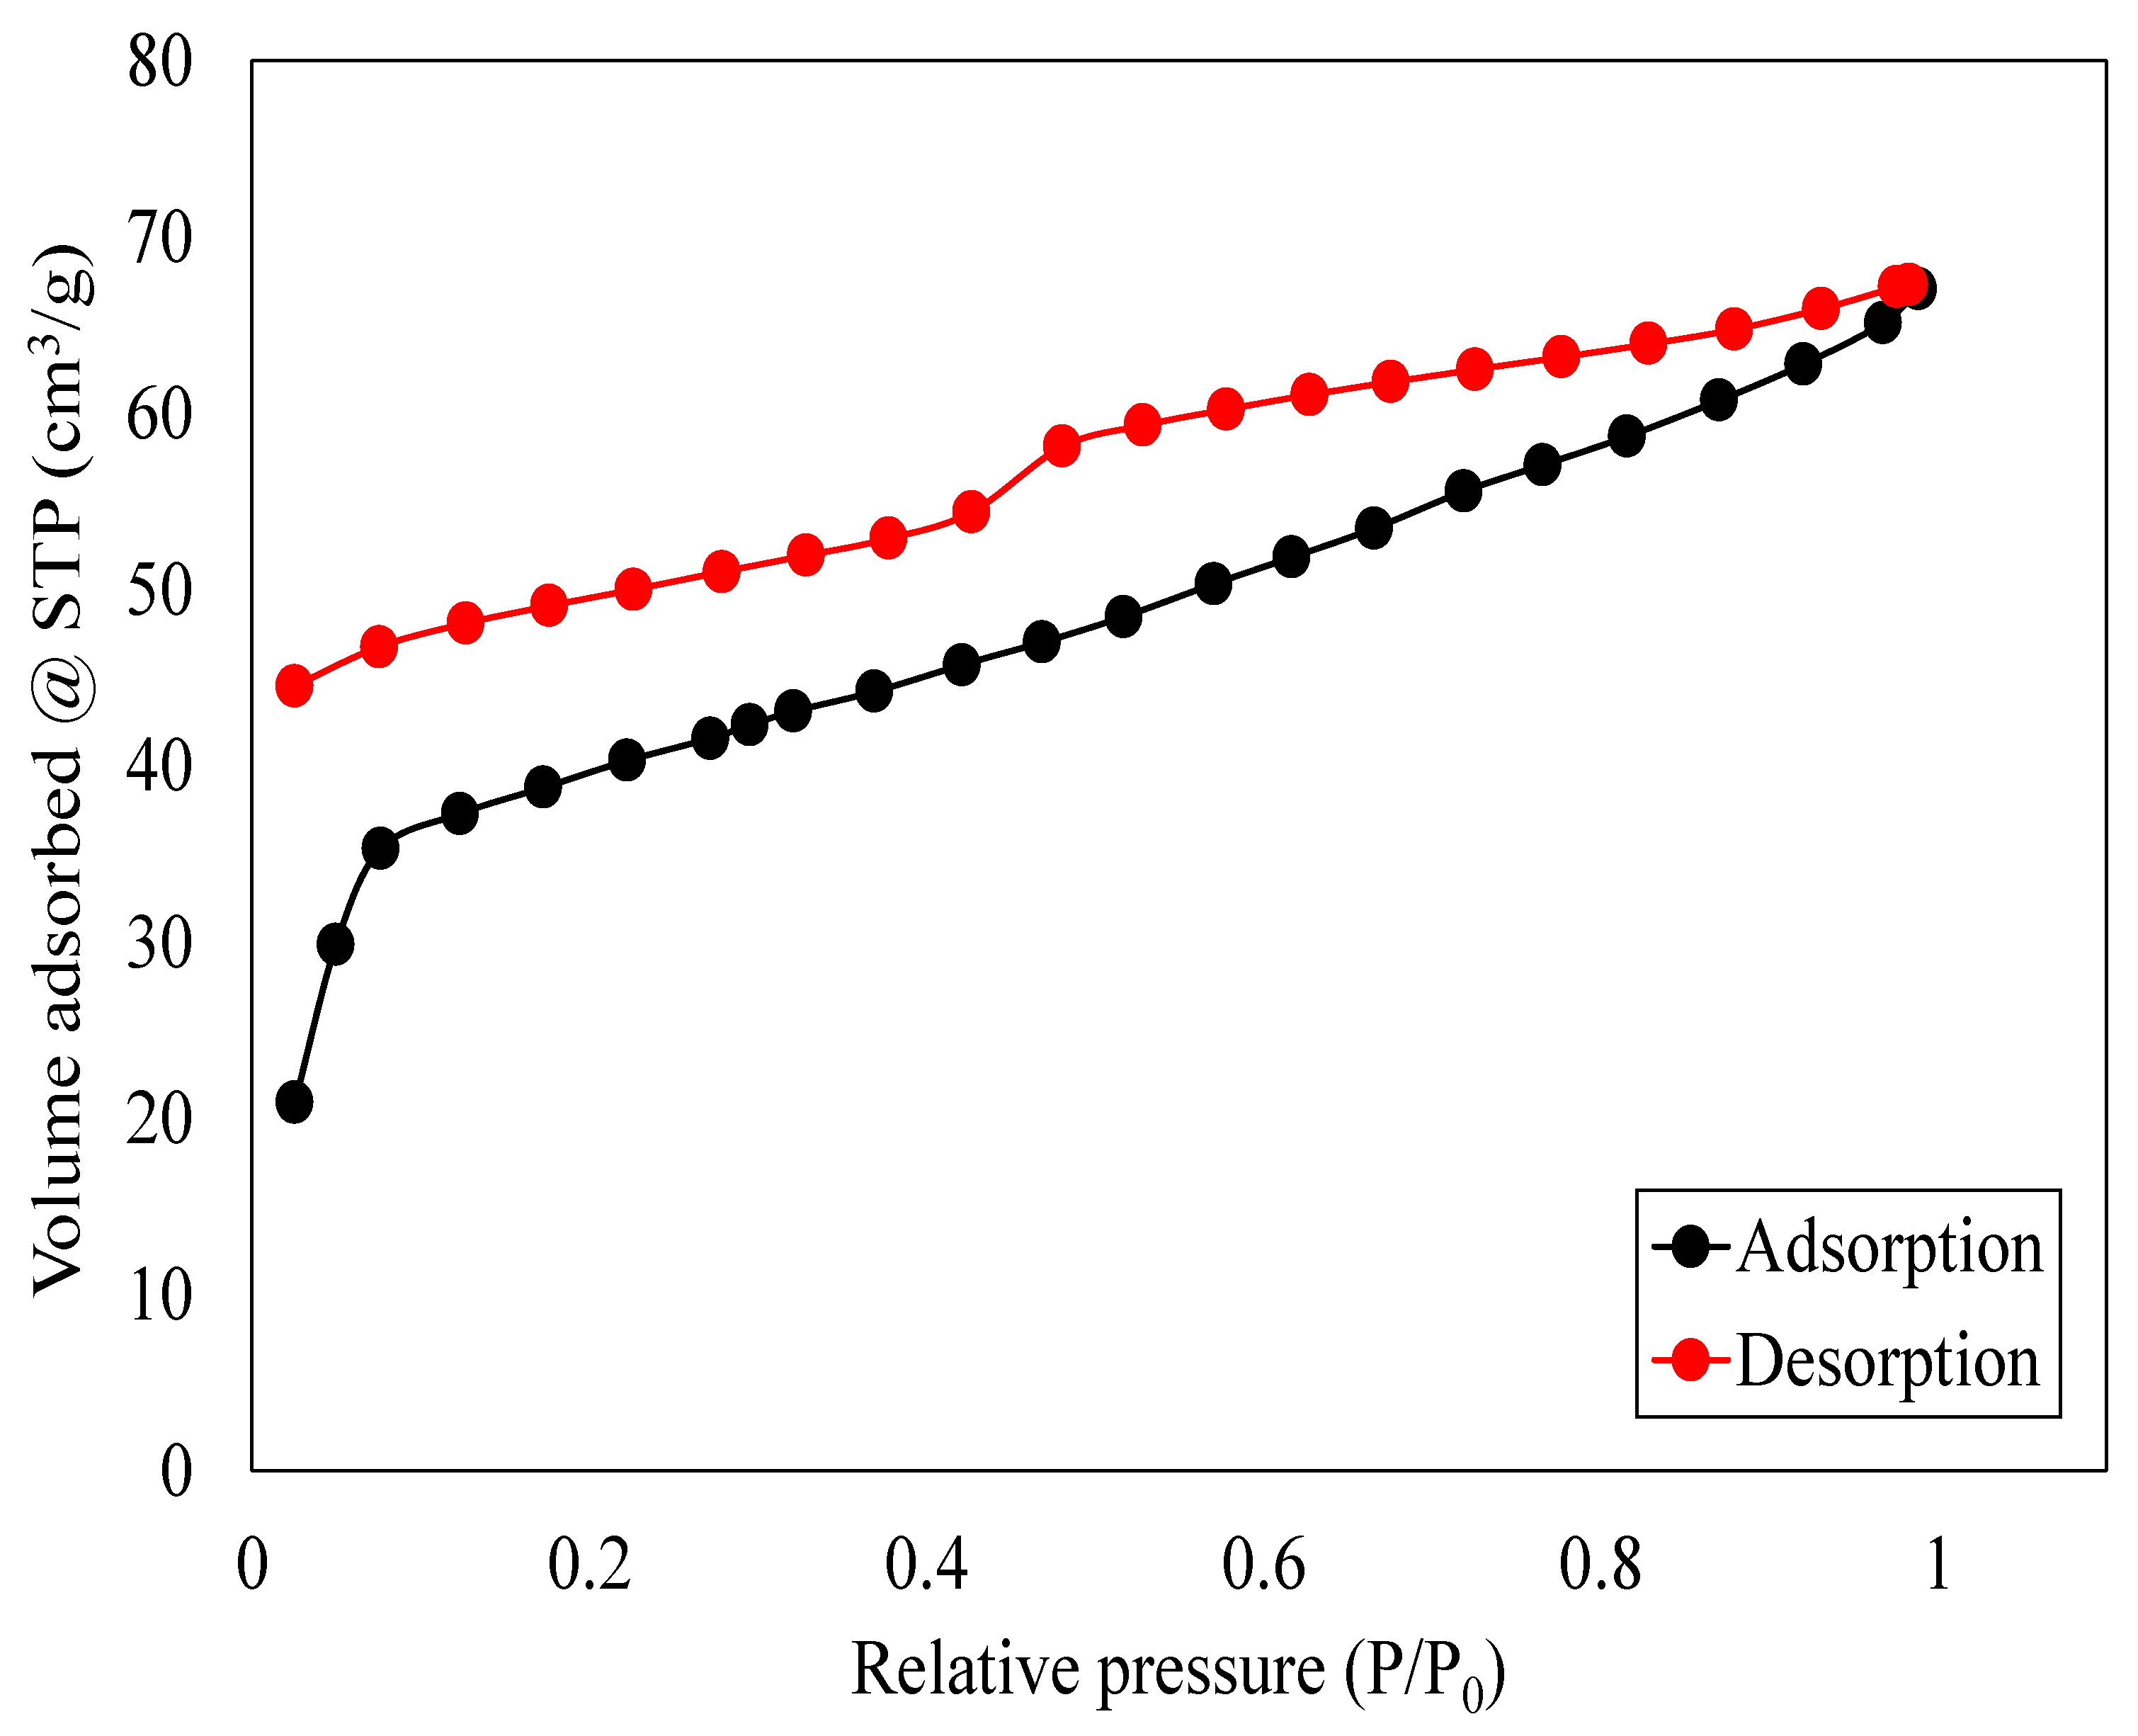
The 44-datapoint BET analysis shows that the oak biochar sample has a surface area of 88.97 m
2/g, a pore width distribution of 1.78–77.698 nm, and absorbed a volume of 67.05 cm
3/g of nitrogen gas with a cumulative pore volume of 0.0670 cm
3/g.
Table 1 summarizes the BET analysis of the oak biochar sample. Oak biochar shows a hysteresis loop as shown in
Figure 4, indicating that oak biochar is mesoporous, with pore sizes ranging from 2 to 50 nm [
22]. These results are also supported and aligned with studies by Lu and Zong [
23]. Mesoporous materials like oak biochar find applications in energy storage, catalysis, environmental remediation, wastewater treatment, air purification, gas separation, and carbon capture [
24,
25,
26].
3.3. Thermal Stability and Composition Analysis via TGA and Proximate Methods
The changes in mass, temperature, and time, were analyzed on a dry basis of the biochar. Thermogravimetric analysis (TGA) and differential scanning calorimetry (DSC) were used to quantify and evaluate the thermal stability of the oak biochar [
4,
27,
28,
29].
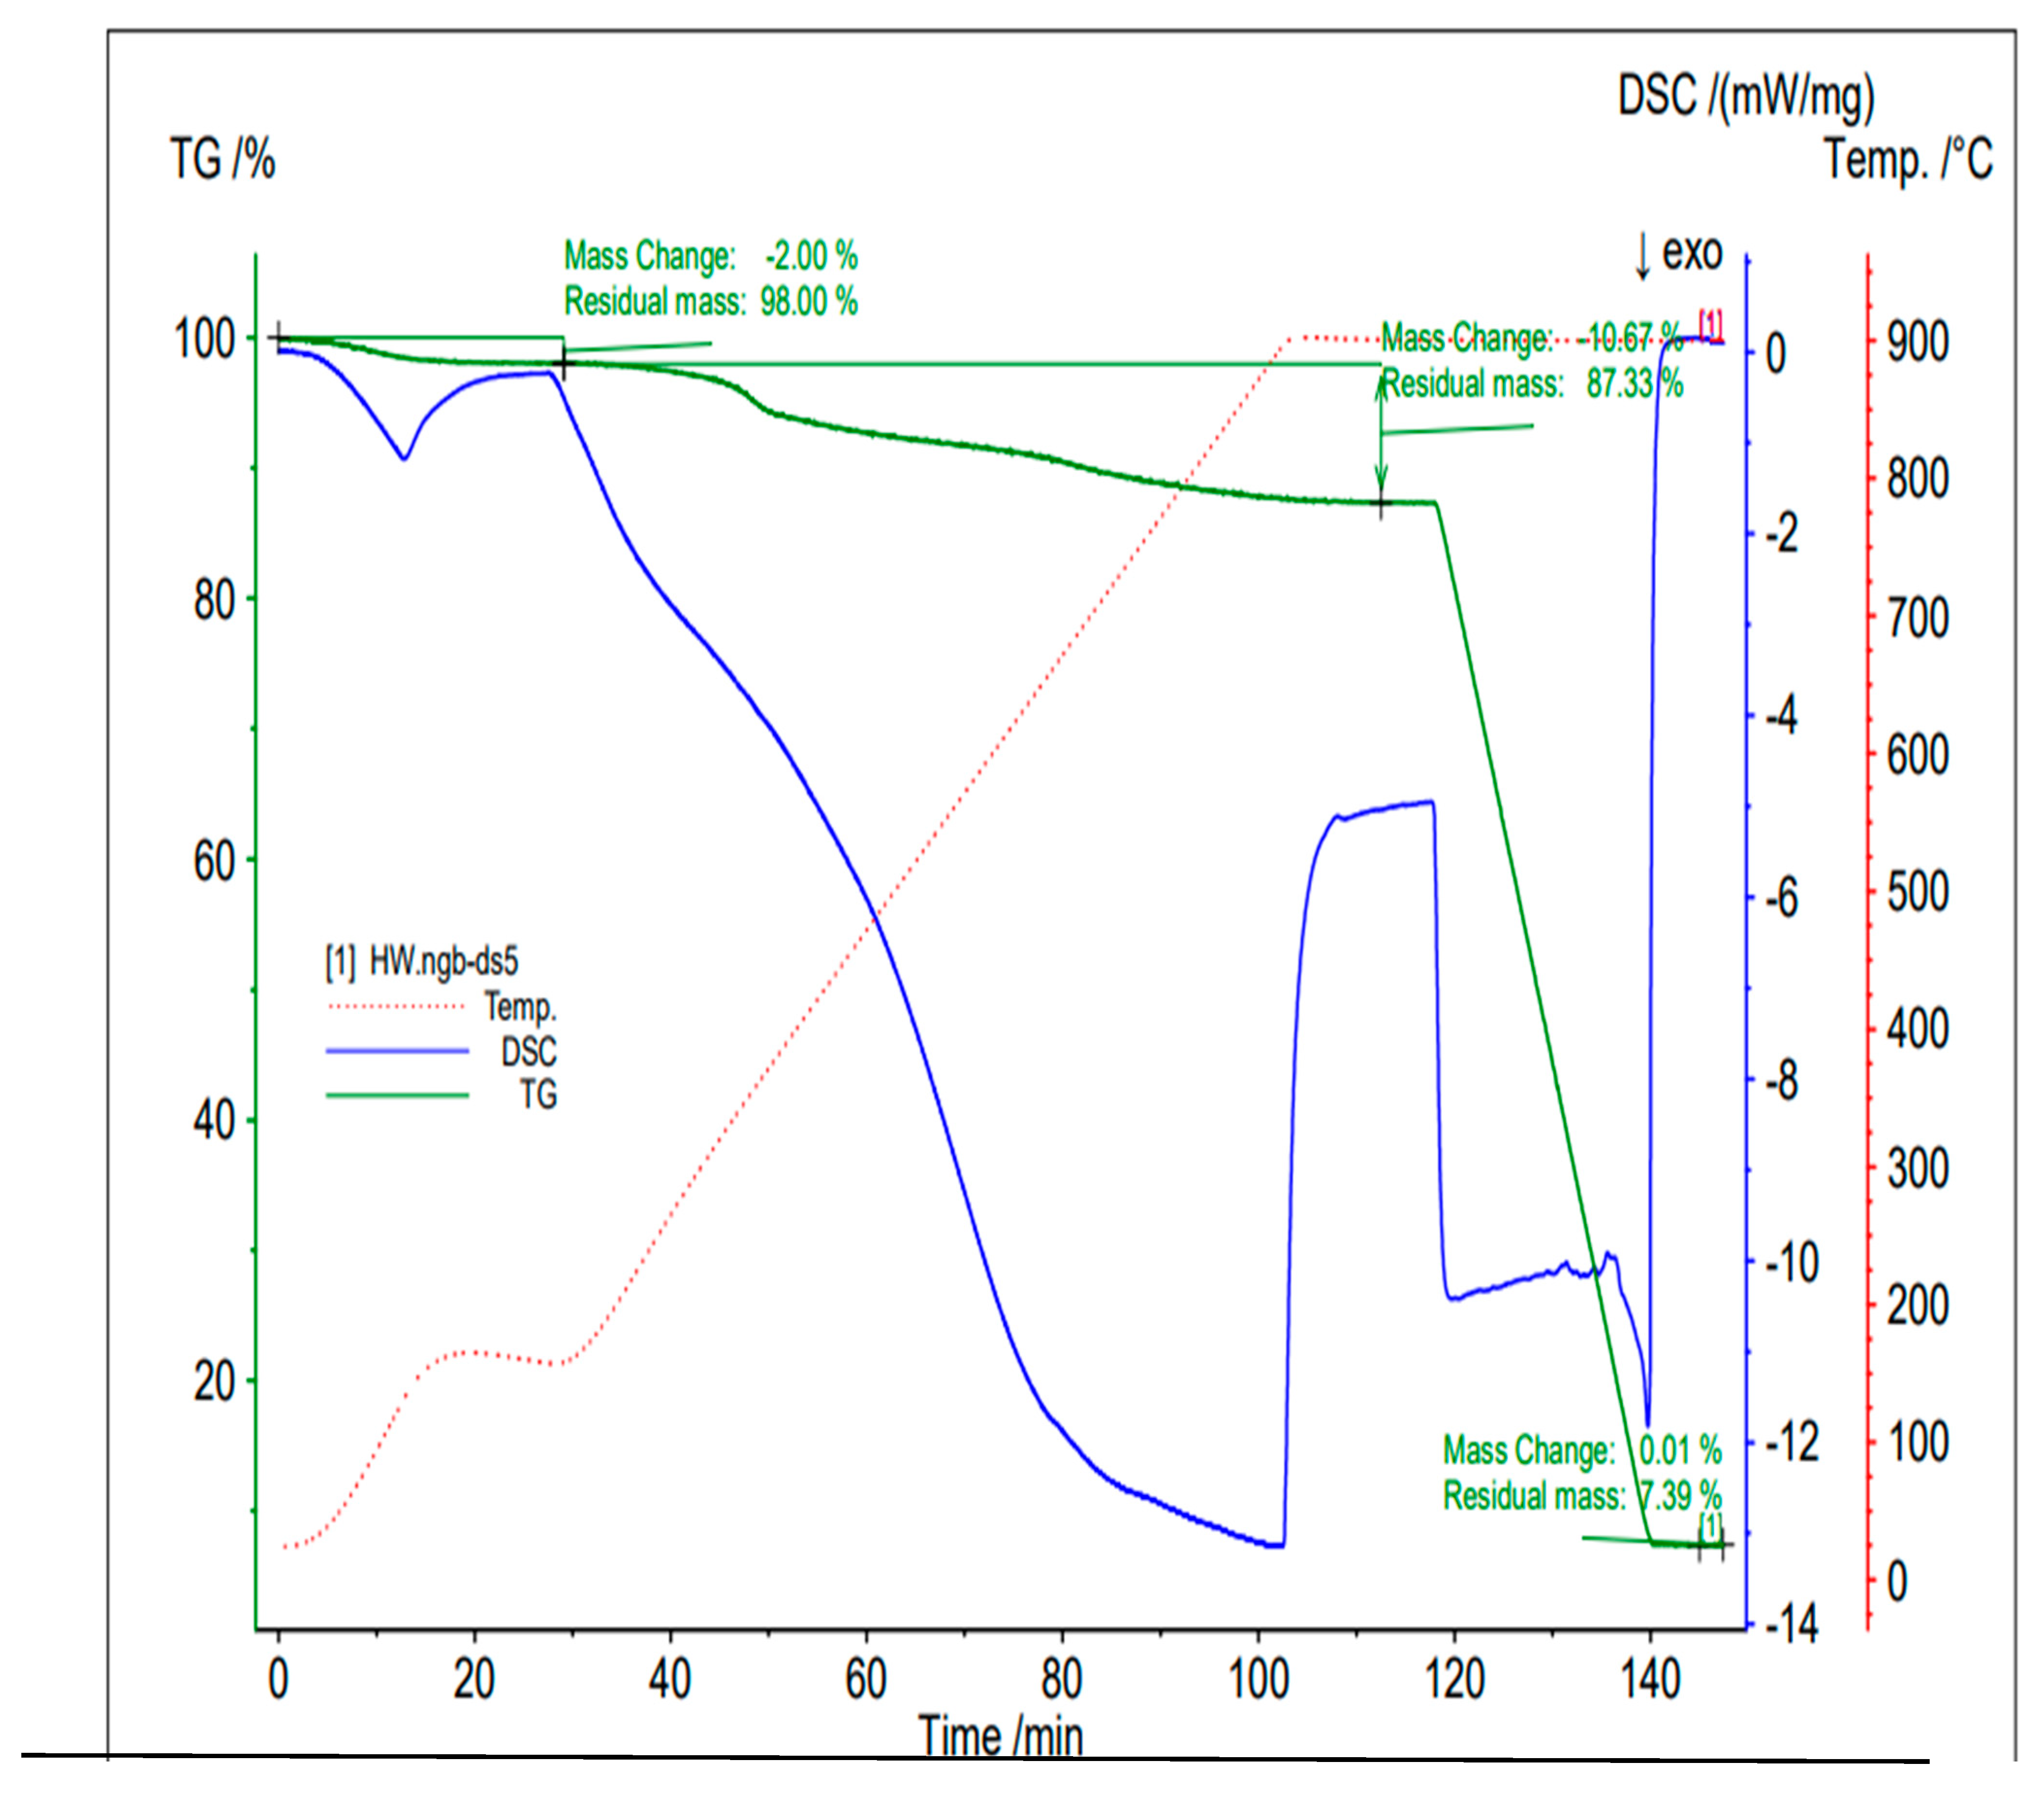
Figure 6 shows the thermogravimetric and thermogram curves.
The thermogravimetric and thermogram curves of the oak biochar sample reveal that, under the presence of nitrogen with a temperature of 900 °C, there was a 2% change in mass due to the loss of moisture content, indicating that the analysis was conducted on a dry biochar basis. Similarly, at 110 min, there was a 10.97% change in mass due to the volatiles expelled as the ramping up of the temperature continued, causing the breakdown of less stable compounds. At 120 min, with the introduction of air, 80% of the biochar combusted, leaving 7.39% as ash (incombustible inorganic matter).
The thermal stability of the oak biochar under inert nitrogen conditions was good, with only the volatilization of breakable matter (volatiles). The significant weight loss of the oak biochar occurred only after the air was introduced, indicating a strong resistance to thermal degradation in the absence of oxygen [
30,
31].
The high carbon content identified in the analysis indicates a high-temperature thermochemical conversion, a characteristic of high-quality biochar, and a potential application in carbon sequestration. Finally, the low volatile matter and high fixed-carbon content, low moisture content, and low ash content are characteristics of a good stable biochar with significant potential for long-term carbon sequestration [
32,
33,
34].
Proximate Analysis
Evaluating the TGA, the proximate analysis of the oak biochar can be approximately deduced.
Table 2 shows the proximate analysis of the oak biochar. The proximate composition consists of fixed carbon, volatile matter, moisture content, and ash content. The thermal decomposition graph in
Figure 6 allows for the evaluation of the decomposition of volatile compounds, the oxidation of fixed carbon, and the evaporation of moisture content. Studies by Calin et al. and Yradoddi et al. [
31,
35] investigated the pyrolytic decomposition of apple and potato peel, corn starch, sugarcane bagasse, and food waste using TGA). The findings offer key insights into thermal stability and highlight the effectiveness of TGA and proximate analysis in assessing material decomposition and stability.
Table 2 presents the proximate analysis of the oak biochar, offering detailed information on the breakdown of the biochar’s composition and its thermal behavior. While volatile matter offers the potential for oak biochar reactivity and gas evolution, the ash content offers the presence of organic content in the biochar and reflects the biochar’s effectiveness in soil amendment. Similarly, the high fixed-carbon content gives information suitable for applications in carbon sequestration [
34].
Further analysis of
Figure 6, which shows the thermogram curve from the differential scanning calorimetry (DSC), reveals many different thermal events [
10]. At around 20 min, there was a dip in the DSC graph, indicating an endothermic process of evaporation, resulting from the loss of the moisture content. There was a fairly stable period before a second endothermic transition occurred due to the breaking of the bonds of the volatiles, during which the sample absorbed a large amount of heat for about 60 min. Subsequently, a sharp increase at around 102 min indicates an oxidation process accompanied by a release of heat (exothermic) during the combustion of fixed carbon in the air. Finally, the sharp decrease in temperature after another fairly stable phase represents the cooling phase following the combustion of fixed carbon.
Finally, the oak biochar sample shows a high fixed-carbon (FC) content and very low volatile matter, which are desirable properties for biochar. These characteristics make it suitable for applications in carbon sequestration and soil amendment [
36,
37].
3.4. Characterization of Surface Functional Elements Through X-Ray Photoelectron Spectroscopy
The use of an X-ray photoelectron spectroscopy analysis is an important technique for analyzing and quantifying biochar. It was used to study the surface characteristics of the oak biochar and provide quantitative information on its elemental composition.
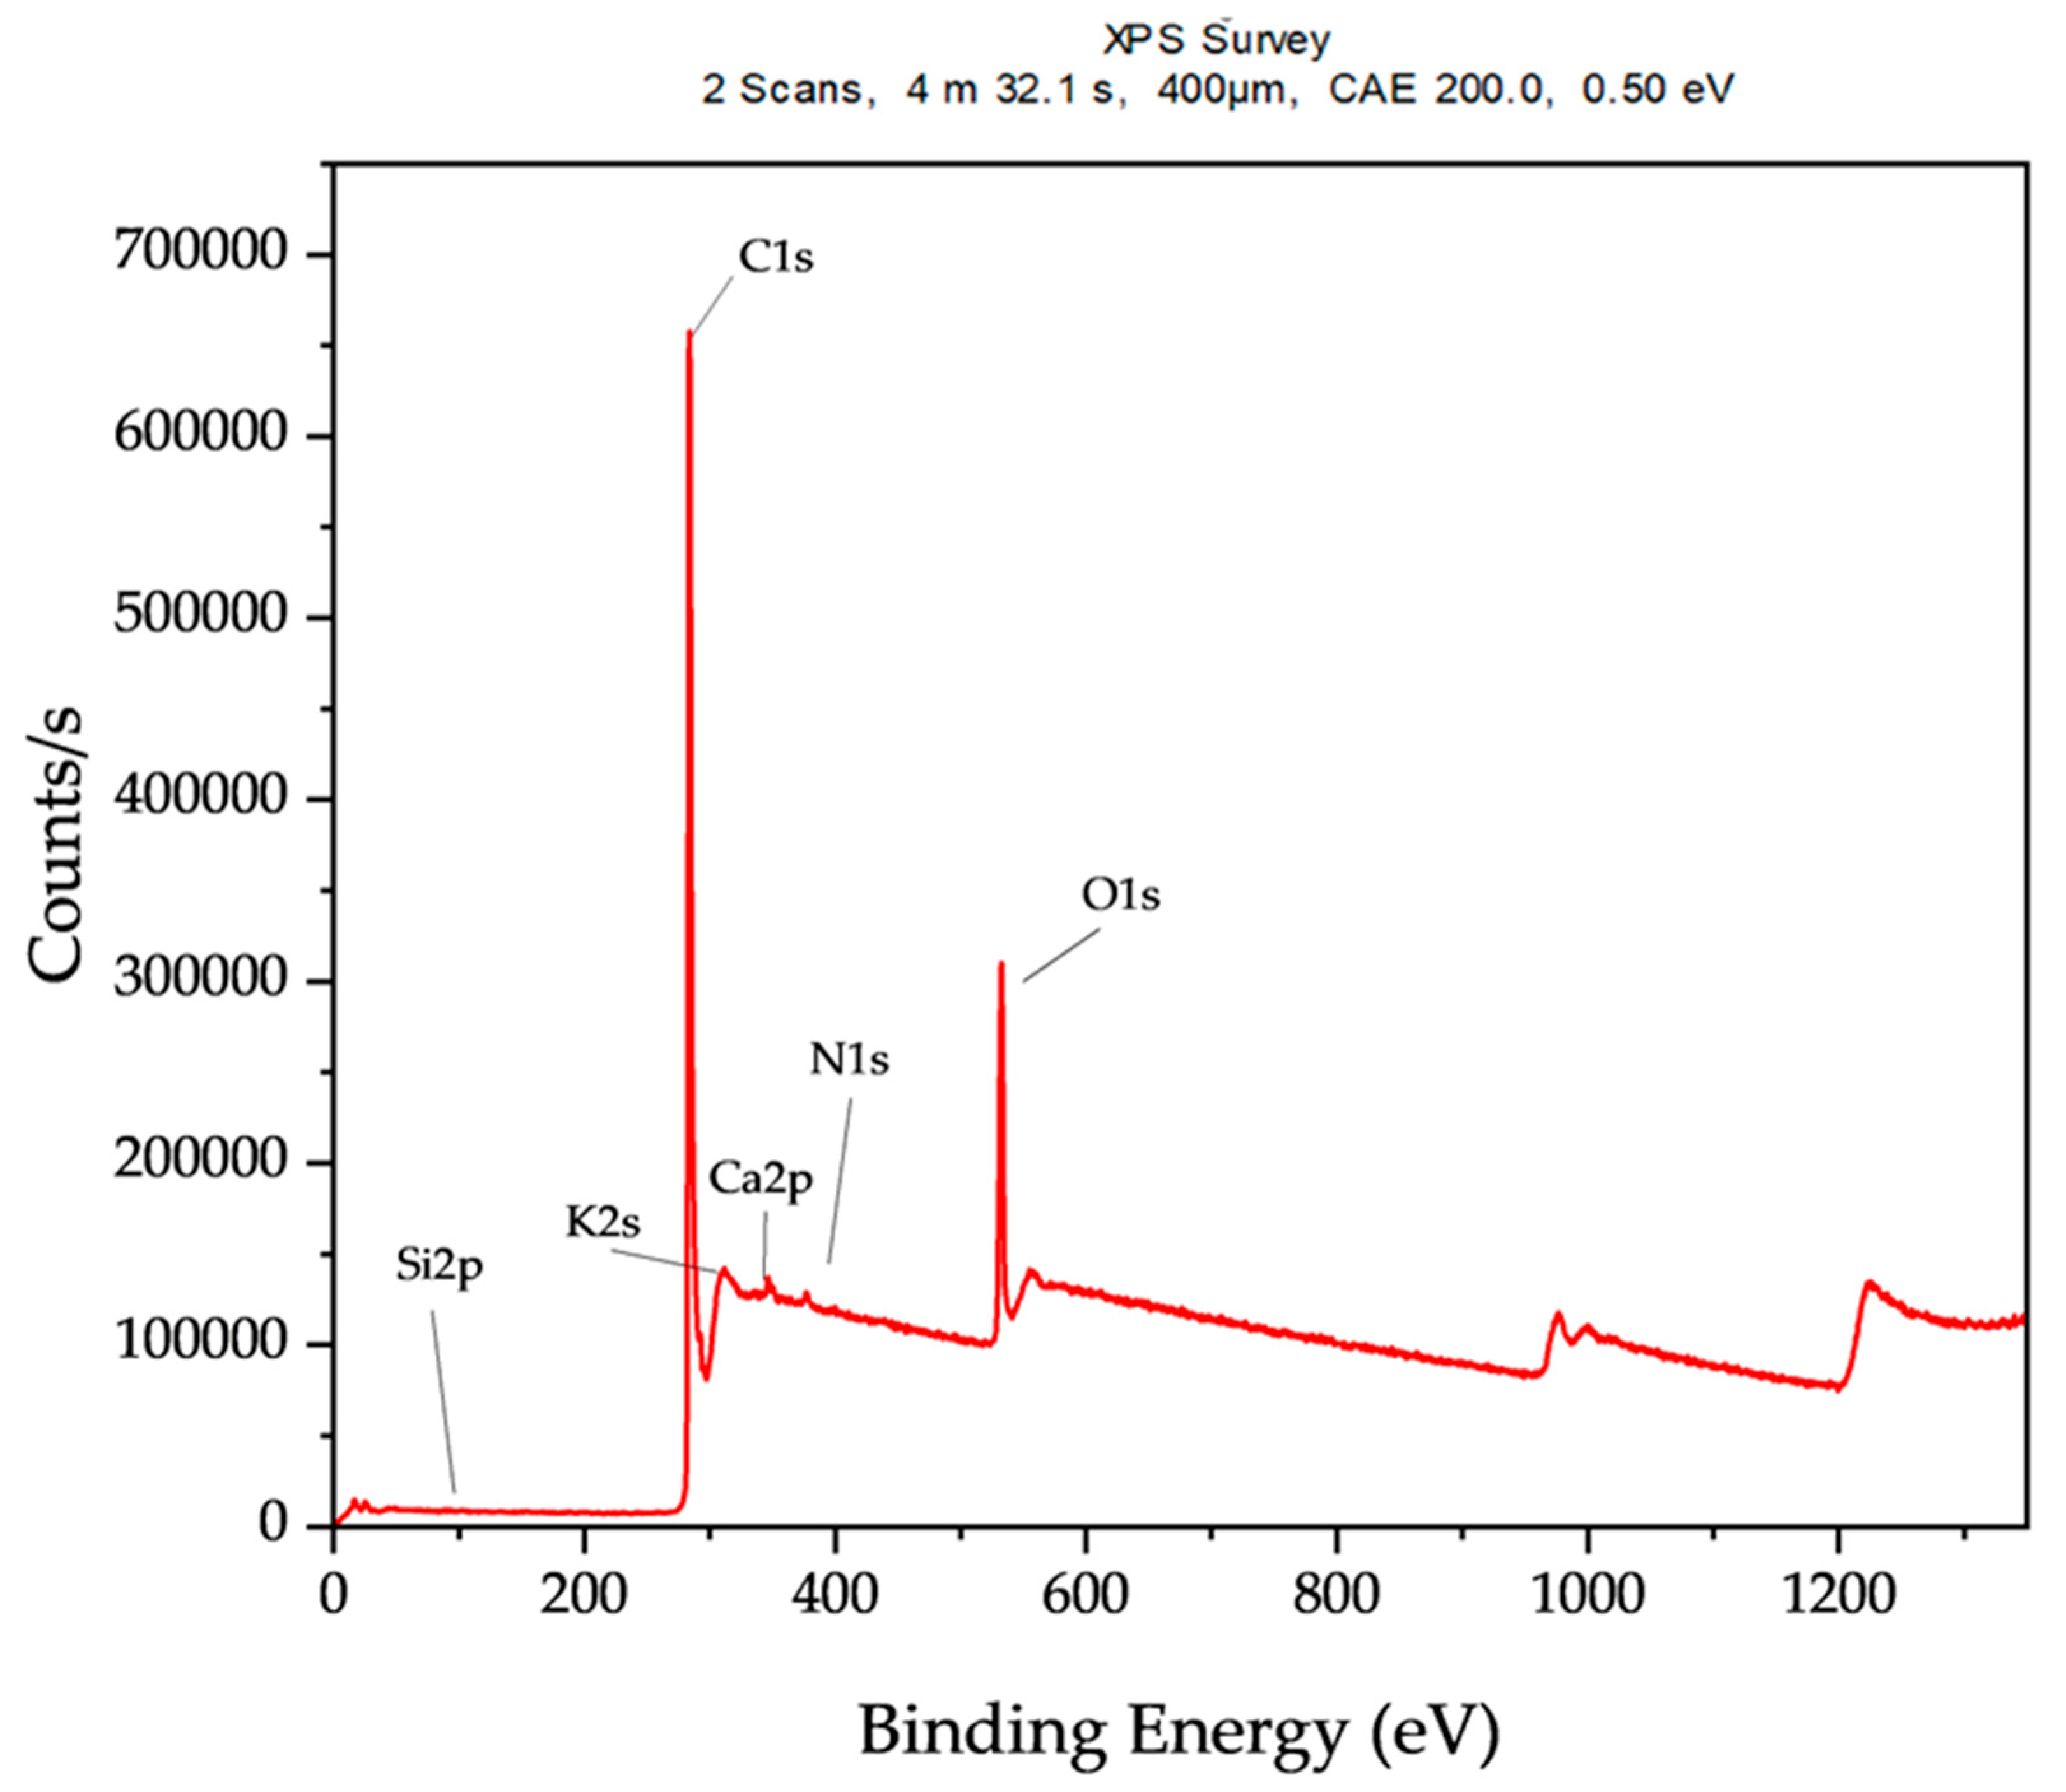
Figure 7 shows the XPS survey of the oak biochar [
38,
39]. Similarly,
Table 3 presents a summary of the elements present on the surface of the oak biochar.
The high amount of carbon elements (81.07%) on the surface is typical for carbonaceous material like biochar, and it further suggests a high degree of carbonization during the gasification at 850 °C. The second most abundant element, oxygen, indicates significant surface oxidation and the presence of several oxygen-containing functional groups, such as carbonyl, hydroxyl, and carboxyl. The presence of nitrogen suggests the indication of amino groups, while the small concentrations of potassium and calcium, in trace quantities, are indicative of plant-based feedstock. Silicon is mostly inherent in biomass.
Studies by Chen [
40] and Nzediegwu [
41] demonstrated the surface quantification of biochar using the XPS methodology. Their results reflect the capability of XPS to evaluate the elemental chemical composition, surface oxidation, and functional groups that are present on the biochar’s surface, which are valuable in assessing the physiochemical properties of oak biochar.
The oak biochar sample shows a significantly high carbon content, a substantial amount of oxygen, and trace amounts of potassium (K), calcium (Ca), and silicon. The high carbon content and reduced oxygen levels indicate that gasification at 850 °C has produced highly carbonized and aromatized biochar. This composition suggests promising potential for carbon sequestration and soil enhancement, with some ability to retain nutrients due to the presence of minerals such as potassium and calcium. Similarly, Mobarak et al. comprehensively characterized biochar derived from rubber seed shells via pyrolysis. One of their characterizing techniques was XPS; their findings align closely with the composition of the studied oak biochar [
30].
3.5. CHN and Ultimate Elemental Analysis for Biochar Characterization
CHN analysis using a LECO Instrument is a widely employed method for the evaluation and quantification of elemental composition, including carbon (C), hydrogen (H), and nitrogen (N). It is a combustion-based method that provides accurate and reliable quantification. See
Table 4 for the results for the oak biochar.
The CHN analysis and elemental composition show the high carbonization of the oak biochar at 78.7%, with low hydrogen and nitrogen contents at 2.43% and 0.182%, respectively. The high carbon content suggests excellent potential for carbon sequestration and soil amendment applications.
The ultimate analysis is a chemical analysis that evaluates and provides important insights into the elemental composition of a material. This analysis finds applications in fuel quality assessment, material characterization, and environmental compliance. The following elements are evaluated in weight percentage during ultimate analysis: carbon (C), hydrogen (H), nitrogen (N), and oxygen (O)—calculated by difference, subtracting other measured elements from 100% [
42,
43].
Table 4 shows the ultimate analysis of the oak biochar.
It is worth noting that, the variation in the results by XPS and CHN analysis is due to XPS emphasizing the surface elemental composition rather than the bulk composition evaluated by the CHN analysis (ultimate analysis); see also the studies by Chen and Nzediegwu [
40,
41].
Oxygen–Carbon (O/C) Ratio, Hydrogen–Carbon (H/C) Ratio, and Carbon–Nitrogen C/N Ratio
Oak biochar has significant carbon and other elemental compositions. The oxygen–carbon molar ratio O/C, the hydrogen–carbon molar ratio H/C, and the carbon–nitrogen molar ratio C/N are valuable tools and analyses used to indicate the potential applications of biochar and its soil amendment qualities. The O/C ratio is used to predict biochar stability in soil [
44]. A lower O/C ratio is indicative of a more carbonized structure with thermal stability; a biochar with an O/C < 0.2 is considered and classified as highly carbonized and exhibits resistance to degradation; it also suggests resistance to microbial degradation; it also suggests it has the structural integrity to maintain its chemical structure over a long time. Furthermore, the low oxygen content indicates and reflects the extent of oxidation and carbonization during the thermochemical process—as a lower oxygen content suggests low polarity and a reduced affinity for water, making the biochar more applicable in hydrophobic applications [
45].
The H/C ratio is used to determine the aromaticity of biochar and its potential for mineralization. A value below 0.7 reflects a highly aromatic structure and is an indication that the biochar has undergone significant thermal decomposition; it also suggests that the biochar contains a low volatile matter content and is suitable for soil amendment.
Finally, the C/N ratio is used to analyze the potential for the mobilization of nutrients and mineralization; a very high C/N ratio suggests a low nitrogen content and is an indication that the biochar will not provide a significant nitrogen source but could provide water retention and improve microbial activity and soil structure [
1]. Studies by Spokas [
44], Lehmann and Joseph [
45], Schmidt and Noack [
46], and Keiluweit et al. [
47] detailed the stability and degradation of biochar in soil and how its composition influences these processes.
Table 5 shows a summary of the elemental ratios of oak biochar.
The low amount of oxygen reliably shows that the oak biochar has a very reduced functional group, which results from high-temperature gasification. An O/C ratio of 0.178 indicates the high carbonization of the biochar. A H/C ratio of 0.368 reveals a high degree of aromaticity and carbonization, indicating the biochar’s very high stability. The high C/N ratio indicates a very low nitrogen content, which is essential for soil and plant growth. Oak biochar is likely to cause significant nitrogen immobilization. Overall, oak biochar is highly carbonized, stable, and resistant to decomposition, as seen in the TGA results, see
Section 3.3. These findings confirm the potential applications of biochar for carbon sequestration and soil amendment [
40,
48].
3.6. Functional Group Identification via Fourier Transform Infrared Spectroscopy (FTIR)
Fourier transform infrared spectroscopy (FTIR) was used to analyze the surface functional groups and structural properties of oak biochar. This technique provides crucial information about the chemical composition of the oak biochar sample [
4,
49,
50].
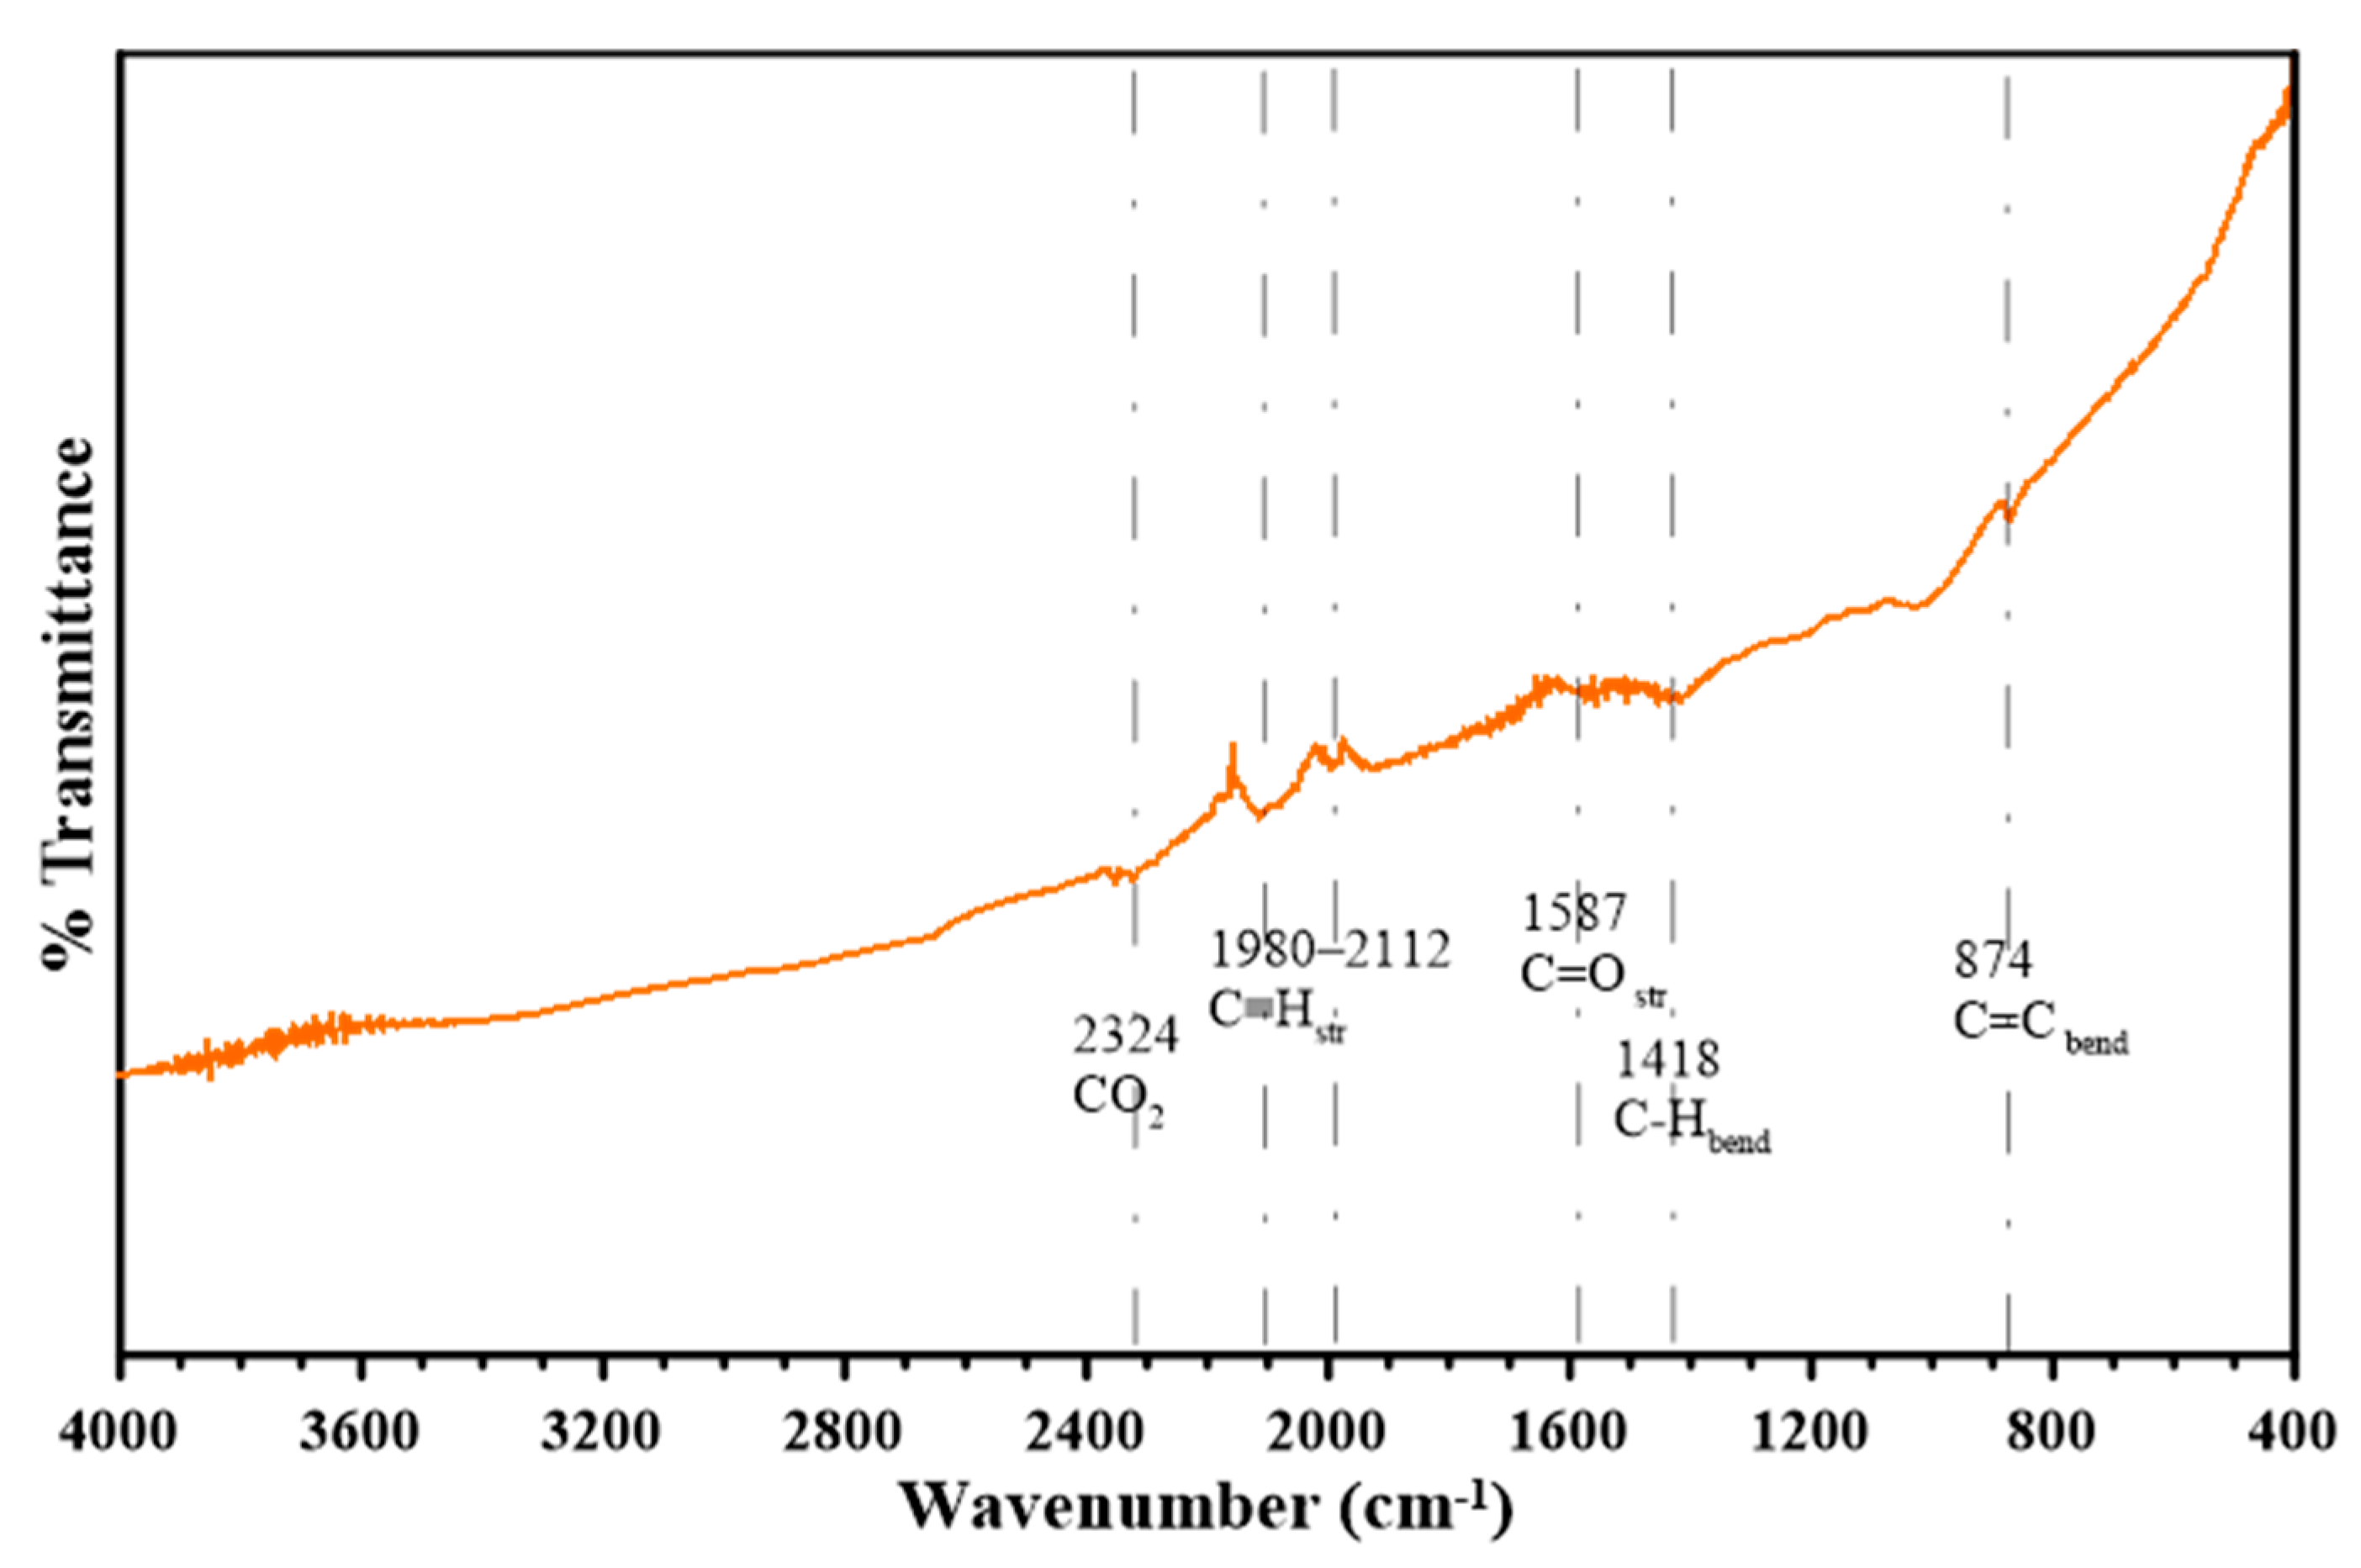
Figure 8 shows the FTIR analysis of the oak biochar, and the various surface functional groups present in it.
The peak at 2324 cm−1 is associated with CO2, and the range of peaks from 1980 cm−1 to 2112 cm−1 is associated with the presence of triple-bonded alkynes or nitrile groups (C≡N). The C=C stretching and C=O stretching vibrations in conjugated ketones and quinones occurring at peak 1587 cm−1 are other signs that the oak biochar is aromatic. Similarly, the peak at 1418 cm−1 is associated with aromatic C=C rings and C-H bending in alkanes. Furthermore, the peak at 874 cm−1 is attributed to aromatic C-H bonds, confirming the presence of an aromatic structure in the oak biochar.
Overall, the presence of peaks at 1587 cm
−1,1418 cm
−1, and 874 cm
−1 indicates high-temperature gasification and confirms the presence of aromatic functional groups in the oak biochar (see its H/C ratio) [
51]. Finally, the presence of a 2324 cm
−1 peak indicates the potential for CO
2 adsorption applications.
The FTIR examination of the oak-derived biochar, created at temperatures reaching 850 °C, reflects a significant increase in aromatic bonding. This process results in a durable, carbon-rich material with enhanced aromatic characteristics. The comprehensive chemical evaluation provides a crucial understanding of the biochar’s structural integrity, its capacity to attract and hold contaminants, and its performance in electrochemical contexts. These factors are essential when considering its potential uses in environmental remediation and energy-related applications. Moreover, the detection of specific functional groups associated with carbon dioxide suggests that this oak-based biochar could play a role in capturing and storing CO
2, as supported by other results in this study, highlighting its possible contribution to sustainable carbon management strategies [
48,
52].
3.7. Raman Spectroscopic Characterization of Carbon Structure in Oak Biochar
Raman spectroscopy analysis is a nondestructive technique that provides structural analysis and carbon chemistry by employing inelastic light scattering to evaluate the rotational and vibrational energy levels of molecules [
53]. Analysis of D and G bands can provide valuable information about the graphitization and defects in biochar samples.
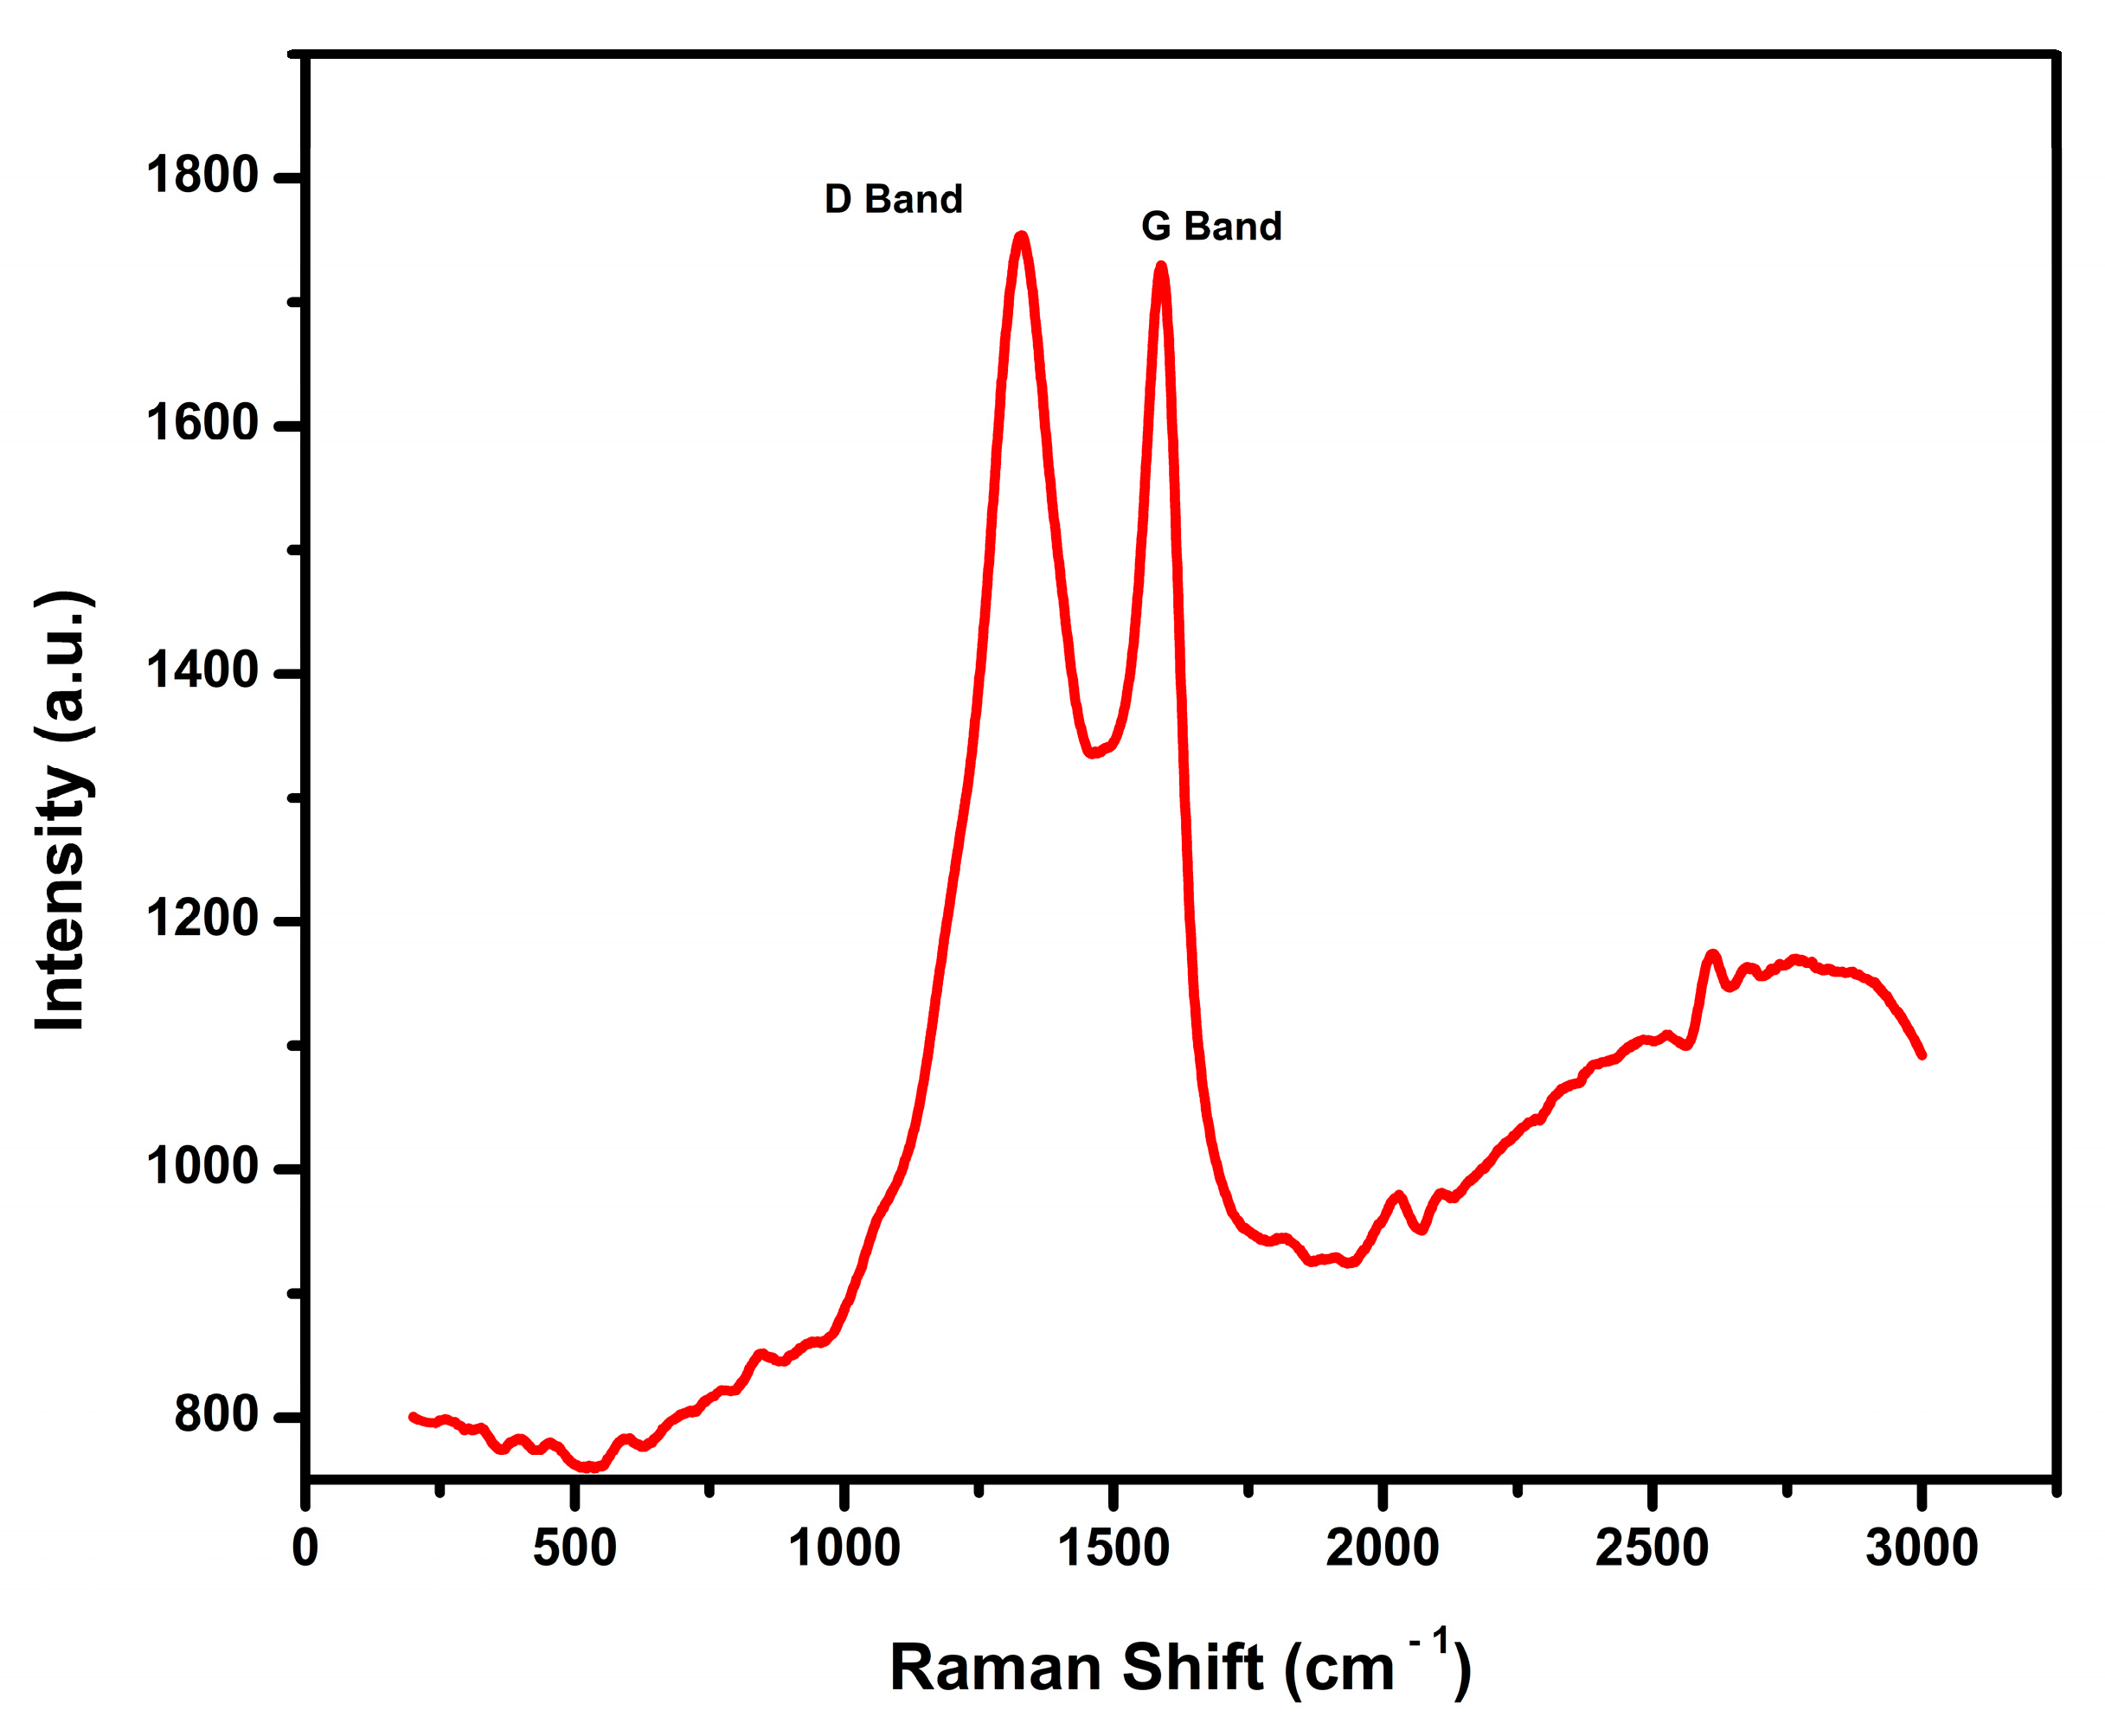
Figure 9 shows the Raman spectra graph, which is a plot of intensity (a.u.) and the Raman shift in cm
−1 for the oak biochar.
The Raman spectra exhibit two prominent D peaks at 1328 cm
−1 and a G band at 1587 cm
−1 with intensities of 1750 and 1720, respectively, which are typical of biochar. The D band is uniquely associated with defects and structural disorders. The presence of the D and G bands indicates that the oak biochar contains a mixture of amorphous and crystalline carbon structures [
53,
54,
55].
Further analysis of the I
D/I
G ratio can be used to evaluate the structural properties; a lower ID/IG ratio suggests a more ordered graphitic structure, while a higher ratio is indicative of an amorphous nature and disorder.
Figure 9 above shows Raman spectra with an I
D/I
G ratio of 1.017, indicative of a highly disordered biochar with a relatively small crystalline domain. The methodology and evaluation align with the studies reported by Valenga et al. [
56]. In their characterization of biochar produced from sugarcane bagasse, the presence of the D band and the G band was used in analyzing the graphitization and the disorder of their sample for the application and development of an electrochemical sensor.
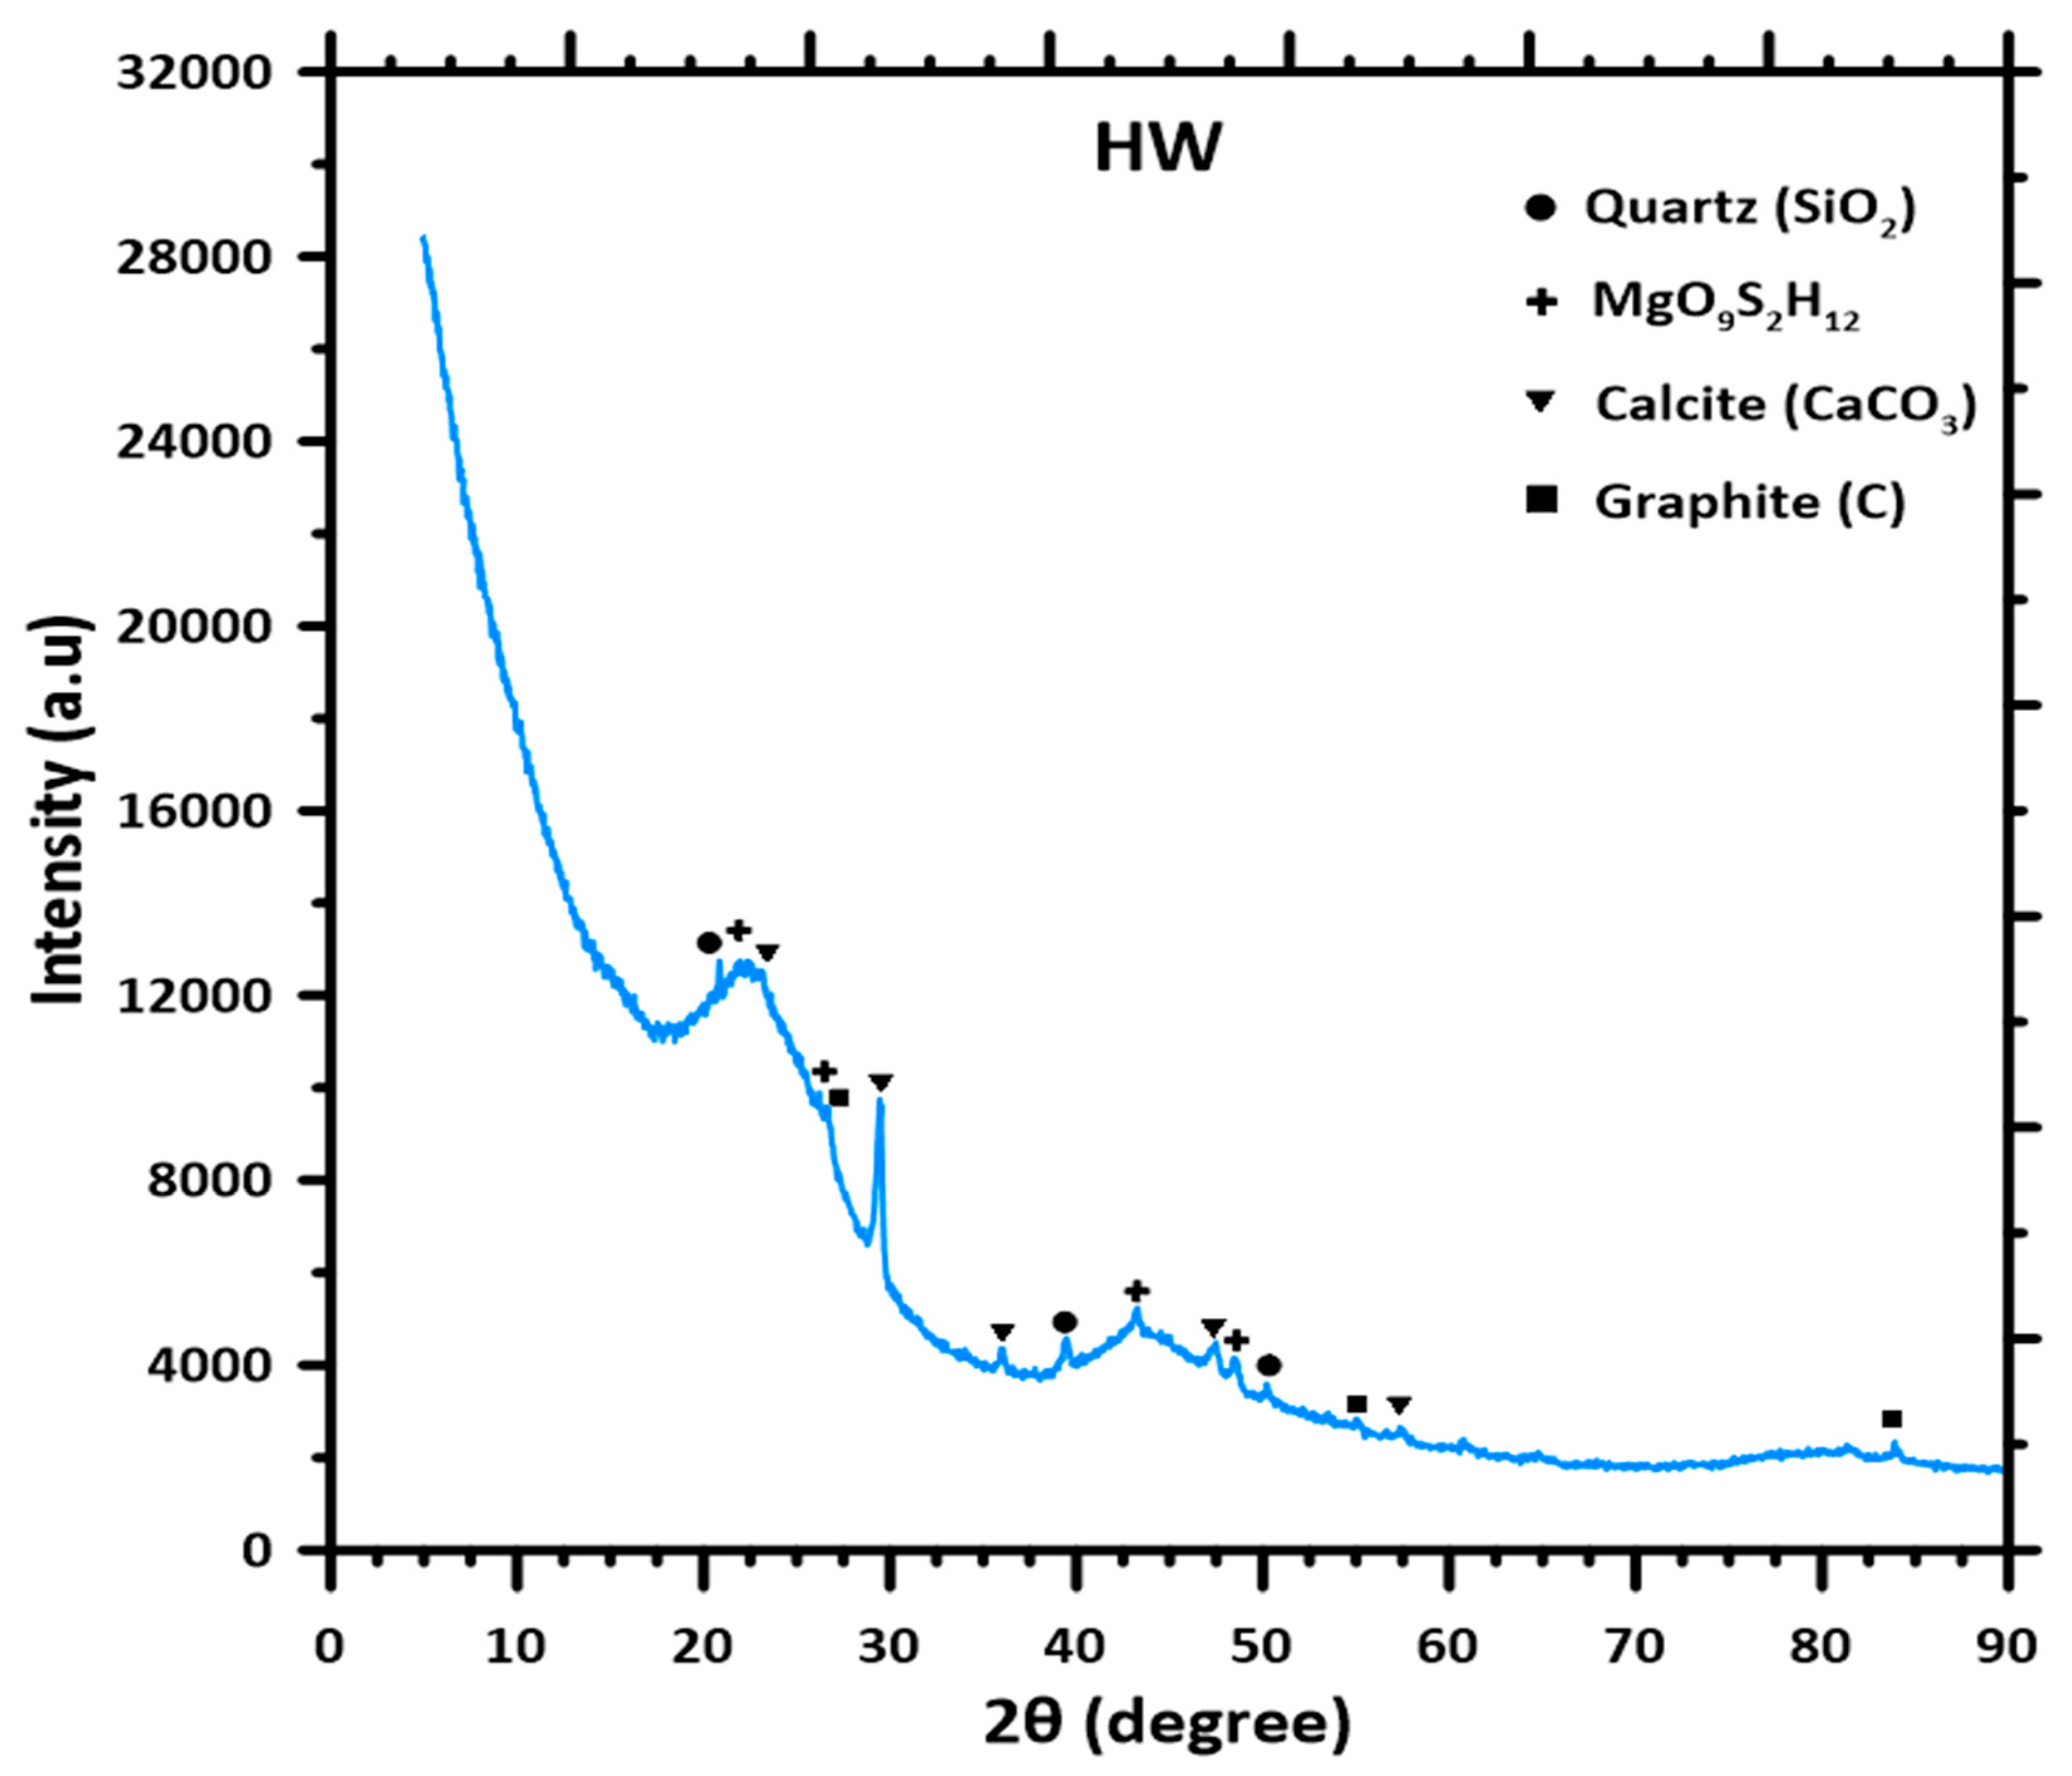
3.8. X-Ray Diffraction (XRD) Analysis of Oak Biochar
The XRD of the oak biochar sample is shown in
Figure 10, and provides a comprehensive overview of the crystal phase present in the sample [
57]. The diffractogram reveals a dominant peak of calcite (CaCO
3).
It reveals the presence of calcite, which is a common mineral found in biomass gasification because of the inorganic constituents of biomass and the interaction with atmospheric Co
2 during the thermochemical process. There is also a peak identified as the presence of quartz, which is also inherent in plant-based feedstocks [
58].
Graphite and MgO
9S
2H
12 are present in trace quantities. The presence of graphite is an indication of the partial graphitization of the carbonaceous matrix under high-temperature gasification conditions [
59]. The identification of a complex magnesium compound, MgO
9S
2H
12, within the biochar structure reflects the preservation of trace inorganic components, likely stemming from the original plant material’s mineral content [
13].
Insights into the chemical composition are valuable in terms of predicting how the oak-derived biochar will perform in several applications. Its electrochemical properties, surface interactions, and long-term stability are all influenced by these molecular arrangements. This knowledge is particularly relevant when considering the material for use in advanced technologies like eco-friendly electrodes, catalytic systems, or as a soil enhancer in agriculture.
The presence of magnesium compounds, calcite, and quartz in biochar has been reported in studies by Mujtaba et al. [
58]. Also, studies by Muigai et al. included comparative studies and the characterization of lignocellulosic biomass, and reported SiO
2 using the XRD methodology [
60]. Furthermore, Sahoo et al., in their investigation of the production and characterization of biochar produced from the slow pyrolysis of pigeon stalk and bamboo, reported the presence of magnesium, calcite, and quartz peaks in their XRD analysis [
61].
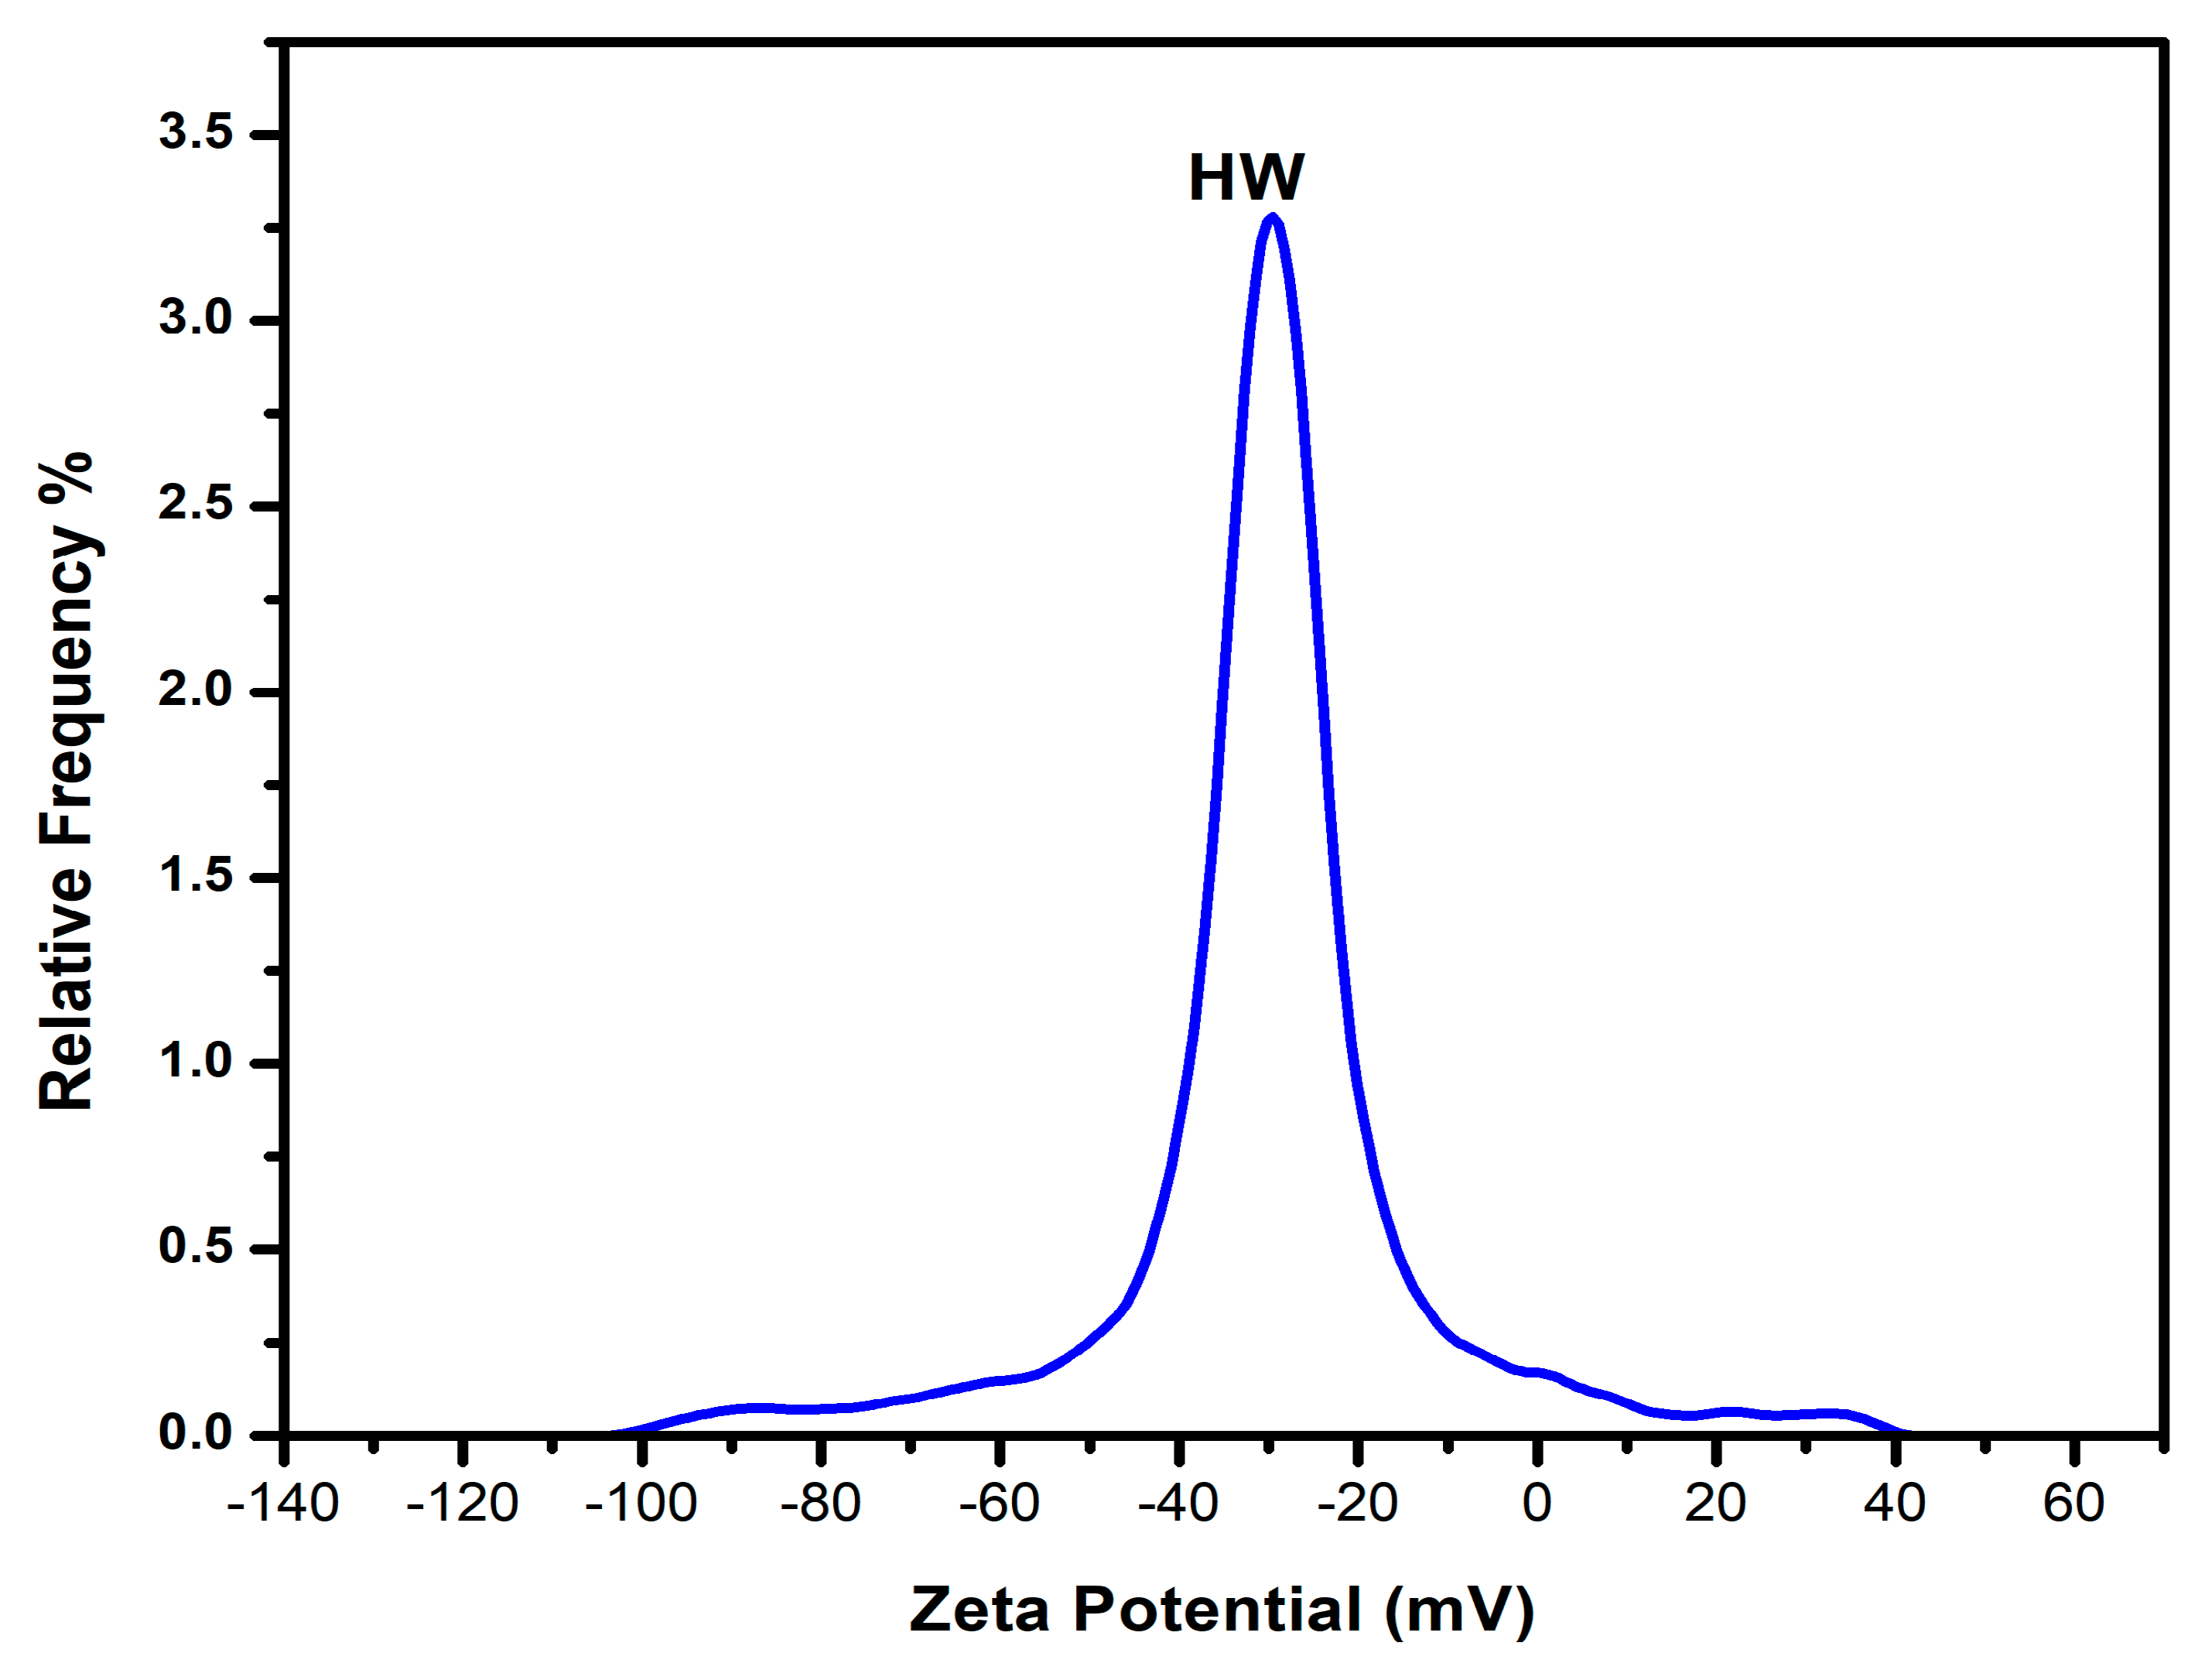
3.9. Analysis of Mean Zeta Potential, Electrophoretic Mobility, Conductivity, and pH of Oak Biochar
The zeta potential, electrical conductivity, electrophoretic mobility, and pH are properties of biochar that effectively influence its applications. The zeta potential of biochar represents its surface charge in a solution. Biochar generally displays negative zeta potential values over a broad pH range, reflecting the presence of negative surface charges. As the pH increases, the zeta potential becomes more negative, primarily due to the adsorption of hydroxide ions (OH⁻) and other anions onto the biochar surface. This property is closely linked to biochar’s capacity for immobilizing heavy metals and retaining water. The zeta potential of the biochar surface is a product of the electronegativity strength and stabilizing performance of biochar that is colloidal in soil [
62,
63]. The study analyzes the movement of biochar under an electric field—its electrophoretic mobility. A plot of relative frequency and zeta potential is shown in
Figure 11.
Below is
Table 6, showing the results of the mean zeta potential, electrical conductivity, pH, and electrophoretic mobility of oak biochar.
A mean zeta potential of 31.5 mV shows that the oak biochar is colloidally stable. This is because the particles are strongly electrostatically repelling each other, which prevents aggregation and agglomeration. The strong mean zeta potential also infers that the oak biochar can attract or absorb positively charged particles in the soil, which is an excellent quality for soil amendment. Similarly, the electrical conductivity results of 113 μS/cm further reveal the presence of dissolved ions in the oak biochar suspension [
64]. The negative mean zeta potential of the oak biochar was measured to be −2.4567 μm.cm/V.s and fits well with the results of the electrophoretic mobility test. This means that the biochar has a good surface charge density.
Finally, the oak biochar shows a high negative surface charge with a pH value of 10.10—another confirmatory factor of the high negative mean zeta potential. The collective results show the potential for soil amendment in acidic soils, electron transfer during soil amendment, and heavy metal immobilization.
5. Conclusions
This comprehensive study provides an in-depth characterization of oak biochar produced via downdraft gasification at 850 °C, offering valuable insights into its physical, chemical, and structural properties and potential applications. By utilizing advanced analytical techniques such as SEM, BET, TGA, XPS, FTIR, and zeta potential analysis, the research highlights the biochar’s mesoporous structure (88.97 m2/g surface area), high carbon content (78.7%), and excellent thermal stability. The low O/C and H/C ratios confirm a high degree of carbonization and aromaticity, while the presence of specific functional groups suggests potential for CO2 adsorption. The negative zeta potential (−31.5 mV) indicates colloidal stability, reinforcing its suitability for soil amendment applications.
The findings demonstrate the biochar’s effectiveness in enhancing soil properties, particularly through improved water retention, microbial activity support, and pH balancing for acidic soils. Its ability to immobilize heavy metals and other pollutants underscores its potential for wastewater treatment and environmental remediation. Furthermore, its high carbon stability highlights its role in long-term carbon sequestration, offering a viable strategy for mitigating climate change. Beyond environmental applications, the biochar’s structural and chemical properties suggest promising roles in energy storage and catalytic processes, broadening its utility in industrial applications.
The electrochemical and adsorption properties of the oak biochar suggest its potential roles in carbon capture, wastewater treatment, and energy storage applications. Its ability to retain nutrients and stabilize soil pH further supports its use in agricultural systems. Compared to other biochar types, the controlled gasification process ensures minimal tar formation and a well-defined pore structure, improving consistency and application versatility.
To maximize its practical benefits, future research should focus on optimizing gasification conditions, tailoring biochar properties for specific applications, and conducting long-term field studies to evaluate its stability and interactions in various environments. Further modifications, such as surface functionalization, could enhance its reactivity and broaden its applications in catalysis, electrochemistry, and advanced material synthesis. Economic and life cycle assessments will also be crucial in determining the feasibility of large-scale biochar production. By addressing these areas, oak biochar can be further developed as a sustainable material with significant environmental and industrial benefits.


 ,
, 


