1. Introduction
Direct ethanol-based, high temperature proton exchange membrane (PEM) fuel cells are considered as a promising alternative energy generating system because of the available infrastructure and supply chain facilities for ethanol [
1,
2,
3]. In addition, ethanol has a higher volumetric energy density than hydrogen and methanol [
4]. It is less toxic, less volatile, has low catalyst poisoning by strongly absorbed intermediate products, and has a lower crossover rate compared to methanol [
4,
5]. Thus, the performance of direct ethanol fuel cells can be higher than the methanol-based fuel cell [
3]. However, a main drawback of ethanol fuel cells is the slow reaction kinetics, which is due to the difficulties of breaking the C-C bond [
1,
6,
7]. As such, instead of forming carbon dioxide (CO
2), other intermediate products like acetaldehyde, acetic acid, and methane are formed along with CO
2 [
7,
8]. The complete reaction of ethanol would produce CO
2 as the only reaction product [
1]. An increase in operating temperature enhances the reaction kinetics and reduces catalyst poisoning [
1].
Most ethanol fuel cell research is focused on low-temperature (LT) operation while the data on high temperature (HT) operation (>100 °C) are more limited. Thus, there is a need for more high temperature studies. Among the high temperature studies, most studies have mainly focused on material development like the membrane and catalyst [
8,
9,
10,
11]. Additionally, a limited number of studies focusing on operating conditions have been conducted [
12,
13] and these have used a serpentine flow field design [
8,
12]. Comparisons between the absolute values of metrics, such as power output, reported by the prior work are difficult due to differences in key factors such as the type of membrane electrode assembly (MEA) (e.g., catalyst type, loading composition, and thickness) and operating conditions; however, peak power outputs between 12 and 30 mW/cm
2 have been reported for HT direct ethanol fuel cells [
12]. The range depends on factors such as the operating temperature and ethanol concentration. Linares et al. reported peak power outputs ranging from 9 to 60 mW/cm
2 for HT direct ethanol fuel cells, which depend on the type of catalysts used in the MEA [
8]. The prior studies investigating operating conditions have shown that fuel cell performance drops significantly at high ethanol concentrations (above 6 M). However, at higher ethanol concentrations, the impact of the concentration (e.g., increasing from 6 M to 9 M) is more significant on the cell performance than cell temperature (e.g., increasing from 150 °C to 165 °C) [
12]. It was also shown that the cell performance increases with an increase in cell temperature from 125 to 200 °C [
13].
High temperature ethanol studies have relied primarily on serpentine flow fields [
12,
13]. Yet, the flow field is one of the essential components of the fuel cells [
14]. A good flow field ensures uniform gas distribution of fuel and air at the catalyst active area, a low pressure drop for transport, provides mechanical support, and ensures high electrical and thermal conductivity [
14]. Prior research on hydrogen-based PEM fuel cells shows that a good flow field pattern causes a significant improvement of the cell performance [
15]. However, the study on different flow field patterns for the direct ethanol-based PEM fuel cells is very limited. There are some studies (experimental and computational) that were mainly performed at low temperatures [
16,
17,
18]. However, the flow distribution mechanism of ethanol in the flow field differs significantly between low and high temperatures because the phase of the ethanol on the anode side depends on whether the cell operating temperature is above or below the ethanol boiling point (78.3 °C) as well as other differences such as the reaction kinetics and diffusion rates.
To address the current gap associated with the performance evaluation of various flow fields at different high temperature operating conditions, a series of experiments were carried out at different operating conditions using various flow fields to identify the best flow field pattern. Four different flow fields were used in this study: a 4-channel serpentine, a 2-channel spiral, a hybrid design (combination of a parallel–serpentine channel), and a dual-triangle sandwich flow field. Since a serpentine design has been used in prior studies of ethanol-based HT-PEM fuel cells, it is used in the present study as a state-of-the-art design, so that the new designs can be compared to it on a consistent basis (e.g., with the same MEA). A combination of direct and alternating current methods was used. The alternating current method is used because it provides information about cell performance without perturbing the system from its equilibrium [
19,
20], and allows for determination of the individual contributions of charge transfer resistance and mass transfer impedance in the gas diffusion and catalyst layer [
19].
2. Experimental Apparatus and Procedure
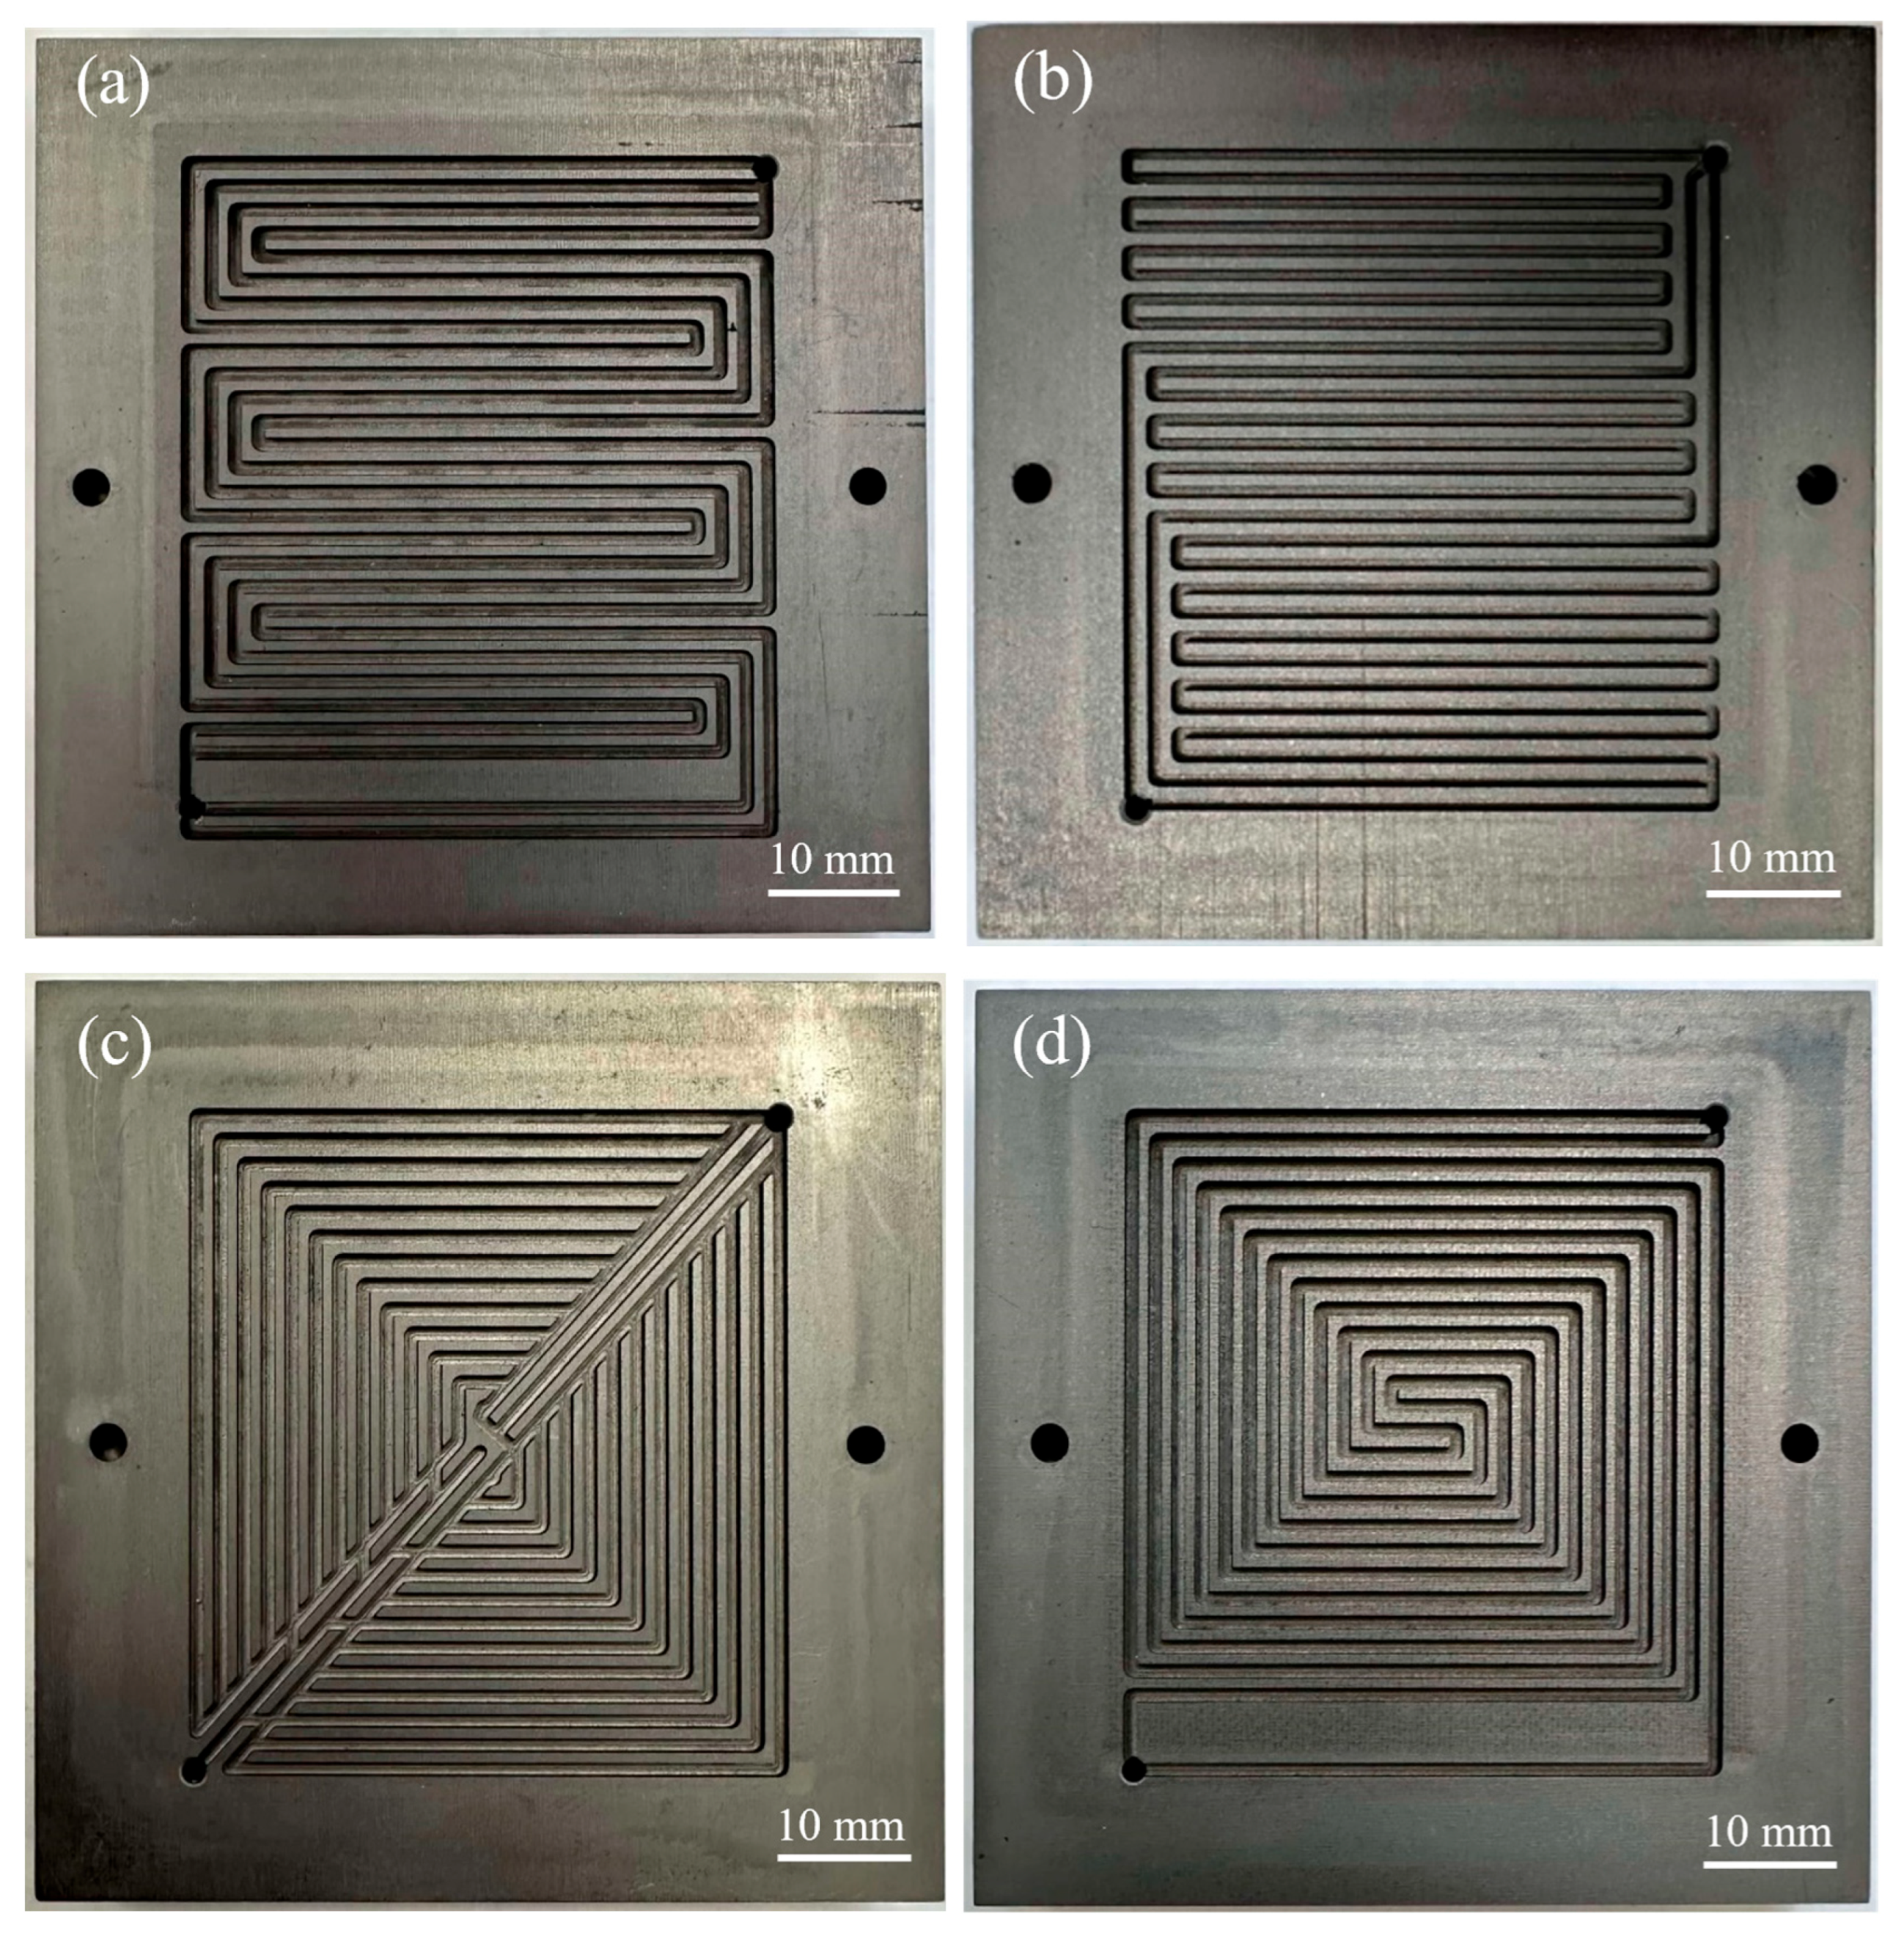
A total of four different flow fields were considered in this study: (1) a 4-channel serpentine, (2) a 2-channel spiral, (3) a hybrid design (a combination of parallel–serpentine design with uniform channel–rib width), and (4) a dual-triangle sandwich shape.
Figure 1 shows the image of these flow field patterns. The 4-channel serpentine flow field is considered state of the art [
21]. The other flow fields were selected based on a prior CFD study, which modeled the flow distribution with air [
22]. In that study, air was modeled because it represents the fluid dynamic behavior on the cathode side. For the current experimental study, the 2-channel spiral design and hybrid design were selected because they provide high mass flux through the GDL [
22]. However, the 2-channel spiral design had the highest predicted pressure drop, while the hybrid design had a lower predicted pressure drop [
22]. The dual-triangle sandwich design was selected because it had the highest predicted level of gas distribution uniformity among all flow fields. All flow fields have a channel width of 1 mm, rib width of 1 mm, and channel depth of 1 mm. The anode and cathode flow field patterns are identical.
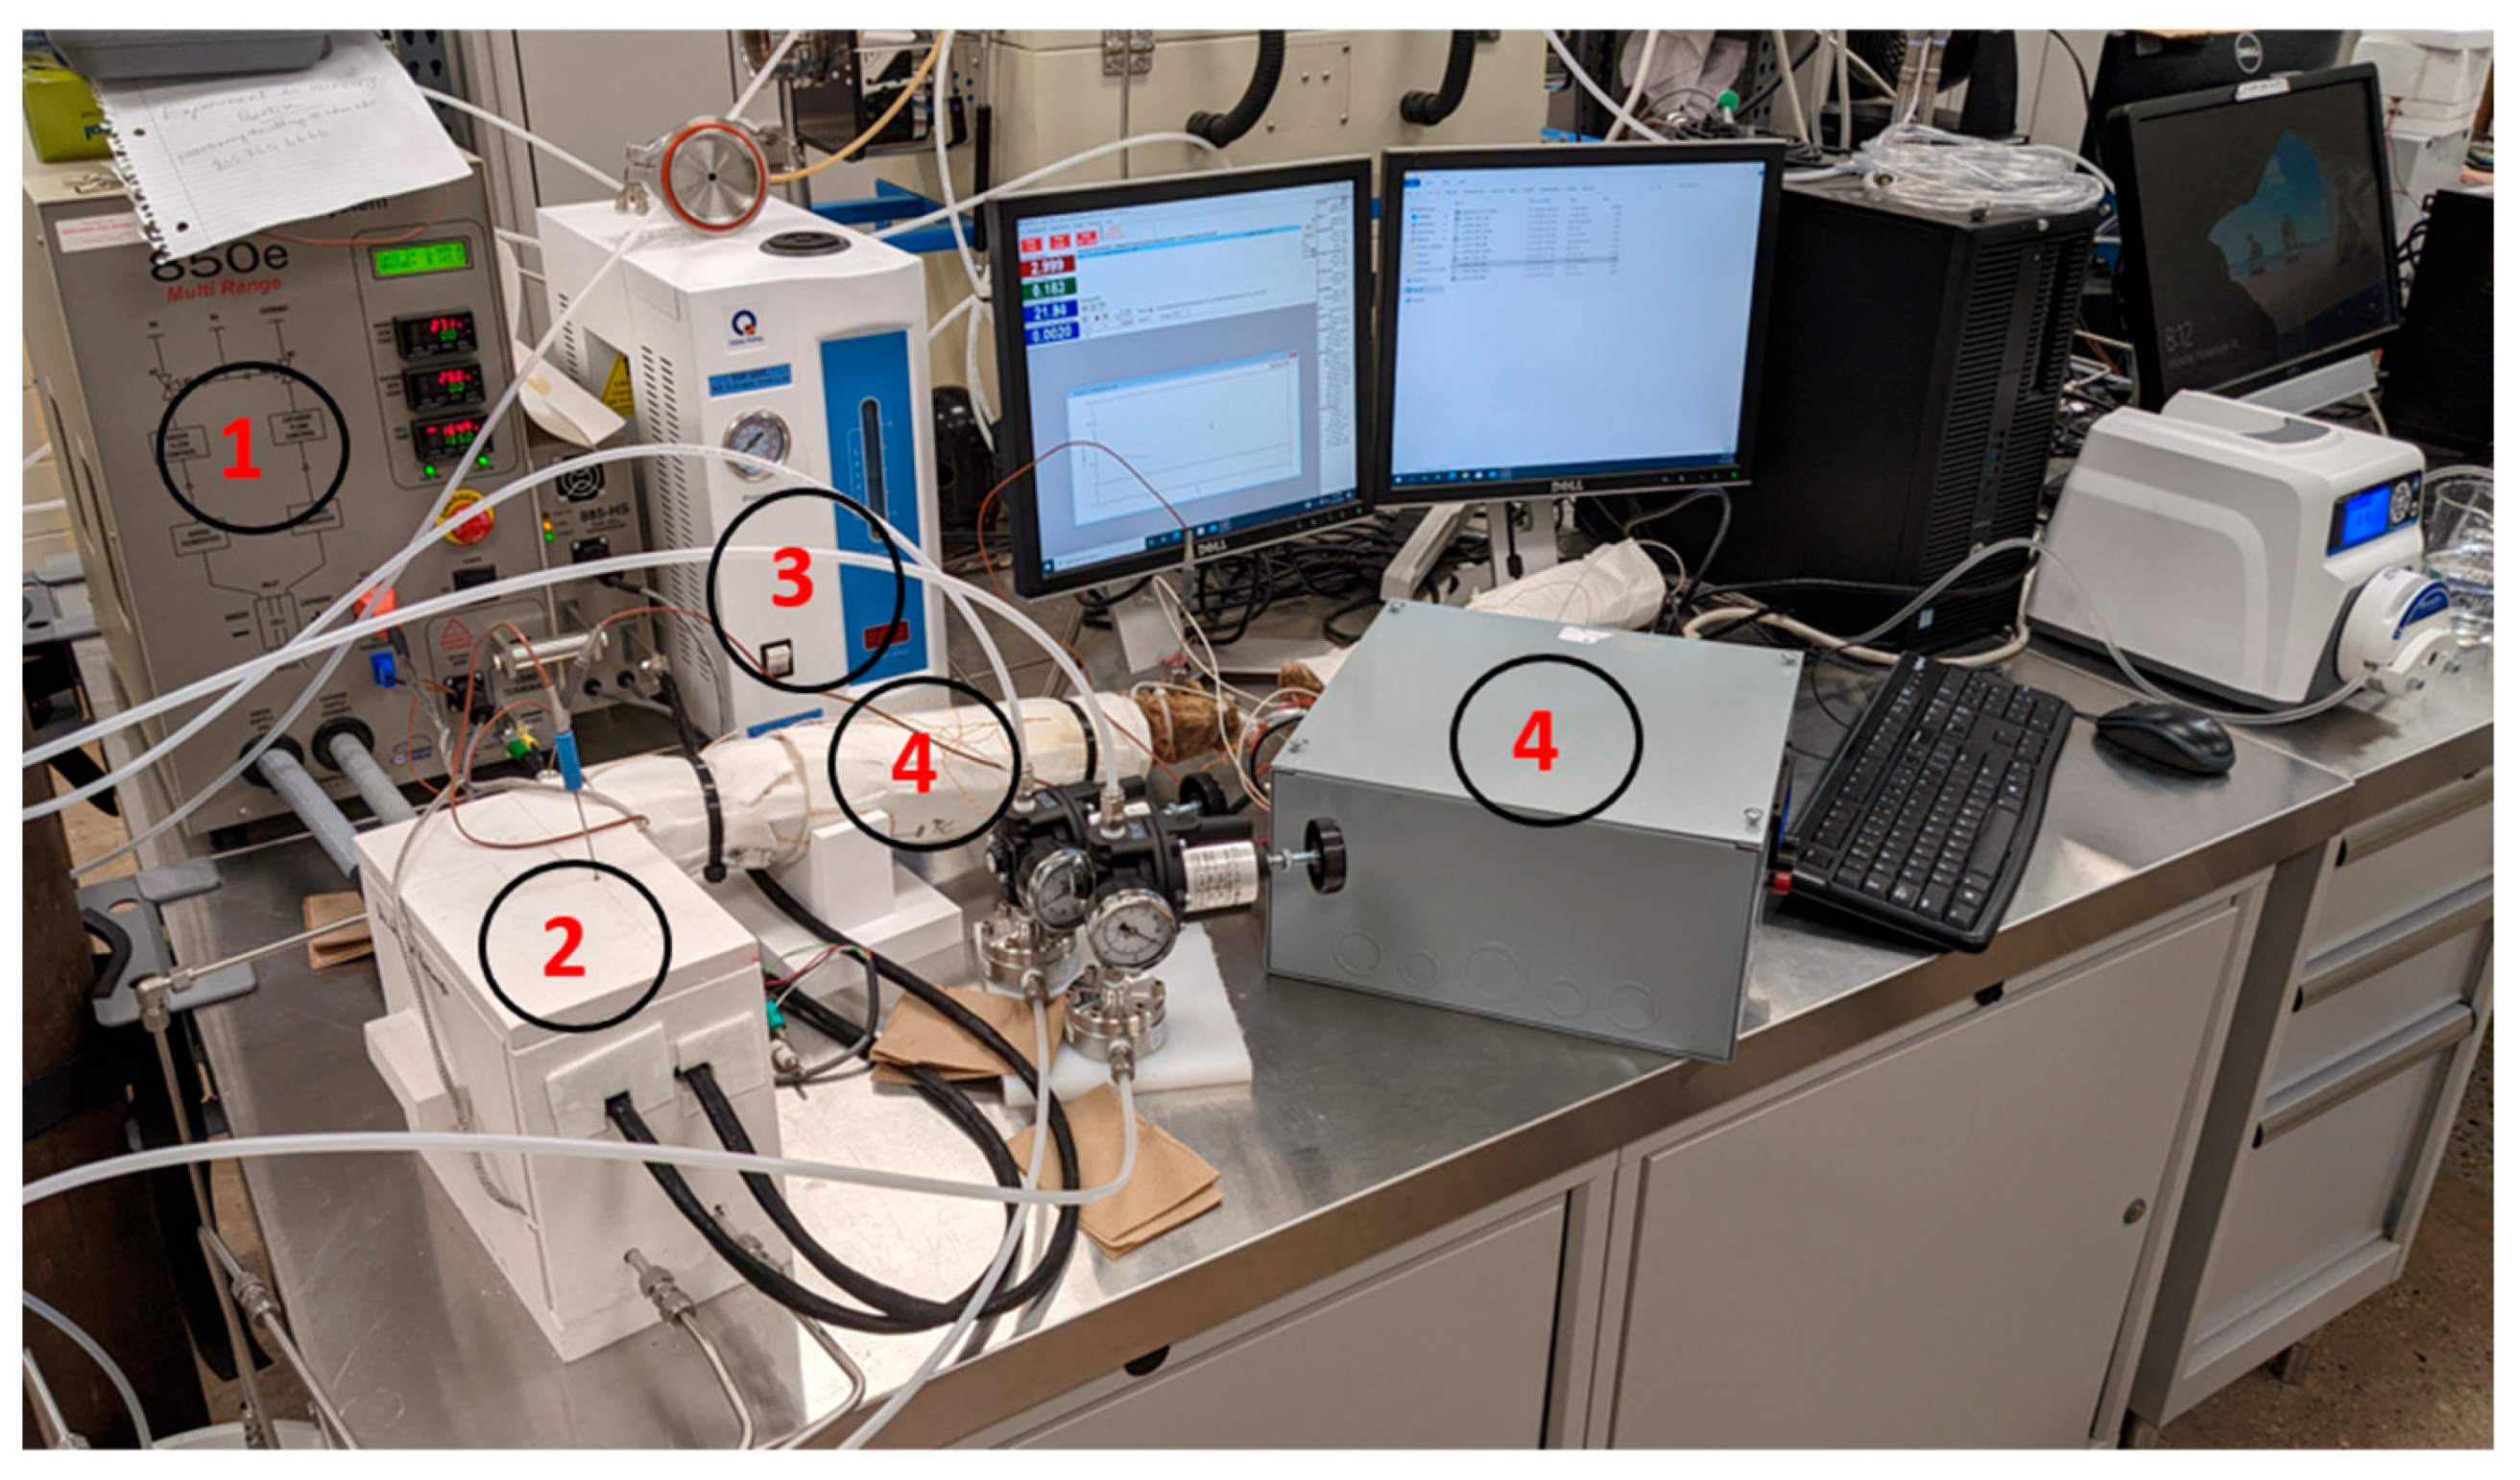
Figure 2 shows the image of the experimental set-up. The experimental set-up consists of a calcium silicate insulation system, vaporizer, and dosing pump (MasterFlex L/S series peristaltic pump, Cole-Parmer Instrument Company, USA). The purpose of using each equipment is explained in detail in the prior work [
12]. Briefly, the insulation helps maintain cell temperature by preventing losses to the environment, the dosing pump provides the flow of liquid ethanol–water mixture, which is then vaporized in an in-house-built vaporizer. The vaporizer provides an inlet flow of fuel, in a vapor state, to the fuel cell at a temperature of ~110 °C.
A Scribner Associated Inc.(USA) fuel cell test fixture with an active area of 25 cm
2 and an 850e fuel cell test system (current: ±0.15 A and voltage: ±3 mV ± 0.3% of reading) were used in this study. A phosphoric acid (PA)-doped PBI-based membrane electrode assembly (MEA), purchased from Advent Technology Inc., Greece, with an active area of 25 cm
2 and a thickness of around ~910 μm was used. A single fuel cell operation was used. For each flow field pattern, the break-in process of MEA was performed as per manufacturer guidelines. The details of the break-in process are given in prior works [
12,
23]. After the break-in process, hydrogen and air supply was stopped, and the fuel cell was purged for 10 min using nitrogen gas. Then, the flow of the vapor ethanol–water mixture was provided to the anode side and air was supplied to the cathode side. The fuel cell was left in open-circuit voltage (OCV) conditions until the cell potential stabilized. Once the voltage was stable, a series of polarization experiments were carried out at the operating conditions shown in
Table 1. The operating conditions were selected based on prior study, where these operating conditions listed in
Table 1 exhibit relatively better performance than other conditions [
12].
Once the polarization experiments were completed, a series of constant current experiments (100 mA/cm
2) were conducted using the combinations of cell temperature, ethanol concentration, and ethanol flow rate given in
Table 1. Initially, the cell was operated at a constant current for 5 min, and then the cell potential was recorded for 30 min operation with a rate of 10 time/point. Then, the data analysis was performed to compare cell potential stability among various flow fields.
The flow field performance was further evaluated using the alternate current method (impedance spectroscopy experiments) for the best operating conditions determined from the polarization experiments. Three different current densities were considered for impedance spectroscopy experiments: (a) 50 mA/cm2, (b) 100 mA/cm2, and (c) 200 mA/cm2. For each test, the AC current amplitude was set to 5% of DC current and the frequency was in the range of 8 kHz–0.1 Hz with 10 steps/decade.
4. Results and Discussion
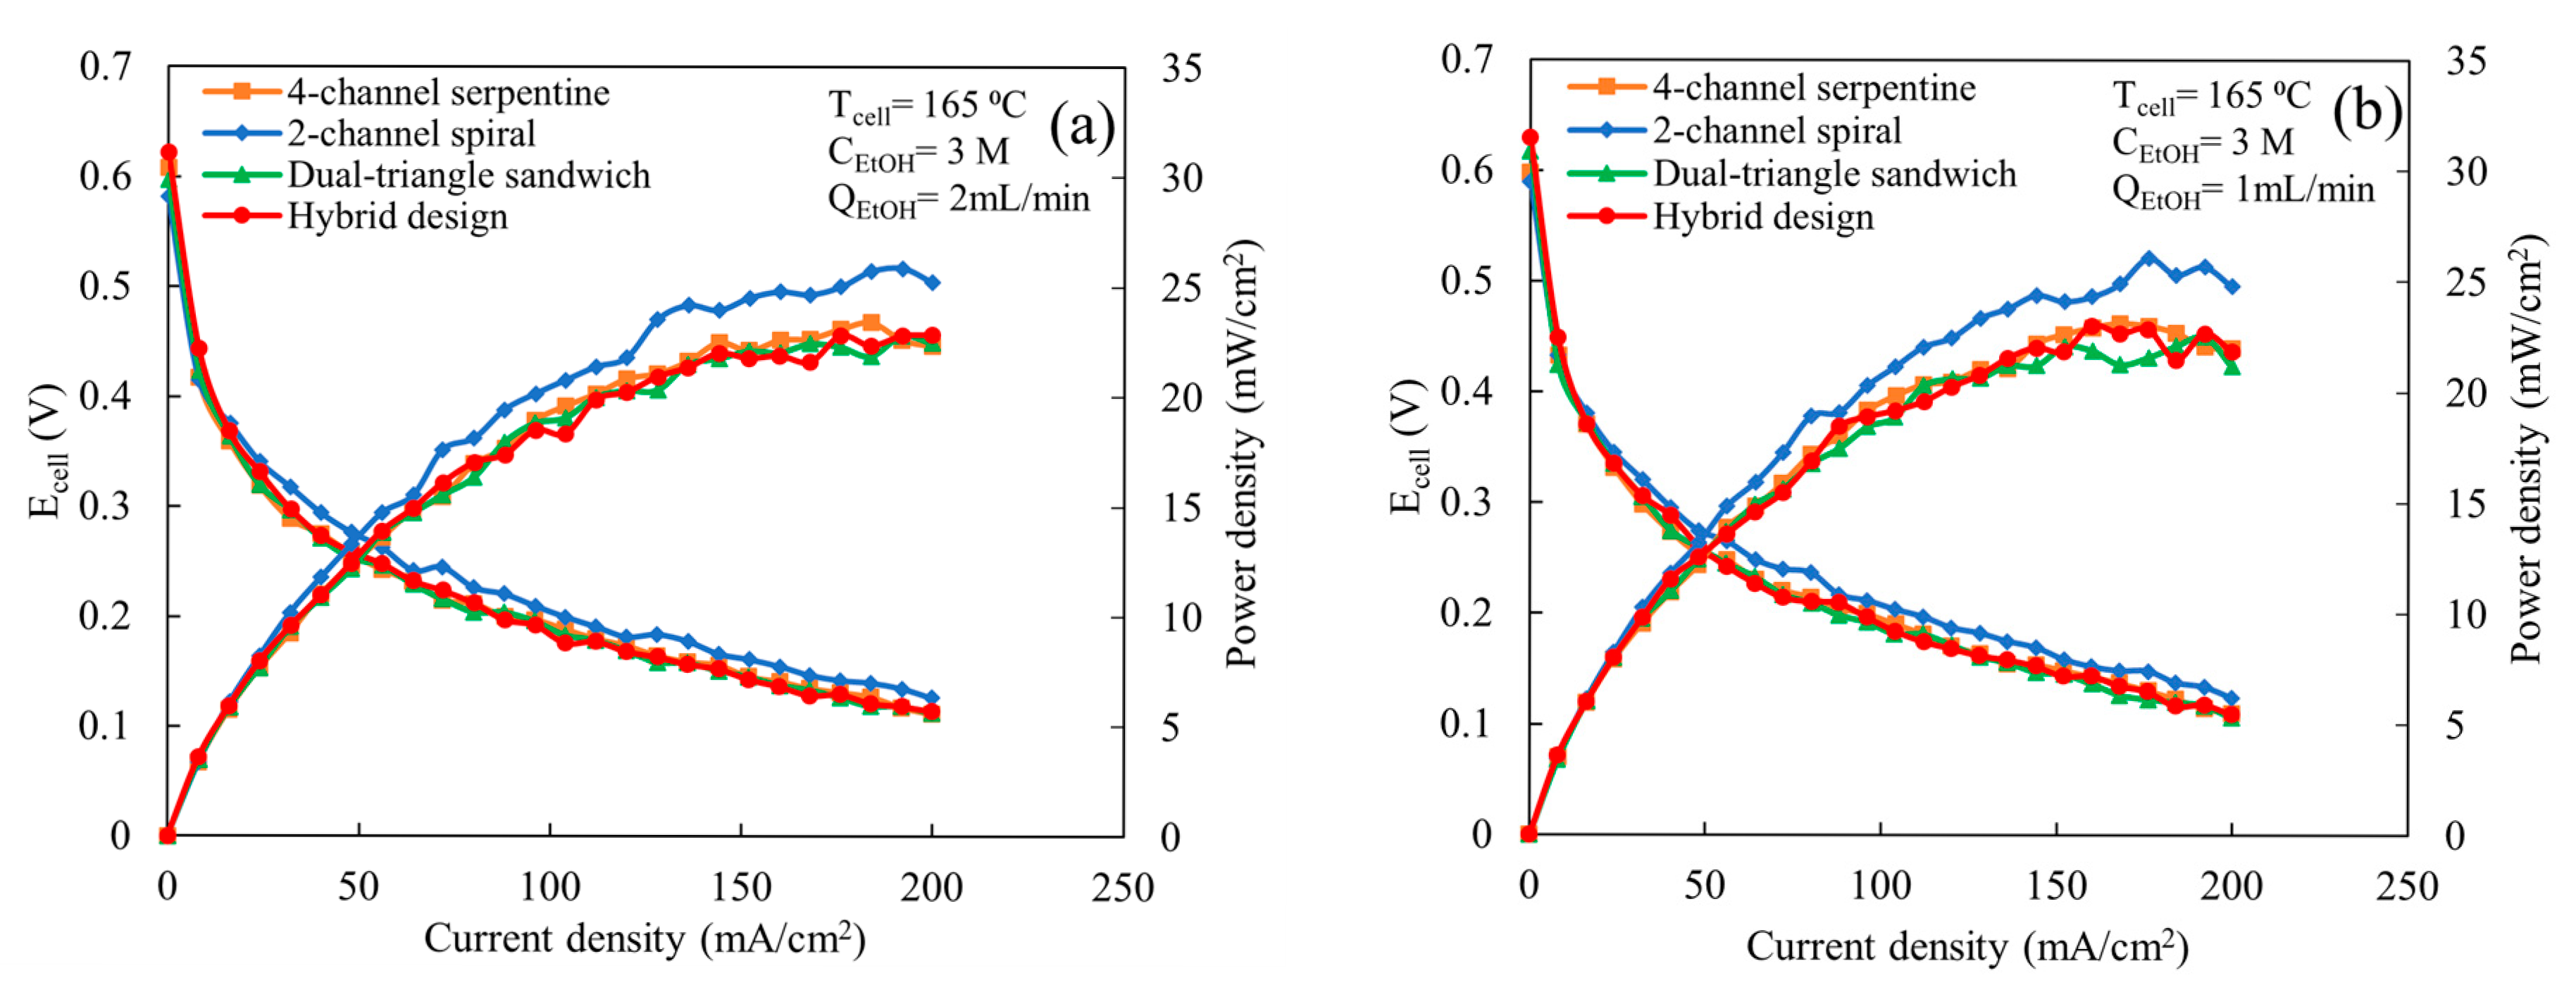
Figure 3 shows the comparison of polarization and power curves among the various flow fields at a cell temperature of 165 °C, ethanol concentration of 3 M, an air flow rate of 2 L/min, and ethanol flow rates of 1 and 2 mL/min. The flow fields exhibit similar trends in cell potential and power output for both ethanol flow rates, e.g., the 2-channel spiral flow field provides the highest maximum power outputs and the other flow fields yield similar maximum power outputs to each other. As shown in
Figure 3a, all flow fields yield similar cell potential and power output at a very low current density (<30 mA/cm
2). Above 30 mA/cm
2, the 2-channel spiral flow field exhibits better cell potential and power output compared to the others. The maximum power density achieved using the 2-channel spiral flow field is ~26 mW/cm
2, which is 13% higher than the other flow fields. The deviation in cell potential and power output becomes more pronounced between the 2-channel spiral flow field and other flow fields as the current density increases. Knowing that the 2-channel spiral design provides higher mass flux [
22], this implies that the 2-channel spiral design has better performance compared to other flow fields because it provides more reactants to facilitate the electrochemical reaction compared to other patterns. Excluding the 2-channel spiral flow field, all other flow fields exhibit similar cell potentials and power outputs for the range of current densities considered. This similar performance indicates that these three flow fields provide similar quantities of reactants to the catalyst active sites. Prior computational work indicated the air mass flux through the GDL and pressure drop are significantly lower in the dual-triangle sandwich flow field compared to the 4-channel serpentine and hybrid flow fields, but it offers better uniformity in flux distribution [
22]. However, the similar performance indicates that the design must be able to provide sufficient reactant distribution so that the predicted lower oxygen mass flux on the cathode is not limiting. Additionally, due to the partial cracking of ethanol, the cell might be less sensitive to oxygen distribution than when hydrogen is used as fuel. When the ethanol flow rate is reduced to 1 mL/min (
Figure 3b), the trends in flow field behavior, in regard to polarization and power output, are similar to those observed for an ethanol inlet flow rate of 2 mL/min, e.g., the 2-channel spiral flow field still yields the highest cell power outputs among all flow fields. For both flow rates (
Figure 3a,b), fluctuations in cell potential are observed for all flow fields at current densities above 125 mA/cm
2. This fluctuation may be due to the presence of fewer ethanol molecules at the catalyst active site for the electrochemical reaction compared to the required quantity. This limitation becomes most apparent at higher current densities when more reactants are needed. Additionally, the MEA performance may not be stable enough to consistently produce power at these current densities, particularly at a high current density.
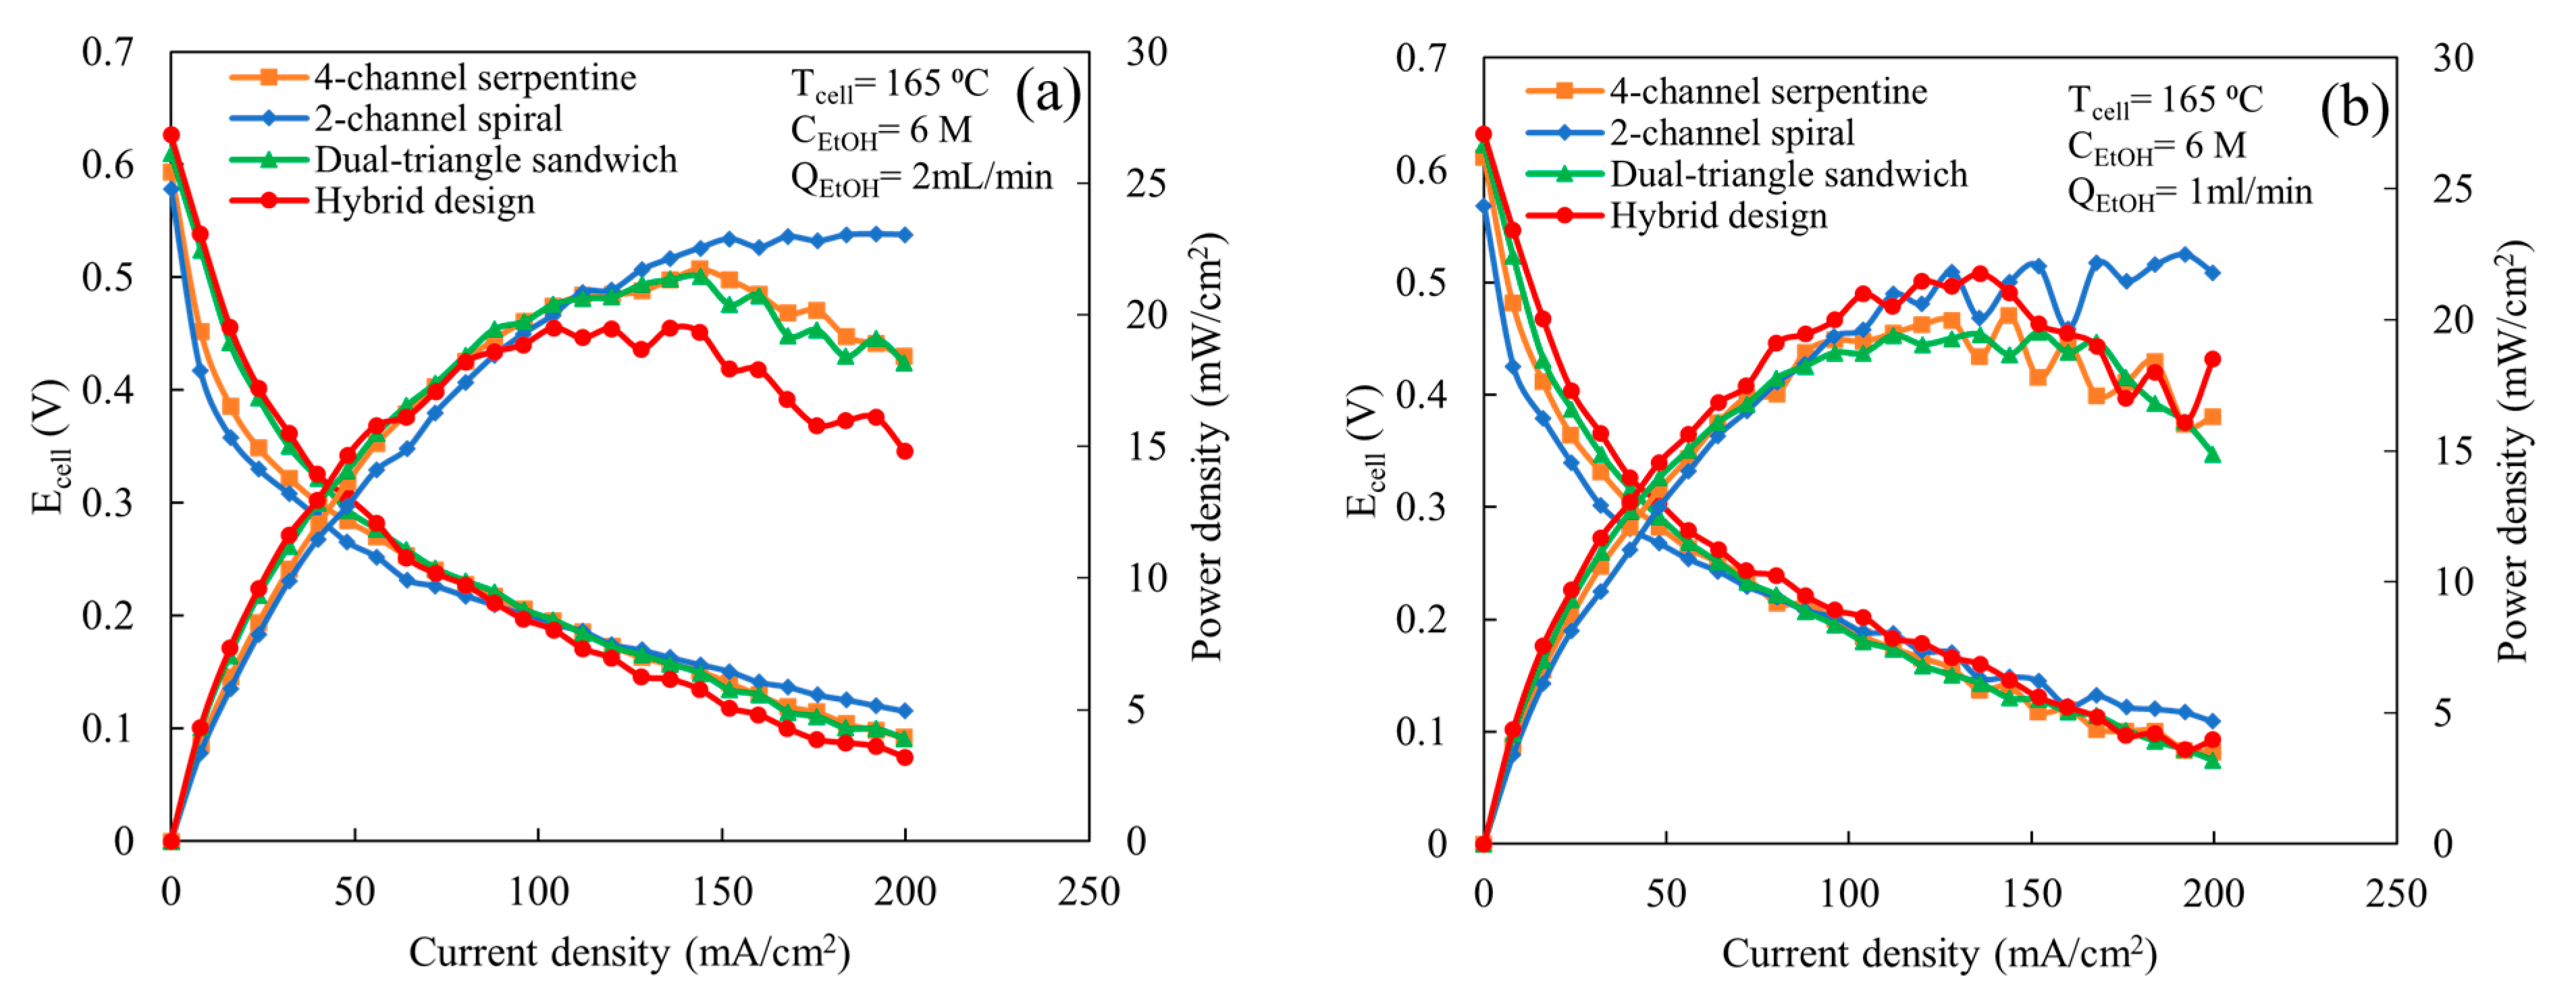
The comparison among various flow fields at the higher ethanol concentration (6 M) with a cell temperature of 165 °C, an air flow rate of 2 L/min, and ethanol flow rates of 1 and 2 mL/min is shown in
Figure 4. As shown in
Figure 4a for an ethanol flow rate of 2 mL/min, below 100 mA/cm
2, both the hybrid and dual-triangle sandwich flow fields exhibit similar cell potentials and power outputs, which are higher than the 4-channel serpentine and 2-channel spiral flow fields. The 2-channel spiral flow field provides the lowest performance until 100 mA/cm
2, which is due to a lower ethanol oxidation reaction rate. According to the prior study, the 2-channel spiral flow field provides a high average and localized maximum GDL mass flux [
22]. This high mass flow through the GDL causes the presence of more ethanol concentration in the catalyst active site, particularly in localized regions, compared to other flow fields. Additionally, at the high ethanol concentration (6 M), more ethanol than water molecules occupy the catalyst active sites, which imbalances the ratio of water and ethanol molecules required for a faster electrochemical reaction [
13,
24]. Thus, the high concentration (6 M), along with the increased mass flow through the GDL provided by the 2-channel spiral flow field, enhances the overall ethanol concentration at the catalyst active site compared to the other designs. The excess unused ethanol molecules at the catalyst active site likely lead to ethanol crossover from the anode to the cathode side and block the catalyst active site, which results in a reduction in the overall cell potential. However, at a higher cell current density (>100 mA/cm
2), the cell potential and power output improvement are significant for the 2-channel spiral flow field. At these current densities, the 2-channel spiral flow field exhibits higher cell potential and power output than the other designs. Due to an increase in cell current density, more ethanol molecules take part in the electrochemical reactions, which cause fewer unreacted ethanol molecules in the reaction active sites compared to at a low current density. This relatively fewer amount of ethanol molecules may decrease the ethanol crossover rate to the cathode side, which in turn reduces the losses due to crossover current density. Thus, the higher flux mass flux through the GDL provided by the spiral design becomes advantageous. In contrast, the hybrid design has the opposite process; at current densities less than 100 mA/cm
2, it has the highest cell potentials and power outputs, but at higher current densities, its potential and power output are significantly lower than the other designs. It is unclear what the cause is of the decreased performance for this design at higher current densities. It may be due to the combined effect of the imbalanced ethanol–water ratio at the catalyst active area and ethanol crossover. The 4-channel serpentine and dual-triangle sandwich flow fields show similar cell potential and power output across the range of current densities. At current densities above 100 mA/cm
2, the cell potentials and power outputs provided by these two designs lay between the spiral and the hybrid designs. Prior study [
22] shows that the dual-triangle sandwich flow field provides better uniform distribution than the 4-channel serpentine, but the amount of mass flow through the GDL is ~16 to 30% lower. This implies that the better uniformity with lower mass flux value (the dual-triangle sandwich) provides similar performance as less uniformity with higher mass flux value (the 4-channel serpentine) at a high ethanol concentration. When the ethanol flow rate is reduced to 1 mL/min (
Figure 4b), the 2-channel spiral flow field still exhibits higher cell potential and power output than others at a high current density (above 150 mA/cm
2). However, now, the hybrid flow field provides similar cell potential and power output as other flow fields. This similar performance of the hybrid flow field compared to other designs may be due to a decrease in ethanol crossover because of the reduction in mass flow towards the catalyst active side at low flow rate conditions. For both ethanol flow rates (
Figure 4a,b), the cell potential disturbance or fluctuation are noticed for all flow fields except the 2-channel spiral flow field for an ethanol flow rate of 2 mL/min at a high current density. Additionally, fluctuations become more prominent as the ethanol flow rate decreases to 1 mL/min. This high fluctuation may happen because the MEA may not perform well at a high ethanol concentration. The decrease in cell potential with increasing current density at a high ethanol concentration was also observed in the prior experimental study using the 3-channel serpentine flow field [
12].
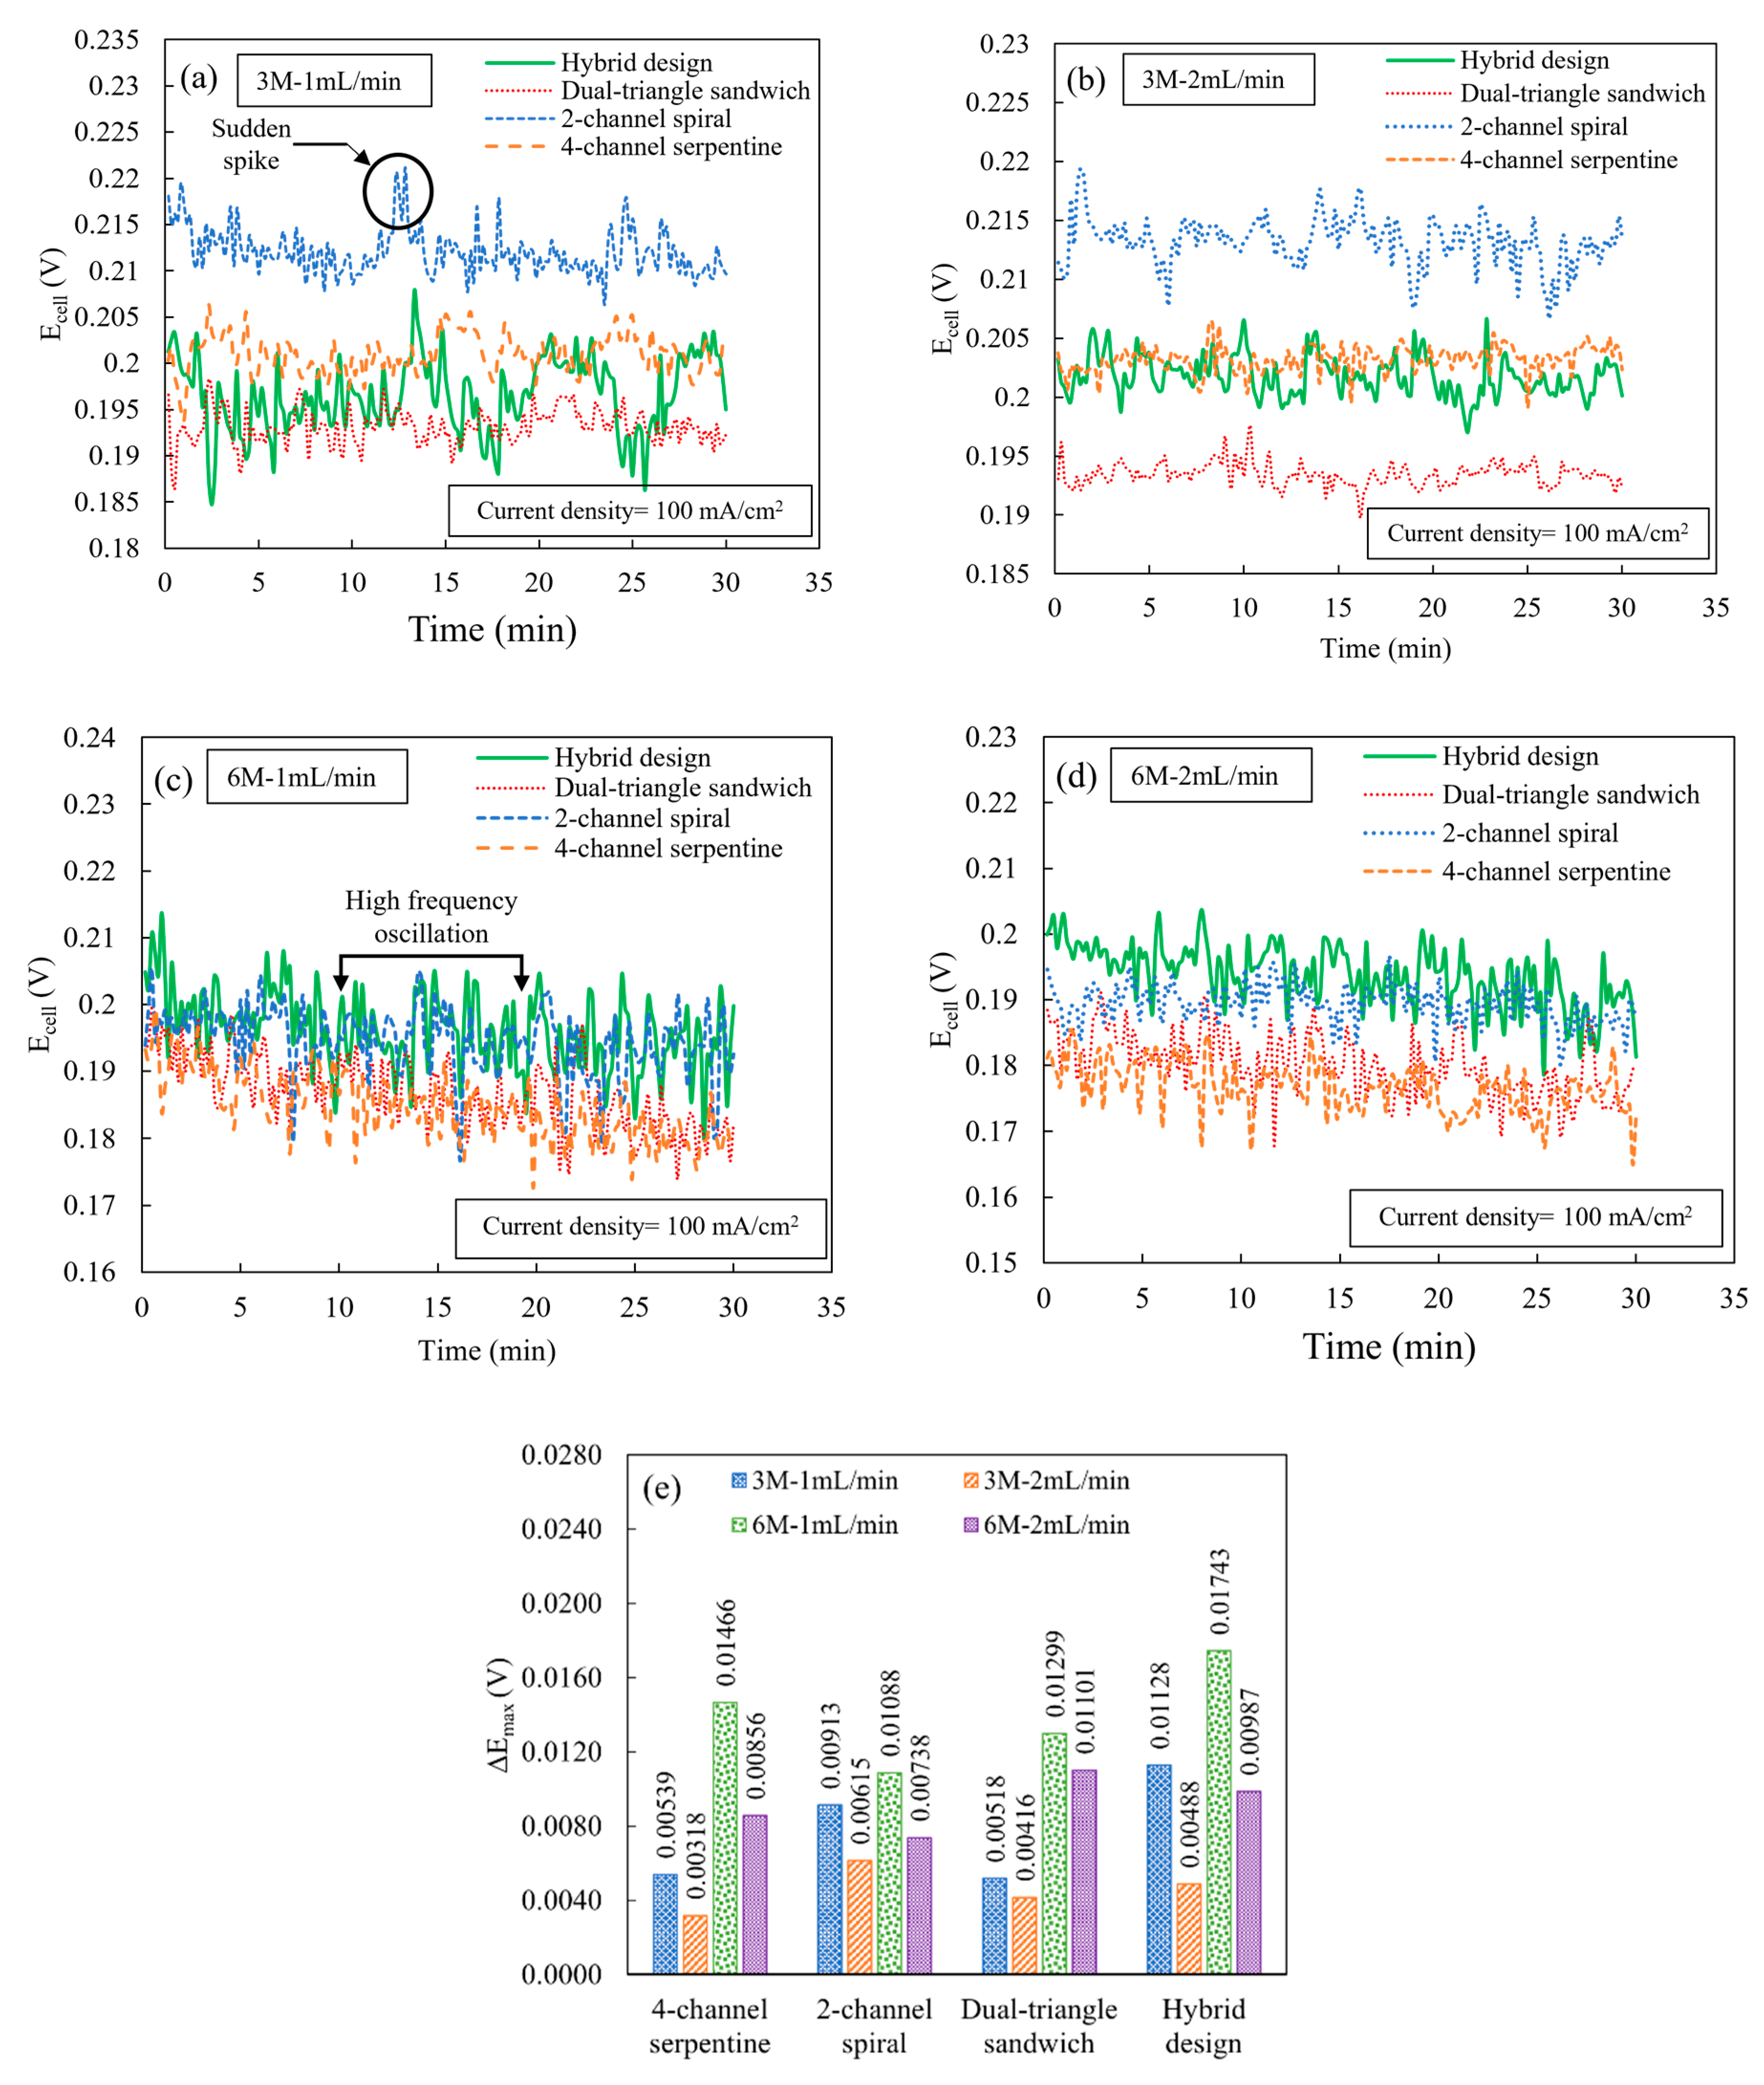
Figure 5 shows the results of the constant current experiment by plotting the cell potential versus time for different ethanol concentrations and flow rates at a cell temperature of 165 °C and a cell current density of 100 mA/cm
2. For all flow fields, at each combination of ethanol concentration and flow rate, there are high-frequency, random fluctuations of cell potentials. Although the amplitudes of cell potential fluctuations are different among various flow fields, most of these fluctuations are near the instrument accuracy level (for the cell potential readings of 0.18 to 0.21 V, the instrument accuracy is 0.0035 to 0.0036 V). These high-frequency, random oscillations are due to the frequent change in the reaction rate and instability of MEA performance during the electrochemical reaction [
25,
26]. A catalyst more optimized for direct ethanol conversion may be beneficial to help reduce these fluctuations. In addition to the high-frequency fluctuations, there are also sudden spikes or drops in potential. As shown in
Figure 5a, for the condition of 3 M and 1 mL/min, the sudden spikes or drops in cell potential are relatively less frequent for the 4-channel serpentine and dual-triangle sandwich design compared to other flow fields. This reduced frequency of sudden spikes or drops in cell potential indicates that both the 4-channel serpentine and dual-triangle sandwich flow fields provide more stability in the reaction kinetics because these designs more evenly supply the required amount of ethanol–water molecules that ensure the stable performance of the MEA. Due to an increase in the ethanol flow rate (2 mL/min), the number of sudden spikes increases for the 2-channel spiral flow field, while other flow fields provide fewer spikes, as shown in
Figure 5b. This more frequent spike or drop for the 2-channel spiral flow field may be due to the high flow rate exacerbating its already uneven distribution compared to other flow fields. In contrast, for all other flow fields, the supplied reactants reach the catalyst active site in sufficient quantity and with more even distribution, allowing the MEA to exhibit relatively more stable performance.
When the ethanol concentration increases to 6 M, the instability in cell potential fluctuation increases significantly. In
Figure 5c, for the condition of 6 M and 1 mL/min, the frequency of oscillations increases significantly with more random spikes for all flow fields. This instability is primarily caused by an imbalance in the ethanol–water ratio, rather than the effect of the flow fields. With an increase in ethanol flow rate to 2 mL/min for an ethanol concentration of 6 M (
Figure 5d), the frequency of cell potential oscillations remains almost unchanged for all flow fields.
Figure 5e shows the peak cell potential deviation for the various flow fields. This data confirms the trends observed in cell potential instability at different ethanol concentrations and flow rates, particularly that the high ethanol concentration (6 M) has greater peak cell potential deviation, in general. At a low flow rate (1 mL/min) for an ethanol concentration of 3 M, the hybrid flow field has the highest peak cell potential deviation, possibly due to slightly more uneven reactant distribution compared to other flow fields at this flow rate. However, an increase in flow rate helps to reduce the peak cell potential deviation for all flow field designs for both ethanol concentrations. As such, for an ethanol concentration of 3 M and a flow rate of 2 mL/min, all flow fields exhibit their lowest peak cell potential deviation. Overall, the 4-channel serpentine flow field has the lowest peak potential deviation at the 3 M and 2 mL/min conditions. At these conditions, the peak cell potential deviation in the 4-channel serpentine flow field is approximately at the instrument accuracy level. At the 3 M condition, the dual-triangle design is a close second. However, at the high ethanol concentration level, the spiral design offers the lowest peak fluctuation. Combining the information on the frequency and amplitude of the sudden potential spikes or drops (
Figure 5a–e), when operated at a concentration of 3 M, the 4-channel serpentine flow field exhibits relatively better cell potential stability among all flow fields because it has relatively fewer high-frequency oscillations and low peak cell potential deviations. But, by operating at a concentration of 3 M and flow rate of 2 mL/min, a significant amount of the differences between the stabilities of the flow fields can be reduced.
Drawing together the prior results of polarization and constant current experiments, all flow fields exhibit lower power output and higher cell potential instability at the higher ethanol concentration (6 M). At the low ethanol concentration (3 M) for all flow fields, the power outputs for a given flow field are nearly independent of the flow rate. However, the cell potential stability (high-frequency random oscillation and peak cell potential deviation) is better at an ethanol flow rate of 2 mL/min compared to 1 mL/min for all flow fields. Thus, regardless of design, an ethanol concentration of 3 M and flow rate of 2 mL/min are preferred. The 2-channel spiral flow field yields significantly higher power output with slightly worse cell potential stability compared to the other designs.
Since an ethanol concentration of 3 M and flow rate of 2 mL/min are preferred, these are the conditions used for the alternating current analysis.
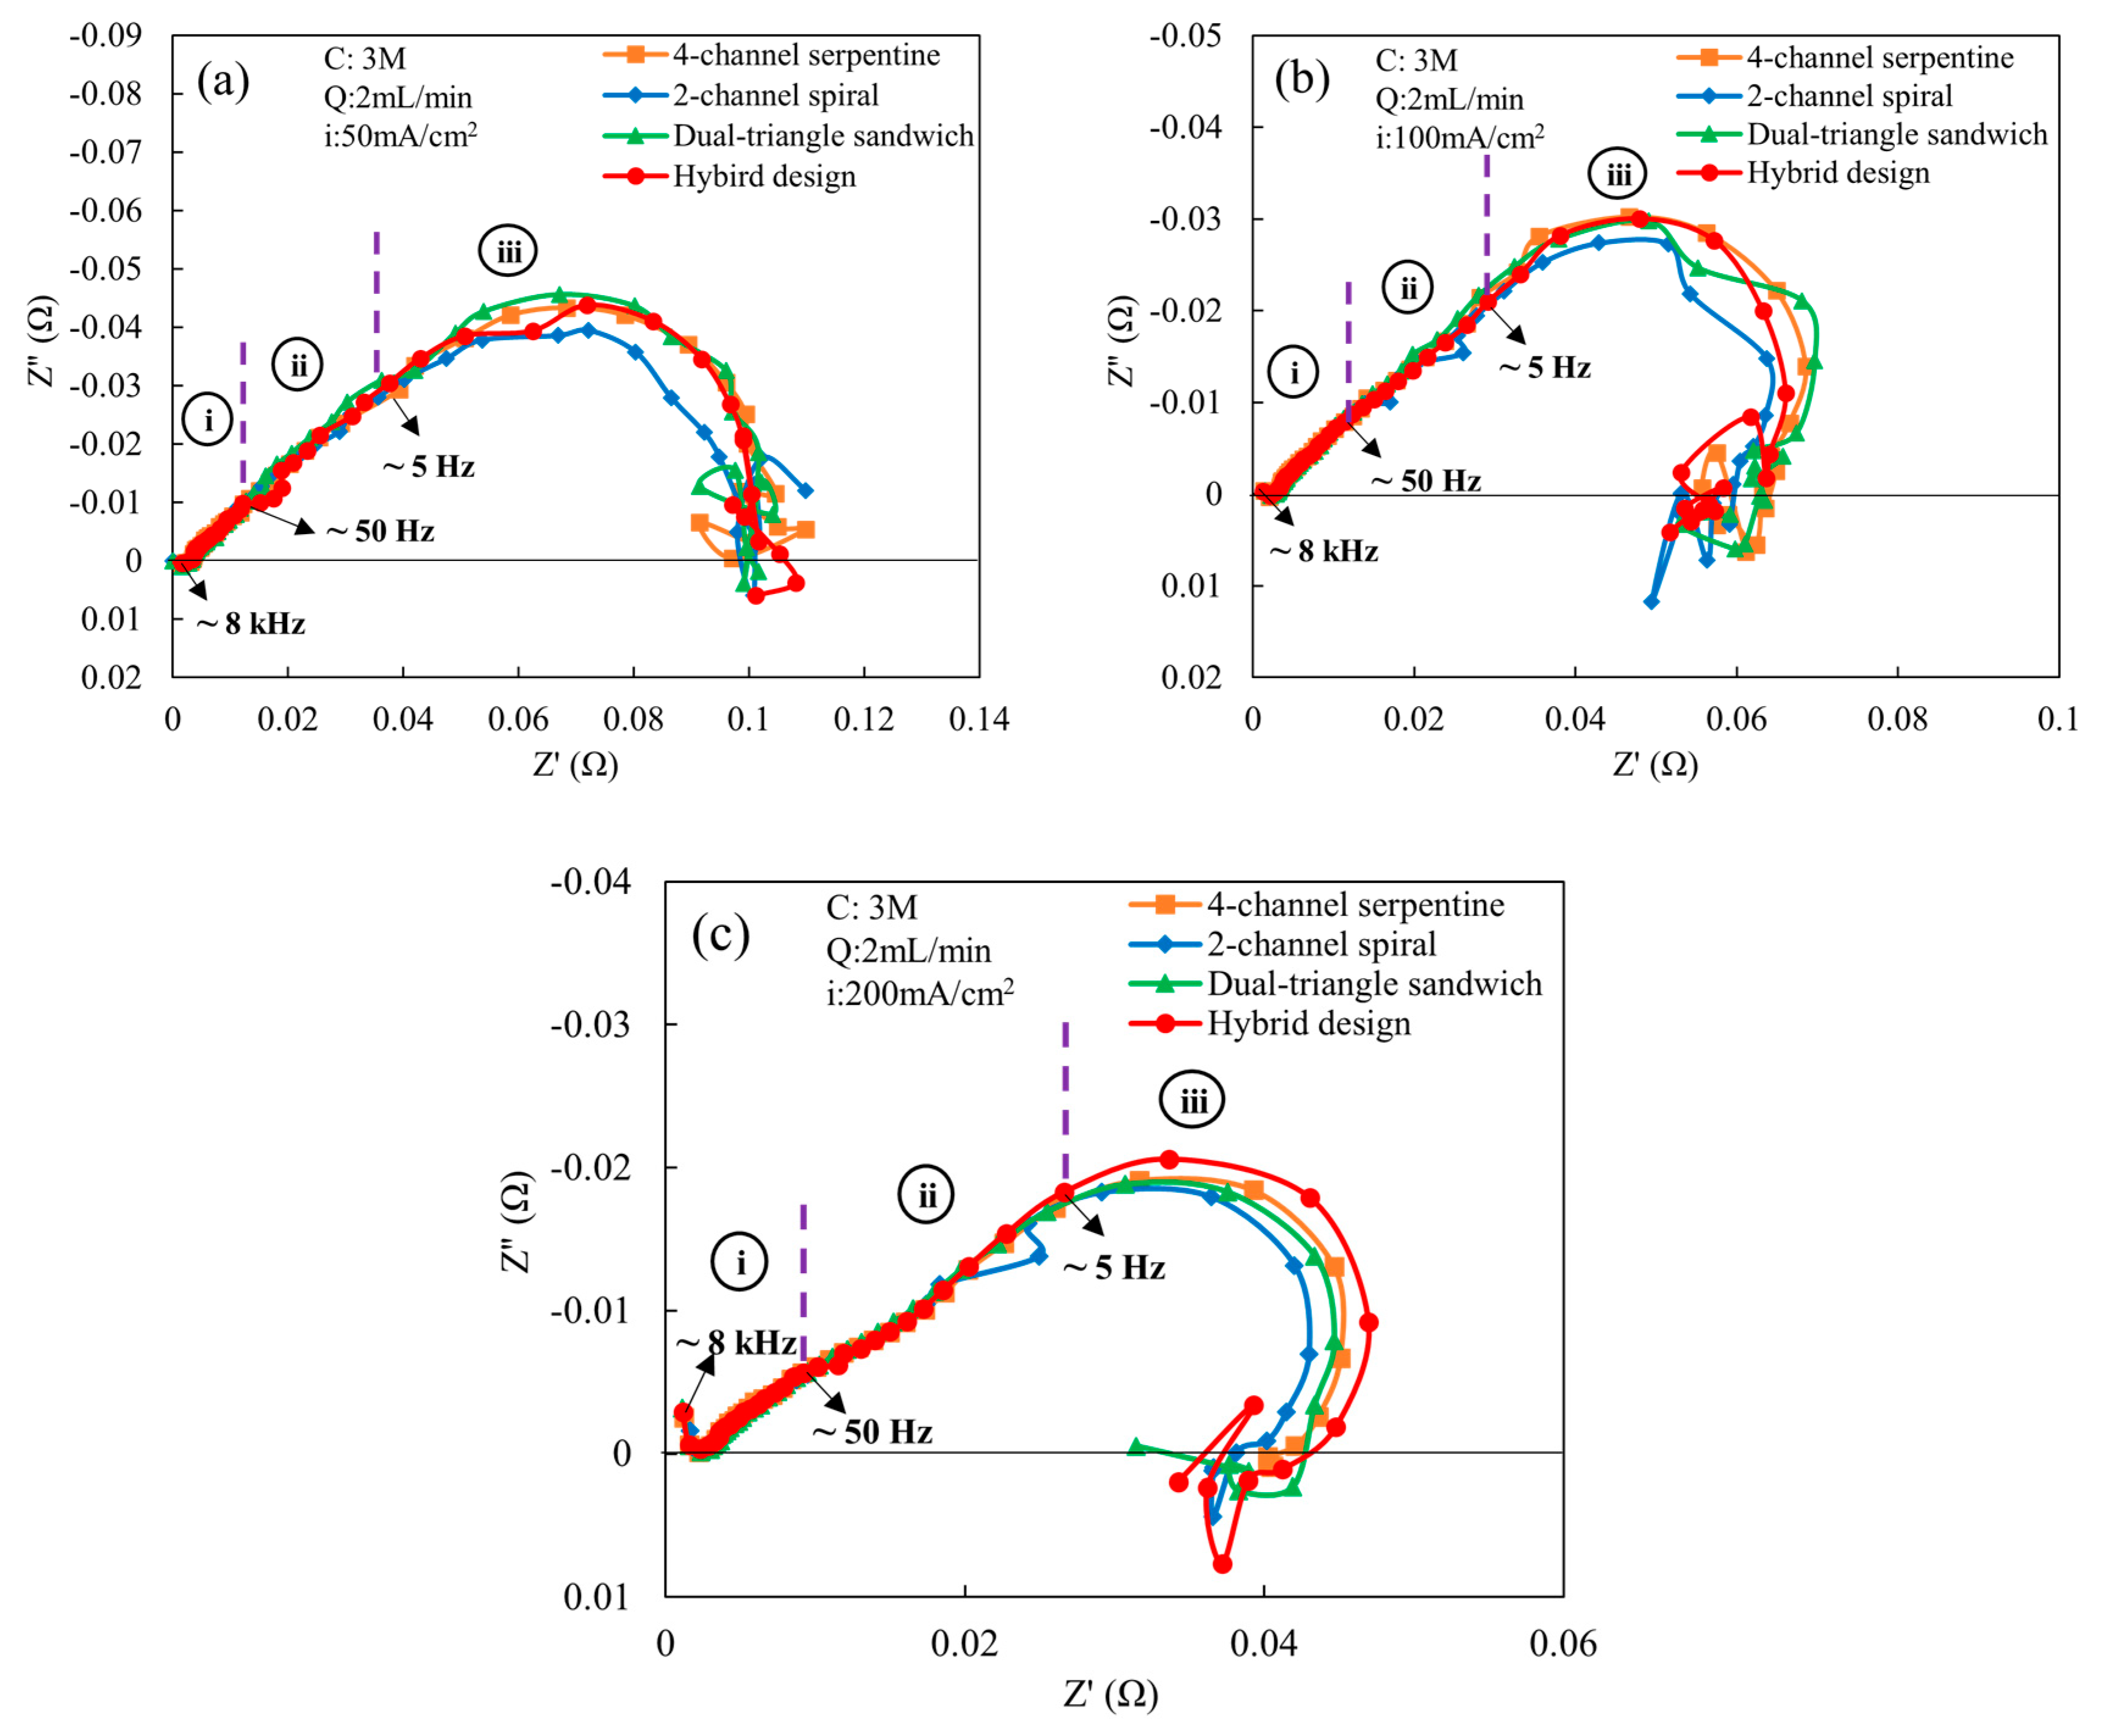
Figure 6 shows the comparison of Nyquist plots of various flow fields obtained at these conditions. The comparison is carried out for three different current densities: (a) low (50 mA/cm
2), (b) medium (100 mA/cm
2), and (c) high (200 mA/cm
2). As shown in
Figure 6a for a current density of 50 mA/cm
2, a 45° linear region in the high-frequency (region-i) is observed in the spectrum for all flow fields, which indicates that the proton transfer resistance is uniformly distributed across the catalyst layer (CL) for all flow fields [
27,
28]. Similar behavior is observed in region-ii for all flow fields. In region-iii, a low-frequency arc, associated with the finite-length Warburg impedance, appears for all flow fields, indicating the presence of mass transport effects in the electrochemical reaction. These results agree with a prior study on low-temperature direct ethanol fuel cells, where finite-length Warburg impedance was also observed in the spectrum [
20]. The arc diameter is smaller for the 2-channel spiral flow field compared to other flow fields, which implies that the mass transfer impedance, charge transfer resistance, and double-layer capacitance are lower in the 2-channel spiral flow field compared to other flow fields. Excluding the 2-channel spiral flow field, all other flow fields have similar mass transfer impedance and charge transfer resistance since the arc diameters are identical. When the current density is increased to 100 mA/cm
2 (
Figure 6b), the finite-length Warburg impedance also persists and begins near the start of region-iii. The 2-channel spiral flow field still yields lower mass transfer impedance and charge transfer resistance compared to other flow fields, as observed by the smaller arc in region-iii. This observation is also aligned with the polarization outcomes (
Figure 3a), wherein the 2-channel spiral flow field has higher cell potentials and power outputs. The hybrid, dual-triangle sandwich and 4-channel serpentine flow fields have higher mass transfer impedance and charge transport resistance since the arc diameter is larger. The arc diameter of hybrid design is slightly smaller than the other two at the lowest frequencies. These two flow fields may supply a slightly lower quantity of ethanol–water molecules to the anode catalyst active site. Except for the slightly better performance of the 2-channel spiral design at these conditions (50 and 100 mA/cm
2), the differences among the other flow fields noticed in the Nyquist plots are not observed in the polarization curves. This is likely because the variations in arc diameter detected through the impedance spectroscopy are fairly minor. At a high current density (200 mA/cm
2) in
Figure 6c, the second loop indicative of the finite-length Warburg starts at intermediate frequencies (region-ii). The arc diameter is still smallest for the 2-channel spiral flow field, while it is largest in the hybrid flow field. The 4-channel serpentine and dual-triangle sandwich shape flow fields have similar arc diameters, and rank between the 2-channel spiral and hybrid designs. The largest arc diameter is due to the highest charge and mass transport losses among all flow fields. However, the differences among the hybrid design, the 4-channel serpentine, and the dual-triangle are not observed in the polarization curve. This indicates that the difference in mass transfer impedance and charge transfer resistance between these three designs is less consequential than the difference with the 2-channel spiral design, because the 2-channel spiral design does have higher power output and cell potential at 200 mA/cm
2.
Based on the shape of the Nyquist plots [
29], which in addition to a resistance–capacitance loop, shows an offset due to ohmic resistance and a subtle double loop indicative of finite-length Warburg impedance,
Figure 7 shows the equivalent circuit for the flow fields. The circuit consists of ohmic resistance due to the electrochemical/electrical resistances (R
s), charge transfer resistance (R
ct), and double-layer capacitance (C
dl) at the membrane–electrode interface, and a Warburg impedance (W) associated with mass transfer.
Using this equivalent circuit model (
Figure 7),
Table 2 quantifies the ohmic, charge transfer, and total resistances associated with impedance spectra. Additionally,
Table 2 provides the total resistance obtained from polarization experiments for the flow fields at the various current densities. For all flow fields at the various current densities, the ohmic resistances (R
s) are nearly identical. This similarity indicates that the component electrical resistance remains unchanged with an increase in current densities and that the differences in flow field designs are not impactful on the ohmic resistance. Thus, for the impedance spectra, the difference in resistance between the designs is due to the charge transfer resistance and the impact of mass transport impedance.
As to the charge transfer resistance (R
ct), at 50 mA/cm
2, the 4-channel serpentine and 2-channel spiral flow fields exhibit a similar resistance at the electrode and membrane interface, while the value is slightly higher for the dual-triangle sandwich and highest in the hybrid flow field design. Although the charge transfer resistance for the 2-channel spiral flow field is similar to that of the 4-channel serpentine, the smaller arc diameter over most of the lower-frequency region (below 5 Hz) of the Nyquist plot for the 2-channel spiral design (
Figure 6a) indicates that it has lower mass transport losses for most of the range, but it increases at the lowest frequencies near where it crosses the real axis, which results in a similar charge transfer resistance. At higher current densities (100 and 200 mA/cm
2), the charge transfer resistance decreases for all flow fields. At these higher current densities, the 2-channel spiral flow field has the lowest charge transfer resistance among all flow fields, indicating that the lower mass transport losses due to a lower arc diameter, as discussed above (
Figure 6), have a significant effect on the reduction in charge transfer resistance. From the prior computational study, the 2-channel spiral flow field has a higher mass flux [
22], which enhances the presence of more molecules at the catalyst active site for the electrochemical reaction, ultimately reducing the charge transfer resistance. For the other flow field designs, the charge transport resistance is nearly identical at 100 and 200 mA/cm
2. Thus, the larger arc diameter in the lower-frequency region for the hybrid flow field at 200 mA/cm
2, observed in
Figure 6c, is primarily due to mass transport losses of reactants at the catalyst active area. Looking at the channel configuration of the hybrid flow field in
Figure 1b, the upper parallel–serpentine flow channel is directly connected to the outlet of the flow field, while the other two parallel–serpentine channels are merged into a single channel before connecting to the outlet. This direct connection of the upper parallel–serpentine channel to the outlet causes fewer obstacles in reactants’ flow through the channel compared to the other two channels. Thus, the upper parallel–serpentine channel may supply relatively fewer reactants with a slightly more uneven distribution compared to the other two channels, which results in a higher mass transport loss for a cell current density of 200 mA/cm
2. Since both the dual-triangle sandwich and 4-channel serpentine have a similar charge transfer resistance and arc diameters in the Nyquist plot (
Figure 6c), the two designs likely facilitate similar mass transport to the catalyst active site.
Comparing the total resistance obtained from the impedance spectra and that obtained from the DC polarization curve, the total resistance from the DC polarization is lower compared to the total resistance from the impedance spectra. This apparent difference in total resistance was also noted by Makharia at al. [
30], and is likely due to the relaxation (time-dependent behavior) of intermediate species produced in the electrochemical reaction [
31]. The inductive behavior associated with the formation of intermediate species is observed in
Figure 6, as indicated by the positive value of imaginary components. As shown in
Table 2, the hybrid flow field exhibits the highest total resistance in both the DC and AC methods for all current densities, while the 2-channel spiral flow field has the lowest total resistance among all flow fields. The higher total resistance of the hybrid flow field in both methods may be attributed to its greater production of intermediate species, where the lower resistance of the 2-channel spiral flow field implies a reduced yield of these species.


