Abstract
This study presents the development of a kinetic model for the gasification of biochar with carbon dioxide and compares the results obtained using a thermogravimetric analyzer (TGA) and a fluidized bed reactor (FBR). The kinetic experiments investigated the effects of the CO2 partial pressure (0.33–1 atm), temperature (800–1000 °C), and CO2/C ratio (3.5–10.5). Three structural models, the shrinking core model (SCM), volumetric model (VM), and power-law model (PLM), were evaluated for their ability to predict experimental results. The results demonstrated that increasing the temperature, CO2 partial pressure, and CO2/C ratio enhanced the gasification rate, reducing the time required for complete biochar conversion. The apparent activation energy for both reactors was similar (156–159 MJ/kmol), with reaction orders of 0.4–0.49. However, the kinetic models varied significantly between setups. In the TGA, the PLM provided the best fit to experimental data, with standard deviations of 2.6–9%, while in the FBR, the SCM was most accurate, yielding an average deviation of 1.5%. The SCM effectively described the layer-by-layer char consumption, where gasification slowed at high conversion levels. Conversely, the PLM for the TGA revealed a unique mathematical function not aligned with traditional models, indicating localized reaction behaviors. This study highlights the inability to directly extrapolate TGA-derived kinetic models to FBR systems, underscoring the distinct mechanisms governing char consumption in each reactor type. These findings provide critical insights for optimizing biochar gasification across diverse reactor configurations.
1. Introduction
The European Union has made decarbonization a top goal in its economic strategy. After the European Commission adopted the European Green Deal, a comprehensive environmental protection program aiming for net-zero emissions by 2050 was developed [1]. This program involves the use of renewable energy sources in order to replace fossil fuels, namely coal, oil, and natural gas, responsible for greenhouse gas emissions into the atmosphere, particularly carbon dioxide, leading to global temperature rise [2]. In 2022, renewable energy sources accounted for 23% of the EU’s energy consumption [3]. Solar, geothermal, hydropower, wind, and biomass energy are the main exploitable renewable energy sources [4]. Biomass appears to be among the most attractive energy sources due to its elevated energy potential and abundance on Earth. Biomass, such as forestry residues or food waste, can be used to produce biofuels through thermochemical conversion processes (torrefaction, pyrolysis, hydrothermal liquefaction, and gasification) or biological conversion processes (fermentation and anaerobic digestion) [5]. In order to lower the atmospheric concentration of carbon dioxide, gasification with CO2 as an agent seems to be a compromising method. During this process, CO2 participates in the formation of several compounds, including H2, CO, CH4, coke, tar, and volatiles [6]. The quality of the syngas produced depends on the amount of CO and H2 that it contains compared to other gaseous molecules. Since it is complicated to remove tar from syngas, biochar can be used as a catalyst during the process in order to increase syngas generation [7]. In a simulated two-stage gasifier, other authors of [8] assessed the steam gasification of biomass combined with a biochar catalytic bed. They illustrated the value of employing biochar as a catalytic treatment for tar by demonstrating the rise in the thermodynamic efficiency of the syngas generated, which is primarily caused by the endothermic steam gasification reaction (ΔrH° = +131.38 kJ/mol carbon) [9].
A considerable number of complex reactions are involved in the gasification process. A thorough understanding of the mechanism and behavior is necessary. By using the concepts of particle consumption and reaction mechanism found in kinetics, researchers may create a kinetic model that allows them to replicate and confirm gasification results. Selecting individual reactions to develop kinetic models is the most appropriate and accurate approach since biomass gasification generally consists of numerous chemical reactions that each exhibit unique kinetic behavior [10,11,12]. The gasification of biomass using CO2 as an agent has many benefits including a less corrosive medium than steam, increased gasification output yield, and efficiency and flexibility in syngas production [13]. However, the low utilization of CO2 as a gasification agent in industries and laboratories could be due to the extremely endothermic Boudouard (ΔrH° = +172.3 kJ/mol) reaction and consequently the high energy requirements [14,15]. Concerning the gasification of char, the reactivity of the latter is influenced by its volatile amount, ash content, and volatile release rate. The volatile chemicals may eventually interact with the char, leading to a decrease in its reactivity and causing secondary reactions. Additionally, the gasification kinetics depends mainly on char structure and size [15,16,17]. Char reactivity models are typically described in terms of volumetric- and structural-type models. For the structural models, an internal solid matrix or an internal pore structure (random pore model) is specified. Since porosity is not explicitly expressed in volumetric-type models, in which only the conversion x is represented as a variable, the changes in the pore structure during char conversion can be described by empirical correlations [18].
Under a CO2 environment, Nguyen et al. investigated the kinetics of the isothermal gasification of rice husk char. The studies were carried out in a temperature range of 900 to 1000 °C using a macro-thermogravimetric reactor setup. Nitrogen with a heating rate of 20 °C/min was used to prepare the char at 600 °C. The authors used a volumetric model to represent the char gasification rate as a function of the conversion process. The kinetic equation was r = A exp (−Ea/RT) (1 − x), where x is the conversion rate. The pre-exponential factor A and the apparent activation energy Ea were 1.80 × 10⁵ s−1 atm and 193.4 kJ/mol, respectively, with a reaction order n of 0.36 [19]. Rice husk gasification with CO2 was also investigated using a thermogravimeter analyzer. Biochar was prepared in situ at 800 °C. The random pore model was employed, and the kinetic equation was r = A exp (−Ea/RT) (1 − x) (1 − 12.6 ln (1 − x))2, with 3.937 × 10⁷ s−1 and 238.3 kJ/mol for A and Ea, respectively [20]. In another study, three kinetic models, the modified random pore model (MRPM), the random pore model (RPM), and the modified volume reaction model (MVRM), were used to calculate the kinetic parameters of torrefied oil palm gasification with CO2. According to the findings, the MRPM provides the best fitting with the gasification reactivity curve [21]. Wang et al. tested the Flynn–Wall–Ozawa (FWO) and Kissinger–Akahira–Sunose (KAS) methods to determine the apparent activation energy for the gasification of corn straw with CO2 in a thermogravimetric analyzer. The apparent activation energy calculated by the FWO and KAS methods was 239.43 and 232.82 kJ/mol, respectively [22]. These two techniques have been widely used in the literature, particularly for the kinetic analysis of the pyrolysis, gasification, and combustion of biomass and coal [23,24,25,26,27,28,29,30,31]. The corresponding equations are detailed in the Appendix A.
Alongside the ash content, biochar preparation method, reaction temperature, and partial pressure, the reaction kinetics can be affected by the reactor type, according to various studies comparing the char gasification rate and kinetics in various reactors [32,33]. The presence of diffusional limitations may eventually affect the mass and heat transfer of particles. To identify this presence, Dupont et al. determined the external and internal heat transfer times for biochar gasification by conduction, convection, and radiation. They demonstrated that both physical and chemical kinetics may control the process for biochar particles larger than 100 µm. The most important diffusional phenomenon for large particle sizes, according to the authors, is gas and particle convective heat transfer [34,35,36]. Mueller et al. [37] used a small-scale fluidized bed reactor (FBR) and a thermogravimetric analyzer (TGA) to compare the kinetics of CO2 as a gasification agent for two biomasses, brown coal and industrial petcoke char. The fuel bed configuration was the primary distinction between the two setups. In both reactors, the temperature range, partial pressure, and batch fuel samples were identical. The authors reported that char gasification using the FBR demonstrated a significantly faster gasification rate than that using the TGA. This phenomenon was ascribed to the local boundary conditions of the particles. For the FBR tests, the particles were in a quasi-homogeneous gas atmosphere with improved heat and mass transport conditions, which was not the case for TGA tests using a fixed bed configuration type [37]. In order to estimate an appropriate kinetic model, Chen et al. also carried out char gasification with CO2 in a TGA and an FBR. The main objective was to compare various chars with gasification agents. The authors noticed that the exponential conversion curves of the TGA and FBR were similar but that the gasification rate in the FBR was faster than that in the TGA [38]. The conversion path that the char particle undergoes ultimately determines which kinetic model is used in both isothermal and non-isothermal gasification. Vyazovkin et al. [39] reported the kinetic analysis of conversion curves that fit with known kinetic models. According to the authors, gasification conversion curves might take on linear or exponential shapes. Power law, contracting sphere, contracting cylinder, and Mampel first order were the most commonly used reaction models in the study because they were more suited to char degradation [39].
The main objective of this paper is to develop a kinetic model for the gasification process between carbon dioxide and biochar. In our previous work, the use of CO2 as a gasification agent showed a high-energetic-density and high-exergetic-density CO molecule, which represented the bulk of the syngas produced [40]. Furthermore, the energetic and exergetic efficiency of CO2 gasification was comparable to that of steam gasification and better than that of high-temperature pyrolysis. In this study, the creation of a kinetic model in a fluidized bed reactor (FBR) and a thermogravimetric analyzer (TGA) is conducted. A comparison is performed in order to find the potential differences between a fluidized bed reactor and a thermogravimetric setup while modeling the gasification of biochar. For the kinetic investigation, the temperature, the CO2 partial pressure, and the CO2/C ratio were involved. The three parameters varied from 800 °C to 1000 °C, 0.33 to 1 atm, and 3.5 to 10.5, respectively. The shrinking core, volumetric, and power-law models were the three structural models examined. Due to experimental uncertainty and variations, the following data showed an error margin of roughly 3.3%. Mass weighing, value rounding, and equipment tolerance were the sources of the experimental errors.
2. Materials and Methods
2.1. Materials Used
The biochar used in this study was prepared from beech wood biomass, obtained from Ooni Corporation UK. The biomass was heated inside the fluidized bed reactor at 3 °C/min until it reached 900 °C. It was maintained there for 1 h to ensure that no volatile matter was present after the devolatilization process. Nitrogen was used as the carrier gas with a flowrate of 0.5 L/min. The recovered biochar was then sieved to a particle size of approximately 450 μm, with a bulk density of 0.33 g/cm3 at 20 °C. Elemental and proximate analyses were performed for the biomass used for biochar production, as well as for the coal, as shown in Table 1. The BET specific surface area was evaluated using the following equipment: Vacuum Degasser Belprep-VAC III and BELSORP MAX II; it was found to be 359.01 m2/g.

Table 1.
Proxanal and Ultanal composition of produced chars.
2.2. Experimental Setup
2.2.1. Fluidized Bed Reactor
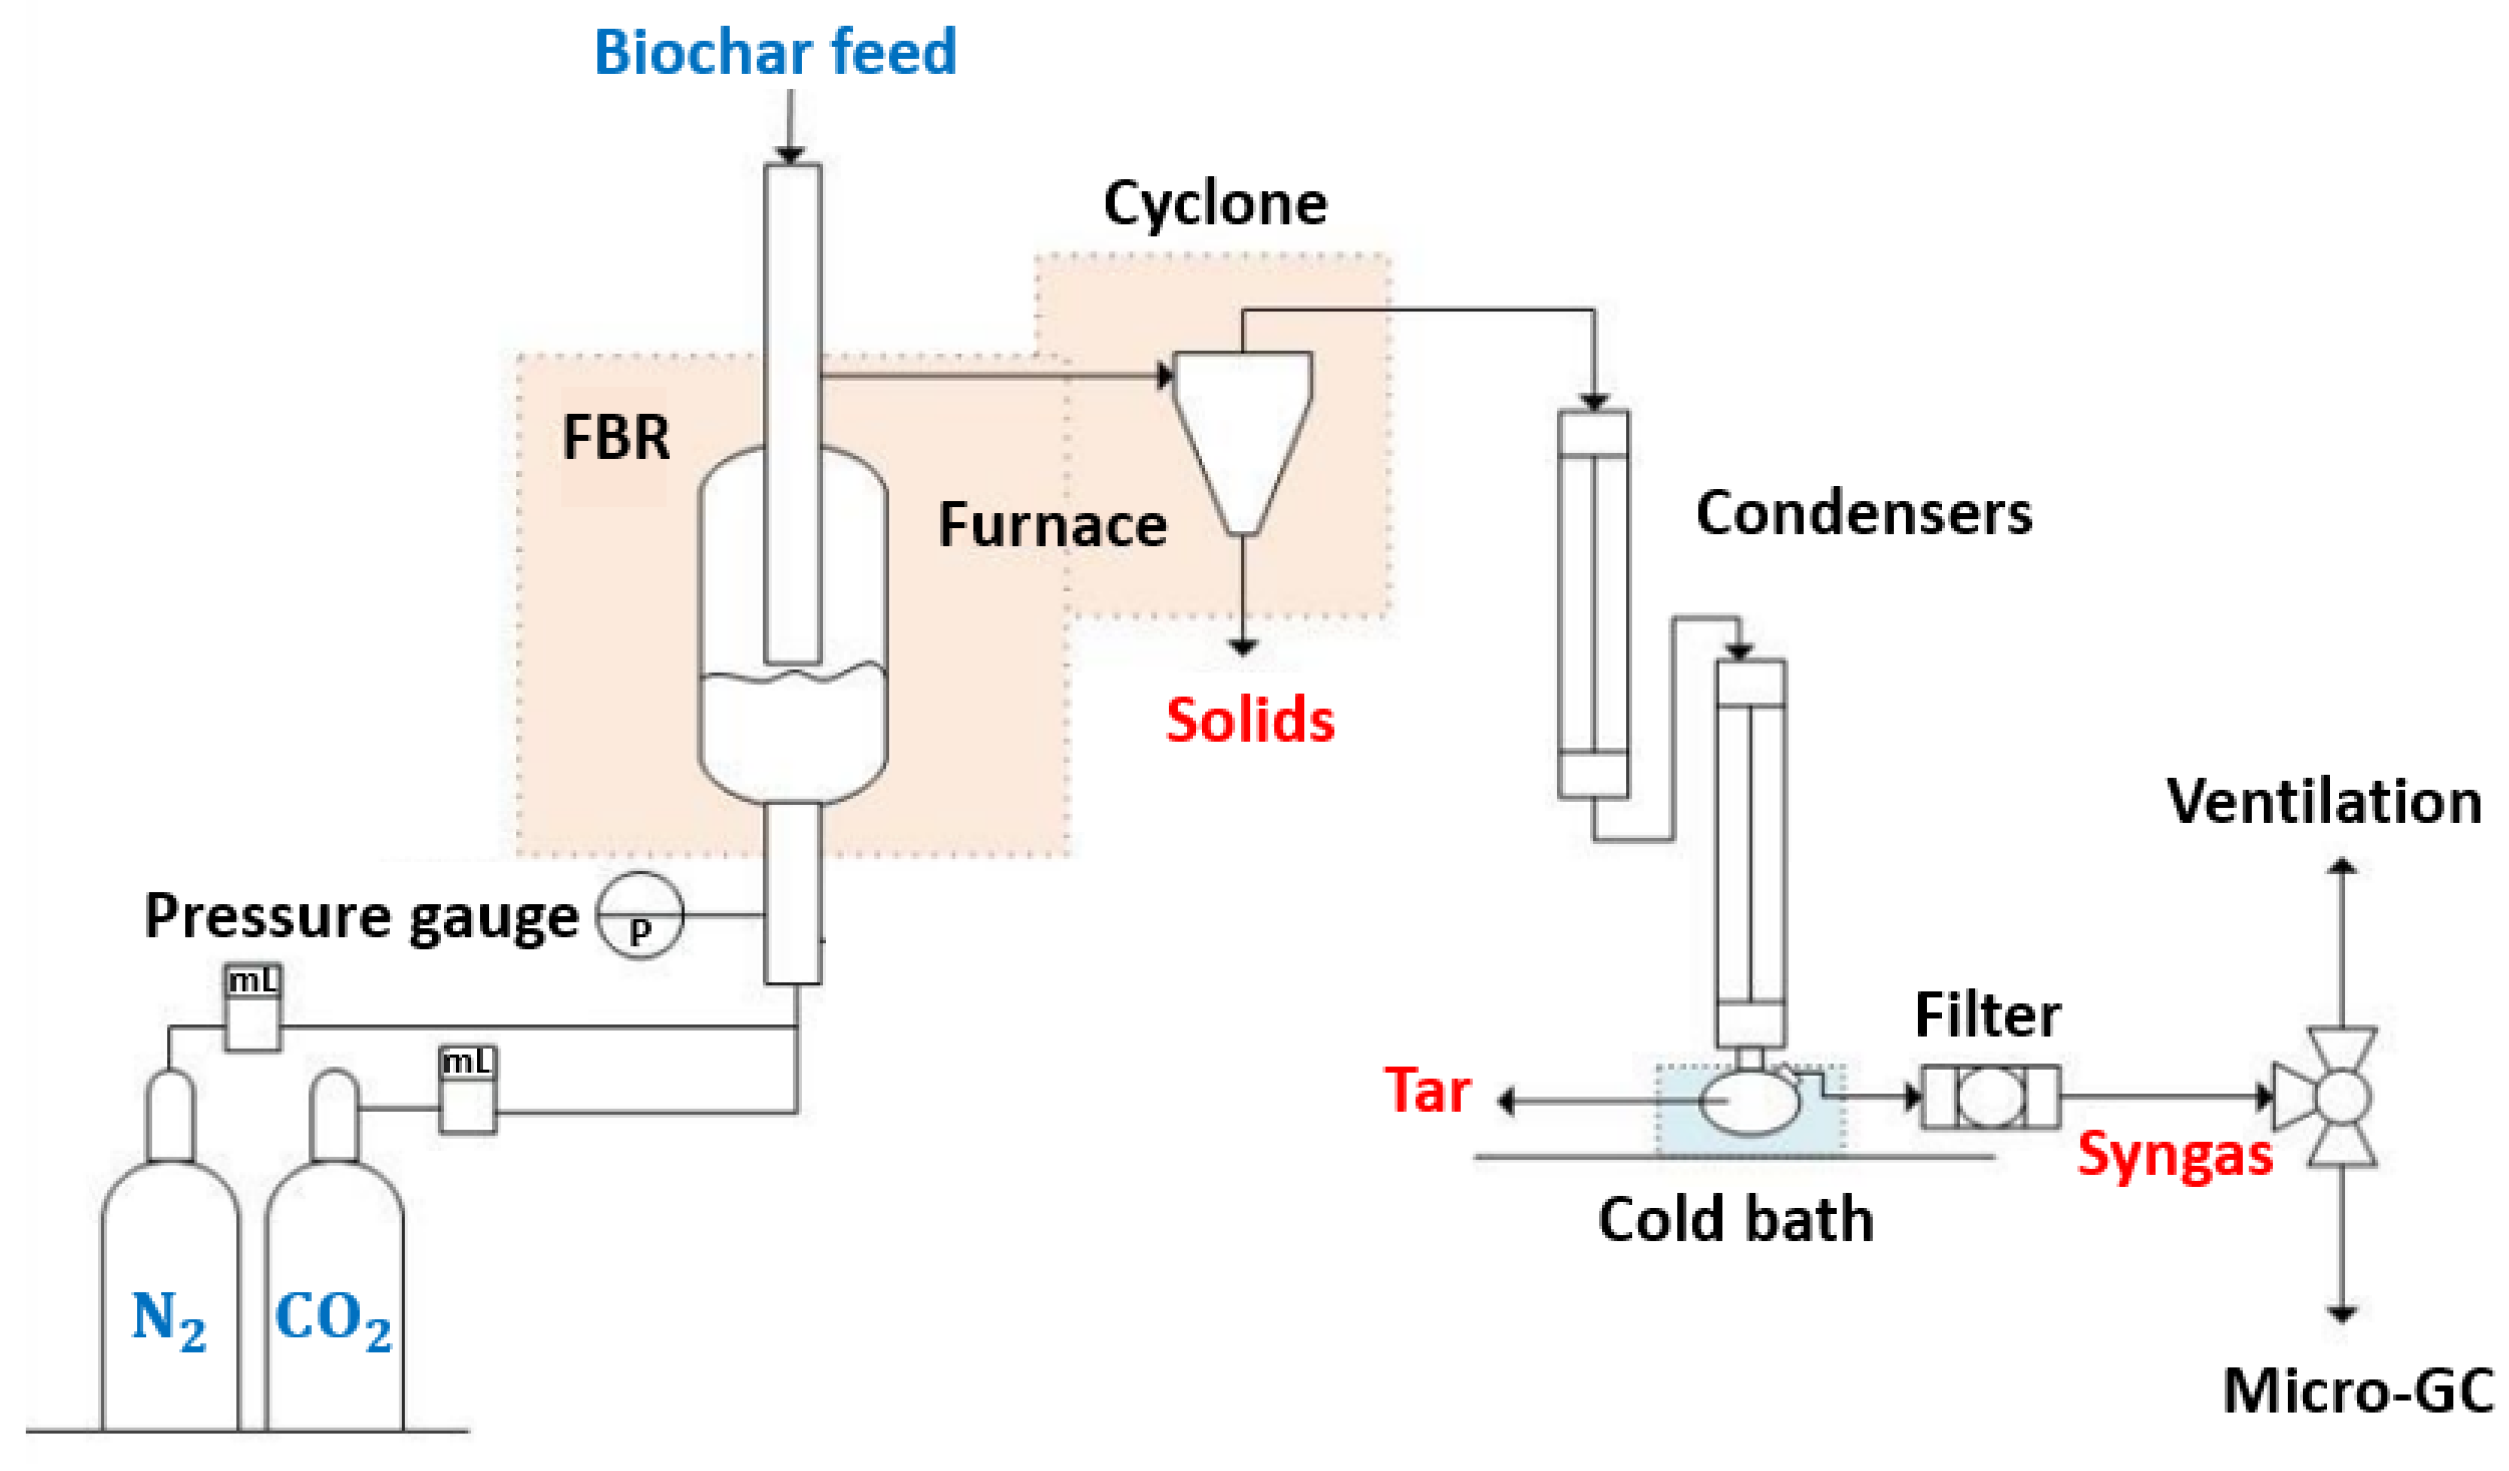
The gasification runs were performed in a fluidized bed reactor obtained from the MTI Corporation (Ref. OTF-1200X-S-FB). The reactor’s wall was made of stainless steel, with an inner diameter of 22 mm and an external diameter of 25 mm. The gasification process was isothermal, and for each run, approximately 100 mg of biochar was introduced into the reactor with 10 g of washed sand (mass ratio of approximately 1/100). Nitrogen was then introduced into the reactor to create an inert atmosphere before heating. The reactor was heated with a rate of 9 °C/min until it reached the desired temperature. At this stage, the gasification agent CO2 was introduced into the reactor. Solids were obtained from the reactor and the cyclone. Condensable gases passed through two condensers and were collected in a flask placed in a cold bath at −10 °C. Non-condensable gases were filtered to retain all possible solid particles before exiting the system from the top of the reactor through a separate tube. Figure 1 presents the overall setup.
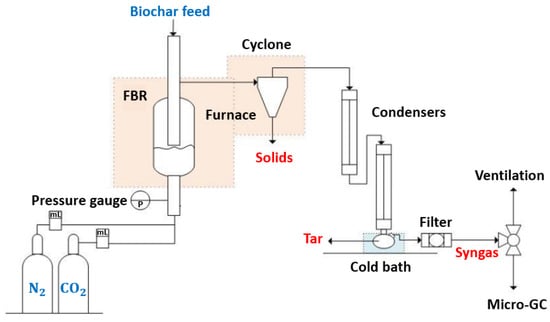
Figure 1.
Fluidized bed reactor setup.
The reaction time was approximately two hours. Table 2 shows the experimental conditions used for the fluidized bed gasifier tests. The minimum fluidization velocity was calculated based on the correlation proposed by Levenspiel et al. [42]. The actual gas velocity used in this study was set to in order to avoid fixed bed conditions and to ensure proper fluidization of the bed. The parameters used for the calculation of are detailed in Table A1 in the Appendix A.
Table 2.
Experimental conditions for gasification.
2.2.2. Thermogravimetric Analyzer
The TG SDT Q600-TA obtained from TA Instruments (USA), equipped with an aluminum oxide sample pan, was used in this study. Flows of CO2 and N2 were connected into a mixer in order to provide a homogeneous stream, which entered the analyzer through a pressure valve. The biochar sample, with an average weight of 7.0 ± 0.1 mg, was introduced into the equipment. N2 flow was then introduced into the analyzer to create an inert atmosphere. Heating started with a rate of 9 °C/min until the operating temperature was reached. At this stage, the N2 flow was replaced by CO2 to start gasification.
The reaction time was approximately two hours for all samples, and the experimental conditions were the same as for the gasification of biochar in the fluidized bed reactor shown in Table 2. However, for the TGA, the CO2/C ratio was set by varying the gas flow rate of the mixture of N2 and CO2 from 50 to 150 mL/min. The software Trios version 5.1 from Universal TG Instruments was used for data acquisition and analysis.
2.3. Biochar Conversion
Biochar conversion in the fluidized bed reactor was determined based on the carbon monoxide produced according to the Boudouard reaction (Equation (1)).
Researchers consider that char or biochar is fully formed of carbon molecules without considering its initial chemical structure [43,44,45] because of the hypothesis of no volatile matter being released at high temperatures. Using the dry reforming equation for solid fuel hydrocarbons proposed by Kaltschmitt et al. [46], biochar conversion with CO2 can be expressed as in Equation (2).
x, y, and z are the molar content of carbon, hydrogen, and oxygen in the biochar, respectively.
The variation in the biochar mass was determined as follows (Equation (3)):
where x is the conversion rate, defied as . m0, mt, and mf represent the initial mass, the mass at a given time t, and the final mass, respectively. t0 denotes the initial time, and tf represents the final time.
The mass of the biochar at the instant t was calculated as follows (Equation (4)):
Mw represents the molecular weight of biochar and CO. The amount of the product gas CO, mt,CO, was determined every two minutes using a micro-gas chromatograph, obtained from Chemlys corporation (Ref. PN 074-594-P1E).
2.4. Gasification Rate
The gasification rate represents the rapidity with which the biochar was consumed. This rate (r) can be expressed as in Equation (5).
A half-reaction index of r50 was selected. This index reported the reaction rate of the biochar samples at a fixed conversion of 50%. This common technique has been used to present reaction rate values for a given conversion and time and to compare results [47]. r50 can be calculated using Equation (6).
where x1/2 and t1/2 represent the variation in conversion from 0 to 0.5 and the required time to reach 50% conversion.
3. Results and Discussion
In this work, several parameters were studied, considering the following conditions: the temperature (800–1000 °C), CO2 partial pressure (0.33–1 atm), and CO2/C ratio (3.5–10.5). The reactor was electrically heated and well insulated with an efficient thermal insulator. In the radial direction, the temperature distribution was found to be very homogeneous, which is expected due to the relatively small reactor diameter (2.2 cm). These observations led us to consider that the reactor operates under nearly isothermal conditions.
Concerning mass transfer, the gas velocity was varied between Umf and 2 × Umf, and the impact on the product composition was found to be extremely low. This behavior was further confirmed by calculations of both the internal and external mass transfer limitations. Specifically, the effectiveness factor for a slab-shaped geometry (η), calculated using the Thiele modulus, was found to be close to 1, and the Weisz–Prater criterion (Cwp = 9.49 × 10⁻⁴) indicated the absence of internal diffusion limitations. Similarly, the overall effectiveness factor (Ω = 1) showed that external diffusion was not limiting under the studied conditions (for more details, the reader is referred to the Appendix A).
3.1. Effect of Gasification Temperature on Biochar Consumption
Temperature plays an important role in the Boudouard reaction (Equation (1)) and the formation of carbon monoxide (all key equations and reactions are summarized in the Appendix A). This reaction is favored by an increase in temperature. The reaction equilibrium is varied due to the Van ’t Hoff and le Chatelier laws, which claim that an increase in temperature partially moves the reaction equilibrium in the forward direction, increasing its heat requirement. The reaction becomes more exergonic following this principle, which implies that the Gibbs free energy becomes more negative [48].
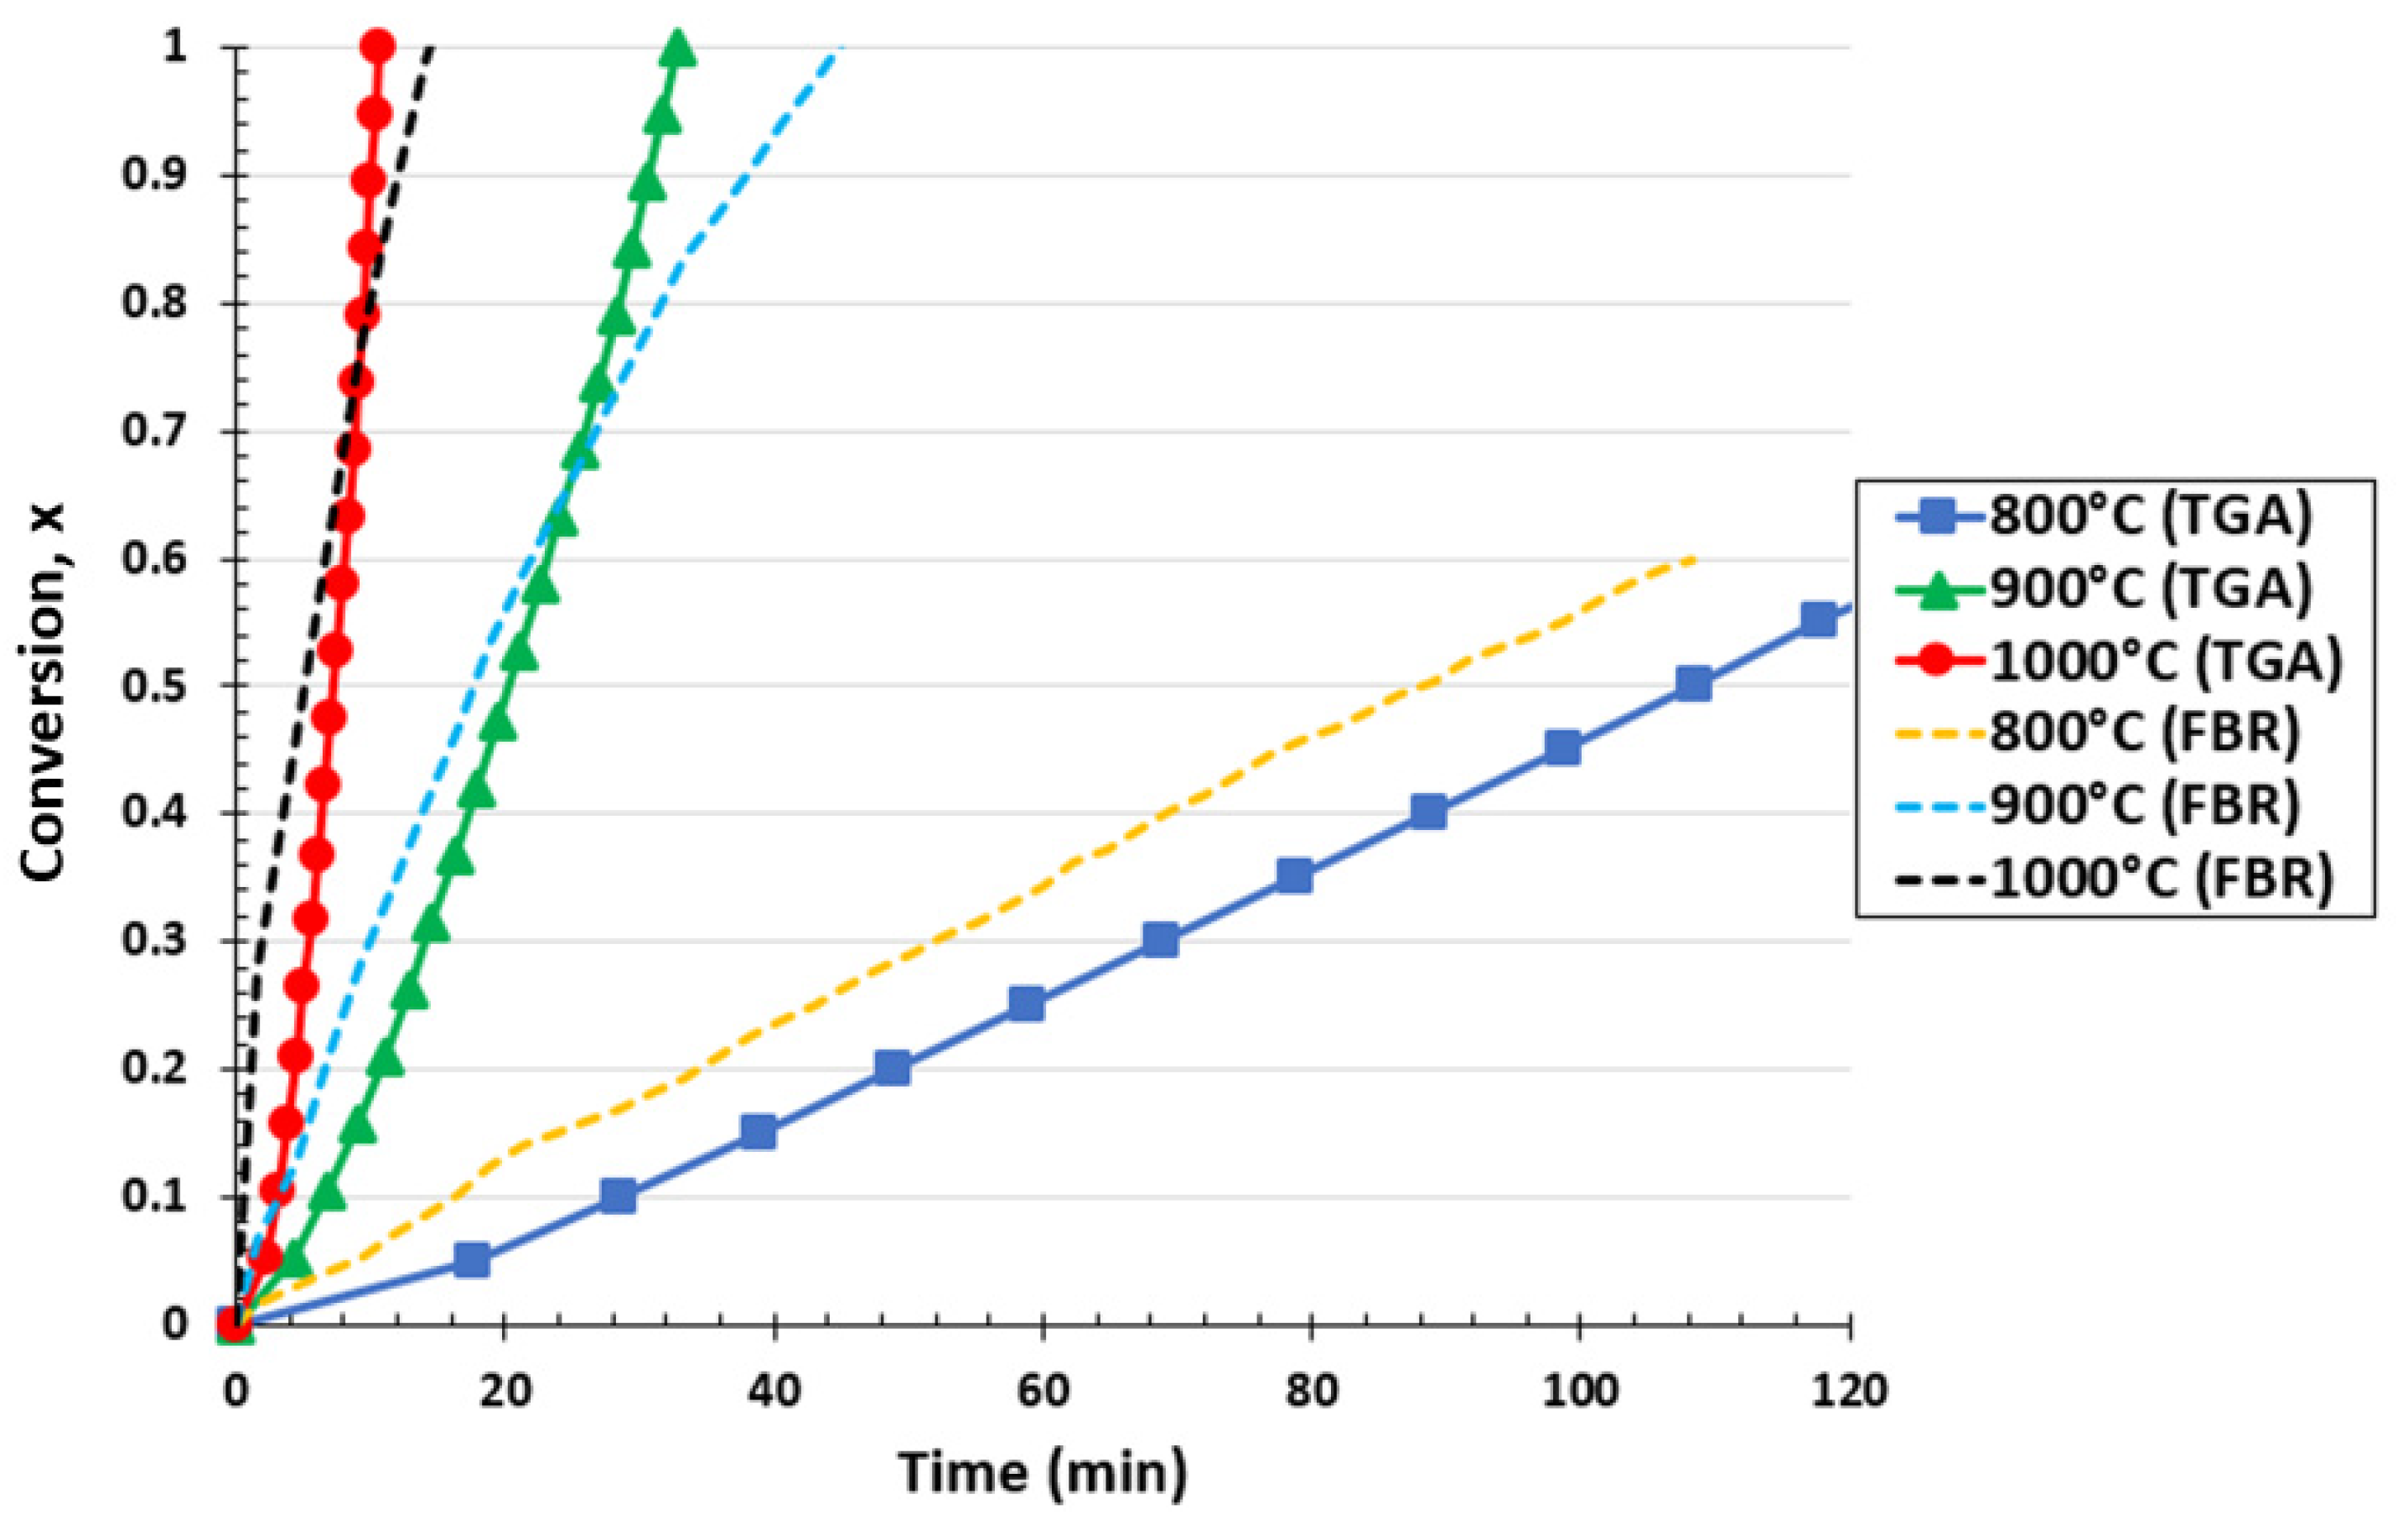
Figure 2 shows the effect of temperature from 800 °C to 1000 °C on biochar conversion for the thermogravimetric analyzer and fluidized bed reactor at a partial pressure of 0.67 atm. It can be observed for the TG analyzer that the required biochar conversion time decreased as the temperature increased. Only 56% of biochar conversion into CO molecules was obtained at 800 °C for a reaction time of 120 min, highlighting the high heat requirements of the Boudouard reaction. However, by increasing the temperature to 900 and 1000 °C, the total conversion of biochar was reached at 32.9 min and 10.7 min, respectively. Therefore, the temperature rise shifted the reaction equilibrium, promoting the conversion of biochar samples. Similar behavior was observed in the literature, confirming the obtained results [49,50]. Kumar et al. [51] concluded that increasing the gasification temperature favored faster reaction kinetics, as described by the Arrhenius equation. Analogous results were obtained in the case of the fluidized bed reactor. A biochar conversion of 60% was reached after approximately 110 min at 800 °C, while the required time for total conversion decreased to 46.5 and 17.1 min for a temperature of 900 °C and 1000 °C, respectively.
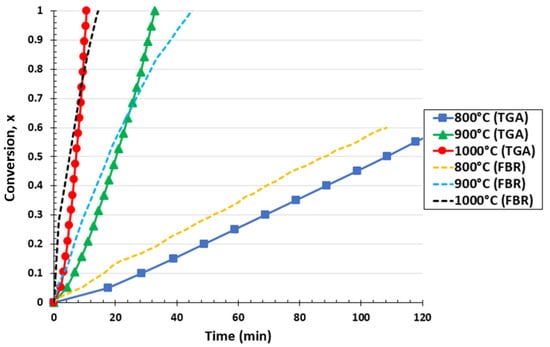
Figure 2.
Effect of reaction temperature on biochar conversion for the TGA and FBR at a pressure 0.67 atm and CO2/C ratio of 7.05.
By comparing both setups at 800 °C, it was observed that the fluidized bed reactor showed a more rapid conversion curve than the one obtained from the TGA reactor. The FBR has better mixing conditions than the TGA (which might be assimilated into a fixed bed reactor). In this case, external heat and mass transfer limitations could, potentially, be less affected in the FBR than in the TGA. Meanwhile, it can be seen that for approximately 65–75% of biochar conversion at 900 °C and 1000 °C, the biochar consumption curve of the FBR intercepted the one obtained with the TGA. This means that over this conversion range, the conversion was faster in the TGA than in the FBR, i.e., the biochar conversion rate is reduced in the FBR compared to in the TGA. This can be explained by the fact that a higher formation of CO was achieved in the FBR in the first 5 and 20 min for 900 °C and 1000 °C, respectively, which could have sequentially inhibited the reaction by provoking a stagnation of biochar consumption [52,53]. The presence of CO can inhibit the Boudouard reaction [54] according to the Langmuir–Hinshelwood mechanism.
Moreover, Mueller et al. [37] used identical conditions for wood biochar as in this investigation to compare the gasification rates for the TGA and FBR. They also observed that the FBR and TGA conversion curves intercepted at higher conversion levels (about 75 to 90%), indicating that the mixing benefits of the FBR diminished as conversion increased. Furthermore, it was also reported that the gasification rate maximum was achieved faster with the FBR than with the TGA, as observed in our work. Zeng et al. [55] asserted that a fluidized bed gasifier was faster than a thermogravimetric analyzer in achieving the maximal gasification reactivity. The reason why both curves were intercepted at lower conversion rates in our investigation might be the delay in the gas chromatography detection time. In contrast to earlier research that used more precise technology, such as FTIR (Fourier transform infrared) and real-time gas plot chromatography, in this study, each FBR result was generated every two to three minutes.
The agglomeration phenomenon is another element that might have affected the amount of biochar consumed in the fluidized bed reactor. Biochar ash contains alkali metals, which can fuse with sand at high temperatures to create agglomerates, inducing defluidization and mass and heat transmission limits [56]. According to Lardier et al. [57], silicate formation for lignocellulosic biochar often occurs at temperatures between 800 °C and 1000 °C [58]. Because it takes longer for the gas to interpenetrate the particle, this results in an increase in the external mass transfer characteristic time for gasification.
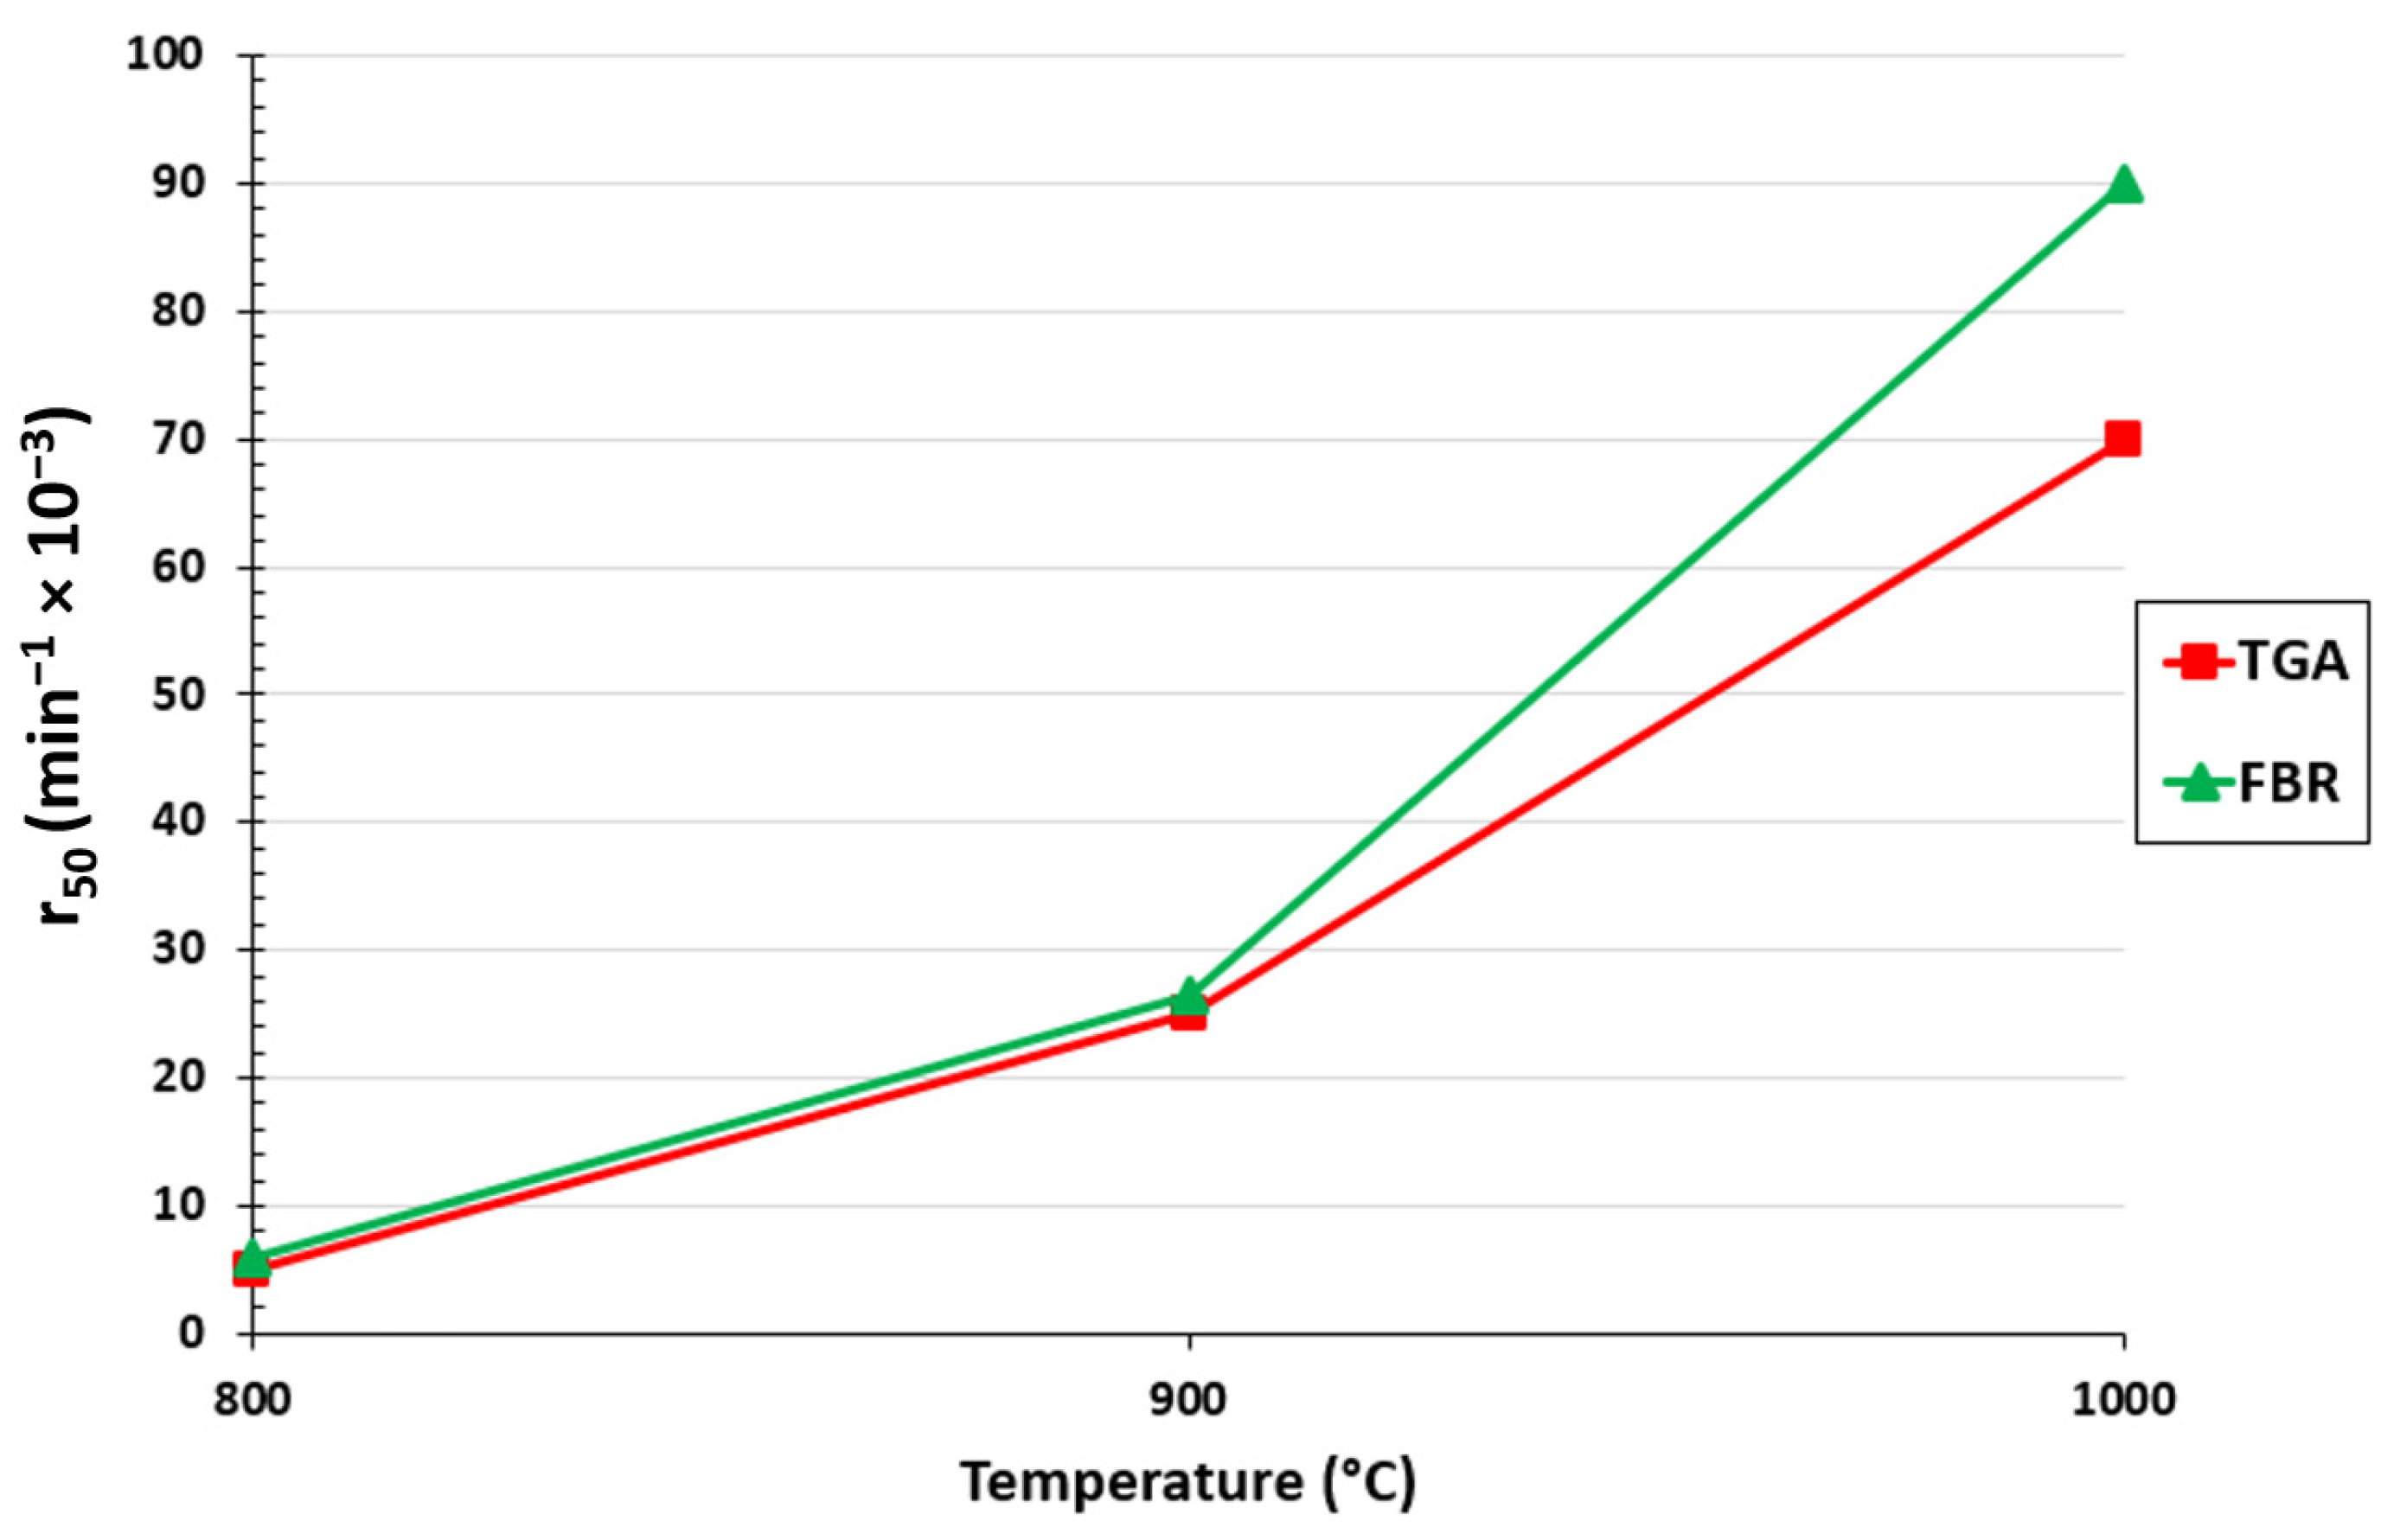
The gasification rate for the TGA and FBR at 50% conversion for each measured temperature is shown in Figure 3. As anticipated, it can be seen that the gasification rate increased for both setups as the temperature rose. It is evident by comparing the TGA and FBR that at 800 and 900 °C the difference between each setup was marginally better for the FBR than for the TGA. The difference was more pronounced at 1000 °C, where a 23% difference between the two setups was calculated. In contrast to the TGA, which replicated fixed bed gasifiers on a small scale, the results demonstrate the speed at which biochar conversion was accomplished under the mixing conditions of fluidized bed gasifiers.

Figure 3.
Effect of temperature on r50 for the TGA and FBR at a pressure of 0.67 atm and CO2/C ratio of 7.05.
3.2. Effect of Partial Pressure on Biochar Consumption
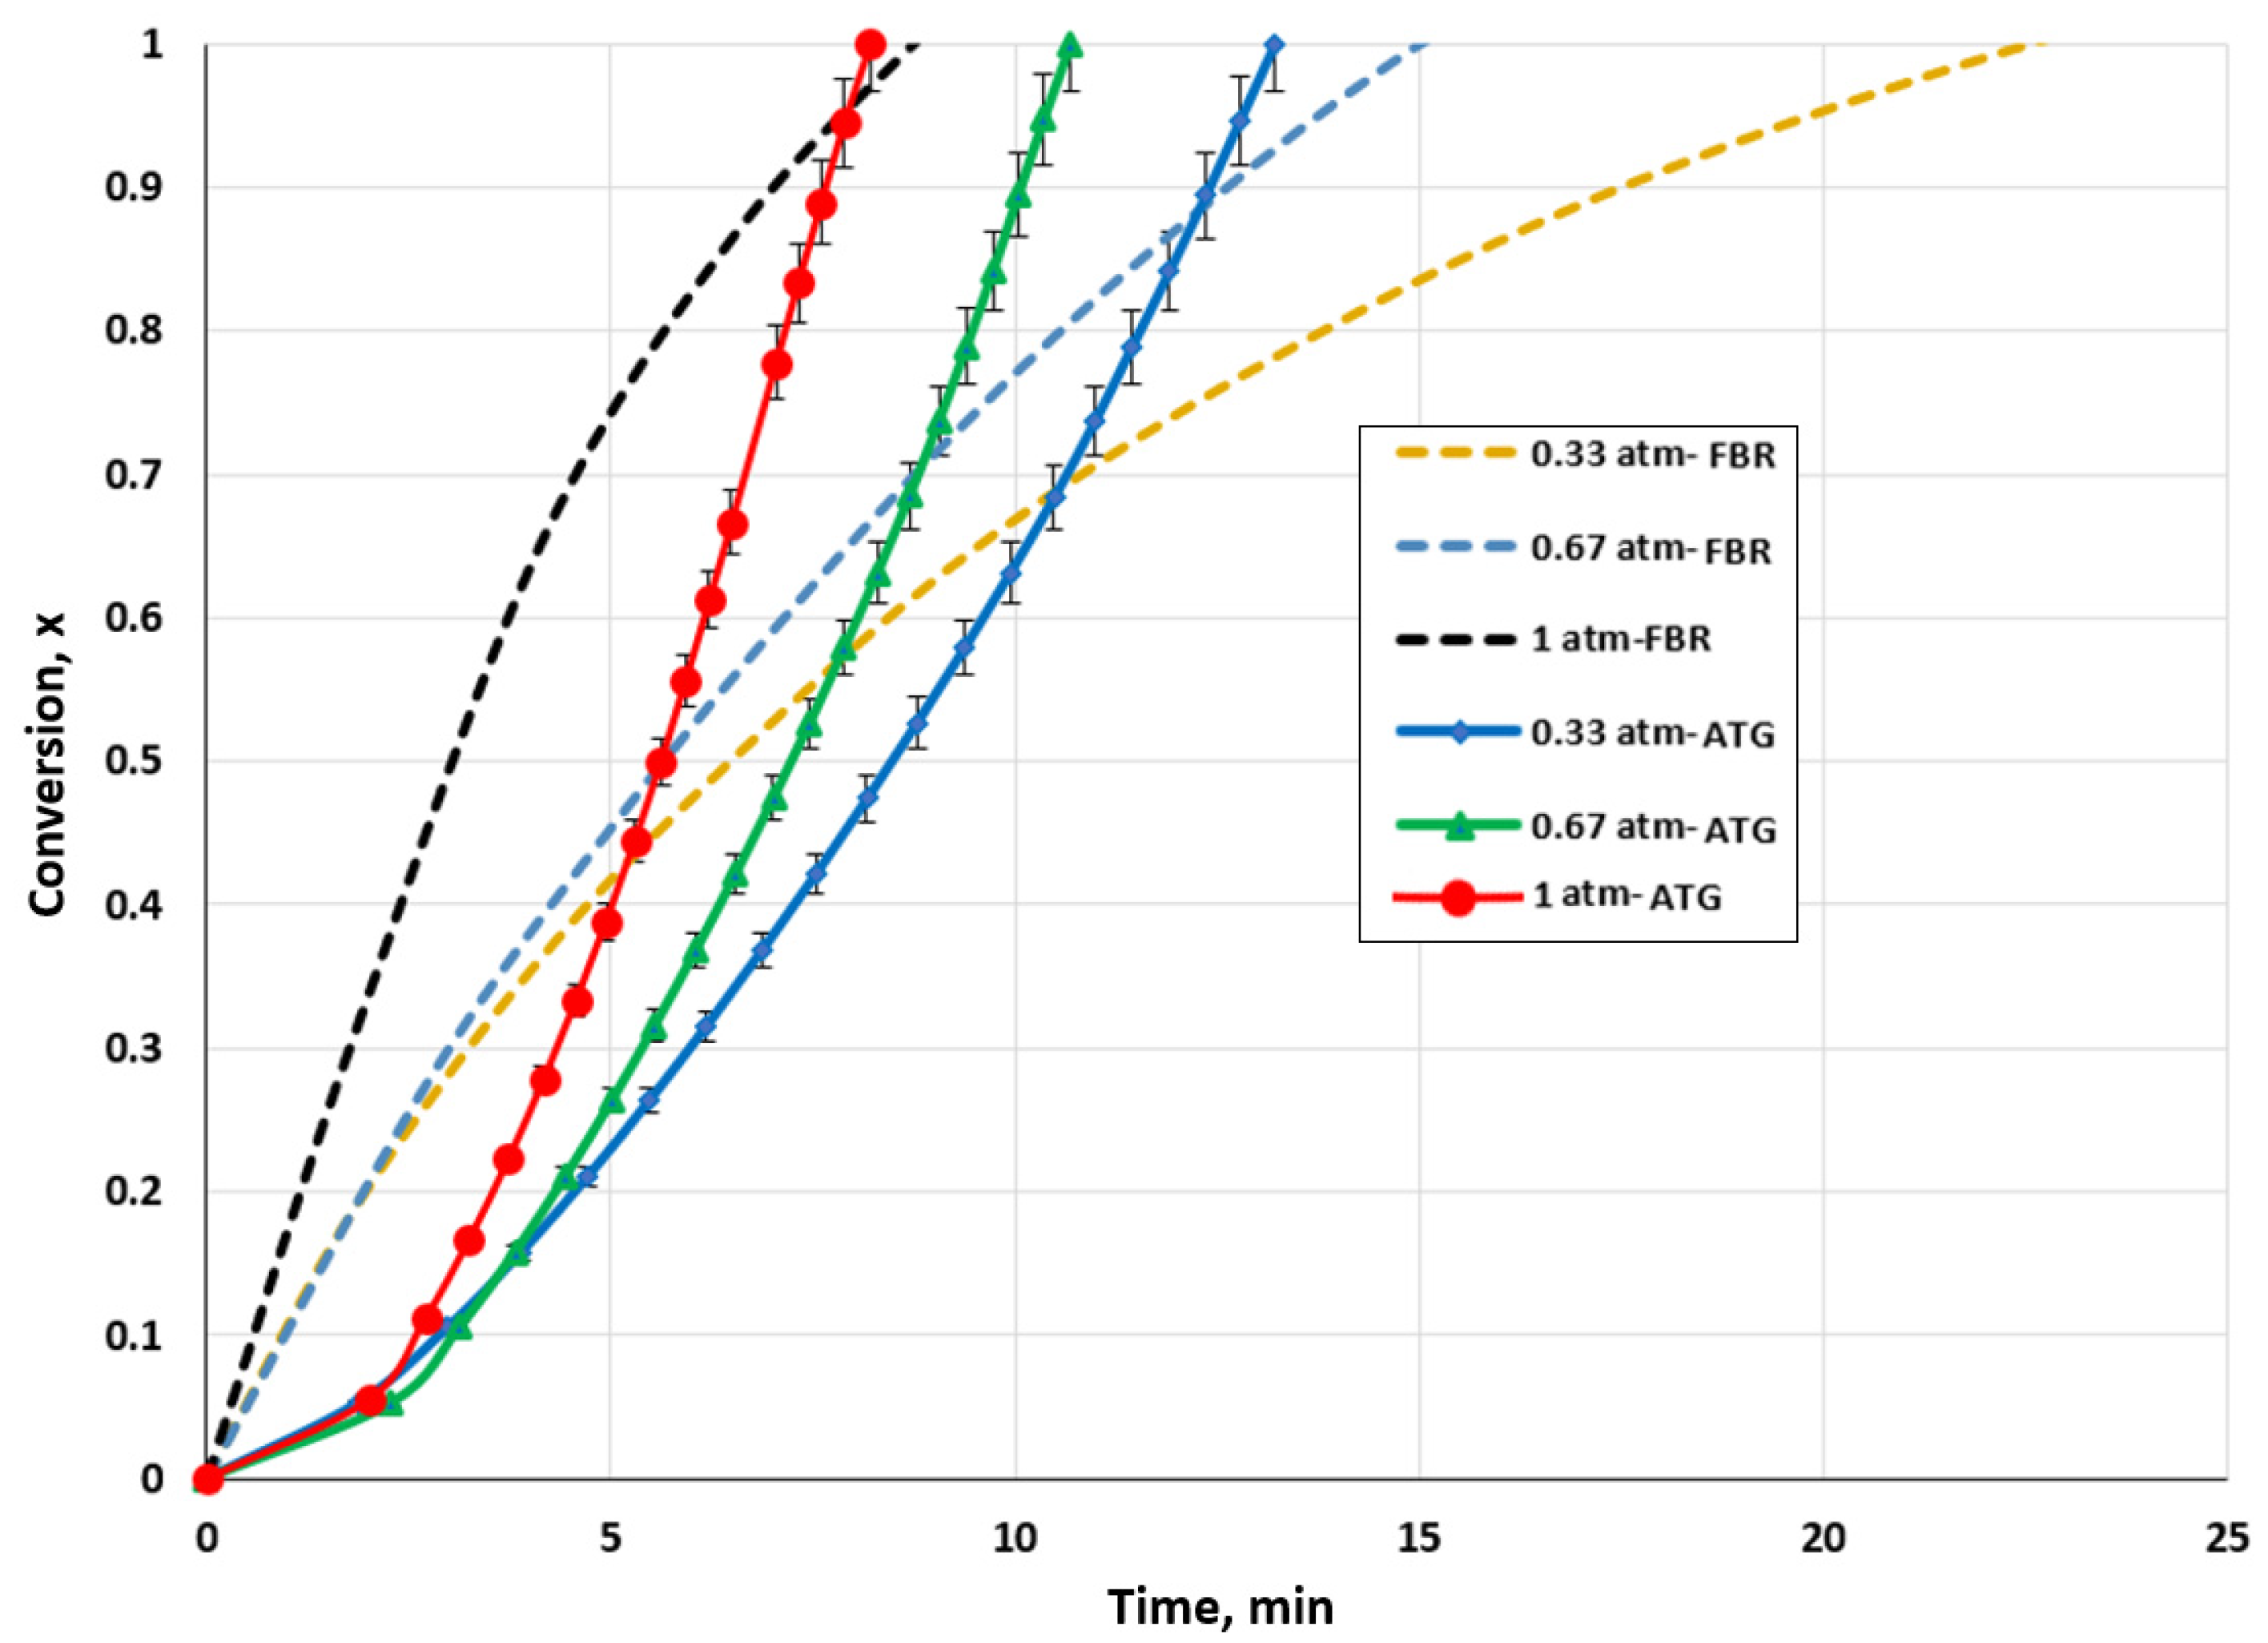
For both setups, the impact of the CO2 partial pressure on biochar conversion was examined. To assess its impact on biochar consumption, the CO2 pressure was varied between 0.33 and 1 atm. The impact of the CO2 partial pressure on the gasification rate of biochar is presented in Figure 4. It is evident that the reaction rate was changed by varying the CO2 pressure. The time needed for the complete conversion of the biochar decreased as the partial pressure of CO2 was raised for both setups.

Figure 4.
Effect of CO2 partial pressure for the TGA and FBR on biochar conversion at a temperature of 1000 °C and CO2/C ratio of 7.05.
For the TGA, the total conversion time decreased from 13.21 to 8.21 min when the pressure was increased from 0.33 to 1 atm. For the fluidized bed gasifier, the conversion time was lowered from 23.71 min to 9.02 min. The conversion of biochar into CO was favored by the increase in the CO2 partial pressure, as the reaction rate increased. An alternative explanation would be that a greater concentration gradient caused by the rising CO2 pressure drove the agent to enter the biochar pores more quickly, favoring the heterogenous reaction. Sajjadi et al. [59] linked this process to bulk diffusion.
It is evident by comparing the results for the TGA and FBR that identical behavior to that discussed in Section 3.1 was observed. For conversion values below 70% to 95%, the FBR demonstrated a faster gasification rate than the TGA. Due to the significant production of CO, the maximum gasification rate in the FBR could have been reached faster than that in the TGA. However, this high production could be a reaction inhibition, which would have decreased the FBR reaction rate. Additionally, agglomerations in the FBR might have favored the increase in diffusional constraints.
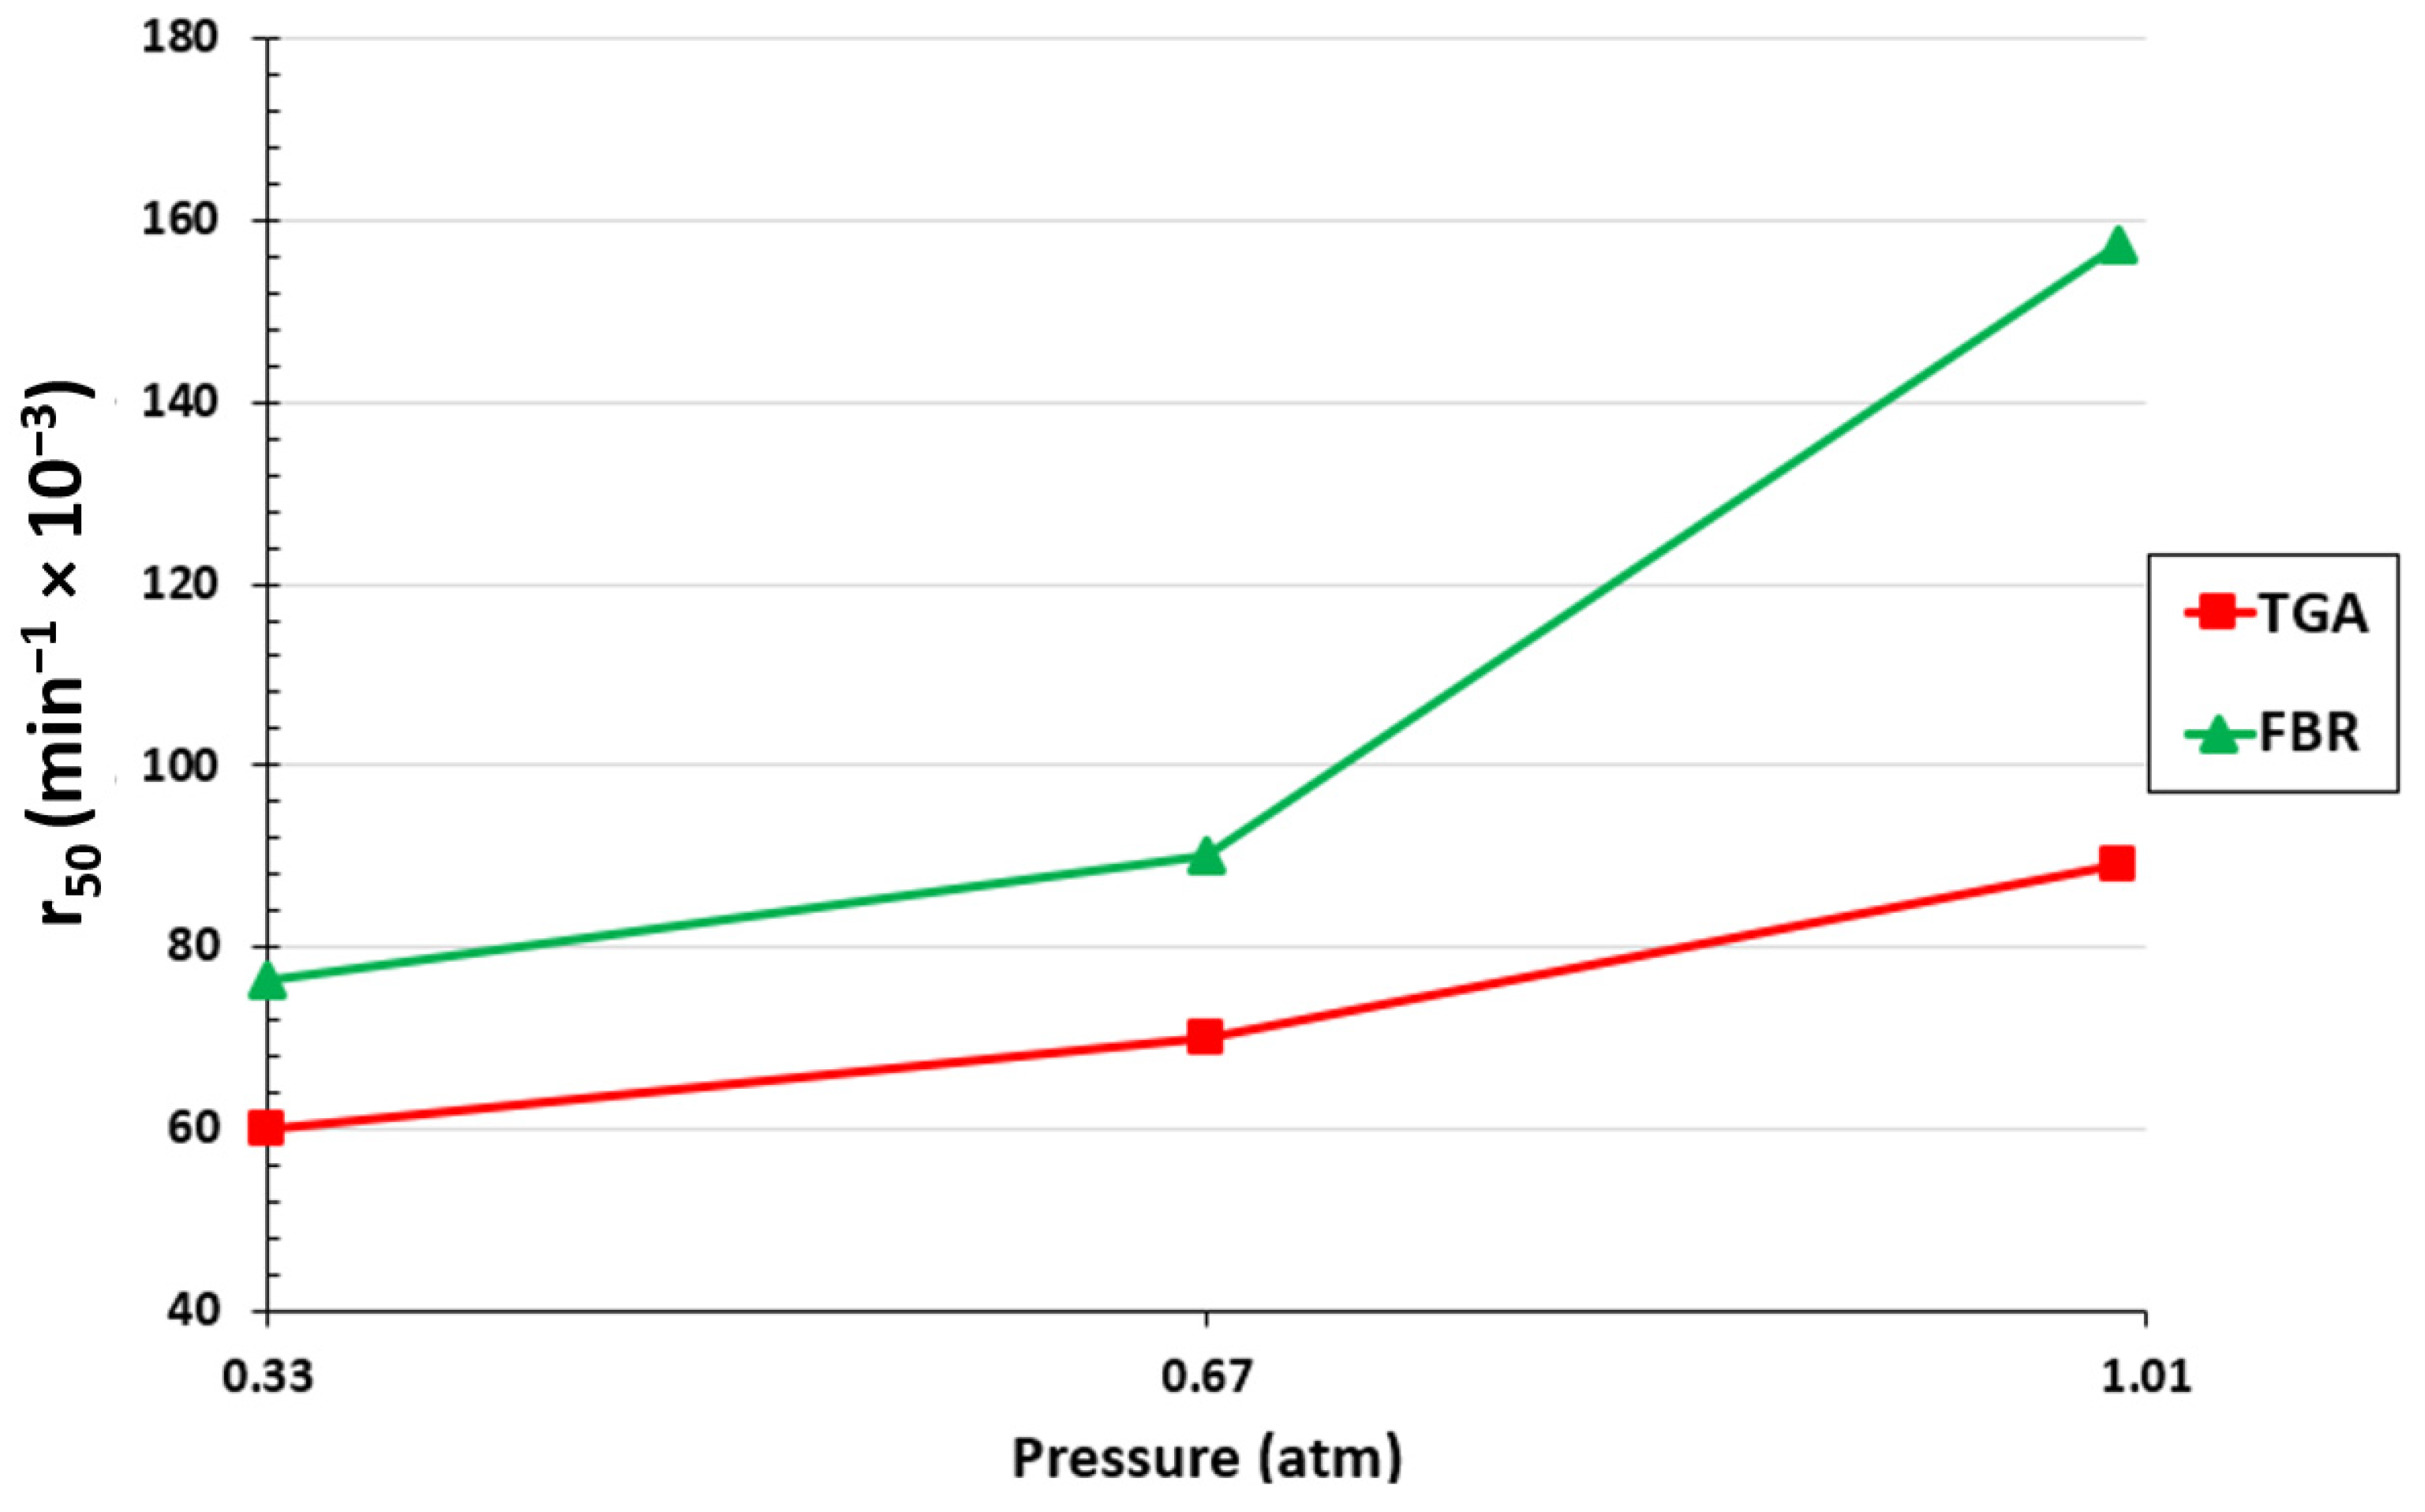
At a 50% biochar conversion, the reaction rate was also assessed for both setups. The results are displayed in Figure 5. It is evident that for both configurations, an increase in the partial pressure of CO2 in the volumetric flow entering the reactor led to an increase in the gasification rate. With the increase in the CO2 partial pressure from 0.33 atm to 1 atm, r50 increased from 0.06 to 0.089 min−1 for the TGA and from 0.076 to 0.157 min−1 for the FBR. As can be observed, a higher reaction rate is obtained with the FBR due to better mass and heat transfer conditions.
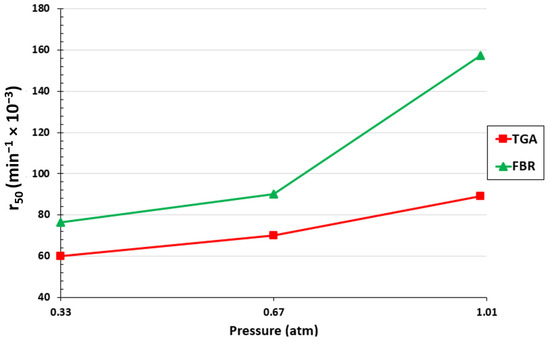
Figure 5.
Effect of CO2 partial pressure on r50 for the TGA and FBR at a temperature of 1000 °C and CO2/C ratio of 7.05.
3.3. Effect of CO2/C Ratio on Biochar Consumption
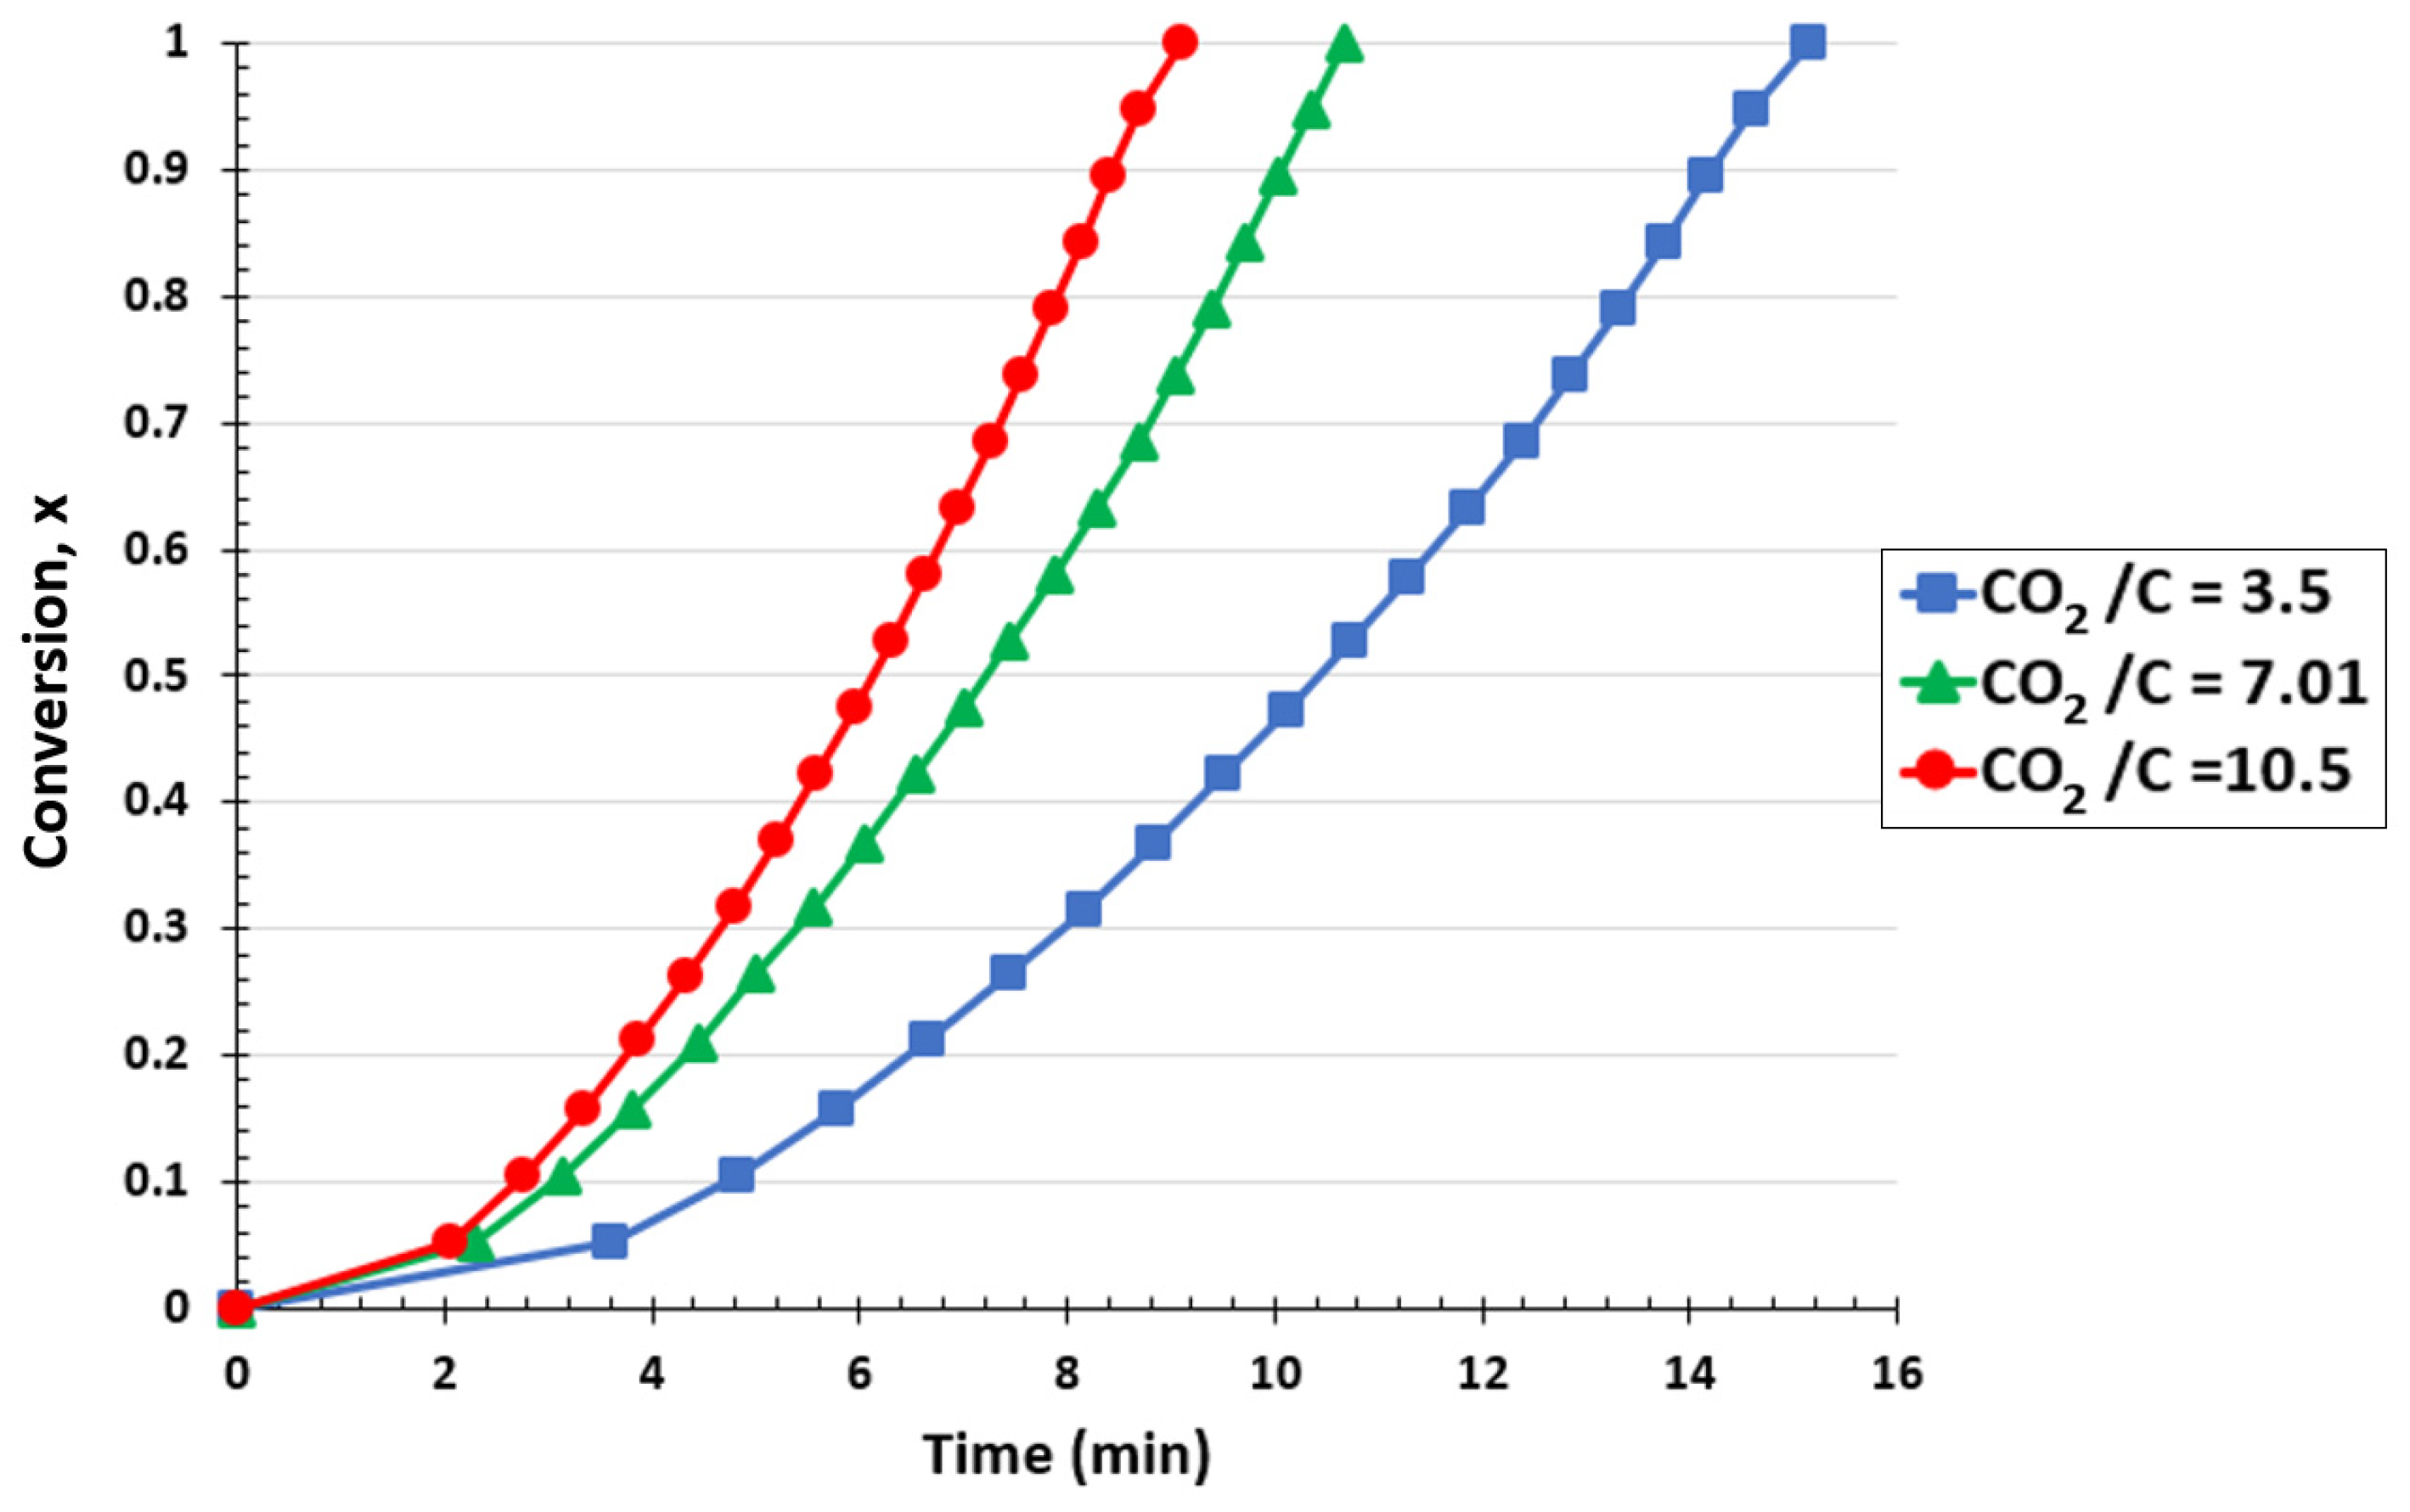
Three ratios (3.50, 7.01, and 10.50) were selected for this investigation. The CO2/C ratio was calculated at 1000 °C by fixing the amount of char, 7 mg for the TGA and 100 mg for the FBR, and varying the CO2 flow rate from 50 to 150 mL/min for the TGA and 713 to 2142 mL/min for the FBR. It is important to note that the goals of this study were to assess the impact of the CO2 volumetric flow on biochar conversion in the TGA and to compare the outcomes with those of the FBR under the same ratio and conditions.
The impact of the CO2/C ratio in the TGA at 1000 °C is shown in Figure 6. Raising the CO2/C ratio, which corresponds to increasing the CO2 flow rate, accelerated the overall conversion of biochar. Converting the biochar into syngas required 15.15 min for a CO2/C ratio of 3.5. However, this time was lowered to 9.1 min when the molar ratio was increased to 10.5. As can be seen, the conversion of biochar into CO was favored by raising the gasification ratios. Increased CO2 rates favored the formation of CO by removing the products from the reaction zone and carrying the reaction ahead [60]. The biochar conversion rates rose as a result of the quick removal of CO from the process, which reduced the inhibition of the Boudouard reaction and promoted the production of additional CO molecules. The FBR showed similar behavior, supporting the TGA findings.
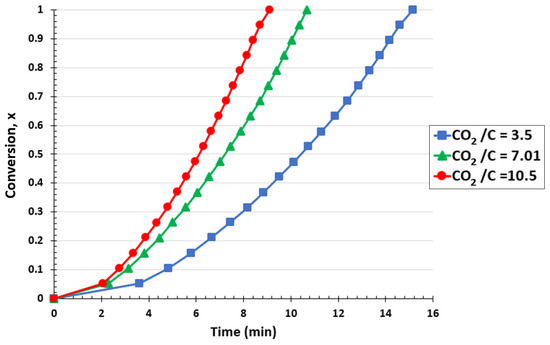
Figure 6.
Effect of CO2/C ratio on biochar conversion for the TGA at a temperature of 1000 °C and CO2 pressure of 0.67 atm.
4. Kinetic Modeling
For the kinetic study of the reaction between biochar particles and CO2, the reaction rate of gasification or the variation in the biochar conversion with time is expressed in Equation (7).
where k(T), PCO2, and n are the apparent reaction rate constant, CO2 partial pressure, and reaction order, respectively. The variable f(x) is a function that depends on the biochar conversion mechanism and describes the evolution in chemical or physical profiles throughout the heterogeneous reaction.
According to the literature [61], k(T) depends on the reaction temperature and can be expressed with the Arrhenius equation as follows:
where A0, Ea, R, and T are the pre-exponential factor, the apparent activation energy, the universal gas constant, and the reaction temperature, respectively.
By combining Equations (7) and (8), the following equation is obtained. It represents the gasification reaction rate as a function of the conversion of biochar.
There are various mathematical models that can be used to represent the dependent conversion function f(x). Because the evolution of biochar conversion depends on a variety of elements, including structure, porosity, physical and chemical properties, gasification agent, and others, the choice of f(x) is somewhat arbitrary and complex. After testing a number of models, three types were chosen for this investigation based on the best fitting results obtained. The volumetric model (VM), shrinking core model (SCM), and power-law model (PLM) are the models employed.
4.1. Kinetic Models Studied
4.1.1. Volumetric Model (VM)
This model is based on the hypothesis that the char particles undergo a quasi-homogeneous reaction and that solid particles do not suffer structural changes during gasification. Therefore, Equation (9) becomes as follows:
4.1.2. Shrinking Core Model (SCM)
According to this model, the heterogeneous reaction occurs on the particle’s surface, which is considered to be spherical [62]. An ash layer remains in the reactor at the end of the reaction, indicating that all of the carbonaceous matter has been consumed. The gasification rate equation can now be stated as follows:
4.1.3. Power-Law Model (PLM)
Power-law models are empirical mathematical correlations without any defined physical interpretation. These models are typically employed to account for the conversion profiles of biochar that cannot be described by other models like random pore, shrinking core, and volumetric models. Therefore, an appropriate reactivity evolution of heterogeneous processes is provided by power-law models [63]. In this case, the function f(x) can be written as follows:
where a and b are the coefficient and exponential order of the power-law model found empirically.
By substituting Equation (12) into Equation (9), the following equation is obtained:
Volumetric and diminishing core models are decelerator models, which show a drop in the reaction rate with conversion. On the other hand, power-law models, without any defined path, can be both decelerator and extremely quick models based on mathematical fitting with the rate of gasification.
The mathematical analysis of the experimental reaction rate curve is a common procedure for choosing kinetic models for heterogeneous reactions involving solid particles and gaseous components. Vyazovkin et al. [39] proposed an adaptation of the reaction models for solids under isothermal conditions, in which every kinetic model presents a distinct curve form. The plots can be found in Figure A1 in the Appendix A. Therefore, by linking the gasification rate curve with the suggested mathematical model, kinetic models for solid decomposition can be selected and defined.
4.2. Kinetic Model for TGA
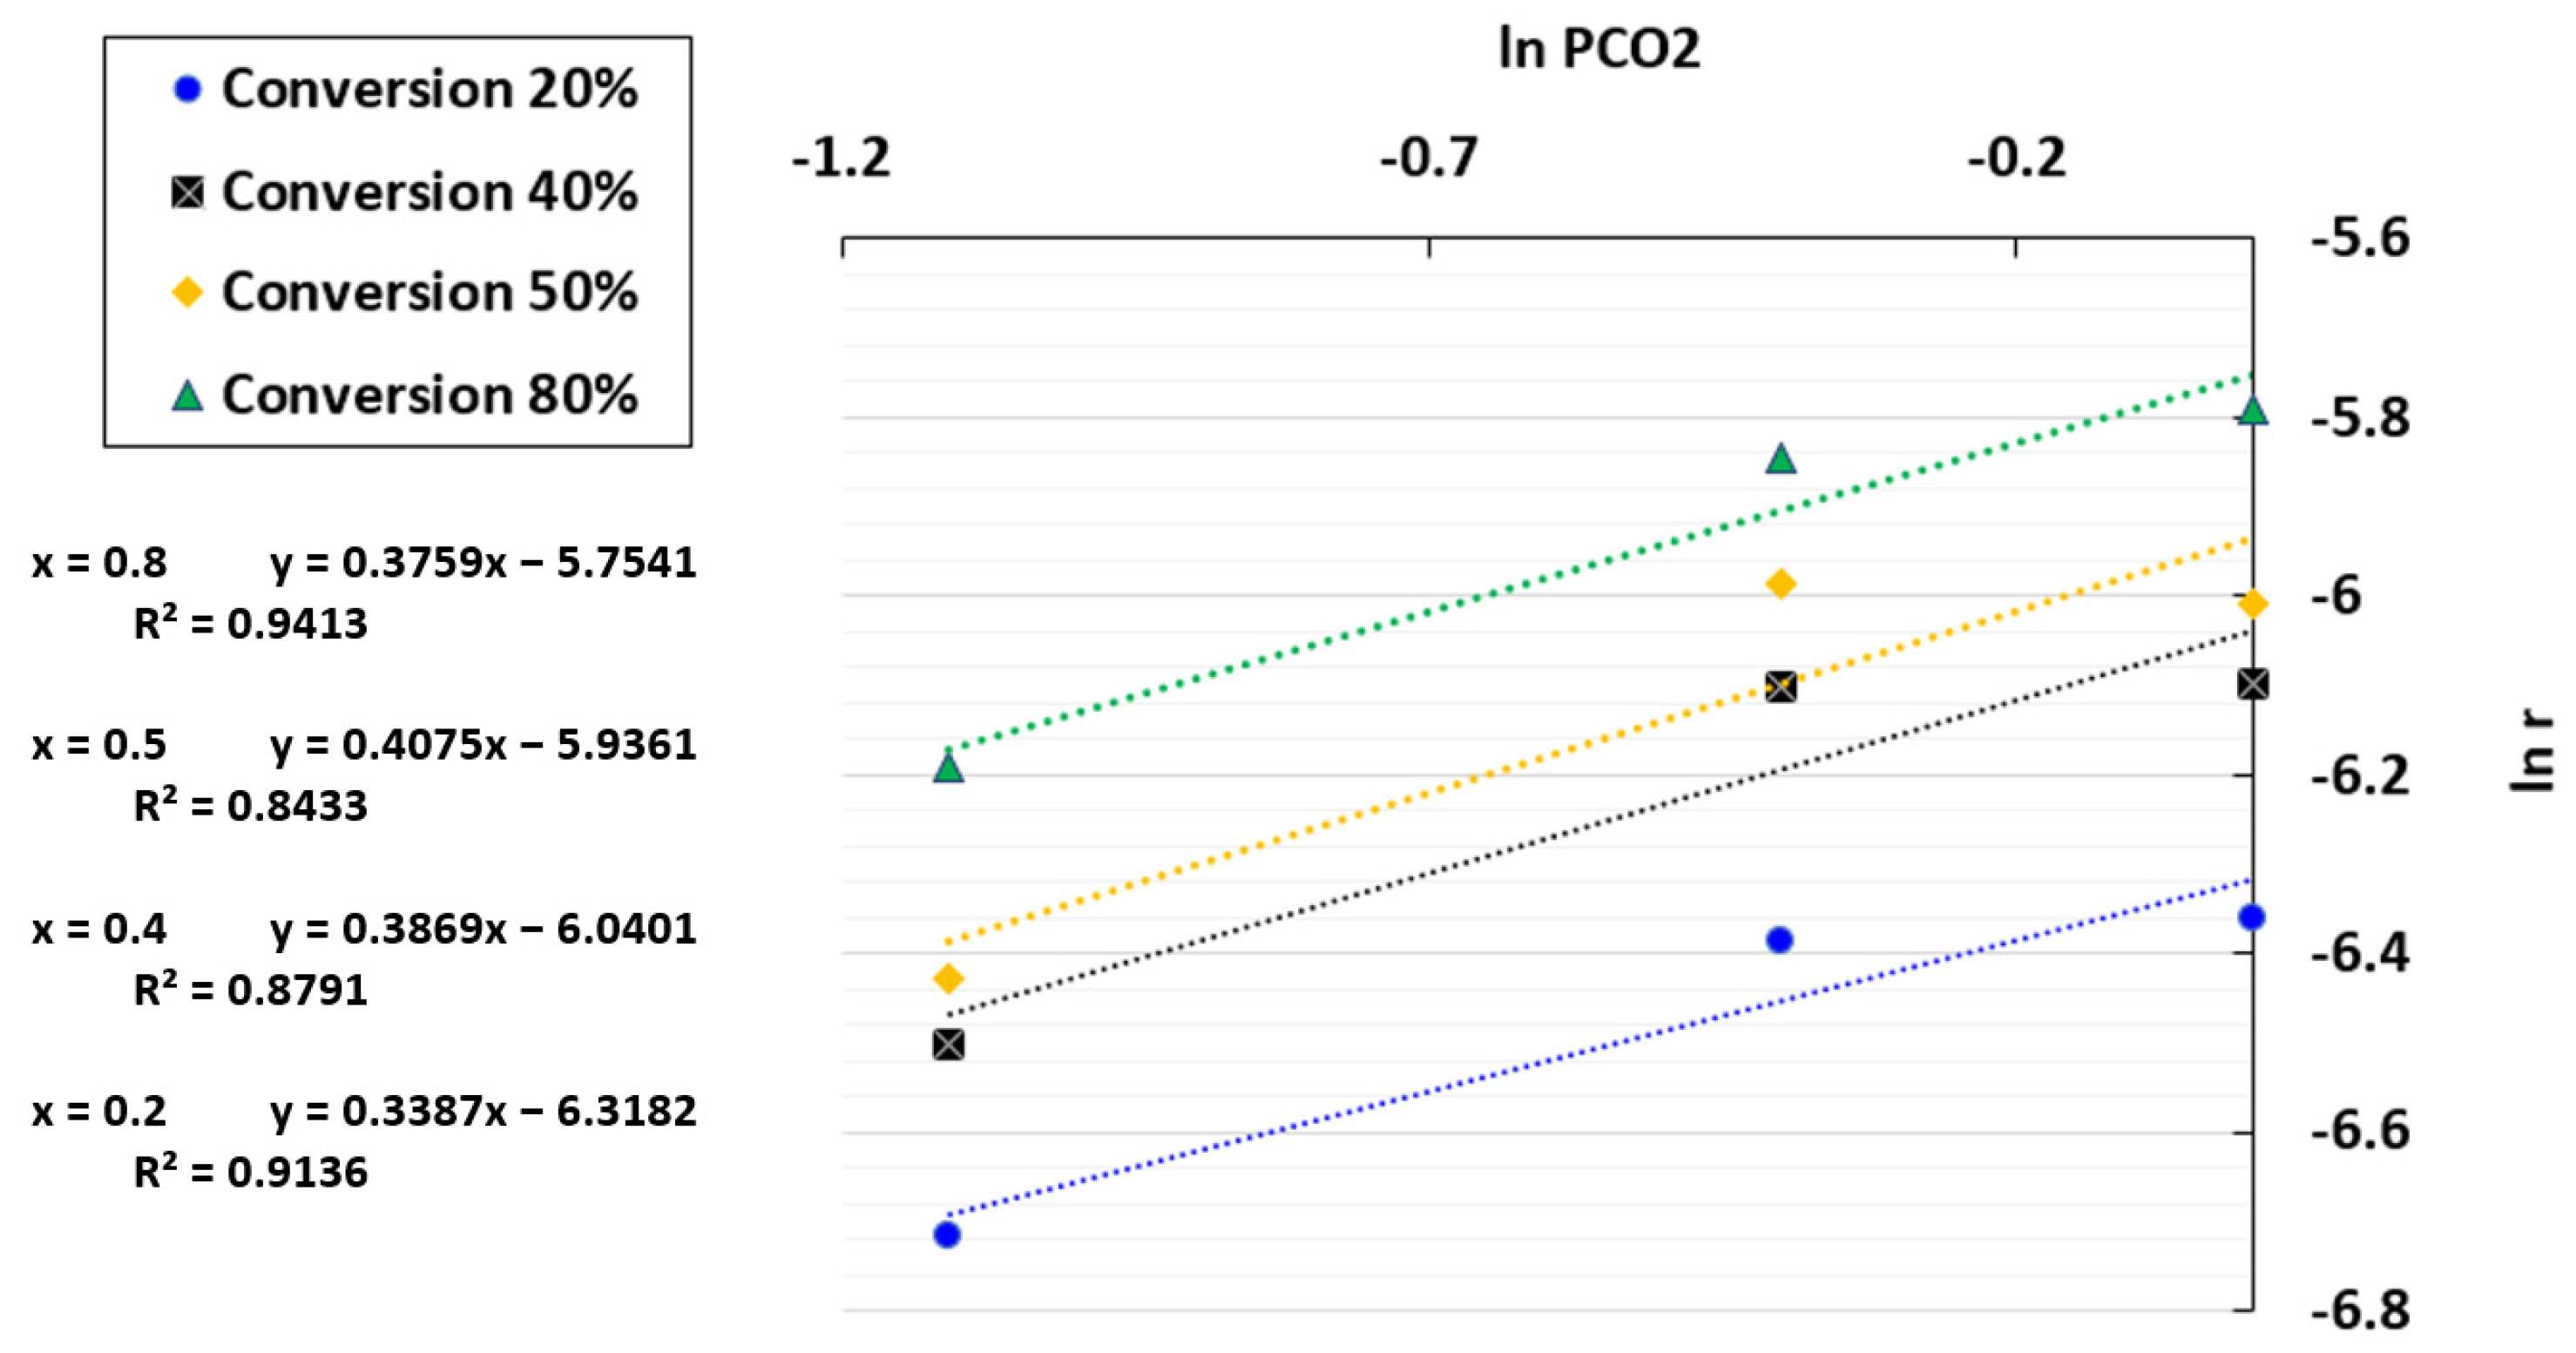
As stated earlier, three functions f(x) were examined in order to determine the best kinetic model for the TGA: the shrinking core model (1 − x)2/3, the volumetric model (1 − x), and the power-law model (2/3 x−1/2) [39]. Equation (7) was subjected to the natural logarithm to determine the order of the reaction.
By plotting ln r against ln PCO2, a linear regression was obtained where ln k(T) + ln f(x) and the reaction order n were determined based on the intercept and the slope, respectively. The plot of ln r versus the CO2 partial pressure is presented in Figure 7. The coefficients of determination (R2) obtained were between 0.8433 and 0.9413, indicating that the results are acceptable but not highly accurate. An average reaction order of 0.4 was selected since this fluctuated slightly with conversion, ranging from 0.38 to 0.41. The chosen order was consistent with the literature on char gasification in the TGA [64,65,66].
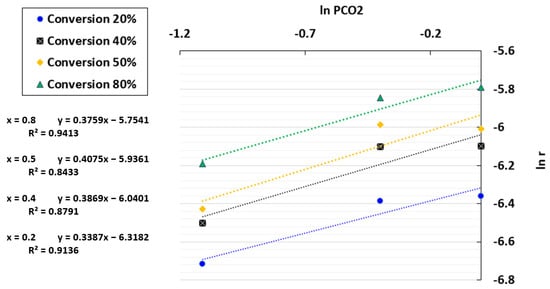
Figure 7.
Fitting results between ln r and ln PCO2 for the TGA at a temperature of 1000 °C and CO2/C ratio of 7.01.
Since the kinetic mechanism function of the biochar conversion f(x) was established, the kinetic parameters of the model had to be determined. The calculation of k(T) was accomplished by using the integral version of Equation (7). The obtained equations for the volumetric model, the shrinking core model, and the power-law model are, respectively, as follows:
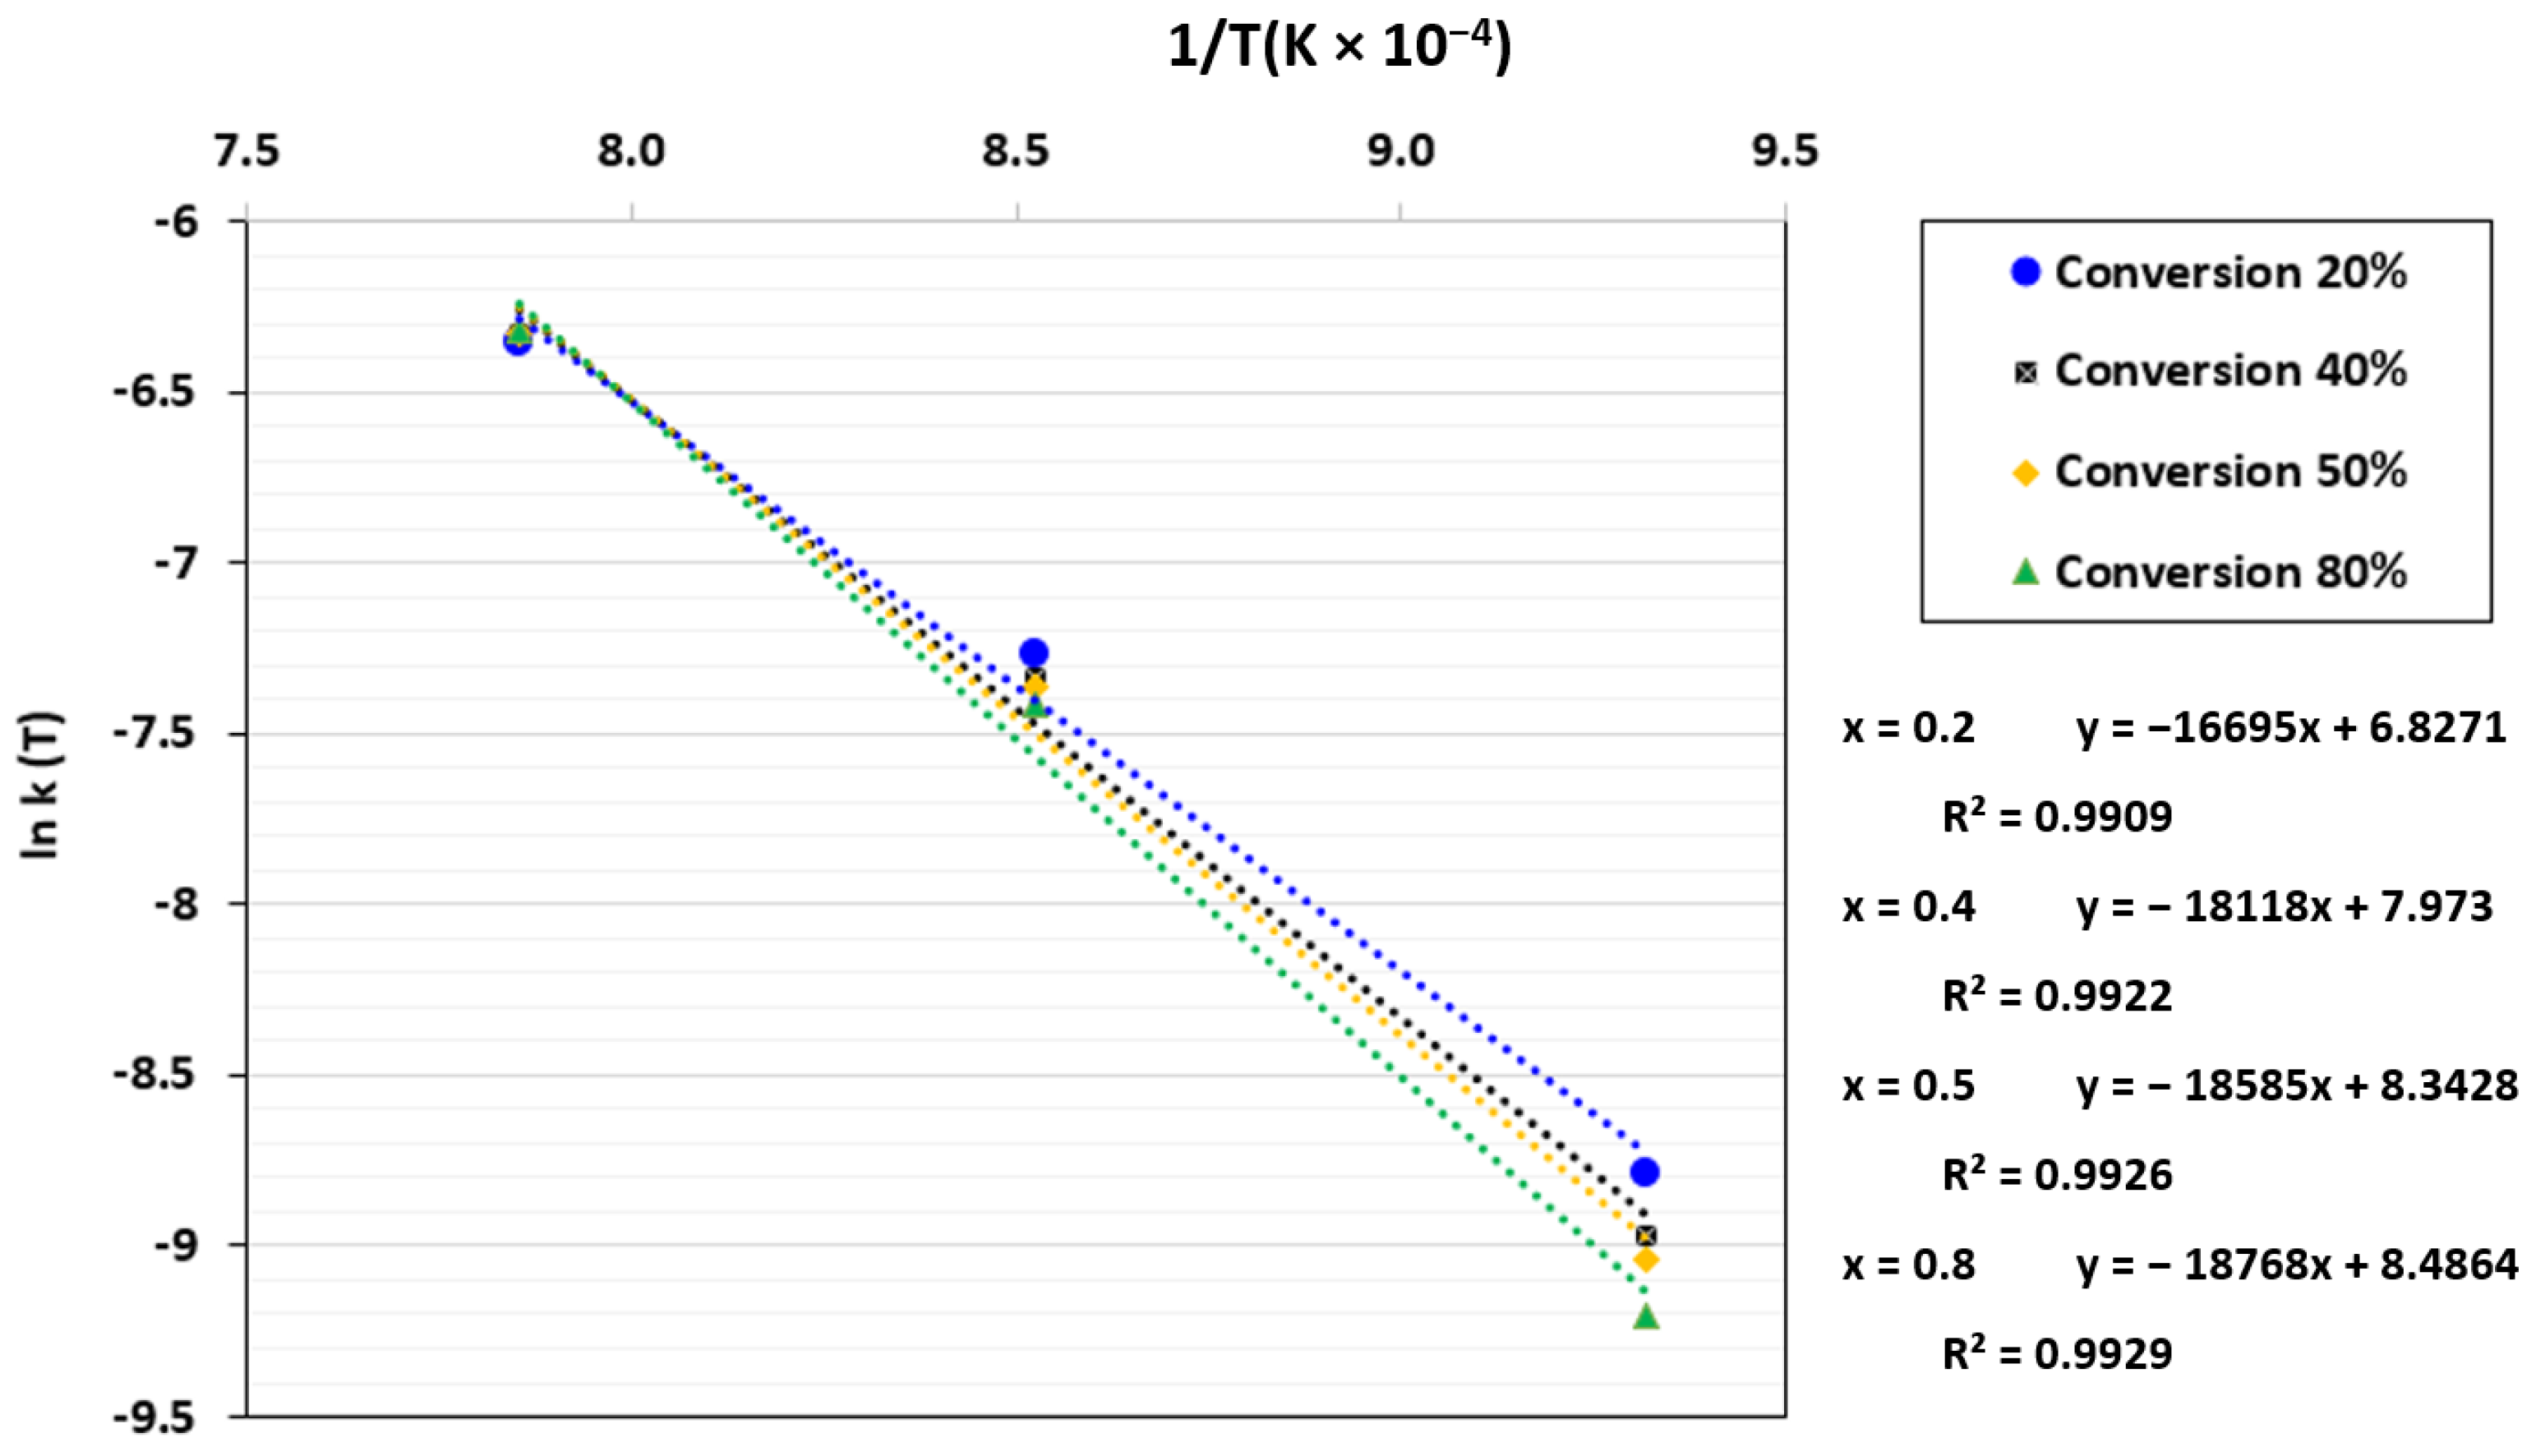
By applying the natural logarithm to both sides of the Arrhenius equation (Equation (8)), Equation (18) was obtained.
By plotting ln k(T) against 1/T, a linear regression was obtained where ln A0 and Ea/R were determined based on the intercept and the slope, respectively. The plot of ln k(T) against 1/T for the power-law model is displayed in Figure 8. As can be seen, Ea/R rose as the conversion increased, which indicates that the gasification rate gradually dropped. Sun et al. [67] have explained this phenomenon by the decrease in reactive sites with conversion, which leads to a reduction in char reactivity.
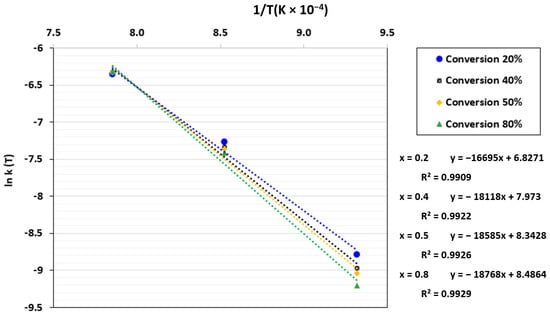
Figure 8.
ln k(T) as a function of 1/T for the TGA at a CO2 pressure of 0.67 atm and CO2/C ratio of 7.01.
The pre-exponential factor, apparent activation energy, and coefficient of determination obtained from the three kinetic models are displayed in Table 3. The estimated activation energies for the three chosen models were nearly identical, as shown in the table, which confirms that the calculations were accurate. Since the apparent activation energy is known to be independent of the kinetic model, this parameter was constant across all models. However, compared to the PLM, the coefficient of determination (R2) for the VM and SCM was lower. This suggests that the PLM could provide better fitting with the experimental data than the other models.
Table 3.
Kinetic parameters obtained for the three gasification models.
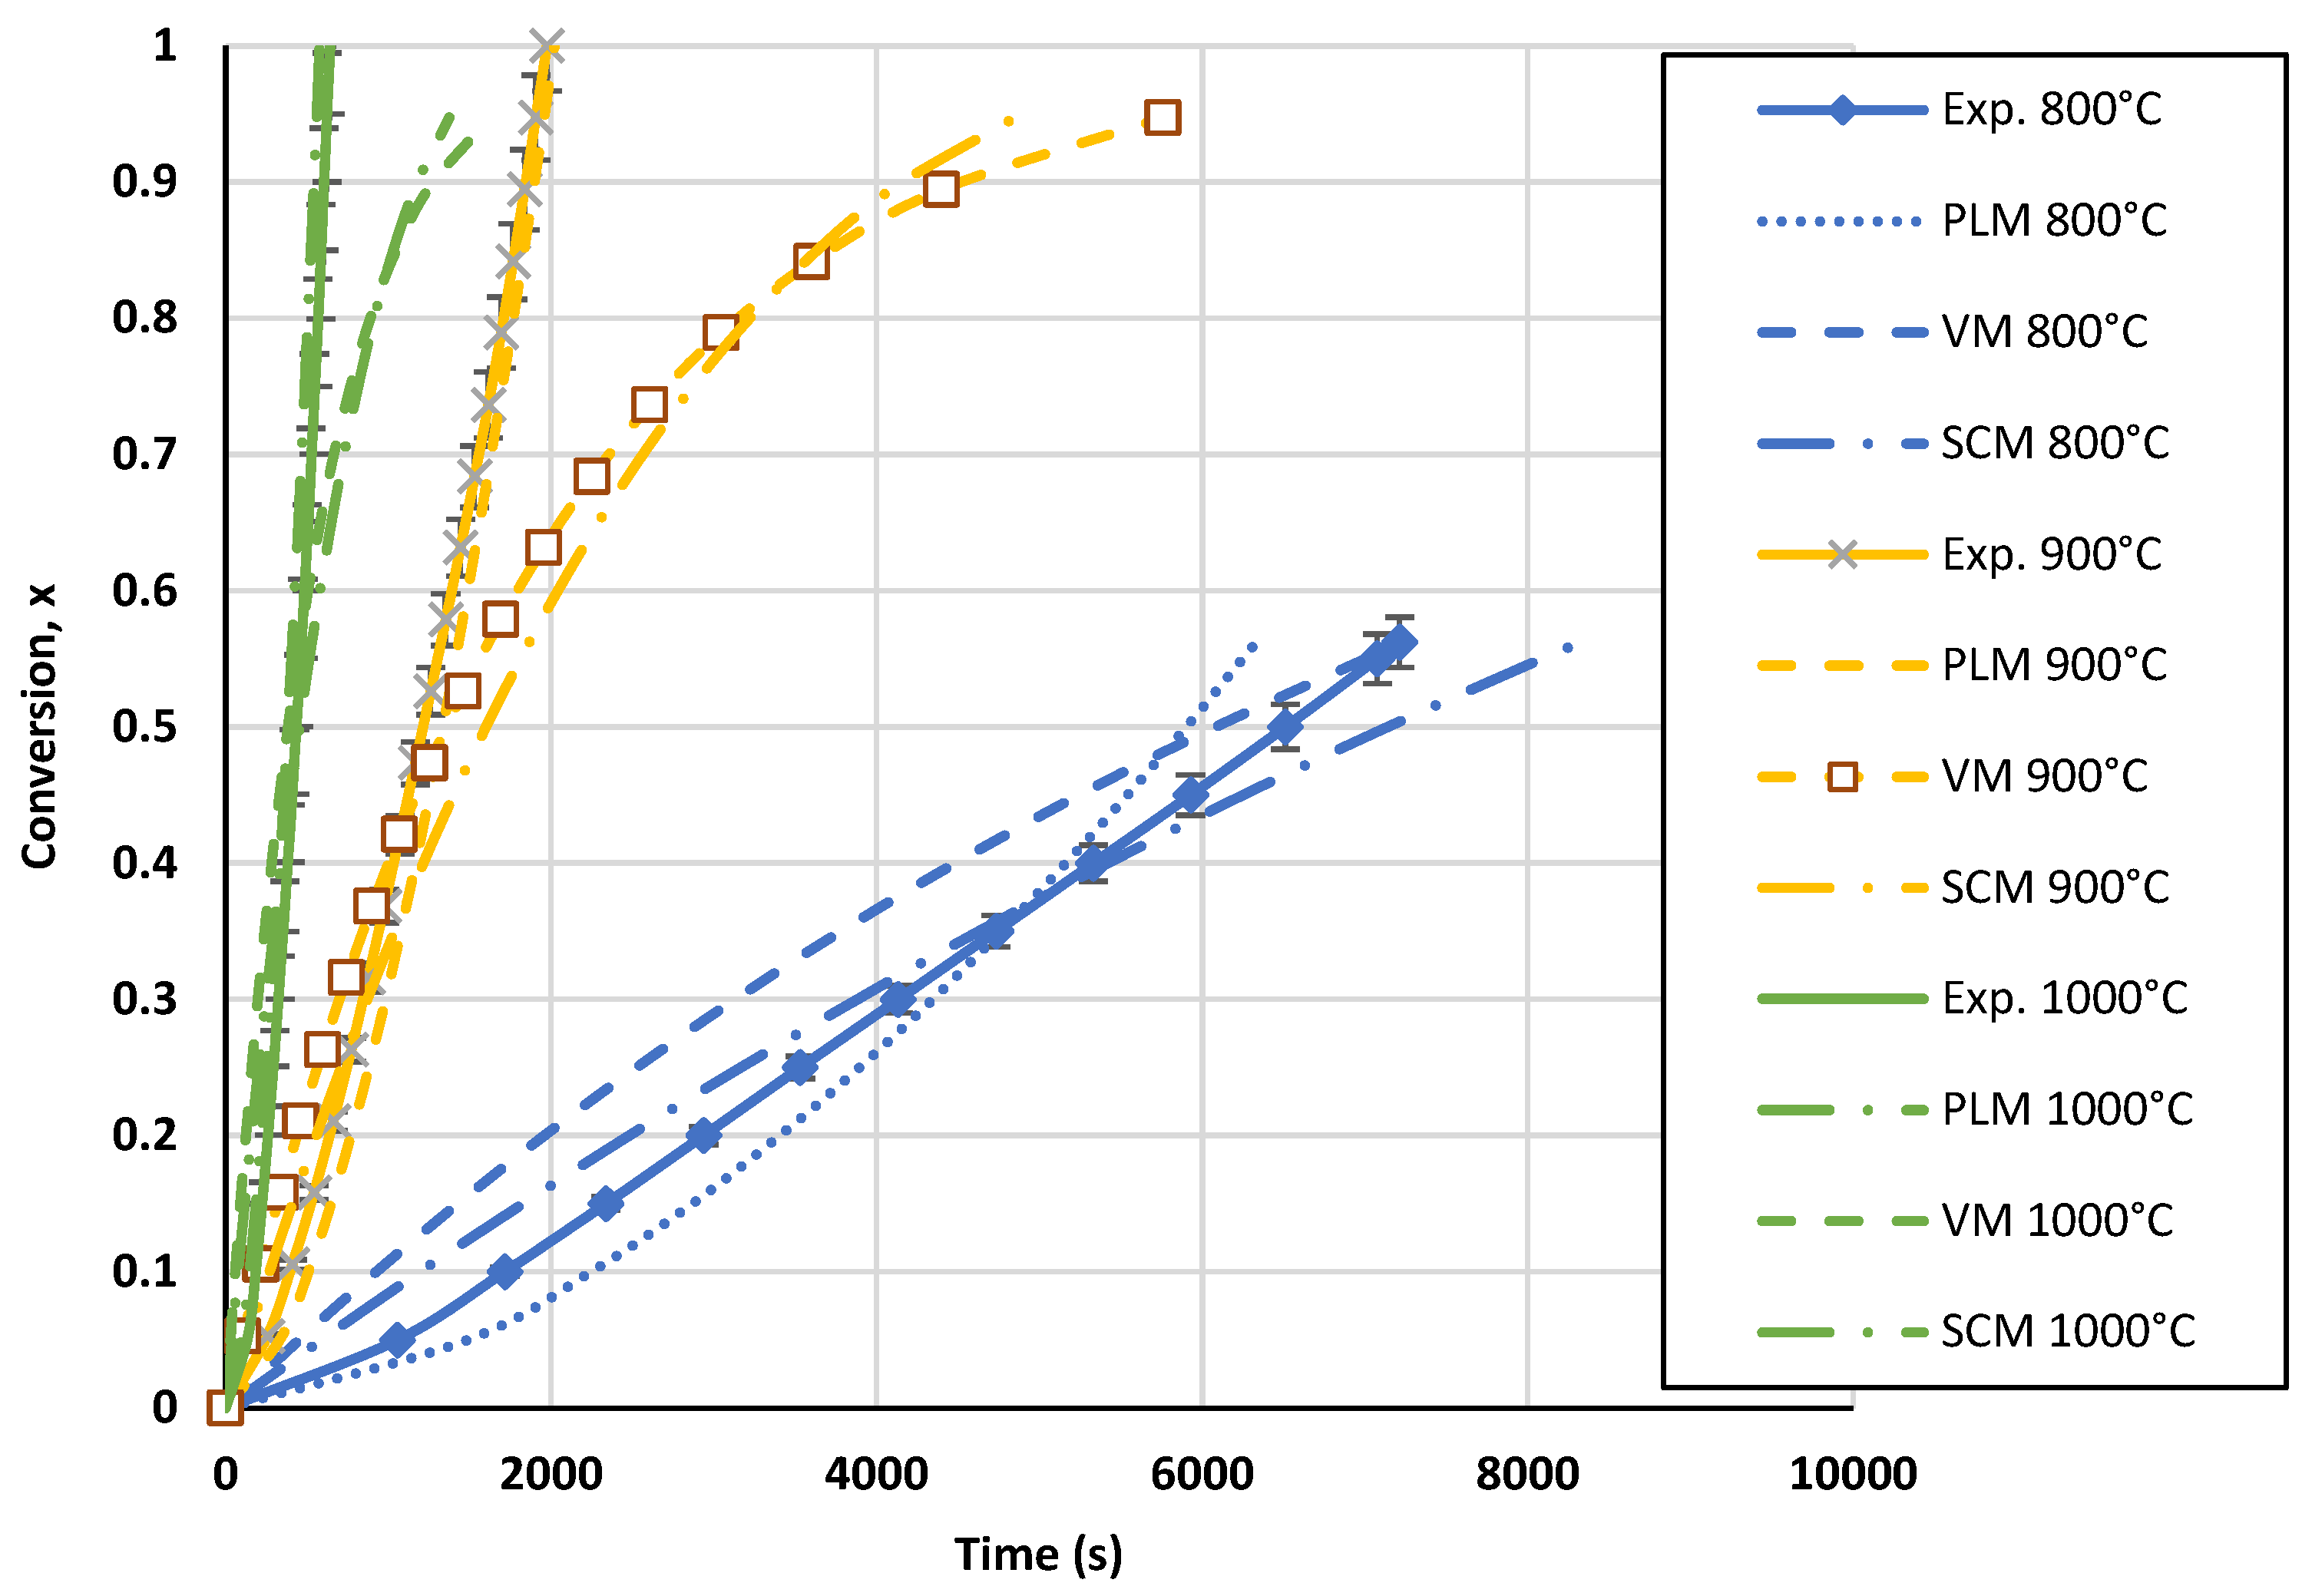
The comparative conversion curves of biochar for the three tested models at temperatures ranging from 800 °C to 1000 °C at a partial pressure of 0.67 atm are displayed in Figure 9. As shown, the power-law model was more accurate than the volumetric and shrinking core models. According to the last two models, the biochar gasification rate was predicted to gradually decline between conversions of 40 and 60%. In the meantime, it is evident from the model curve in Figure 9 that the two models did not provide the expected results. The power-law model was able to predict a very precise path that closely matched the experimental data for temperatures between 800 °C and 1000 °C. The standard deviation of the PLM compared to the experimental values ranged from 8 to 9%. While varying the CO2 partial pressure at 1000 °C, a standard deviation ranging from 2.6 to 6.6% was obtained with this model. Figure A1 and Figure A2 in the Appendix A display further PLM validation data. The observed differences between the experimental results and the kinetic model could be caused by the inability of the PLM to forecast the structural degradation of biochar particles. Based on the PLM, the final kinetic model for the TGA can be expressed as in Equation (19).

Figure 9.
Conversion curves for biochar gasification and calculated conversion with the three models for the TGA at a CO2 pressure of 0.67 atm and CO2/C ratio of 7.01.
4.3. Kinetic Model for FBR
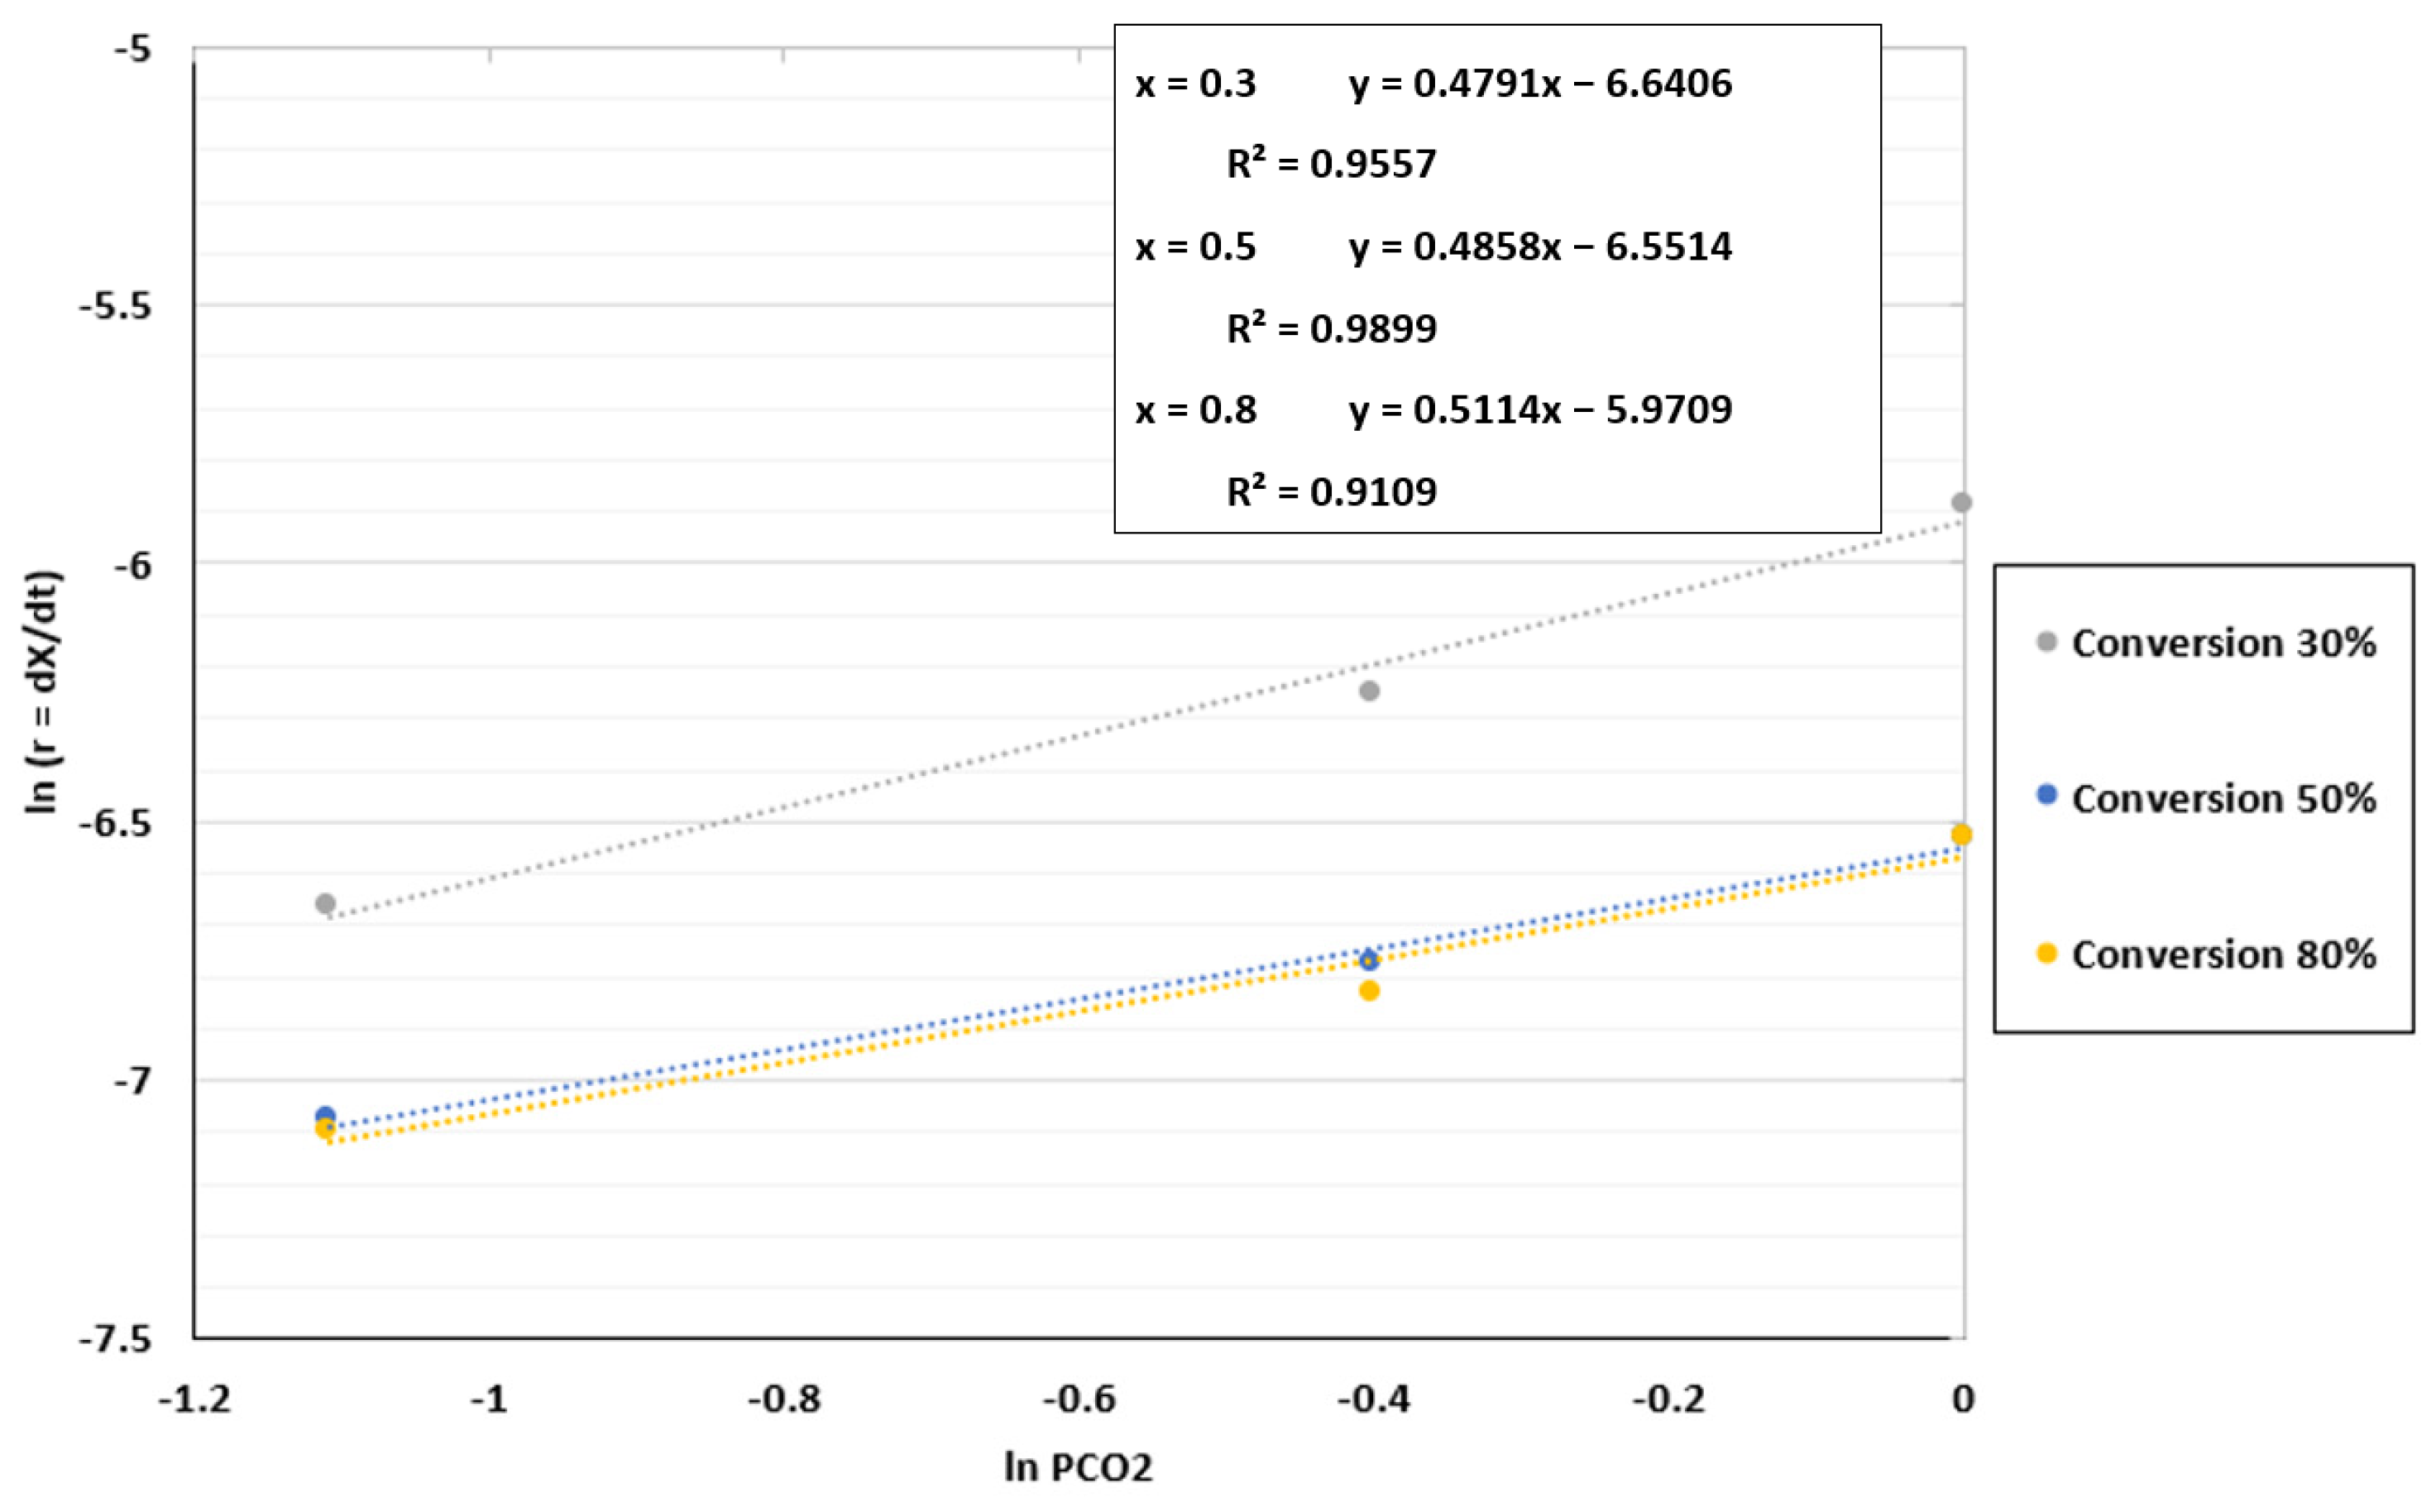
In the case of the fluidized bed reactor, the kinetic parameters and the best model to validate the experimental results were found using the same process as for the TGA in Section 4.2. The reaction order was determined by plotting ln r against ln PCO2, as shown in Figure 10. The coefficient of determination (R2) was approximately 0.99 for a conversion of 50%, indicating that the reaction order may be close to the value of 0.4858 attained for this conversion. An average value of 0.49 was chosen because the values obtained for the reaction order fluctuated between 0.47 and 0.51.
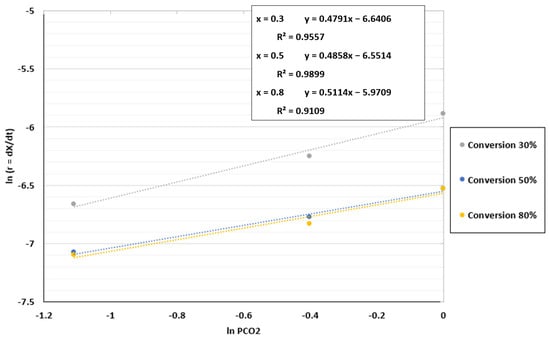
Figure 10.
Fitting results between ln r and ln PCO2 for the FBR at a temperature of 1000 °C and CO2/C ratio of 7.01.
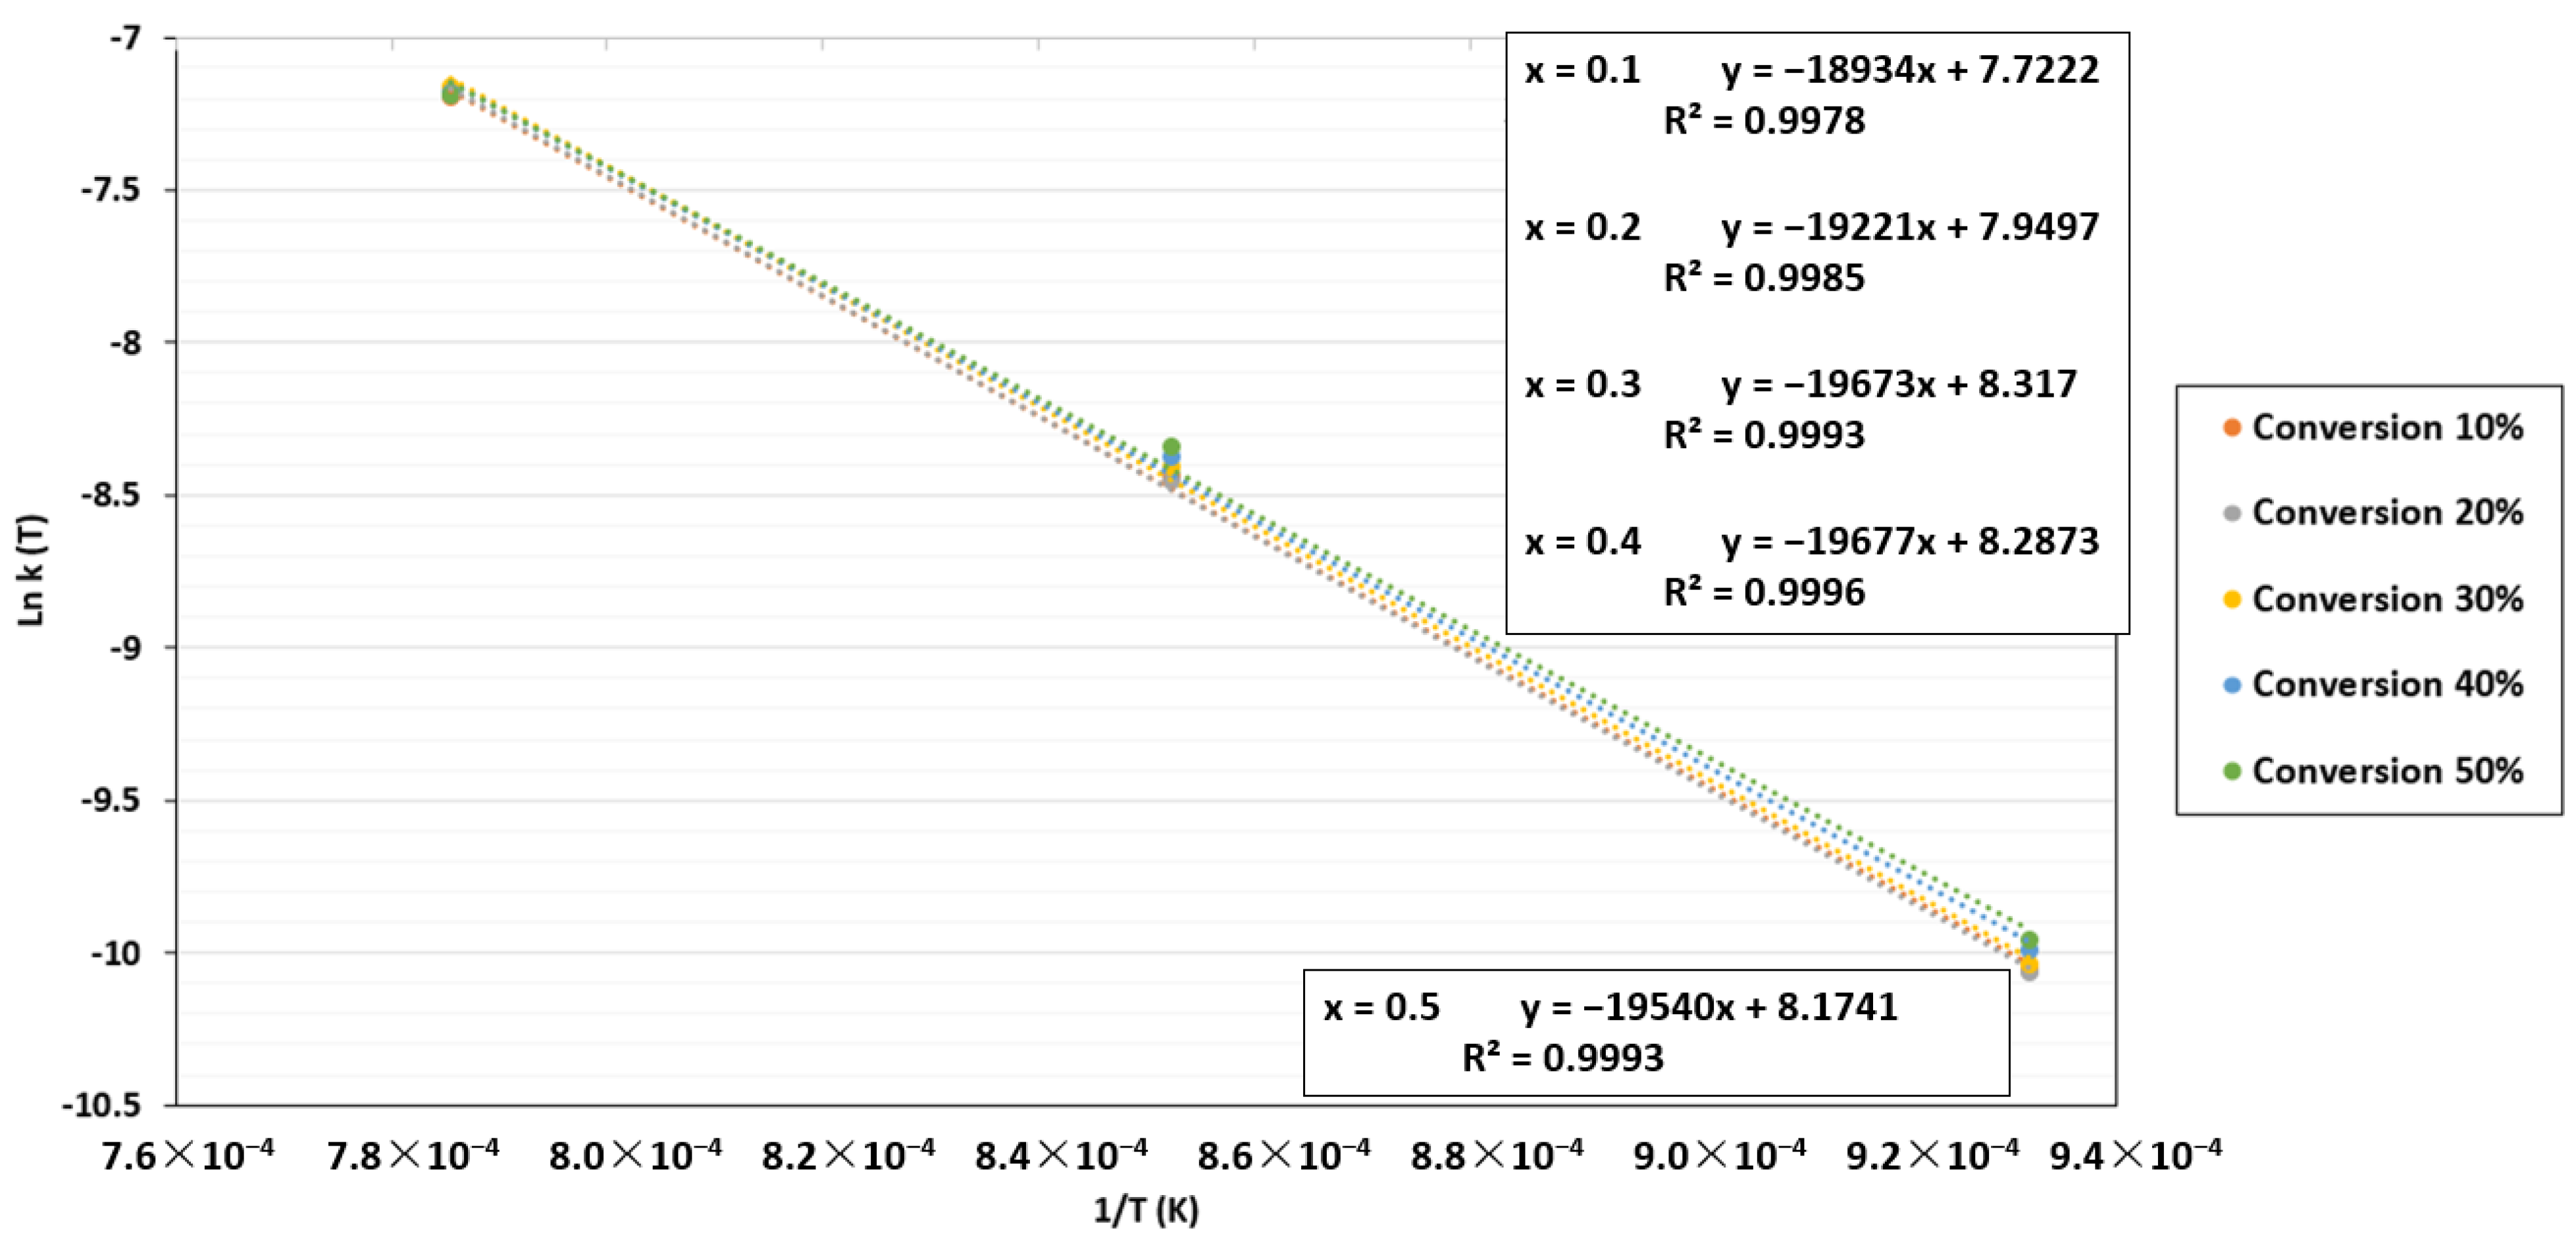
By plotting ln k(T) against 1/T, the apparent activation energy and pre-exponential were determined using the same methodology as in the TGA case. The plots for the FBR are shown in Figure 11. For the apparent activation energy, the results changed with increased conversion. However, in contrast to the TGA results, this energy varied slightly from 157.1 to 162.5 MJ/Kmol. The apparent activation energy value and the pre-exponential factor selected in this section were 159.8 ± 2.7 MJ/Kmol and 2095.8 ± 36 atm−1 s−1, respectively. A minor increase in the apparent activation energy can be seen when char is gradually reduced since reactive sites are reduced with increased conversion. Furthermore, additional reactions might occur in the reactor because the biochar was not entirely made of carbon and change the apparent activation energy values.
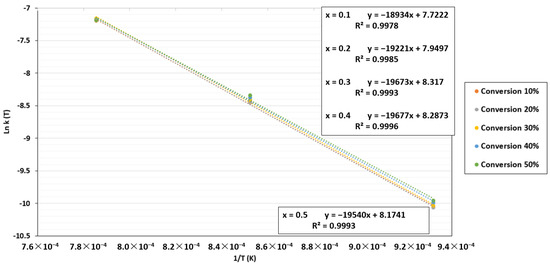
Figure 11.
ln k(T) as a function of 1/T for the FBR at a CO2 pressure of 0.67 atm and CO2/C ratio of 7.01.
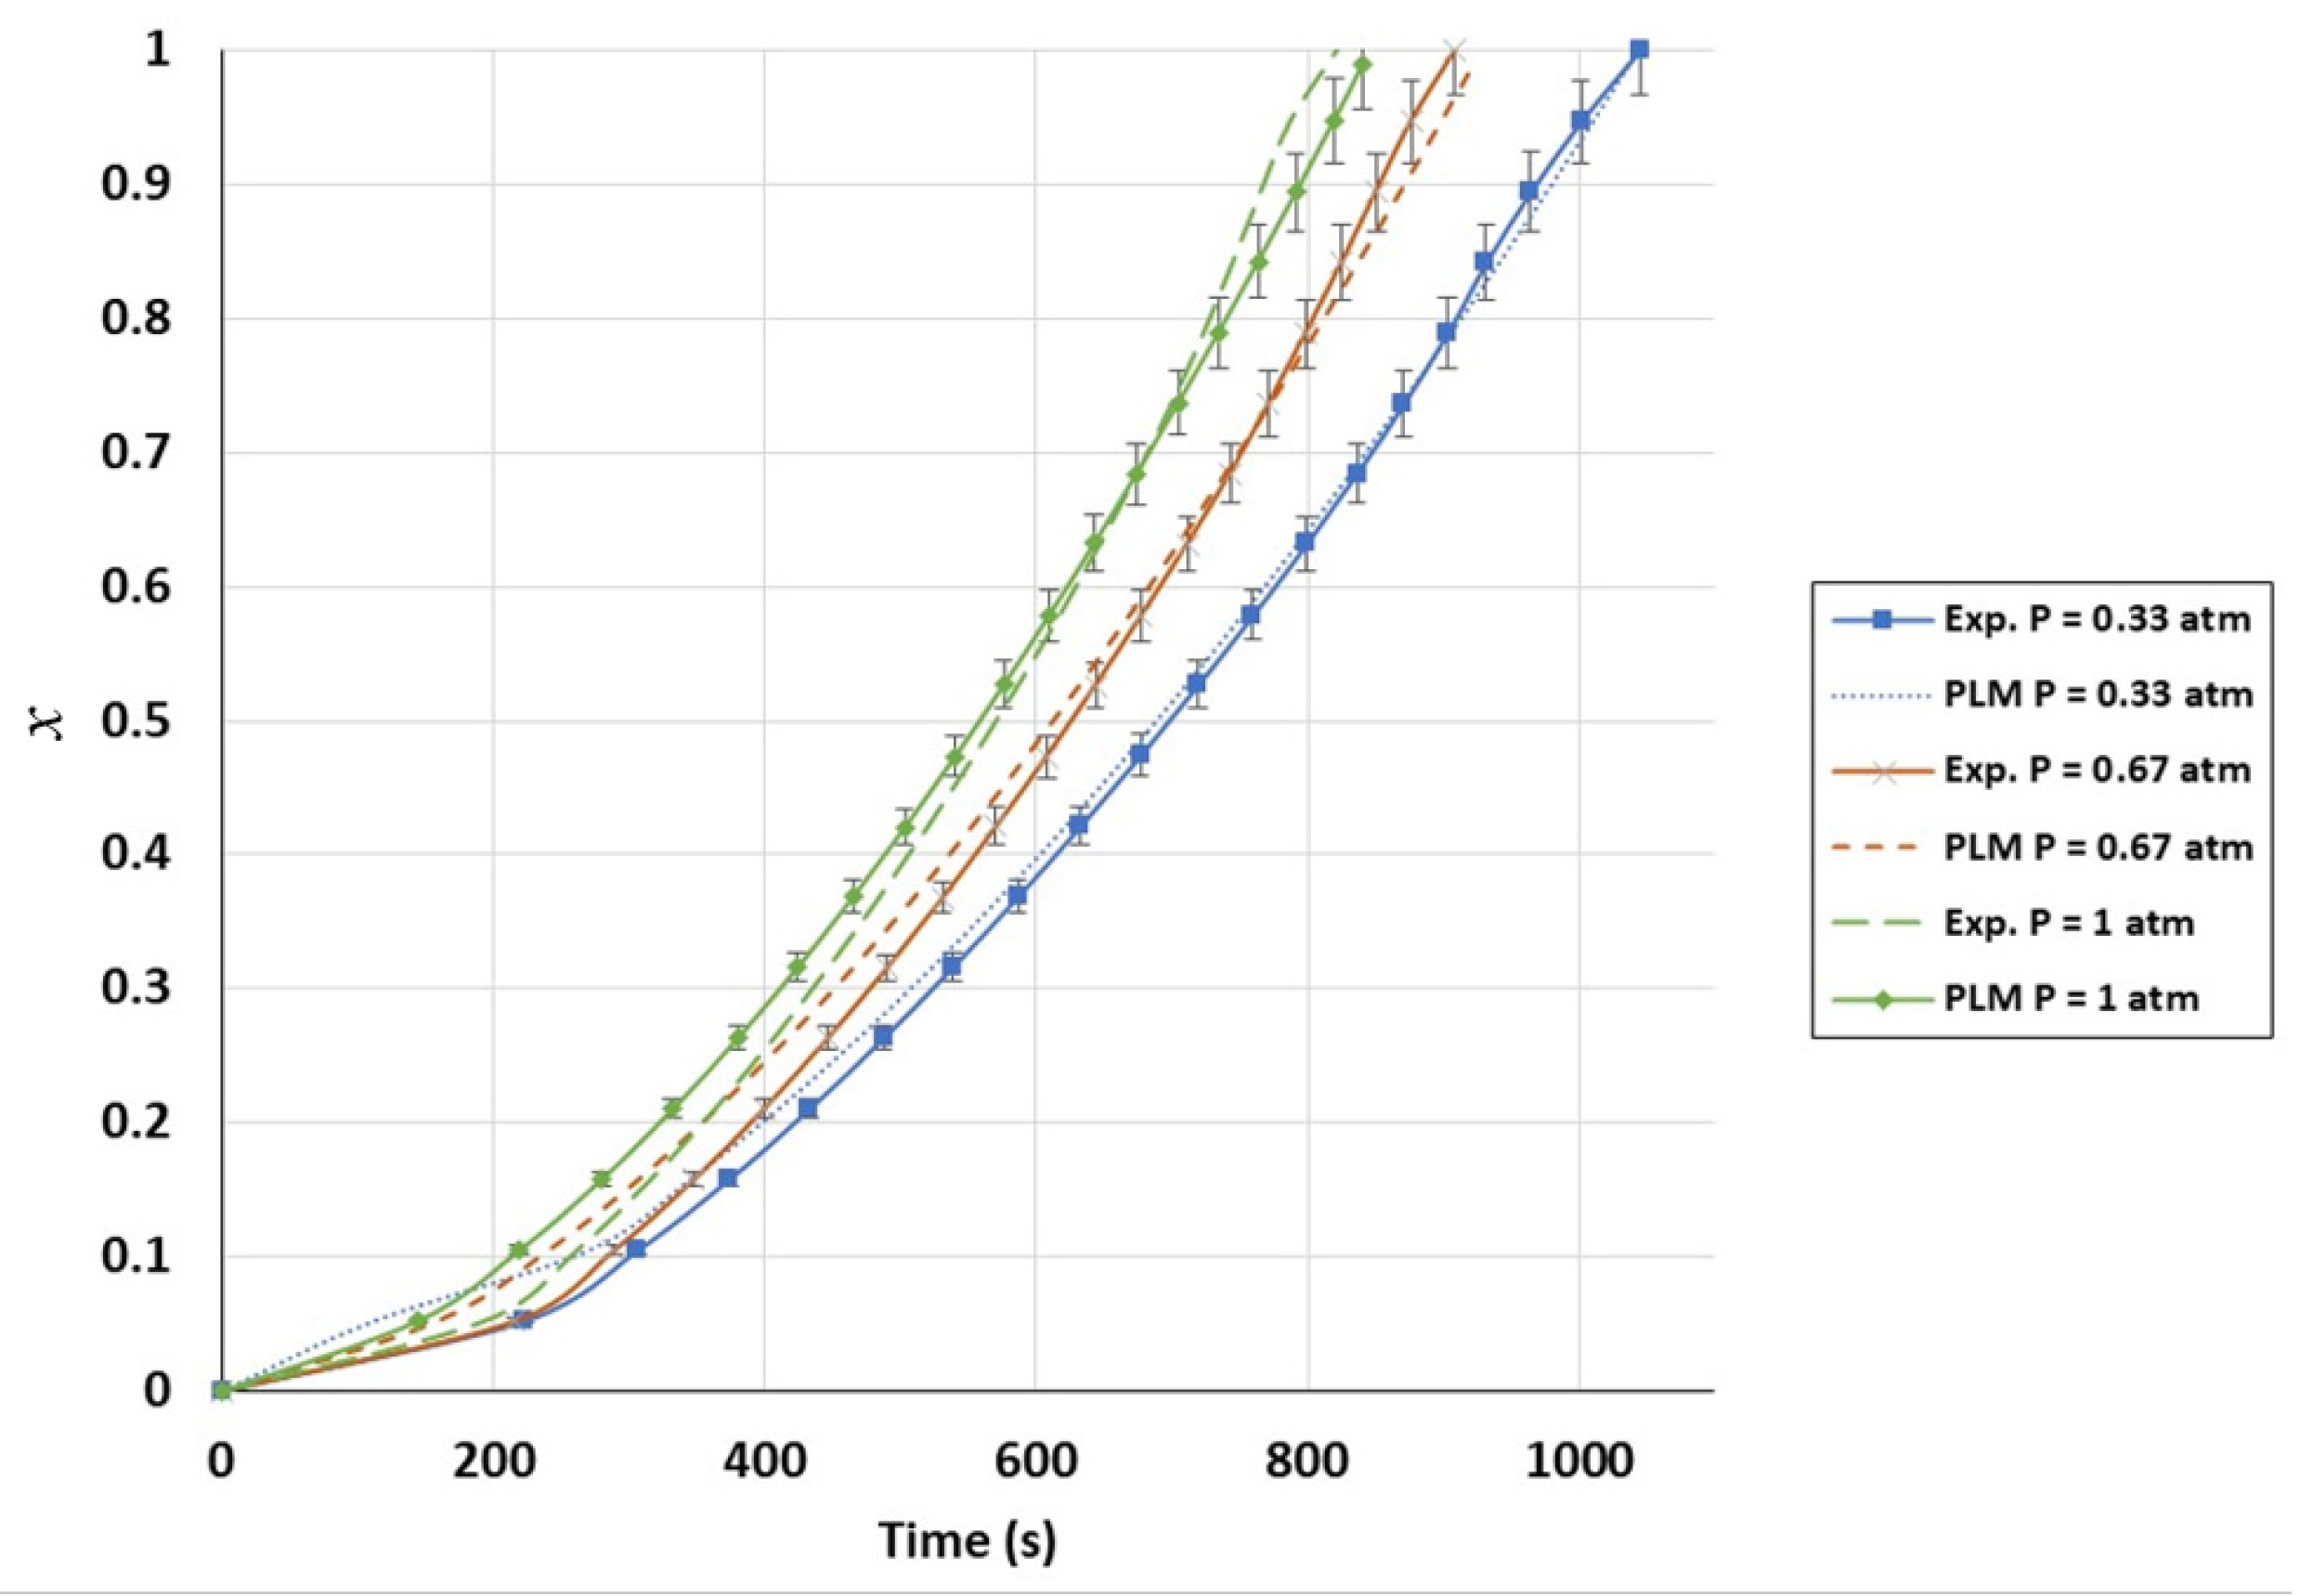
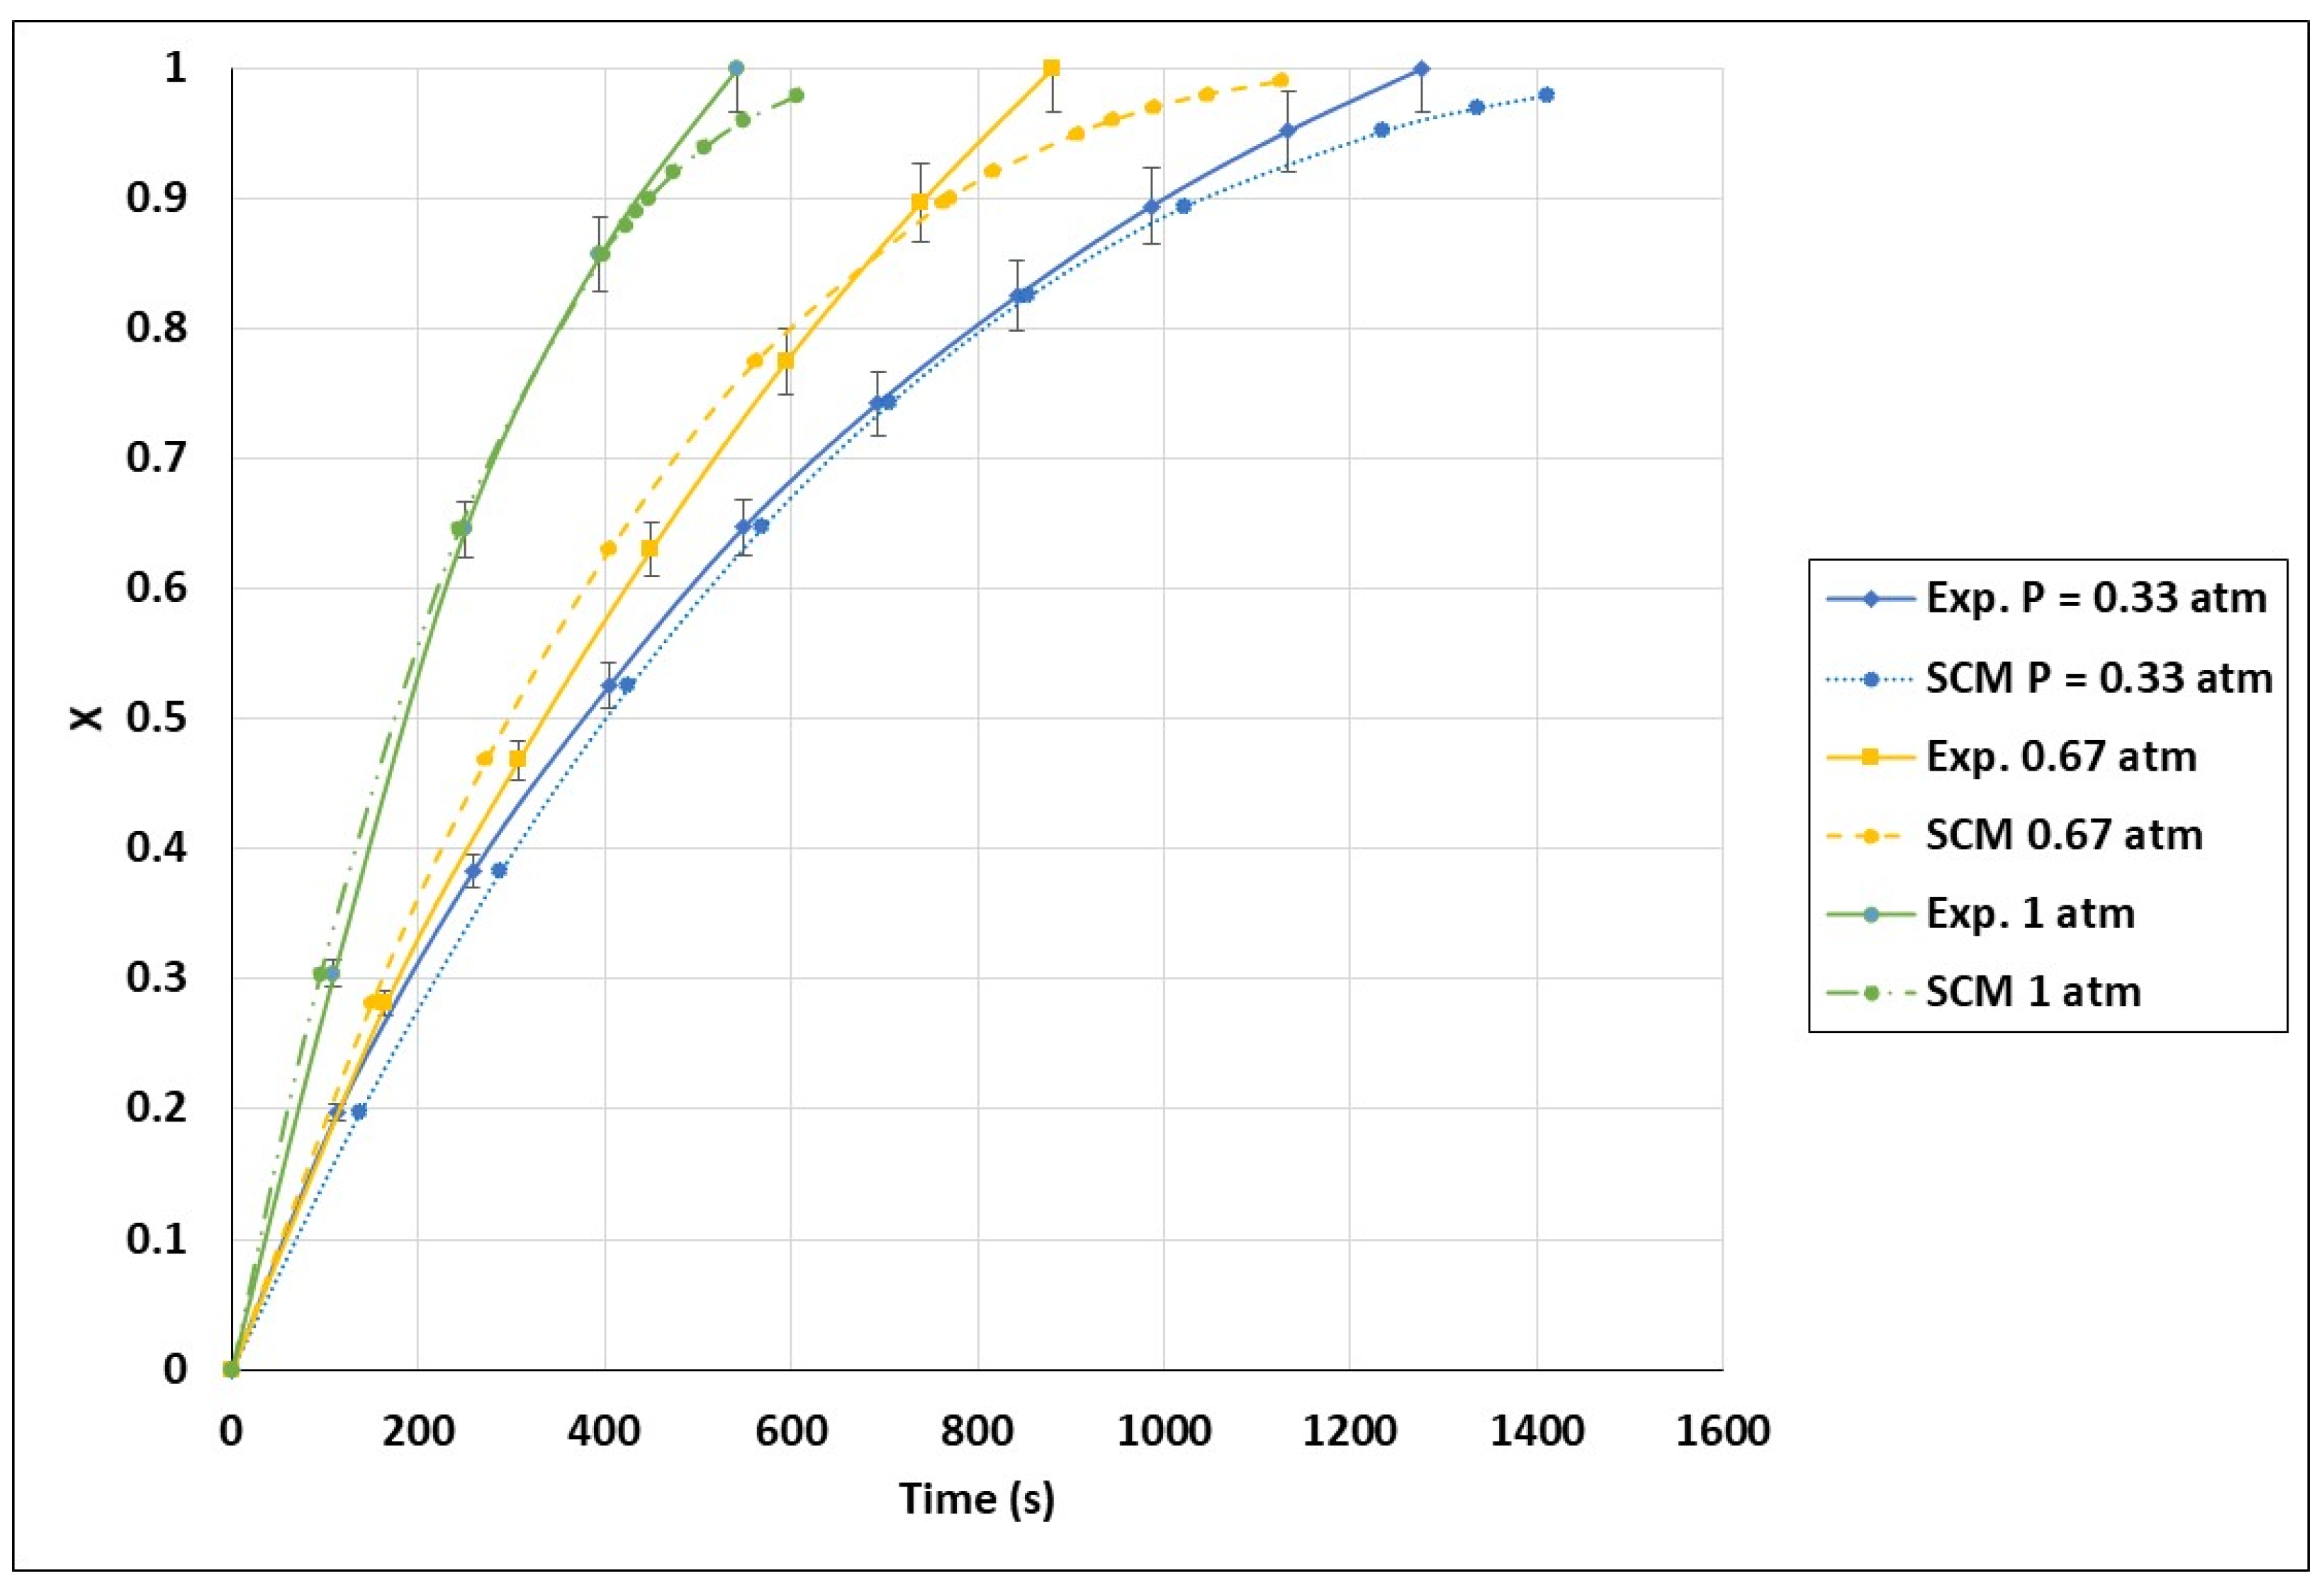
The kinetic model in the FBR was not developed using the power-law model since no power-law mathematical equation adapted to forecast the FBR results was identified. The results obtained for the VM and SCM were compared with the experimental data in Figure 12. It is obvious that the SCM was the best model for the FBR, since the SCM curves were in better agreement with the experimental results. The models showed a minor deviation from the experimental results, namely after 80% biochar conversion. This resulted from the prediction of the kinetic model of a high motion reduction in the biochar gasification rate, which was untrue. Furthermore, diffusional constraints, such as the segregation phenomena of biochar and sand agglomerations, were not taken into consideration by these models. An approximate standard deviation of 1.5% was obtained by comparing the SCM curves with the experimental results. The accuracy of this model is shown in Figure A4 in the Appendix A. Based on the SCM, the final kinetic model for the FBR can be expressed as in Equation (20).
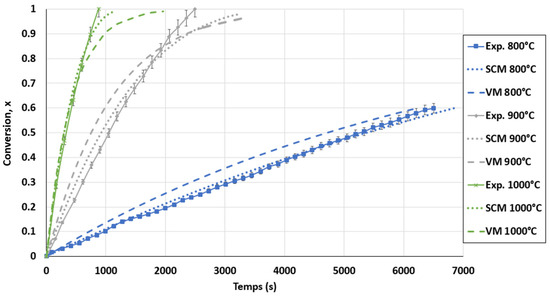
Figure 12.
Conversion curves for biochar gasification and calculated conversion with selected models for the FBR at a CO2 pressure of 0.67 atm and CO2/C ratio of 7.01.
4.4. Further Discussion
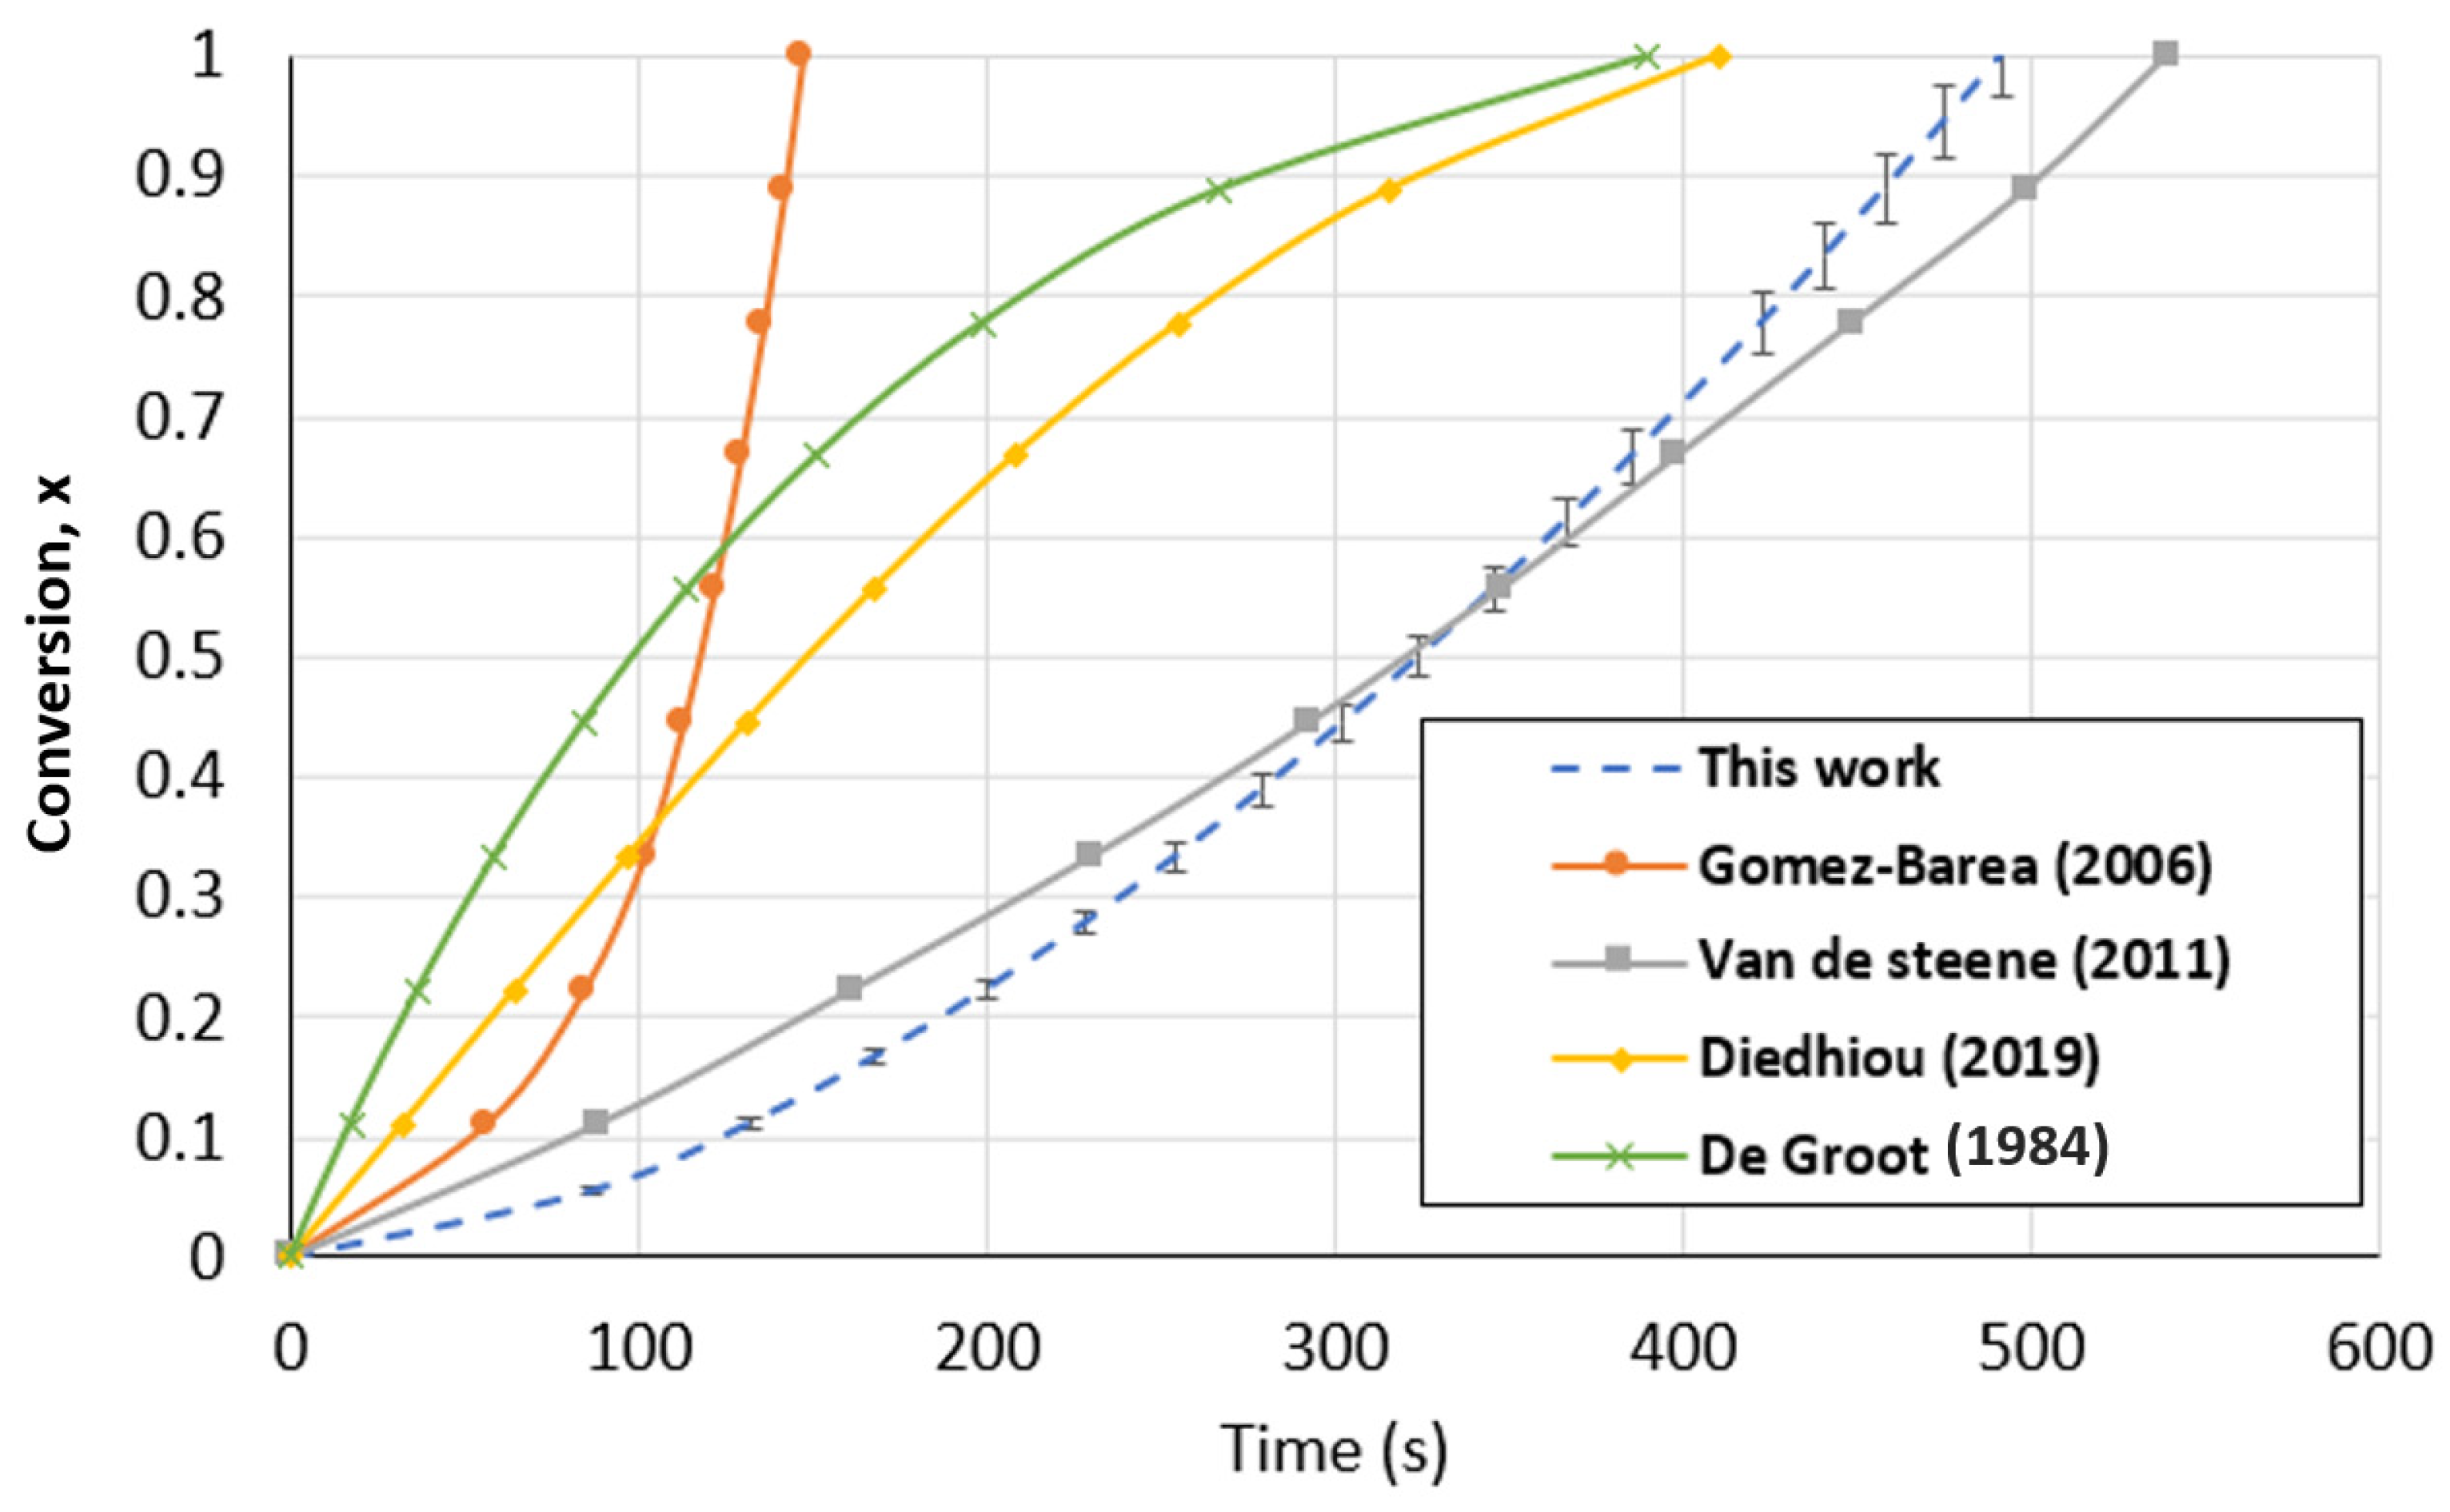
The developed TGA and FBR models were compared to kinetic models previously published by other researchers using the same operating parameters and type of biochar. A comparison between the kinetic models found in the literature and the PLM developed in this study for the TGA is presented in Figure 13. In order to perform the comparison, the literature models were brought to identical operating conditions (1000 °C and 1 atm of CO2 partial pressure). Even though the models are presented under the same conditions, the comparison is constrained by the absence of details regarding the various mass and heat transport limitations of each condition. For all the models, the biochar used is originally from wood. The conversion curves were diversified, as can be seen in Figure 13. On the one hand, Diedhiou et al. [68] and DeGroot et al. [69] proposed models in which the conversion greatly reduces the biochar gasification rate in the TGA, suggesting the modeling of f(x) using the shrinking core and volumetric model. However, it can be seen that the amount of time needed for the complete conversion of biochar was rather close to that in our investigation. On the other hand, the conversion curves obtained by Gomez-Barea et al. [64] and Van de Steene et al. [70] were similar to those in our work. Because the conventional models were not in agreement with their experimental results, both authors expressed the biochar consumption mechanism using power-law models that were mathematically designed. The most recent findings supported the behavior observed in our investigation.
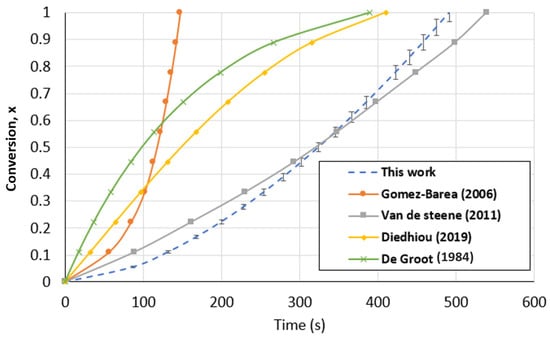
Figure 13.
Biochar gasification kinetic model comparison with the literature for the TGA at a temperature of 1000 °C and CO2 partial pressure of 1 atm [64,68,69,70].
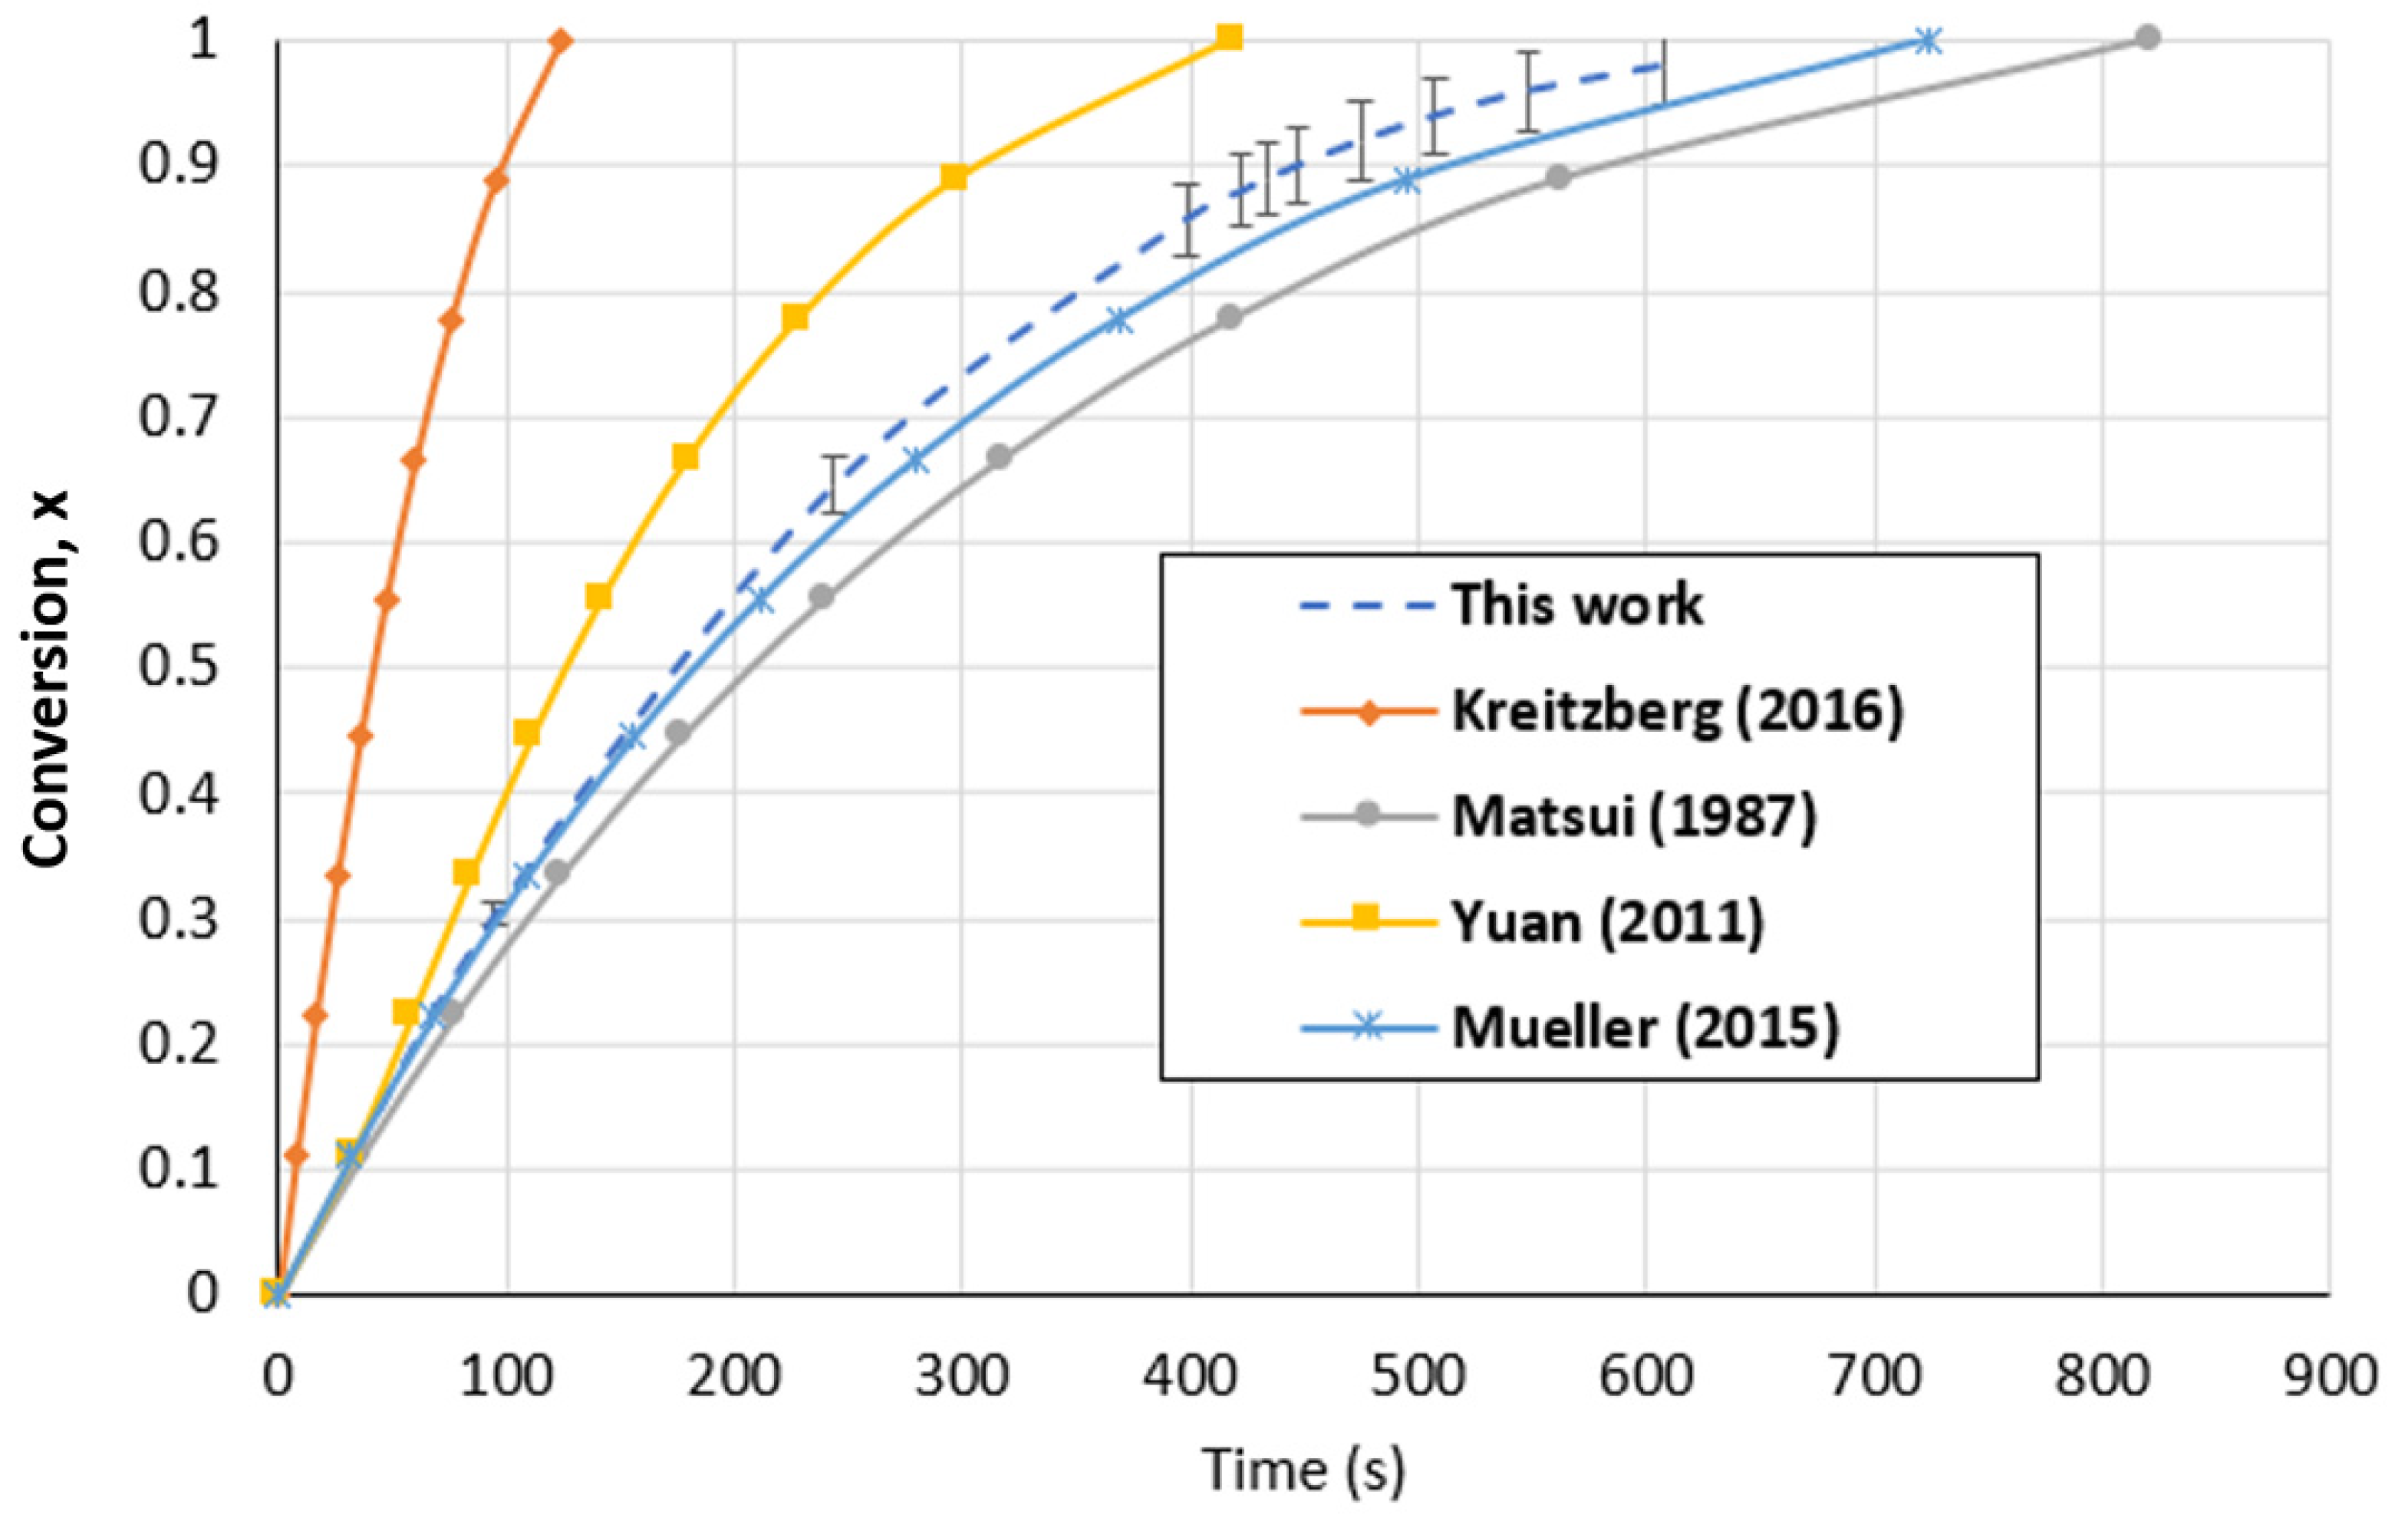
In the case of the fluidized bed reactor, Figure 14 shows that the predicted values of this work at 1000 °C and a CO2 partial pressure of 1 atm using the SCM were demonstrated to be within the same range of values anticipated in the literature. The difference in the particle size, which is recognized as a boundary parameter in gasification, is the reason for the variation in the conversion time. The findings of our investigation were in excellent accord with the kinetic model for the gasification of woody biochar with CO2 that was proposed by Mueller et al. [37] and Matsui et al. [71]. Table 4 summarizes and compares our results with those in the literature.
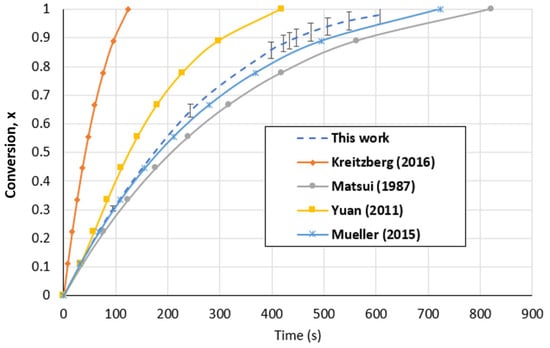
Figure 14.
Biochar gasification kinetic model comparison with the literature for the FBR at a temperature of 1000 °C and CO2 partial pressure of 1 atm [20,37,71,72].
Table 4.
Comparison of kinetic parameters with the literature data.
5. Conclusions
This work focused on developing a kinetic model for the gasification of biochar in a fluidized bed reactor and a thermogravimetric analyzer. The biochar gasification rate was increased by increasing the temperature, partial pressure, and CO2/C ratio, decreasing the time required for total biochar conversion.
The comparison of the results obtained for both setups revealed that the gasification rate was faster in the FBR than in the TGA due to the better mixing conditions favoring heat and mass transfer.
Comparable kinetic parameters were obtained for the two configurations, such as the apparent activation energy ranging from 156 MJ/kmol to 159 MJ/kmol and the reaction order of 0.4 to 0.49 for the FBR and TGA, respectively. With standard deviations ranging from 2.6% to 9%, the power-law model (PLM) for the TGA produced the best results in terms of confirming the experimental findings. The shrinking core model (SCM), which characterizes biochar conversion as a layer-by-layer consumption with which, at high conversion values, the gasification rate becomes very slow, was the most well-suited model for the FBR, with an average standard deviation of 1.5% from the experimental results.
The chosen model (PLM) for the TGA was described by a mathematical function rather than by any path that was previously published in the literature. This function demonstrated a decrease in the gasification rate of biochar but with less effect than the FBR results. It was also found that the kinetic model obtained for the TGA could not be extrapolated in the FBR because of the distinct localized behavior in the TGA. Thus, a unique char consumption mechanism in both reactors was demonstrated by the difference in the kinetic models developed.
In this work, we limited our investigation to a single-factor analysis (temperature, CO2 partial pressure, or C/CO2 ratio). It would be very interesting in future work to perform a multiple-factor analysis combining these different parameters.
Author Contributions
Conceptualization, B.T., L.A. and M.J.; methodology, B.T. and L.A.; software, L.R.; validation, B.T., L.A. and L.R.; formal analysis, M.J.; investigation, B.T. and L.A.; resources, B.T. and L.A.; data curation, L.R.; writing—original draft preparation, B.T. and L.A.; writing—review and editing, B.T., L.A. and M.J.; visualization, B.T., L.A. and M.J.; supervision, B.T. and L.A.; project administration, B.T. and L.A.; funding acquisition, B.T. and L.A. All authors have read and agreed to the published version of the manuscript.
Funding
This project was funded with support from the Ministry of Science and Technology of the Dominican Republic (MESCYT), Project BIO-Engine (HN0002485), RAPHYD (HN0002635°, and the Regional Council of Normandie.
Data Availability Statement
Data can be made available upon request.
Conflicts of Interest
The authors declare no conflicts of interest.
Abbreviations
| A0 | Pre-exponential factor [ s−1 atm−n] |
| C | Carbon [wt. %] |
| Ea | Apparent activation energy [kJ/kmol] |
| f(x) | Consumption mechanism of char [-] |
| FBR | Fluidized bed reactor |
| H | Hydrogen [wt. %] |
| k | Apparent reaction constant [s−1] |
| LPAH | Light poly-aromatic compound |
| m | Mass [g] |
| mf-af | Final mass—ash free [g] |
| mo | Initial mass [g] |
| mt | Mass at time (t) [g] |
| Mw | Molecular weight [g/mol] |
| P° | Reference pressure [atm] |
| Pi | Partial pressure [atm] |
| PLM | Power-law model |
| R | Gas constant [8.314 J/K mol] |
| r | Reaction rate [s−1] |
| r50 | Reaction rate at 50% conversion [s−1] |
| SCM | Shrinking core model |
| t | Time [min] |
| T | Temperature [°C] |
| T° | Reference Temperature [°C] |
| TGA | Thermogravimetric analyzer |
| x | Conversion [-] |
Appendix A
Appendix A.1. Minimum Fluidization Velocity
The parameters used for the calculation of uf are detailed in Table A1.
Table A1.
Detailed parameters used for calculation of uf according to Levenspiel et al. [42].
Table A1.
Detailed parameters used for calculation of uf according to Levenspiel et al. [42].
| Parameters | Values | Unit |
|---|---|---|
| Reactor temperature | 1000 | °C |
| Operating pressure | 1 | atm |
| Bulk solid density | 0.33 | g/cm3 |
| Solid particle diameter (sand) | 450 | micrometer |
| Air percentage | 0% | % vol |
| Nitrogen percentage | 67% | % vol |
| CO2 percentage | 33% | % vol |
| Reactor diameter | 2.2 | cm |
| Bed height | 3 | cm |
| Reactor height | 15 | cm |
| Material bed | Char | - |
| Porosity | 0.43 | - |
| Bulk bed density | 0.33 | g/cm3 |
| Particle diameter | 0.045 | cm |
| Particle sphericity | 1 | |
| Fluid mixture viscosity | 0.0003348 | g/cm/s |
| Particle density | 0.6 | g/cm3 |
| Fluid mixture density | 0.0003186 | g/cm3 |
| Fluidization factor (or multiplier) | 2 | - |
| Minimum fluidization velocity | 3.374 | cm/s |
| Actual fluidization velocity | 6.75 | cm/s |
Appendix A.2. Kissinger–Akahira–Sunose (KAS) and Ozawa–Flynn–Wall (OFW) Methods
The sample’s mass loss during thermal degradation is used to calculate the conversion rate.
where are the initial and the final mass, respectively.
where x is the conversion rate, m0, mt, and mf represent the initial mass, the mass at a given time t, and the final mass, respectively.
Therefore, the reaction rate can be expressed by the following relation:
where m0 and mf represent the initial and final mass of the sample, respectively.
Accordingly, the reaction rate is described by the following general kinetic equation:
Here, k(T) denotes the temperature-dependent rate constant, and f(x) represents a typical kinetic model for solid-state reactions. These parameters are often expressed as follows:
where A is the pre-exponential factor, Ex is the apparent activation energy, R is the universal gas constant, and n is the reaction order. By combining these expressions, the general form of the kinetic model describing biomass decomposition becomes as follows:
- Kissinger–Akahira–Sunose (KAS)
By rearranging and integrating Equation (A5), we obtain the following expression, which involves an integral that lacks an analytical solution and typically requires numerical integration or linear approximation [25,73,74]:
Using the Coats–Redfern approximation [75], the KAS method yields a linearized form:
Soria-Verdugo et al. [76] demonstrated that both the numerical integration and linear approximation of Equation (A6) produce nearly identical results, as the corresponding curves are in excellent agreement.
- Ozawa–Flynn–Wall (OFW) Method
Similarly, the Ozawa–Flynn–Wall method, which employs Doyle’s approximation [25], results in the following linear expression:
Appendix A.3. Key Equations and Reactions in This Work
Table A2.
Kinetics of the different reactions in the article, based on data from the literature.
Table A2.
Kinetics of the different reactions in the article, based on data from the literature.
| No. | Reaction Equation | Reaction Type/Name | Notes |
|---|---|---|---|
| 1 | C(s) + CO2(g) ⇌ 2CO(g) | Boudouard reaction | Strongly endothermic (ΔH° = +172.3 kJ/mol). Main reaction in CO2 gasification of biochar [14,15]. |
| 2 | + → + | Char–CO2 gasification reaction | Represents biochar conversion into syngas. Derived from Kaltschmitt et al. [46]. |
| + → + | Steam gasification of char | ΔH° = +131.38 kJ/mol [9]. | |
| 3 | r = A·exp(−Ea/RT)·(1 − x) | Kinetic rate—volumetric model (VM) | Used to describe homogeneous reaction rate vs. conversion. |
| 4 | r =A·exp(−Ea/RT)·(1 − x)(1 − 12.6·ln(1 − x))2 | Random pore model (RPM) | Captures the effect of pore structure evolution on reactivity. |
| 5 | General Gasification Rate | Core kinetic expression used in modeling. | |
| 6 | f(x) = (1 − x) | Volumetric model (VM) | Assumes homogeneous consumption with no structural changes. |
| 7 | f(x) = (1 − x)(2/3) | Shrinking core model (SCM) | Surface reaction on a spherical particle with ash layer formation. |
| 8 | f(x) = axb (e.g., 2/3·x(−1/2)) | Power-law model (PLM) | Empirical form for fitting conversion profiles not described by classical models. |
| 9 | ln(r) = ln[k(T)] + n·ln(PCO2) | Linearized Rate Law | Used to determine reaction order with respect to CO2. |
| 10 | ln[k(T)] = ln(A) − Ea/RT | Arrhenius equation (log form) | Used to extract activation energy and pre-exponential factor. |
Appendix A.4. Validation Results of the PLM
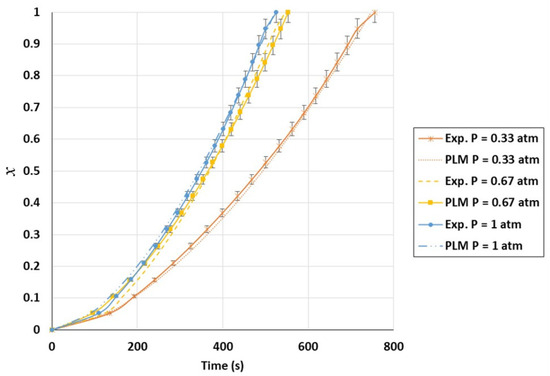
Figure A1.
Validation of conversion curves of experimental test and power-law model (PLM); partial pressure effect, temperature of 1000 °C, and CO2/C ratio of 10.5.
Figure A1.
Validation of conversion curves of experimental test and power-law model (PLM); partial pressure effect, temperature of 1000 °C, and CO2/C ratio of 10.5.
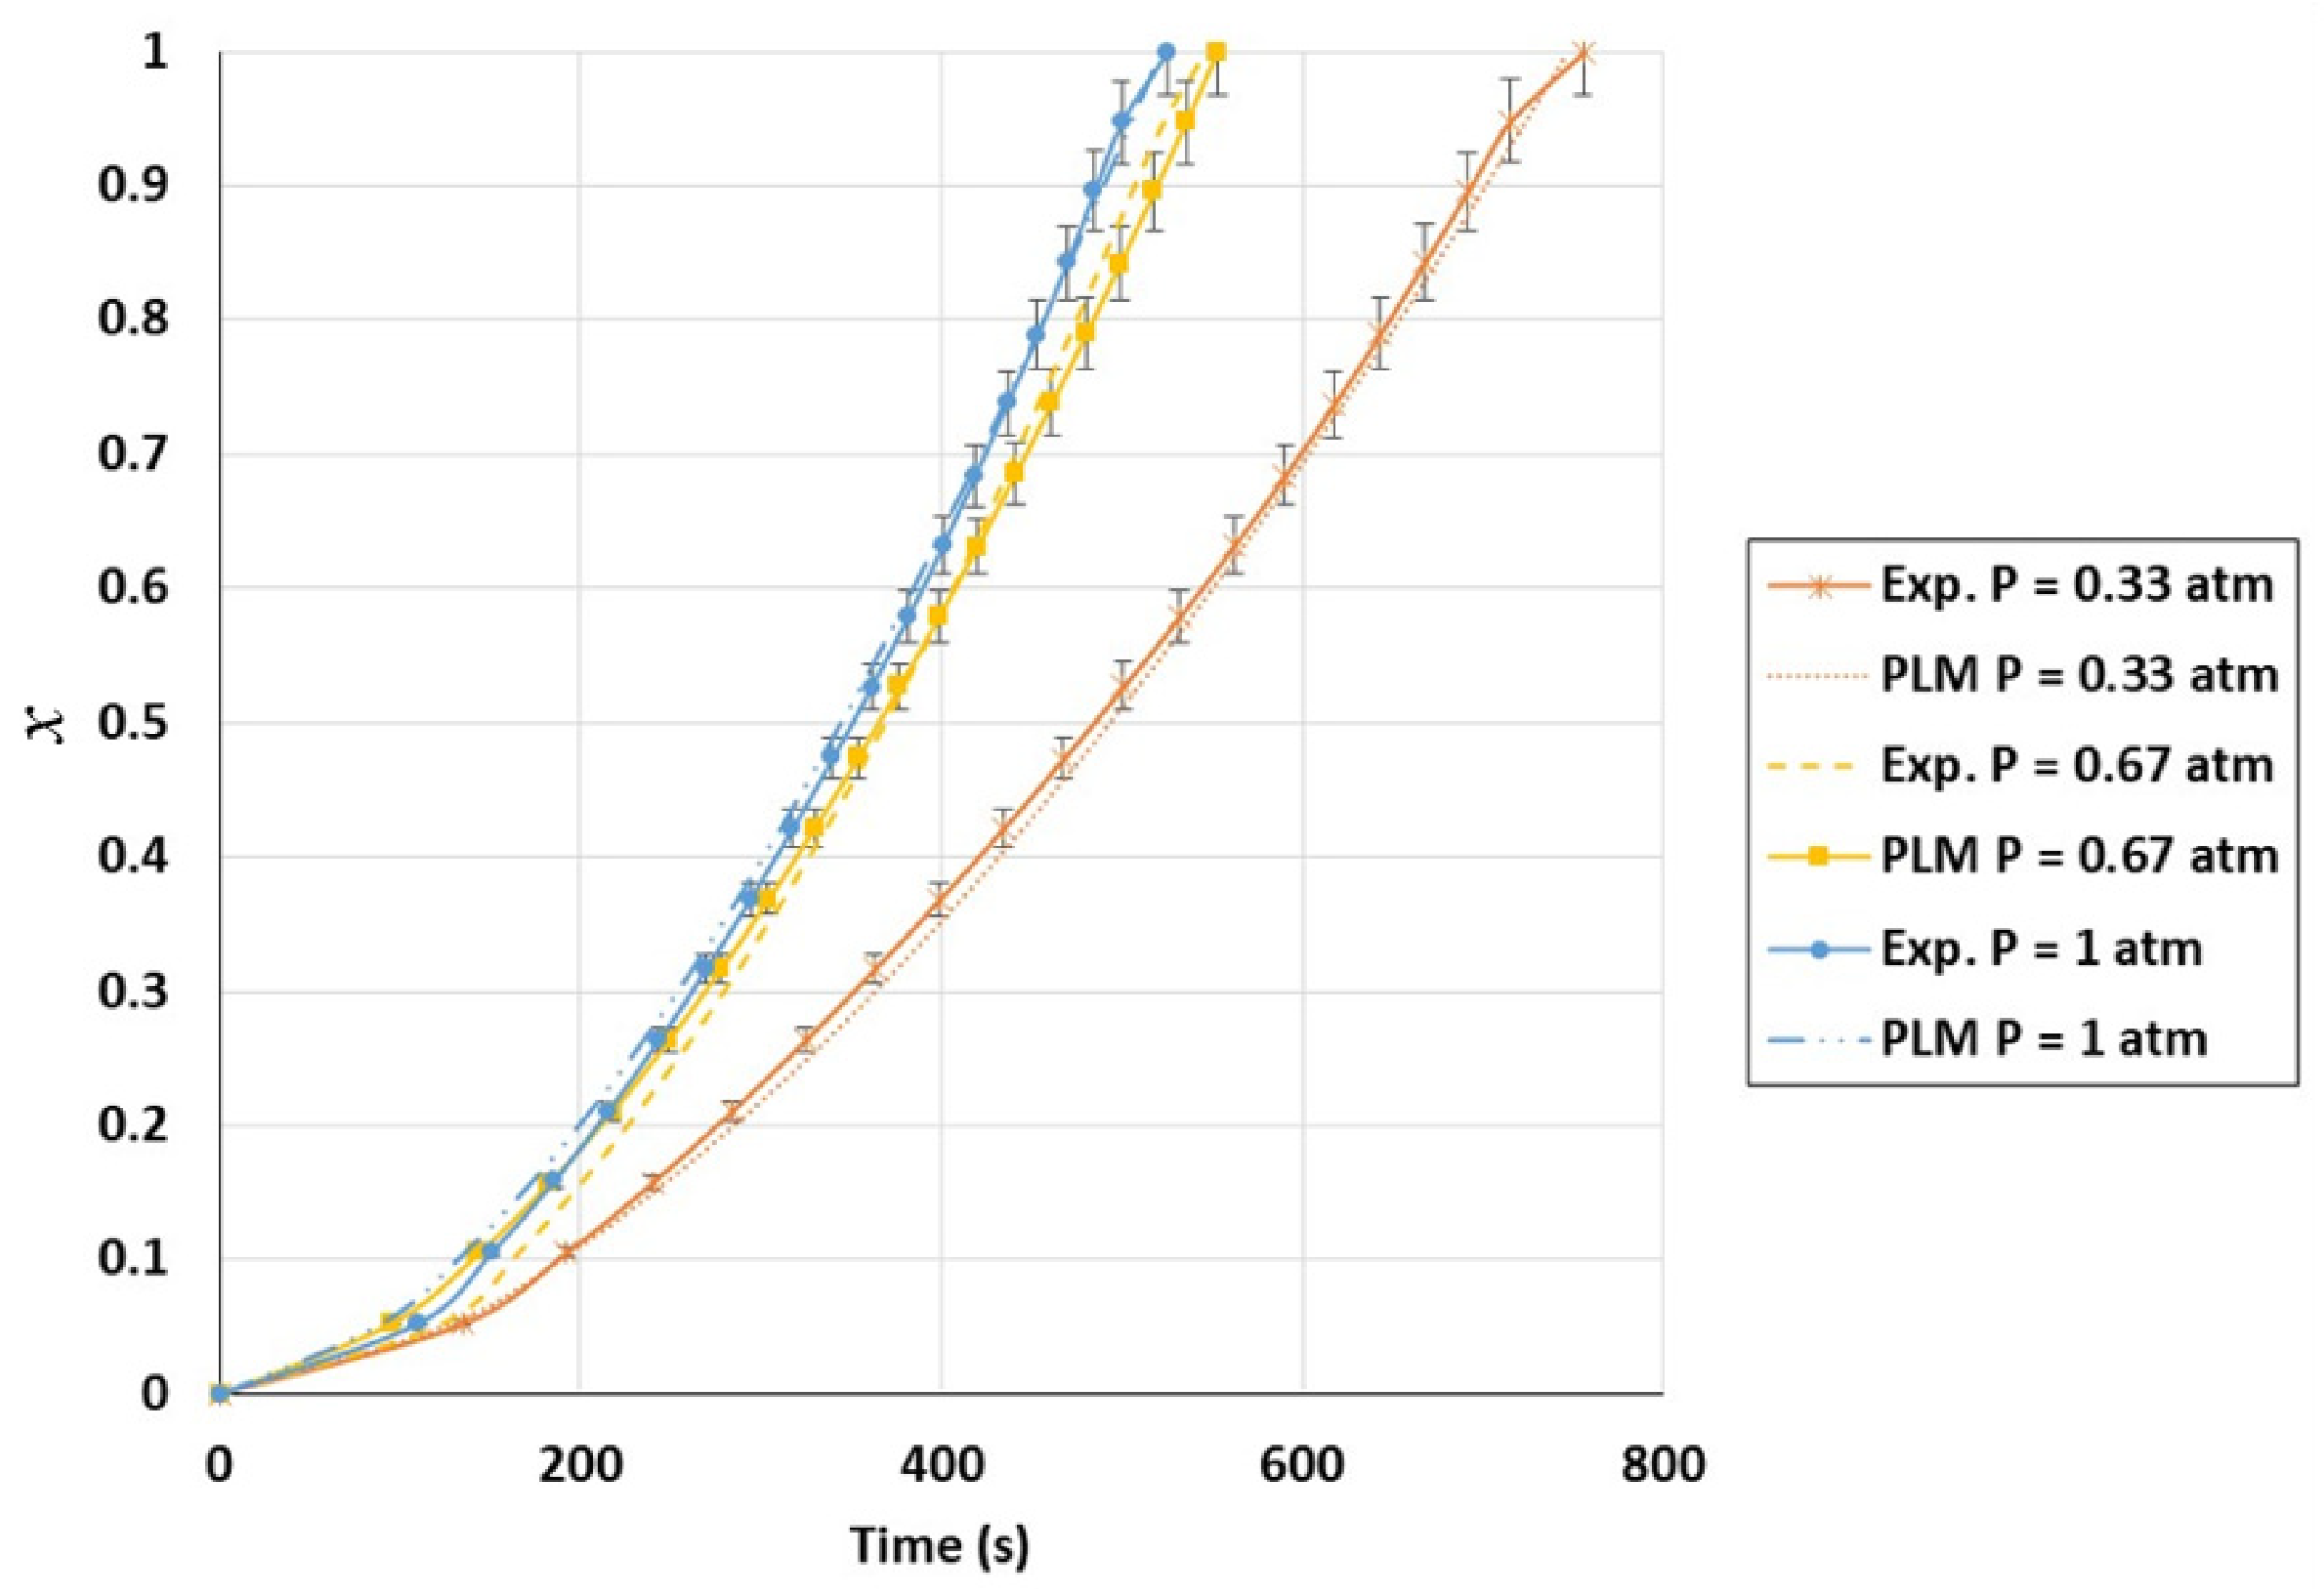
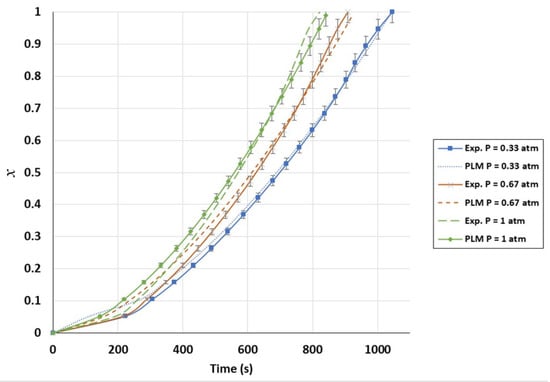
Figure A2.
Validation of conversion curves of experimental test and power-law model (PLM); partial pressure effect, temperature of 1000 °C, and CO2/C ratio of 3.5.
Figure A2.
Validation of conversion curves of experimental test and power-law model (PLM); partial pressure effect, temperature of 1000 °C, and CO2/C ratio of 3.5.
Appendix A.5. Conversion Rate as a Function of Time in the Case of the Fluidized Bed Reactor
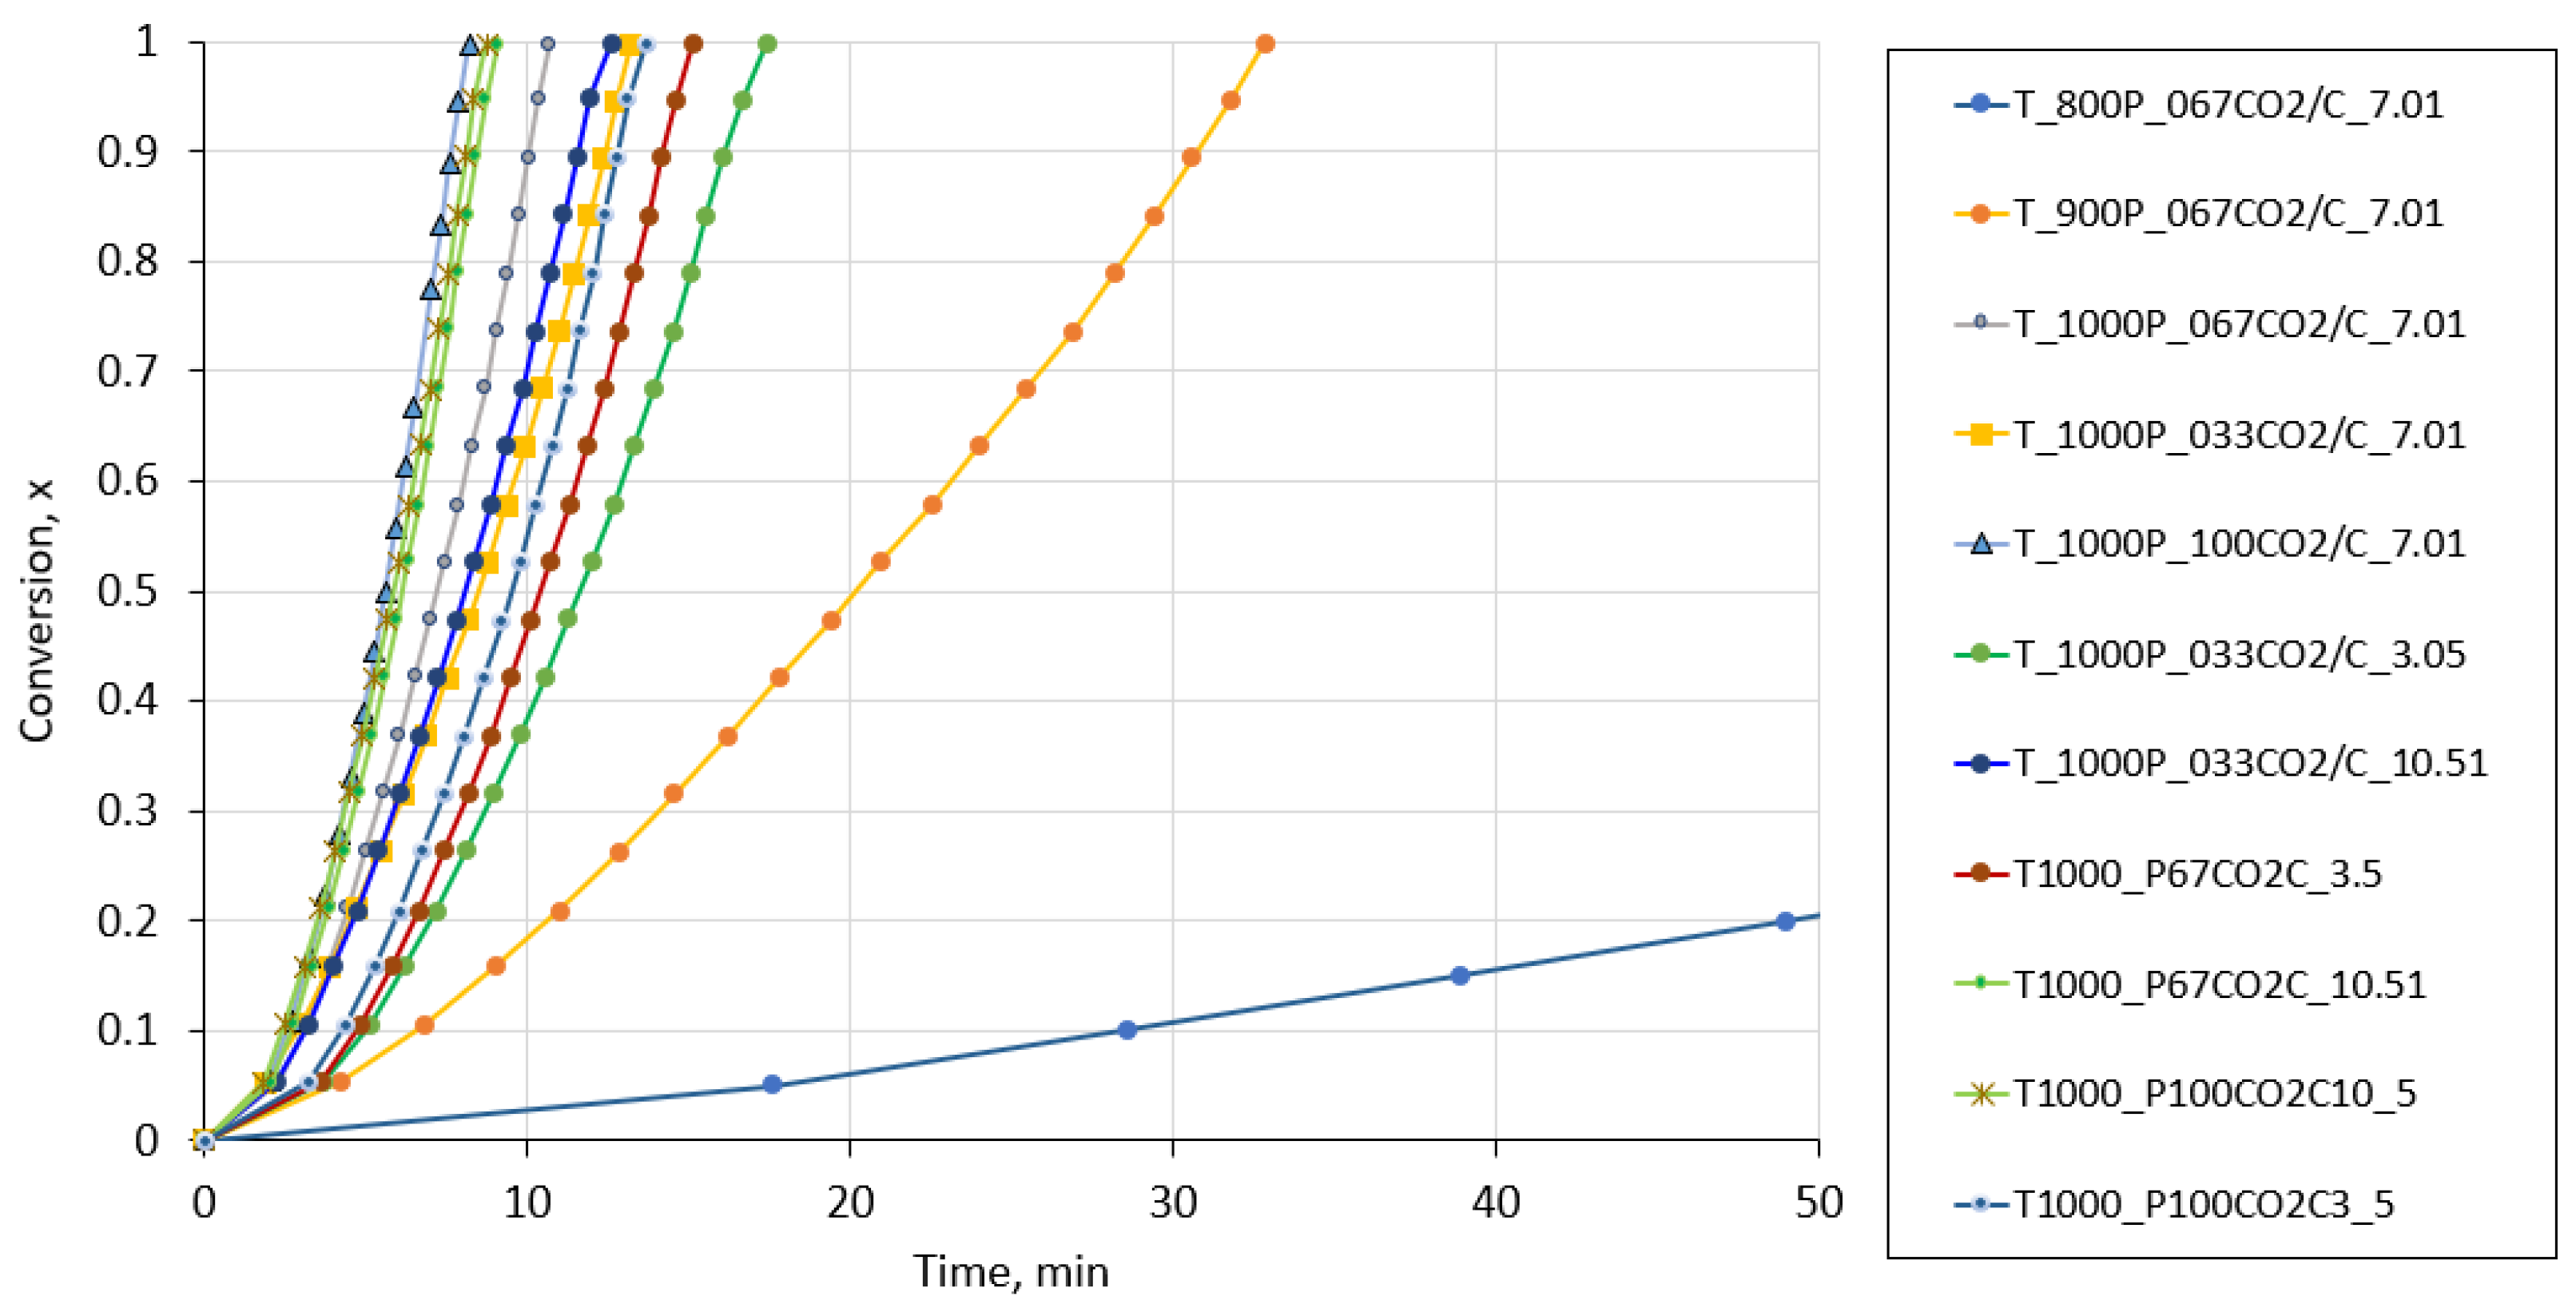
The experimental results, expressed as the conversion rate as a function of time under the different experimental conditions studied in this work for the fluidized bed reactor, are shown in Figure A3.
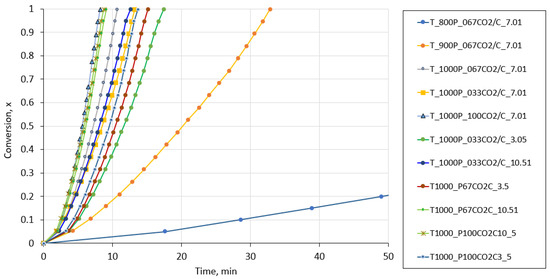
Figure A3.
Conversion rate as a function of time under the different experimental conditions studied in this work in the case of the fluidized bed reactor.
Figure A3.
Conversion rate as a function of time under the different experimental conditions studied in this work in the case of the fluidized bed reactor.
A comparison between the SCM model curves and the experimental data yielded a standard deviation of around 1.5%. The model’s accuracy is clearly illustrated in Figure A4.
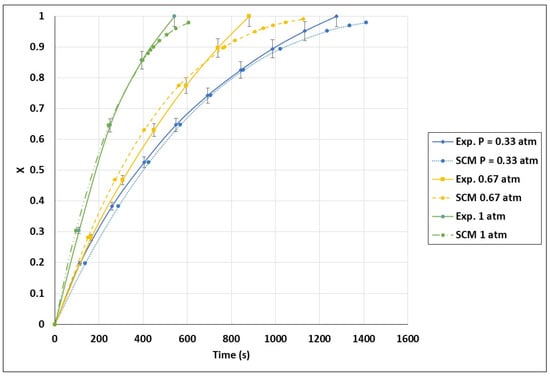
Figure A4.
Validation of conversion curves of experimental test and shrinking core model (SCM), partial pressure effect. Temperature: 1000 °C and CO2/C: 7.01.
Figure A4.
Validation of conversion curves of experimental test and shrinking core model (SCM), partial pressure effect. Temperature: 1000 °C and CO2/C: 7.01.
References
- The European Green Deal—European Commission. Available online: https://commission.europa.eu/strategy-and-policy/priorities-2019-2024/european-green-deal_en (accessed on 17 April 2025).
- Hassan, Q.; Viktor, P.; Al-Musawi, T.J.; Ali, B.M.; Algburi, S.; Alzoubi, H.M.; Al-Jiboory, A.K.; Sameen, A.Z.; Salman, H.M.; Jaszczur, M. The renewable energy role in the global energy Transformations. Renew. Energy Focus 2024, 48, 100545. [Google Scholar] [CrossRef]
- Nagaj, R.; Gajdzik, B.; Wolniak, R.; Grebski, W.W. The Impact of Deep Decarbonization Policy on the Level of Greenhouse Gas Emissions in the European Union. Energies 2024, 17, 1245. [Google Scholar] [CrossRef]
- Worku, A.K.; Ayele, D.W.; Deepak, D.B.; Gebreyohannes, A.Y.; Agegnehu, S.D.; Kolhe, M.L. Recent Advances and Challenges of Hydrogen Production Technologies via Renewable Energy Sources. Adv. Energy Sustain. Res. 2024, 5, 2300273. [Google Scholar] [CrossRef]
- Mignogna, D.; Szabó, M.; Ceci, P.; Avino, P. Biomass Energy and Biofuels: Perspective, Potentials, and Challenges in the Energy Transition. Sustainability 2024, 16, 7036. [Google Scholar] [CrossRef]
- Yang, Y.; Zhou, T.; Cheng, M.; Xie, M.; Shi, N.; Liu, T.; Huang, Z.; Zhao, Y.; Huang, Q.; Liu, Z.; et al. Recent advances in organic waste pyrolysis and gasification in a CO2 environment to value-added products. J. Environ. Manag. 2024, 356, 120666. [Google Scholar] [CrossRef]
- Abu El-Rub, Z.; Bramer, E.A.; Brem, G. Review of Catalysts for Tar Elimination in Biomass Gasification Processes. Ind. Eng. Chem. Res. 2004, 43, 6911–6919. [Google Scholar] [CrossRef]
- Buentello-Montoya, D.; Zhang, X. An Energy and Exergy Analysis of Biomass Gasification Integrated with a Char-Catalytic Tar Reforming System. Energy Fuels 2019, 33, 8746–8757. [Google Scholar] [CrossRef]
- Li, T.; Niu, Y.; Wang, L.; Shaddix, C.; Løvås, T. High temperature gasification of high heating-rate chars using a flat-flame reactor. Appl. Energy 2018, 227, 100–107. [Google Scholar] [CrossRef]
- Wang, G.; Zhang, J.; Shao, J.; Zhang, P. Experiments and Kinetics Modeling for Gasification of Biomass Char and Coal Char under CO2 and Steam Condition. In Proceedings of the TMS 2016 145th Annual Meeting & Exhibition, Nashville, TN, USA, 14–18 February 2016. [Google Scholar] [CrossRef]
- Reschmeier, R.; Karl, J. Experimental study of wood char gasification kinetics in fluidized beds. Biomass Bioenergy 2016, 85, 288–299. [Google Scholar] [CrossRef]
- Zuo, H.-B.; Zhang, P.-C.; Zhang, J.-L.; Bi, X.-T.; Geng, W.-W.; Wang, G.-W. Isothermal CO2 Gasification Reactivity and Kinetic Models of Biomass Char/Anthracite Char. BioResources 2015, 10, 5242–5245. [Google Scholar] [CrossRef]
- Goel, A.; Moghaddam, E.M.; Liu, W.; He, C.; Konttinen, J. Biomass chemical looping gasification for high-quality syngas: A critical review and technological outlooks. Energy Convers. Manag. 2022, 268, 116020. [Google Scholar] [CrossRef]
- Habibollahzade, A.; Ahmadi, P.; Rosen, M.A. Biomass gasification using various gasification agents: Optimum feed-stock selection, detailed numerical analyses and tri-objective grey wolf optimization. J. Clean. Prod. 2021, 284, 124718. [Google Scholar] [CrossRef]
- Zhang, Y.; Wan, L.; Guan, J.; Xiong, Q.; Zhang, S.; Jin, X. A Review on Biomass Gasification: Effect of Main Parameters on Char Generation and Reaction. Energy Fuels 2020, 34, 13438–13455. [Google Scholar] [CrossRef]
- Di Blasi, C. Combustion and gasification rates of lignocellulosic chars. Prog. Energy Combust. Sci. 2009, 35, 121–140. [Google Scholar] [CrossRef]
- Yadav, V.K.; Shankar, R.; Kumar, V. Numerical simulation for the steam gasification of single char particle. Chem. Pap. 2021, 75, 863–872. [Google Scholar] [CrossRef]
- Groeneveld, M.J.; van Swaaij, W.P.M. Gasification of char particles with CO2 and H2O. Chem. Eng. Sci. 1980, 35, 307–313. [Google Scholar] [CrossRef]
- Nguyen, H.N.; Van De Steene, L.; Le, D.D. Kinetics of rice husk char gasification in an H2O or a CO2 atmosphere. Energy Sources Part A Recovery Util. Environ. Eff. 2018, 40, 1701–1713. [Google Scholar] [CrossRef]
- Yuan, S.; Chen, X.-L.; Li, J.; Wang, F.-C. CO2 Gasification Kinetics of Biomass Char Derived from High-Temperature Rapid Pyrolysis. Energy Fuels 2011, 25, 2314–2321. [Google Scholar] [CrossRef]
- Chew, J.J.; Soh, M.; Sunarso, J.; Yong, S.T.; Doshi, V.; Bhattacharya, S. Isothermal kinetic study of CO2 gasification of torrefied oil palm biomass. Biomass Bioenergy 2020, 134, 105487. [Google Scholar] [CrossRef]
- Wang, Y.; Ge, Z.; Shang, F.; Zhou, C.; Guo, S.; Ren, C. Kinetic analysis of CO2 gasification of corn straw. Renew. Energy 2023, 203, 219–227. [Google Scholar] [CrossRef]
- Abdelouahed, L.; Leveneur, S.; Vernieres-Hassimi, L.; Balland, L.; Taouk, B. Comparative investigation for the determination of kinetic parameters for biomass pyrolysis by thermogravimetric analysis. J. Therm. Anal. Calorim. 2017, 129, 1201–1213. [Google Scholar] [CrossRef]
- Boukaous, N.; Abdelouahed, L.; Chikhi, M.; Meniai, A.-H.; Mohabeer, C.; Bechara, T. Combustion of flax shives, beech wood, pure woody pseudo-components and their chars: A thermal and kinetic study. Energies 2018, 11, 2146. [Google Scholar] [CrossRef]
- Doyle, C.D. Kinetic analysis of thermogravimetric data. J. Appl. Polym. Sci. 1961, 5, 285–292. [Google Scholar] [CrossRef]
- de Godois Baroni, É.; Tannous, K.; Rueda-Ordóñez, Y.J.; Tinoco-Navarro, L.K. The applicability of isoconversional models in estimating the kinetic parameters of biomass pyrolysis. J. Therm. Anal. Calorim. 2016, 123, 909–917. [Google Scholar] [CrossRef]
- Cai, J.; Alimujiang, S. Kinetic analysis of wheat straw oxidative pyrolysis using thermogravimetric analysis: Statistical description and isoconversional kinetic analysis. Ind. Eng. Chem. Res. 2008, 48, 619–624. [Google Scholar] [CrossRef]
- Damartzis, T.; Vamvuka, D.; Sfakiotakis, S.; Zabaniotou, A. Thermal degradation studies and kinetic modeling of cardoon (Cynara cardunculus) pyrolysis using thermogravimetric analysis (TGA). Bioresour. Technol. 2011, 102, 6230–6238. [Google Scholar] [CrossRef]
- Starink, M.J. The determination of activation energy from linear heating rate experiments: A comparison of the accuracy of isoconversion methods. Thermochim. Acta 2003, 404, 163–176. [Google Scholar] [CrossRef]
- Vyazovkin, S.; Dollimore, D. Linear and nonlinear procedures in isoconversional computations of the activation energy of nonisothermal reactions in solids. J. Chem. Inf. Comput. Sci. 1996, 36, 42–45. [Google Scholar] [CrossRef]
- Wu, W.; Cai, J.; Liu, R. Isoconversional kinetic analysis of distributed activation energy model processes for pyrolysis of solid fuels. Ind. Eng. Chem. Res. 2013, 52, 14376–14383. [Google Scholar] [CrossRef]
- Rubinsin, N.J.; Karim, N.A.; Timmiati, S.N.; Lim, K.L.; Isahak, W.N.R.W.; Pudukudy, M. An overview of the enhanced biomass gasification for hydrogen production. Int. J. Hydrogen Energy 2024, 49, 1139–1164. [Google Scholar] [CrossRef]
- Song, T.; Xu, J. Experiments and modeling of fluidized bed steam-biomass char gasification with a red-mud oxygen carrier at particle scale for chemical looping. Combust. Flame 2023, 256, 112946. [Google Scholar] [CrossRef]
- Dupont, C.; Boissonnet, G.; Seiler, J.-M.; Gauthier, P.; Schweich, D. Study about the kinetic processes of biomass steam gasification. Fuel 2007, 86, 32–40. [Google Scholar] [CrossRef]
- Dupont, C.; Commandré, J.-M.; Gauthier, P.; Boissonnet, G.; Salvador, S.; Schweich, D. Biomass pyrolysis experiments in an analytical entrained flow reactor between 1073K and 1273K. Fuel 2008, 87, 1155–1164. [Google Scholar] [CrossRef]
- Septien, S.; Valin, S.; Dupont, C.; Peyrot, M.; Salvador, S. Effect of particle size and temperature on woody biomass fast pyrolysis at high temperature (1000–1400 °C). Fuel 2012, 97, 202–210. [Google Scholar] [CrossRef]
- Mueller, A.; Haustein, H.D.; Stoesser, P.; Kreitzberg, T.; Kneer, R.; Kolb, T. Gasification Kinetics of Biomass- and Fos-sil-Based Fuels: Comparison Study Using Fluidized Bed and Thermogravimetric Analysis. Energy Fuels 2015, 29, 6717–6723. [Google Scholar] [CrossRef]
- Chen, C.; Zhang, S.; Xu, K.; Luo, G.; Yao, H. Experimental and Modeling Study of Char Gasification with Mixtures of CO2 and H2O. Energy Fuels 2016, 30, 1628–1635. [Google Scholar] [CrossRef]
- Vyazovkin, S.; Wight, C.A. Model-free and model-fitting approaches to kinetic analysis of isothermal and nonisothermal data. Thermochim. Acta 1999, 340–341, 53–68. [Google Scholar] [CrossRef]
- LReyes, L.; Abdelouahed, L.; Campusano, B.; Buvat, J.-C.; Taouk, B. Exergetic study of beech wood gasification in fluidized bed reactor using CO2 or steam as gasification agents. Fuel Process. Technol. 2021, 213, 106664. [Google Scholar] [CrossRef]
- García, R.; Pizarro, C.; Lavín, A.G.; Bueno, J.L. Biomass proximate analysis using thermogravimetry. Bioresour. Technol. 2013, 139, 1–4. [Google Scholar] [CrossRef]
- Han, K.; Levenspiel, O. Extended monod kinetics for substrate, product, and cell inhibition. Biotechnol. Bioeng. 1988, 32, 430–447. [Google Scholar] [CrossRef]
- Preciado-Hernandez, J.; Zhang, J.; Zhu, M.; Zhang, Z.; Zhang, D. An experimental study of CO2 gasification kinetics during activation of a spent tyre pyrolysis char. Chem. Eng. Res. Des. 2019, 149, 129–137. [Google Scholar] [CrossRef]
- Tong, S.; Li, L.; Duan, L.; Zhao, C.; Anthony, E.J. A kinetic study on lignite char gasification with CO2 and H2O in a fluidized bed reactor. Appl. Therm. Eng. 2019, 147, 602–609. [Google Scholar] [CrossRef]
- Galadima, A.; Muraza, O. Catalytic thermal conversion of CO2 into fuels: Perspective and challenges. Renew. Sustain. Energy Rev. 2019, 115, 109333. [Google Scholar] [CrossRef]
- Kaltschmitt, T.; Deutschmann, O. Chapter 1—Fuel Processing for Fuel Cells. In Advances in Chemical Engineering; Sundmacher, K., Ed.; Fuel Cell Engineering; Academic Press: Cambridge, MA, USA, 2012; Volume 41, pp. 1–64. [Google Scholar] [CrossRef]
- Bai, Y.; Wang, Y.; Zhu, S.; Yan, L.; Li, F.; Xie, K. Synergistic effect between CO2 and H2O on reactivity during coal chars gasification. Fuel 2014, 126, 1–7. [Google Scholar] [CrossRef]
- Palacio, K.; Sanchez, A.; Espinal, J.F. Thermodynamic evaluation of carbon dioxide gasification reactions at oxy-combustion conditions. Combust. Sci. Technol. 2018, 190, 1515–1527. [Google Scholar] [CrossRef]
- Wang, L.; Maziarka, P.; Skreiberg, Ø.; Løvås, T.; Wądrzyk, M.; Sevault, A. Study of CO2 gasification reactivity of biocarbon produced at different conditions. Energy Procedia 2017, 142, 991–996. [Google Scholar] [CrossRef]
- Morin, M.; Pécate, S.; Hémati, M. Experimental study and modelling of the kinetic of biomass char gasification in a fluidized bed reactor. Chem. Eng. Res. Des. 2018, 131, 488–505. [Google Scholar] [CrossRef]
- Kumar, M.; Gupta, R.; Sharma, T. Effects of carbonisation conditions on the yield and chemical composition of Acacia and Eucalyptus wood chars. Biomass Bioenergy 1992, 3, 411–417. [Google Scholar] [CrossRef]
- Mianowski, A.; Radko, T.; Siudyga, T. The reactivity of cokes in Boudouard–Bell reactions in the context of an Ergun model. J. Therm. Anal. Calorim. 2015, 122, 1013–1021. [Google Scholar] [CrossRef]
- Roberts, D.G.; Harris, D.J. High-Pressure Char Gasification Kinetics: CO Inhibition of the C–CO2 Reaction. Energy Fuels 2012, 26, 176–184. [Google Scholar] [CrossRef]
- Basu, P. Biomass Gasification, Pyrolysis and Torrefaction: Practical Design and Theory, 2nd ed.; Academic Press: Boston, MA, USA, 2013. [Google Scholar]
- Zeng, X.; Wang, F.; Wang, Y.; Li, A.; Yu, J.; Xu, G. Characterization of Char Gasification in a Micro Fluidized Bed Reaction Analyzer. Energy Fuels 2014, 28, 1838–1845. [Google Scholar] [CrossRef]
- Cluet, B. Évaluation de la Ségrégation de la Biomasse dans un lit Fluidisé et Modélisation Globale du Procédé de Gazéification. Ph.D. Thesis, Université de Lorraine, Lorraine, France, 2014. [Google Scholar]
- Lardier, G.; Kaknics, J.; Dufour, A.; Michel, R.; Cluet, B.; Authier, O.; Poirier, J.; Mauviel, G. Gas and Bed Axial Composition in a Bubbling Fluidized Bed Gasifier: Results with Miscanthus and Olivine. Energy Fuels 2016, 30, 8316–8326. [Google Scholar] [CrossRef]
- Iqbal, Y.; Lewandowski, I. Biomass composition and ash melting behaviour of selected miscanthus genotypes in Southern Germany. Fuel 2016, 180, 606–612. [Google Scholar] [CrossRef]
- Sajjadi, B.; Chen, W.-Y.; Egiebor, N.O. A comprehensive review on physical activation of biochar for energy and environmental applications. Rev. Chem. Eng. 2019, 35, 735–776. [Google Scholar] [CrossRef]
- Hu, Y.; Yu, H.; Zhou, F.; Chen, D. A comparison between CO2 gasification of various biomass chars and coal char. Can. J. Chem. Eng. 2019, 97, 1326–1331. [Google Scholar] [CrossRef]
- Liu, H.; Luo, C.; Kato, S.; Uemiya, S.; Kaneko, M.; Kojima, T. Kinetics of CO2/Char gasification at elevated temperatures: Part I: Experimental results. Fuel Process. Technol. 2006, 87, 775–781. [Google Scholar] [CrossRef]
- Nowicki, L.; Antecka, A.; Bedyk, T.; Stolarek, P.; Ledakowicz, S. The kinetics of gasification of char derived from sewage sludge. J. Therm. Anal. Calorim. 2011, 104, 693–700. [Google Scholar] [CrossRef]
- Guizani, C. Effects of CO2 on the Biomass Pyro-Gasification in High Heating Rate and Low Heating Rate Conditions. Ph.D. Thesis, Ecole des Mines d’Albi-Carmaux, Albi, France, 2014. [Google Scholar]
- Gómez-Barea, A.; Ollero, P.; Fernández-Baco, C. Diffusional Effects in CO2 Gasification Experiments with Single Biomass Char Particles. 1. Experimental Investigation. Energy Fuels 2006, 20, 2202–2210. [Google Scholar] [CrossRef]
- Ollero, P.; Serrera, A.; Arjona, R.; Alcantarilla, S. The CO2 gasification kinetics of olive residue. Biomass Bioenergy 2003, 24, 151–161. [Google Scholar] [CrossRef]
- Barrio, M.; Hustad, J.E. CO2 Gasification of Birch Char and the Effect of CO Inhibition on the Calculation of Chemical Kinetics. In Progress in Thermochemical Biomass Conversion; John Wiley & Sons, Ltd.: Hoboken, NJ, USA, 2008; pp. 47–60. [Google Scholar]
- Sun, Q.; Li, W.; Chen, H.; Li, B. The CO2-gasification and kinetics of Shenmu maceral chars with and without catalyst. Fuel 2004, 83, 1787–1793. [Google Scholar] [CrossRef]
- Diedhiou, A.; Ndiaye, L.-G.; Bensakhria, A.; Sock, O. Thermochemical conversion of cashew nut shells, palm nut shells and peanut shells char with CO2 and/or steam to aliment a clay brick firing unit. Renew. Energy 2019, 142, 581–590. [Google Scholar] [CrossRef]
- DeGroot, W.F.; Shafizadeh, F. Kinetics of gasification of Douglas Fir and Cottonwood chars by carbon dioxide. Fuel 1984, 63, 210–216. [Google Scholar] [CrossRef]
- Van de Steene, L.; Tagutchou, J.; Sanz, F.E.; Salvador, S. Gasification of woodchip particles: Experimental and numerical study of char–H2O, char–CO2, and char–O2 reactions. Chem. Eng. Sci. 2011, 66, 4499–4509. [Google Scholar] [CrossRef]
- Matsui, I.; Kunii, D.; Furusawa, T. Study of char gasification by carbon dioxide. 1. Kinetic study by thermogravimetric analysis. Ind. Eng. Chem. Res. 1987, 26, 91–95. [Google Scholar] [CrossRef]
- Kreitzberg, T.; Haustein, H.; Gövert, B.; Kneer, R. Investigation of gasification reaction of pulverized char under N2/CO2 atmosphere in a small-scale fluidized bed reactor. J. Energy Resour. Technol. 2016, 138, 042207. [Google Scholar] [CrossRef]
- Bhavanam, A.; Sastry, R. Kinetic study of solid waste pyrolysis using distributed activation energy model. Bioresour. Technol. 2015, 178, 126–131. [Google Scholar] [CrossRef] [PubMed]
- Miura, K.; Maki, T. A Simple Method for Estimating f(E) and k0(E) in the Distributed Activation Energy Model. Energy Fuels 1998, 12, 864–869. [Google Scholar] [CrossRef]
- Coats, A.W.; Redfern, J.P. Kinetic parameters from thermogravimetric data. Nature 1964, 201, 68–69. [Google Scholar] [CrossRef]
- Soria-Verdugo, A.; Garcia-Hernando, N.; Garcia-Gutierrez, L.; Ruiz-Rivas, U. Analysis of biomass and sewage sludge devolatilization using the distributed activation energy model. Energy Convers. Manag. 2013, 65, 239–244. [Google Scholar] [CrossRef]

Disclaimer/Publisher’s Note: The statements, opinions and data contained in all publications are solely those of the individual author(s) and contributor(s) and not of MDPI and/or the editor(s). MDPI and/or the editor(s) disclaim responsibility for any injury to people or property resulting from any ideas, methods, instructions or products referred to in the content. |
© 2025 by the authors. Licensee MDPI, Basel, Switzerland. This article is an open access article distributed under the terms and conditions of the Creative Commons Attribution (CC BY) license (https://creativecommons.org/licenses/by/4.0/).