1. Introduction
A direct methanol fuel cell (DMFC) is a type of fuel cell that directly converts the chemical energy found in methanol into electricity through an electrochemical reaction. Due to its high energy density, low emissions, and the ability to use a liquid fuel, this type of fuel cell has gained significant attention as a promising alternative energy source for portable and small-scale applications [
1]. So, micro- and mini-DMFCs are promising technologies [
2,
3,
4,
5]. In recent years, significant progress has been made in improving the efficiency and performance of DMFCs, particularly through the development of new catalysts [
6,
7,
8] and better electrolyte membranes for use fuel cells which have improved ionic conductivity [
9,
10,
11,
12]. Additionally, there have been advances in cost reduction and scalability by using cheaper materials and more efficient manufacturing methods [
13]. The influence of operative parameters in the output performance has also been analyzed [
14,
15,
16]. Despite the progress made, several challenges remain for DMFC technology [
2]. Methanol transport passing through the membrane from the anode to the cathode, known as methanol crossover, is one of the major issues concerning DMFC technology. This results in high fuel loss and leakage current due to the oxidation of methanol produced at the cathode, and several studies have been dedicated to analyzing this problem [
11,
17,
18,
19,
20]. Another significant issue occurring at the anode is the formation of CO
2 bubbles, which can eventually block the flow. Work has been devoted to understanding the flow dynamics [
21,
22,
23].
Depending on the supply mode of the fuel and the oxidant to the fuel cell, DMFC systems can be categorized into active, semi-passive, or passive modes [
2,
24]. The passive mode is ideal for portable devices as it does not require a fuel pump or active airflow, thus reducing system complexity and operational costs. However, this mode also presents some challenges, such as lower efficiency compared to active systems and a higher risk of unreacted methanol accumulation. This can lead to energy losses and lower efficiency if the operating conditions are not properly managed. In the active mode, circulating systems are used to supply methanol and oxygen to the anode and cathode, respectively [
24,
25]. In the semi-passive mode with an active anode, auxiliary components are necessary to supply fuel to the anode, while oxygen is directly taken from the ambient air surrounding the system.
Incorporating a circulation system for methanol in the anode of DMFCs offers several key advantages, such as a more uniform reactant distribution, better control of methanol concentration, minimized methanol loss and catalyst poisoning, and improve temperature control of the fuel cell. Moreover, it helps to remove CO
2 accumulation by extracting it from the reaction zone. A well-designed circulation system can enhance the performance and longevity of the DMFC. However, the use of a circulating system increases its complexity, and if the flow rate is not optimized, it may negatively impact DMFC performance. There has been a growing interest in active and semi-passive DMFCs [
2,
25,
26,
27,
28,
29,
30]. Therefore, more research into these modes is required. The impact of methanol flow under various operational conditions, such as differing concentrations and temperatures, as well as the interdependence between these factors, has not been fully explored.
This study addresses this gap by analyzing the influence of methanol flow at different temperatures and concentrations in a semi-passive DMFC configuration. Through a parametric experimental approach, we examine how methanol flow, concentration, and temperature interact to affect fuel cell performance, aiming to identify operational conditions that optimize cell efficiency. The findings contribute to advancing the understanding of semi-passive DMFCs and offer valuable insights for improving the design and operation of mini-DMFC systems in real-world applications.
2. Fundamentals of the DMFC
A direct methanol fuel cell (DMFC) is a type of fuel cell that uses a methanol–water solution as fuel and a proton exchange membrane as the electrolyte. The chemical reactions occurring within a DMFC are as follows:
Polarization curves are an effective way of characterizing the performance of a fuel cell. The form of this curve shows the different voltage losses, such as activation, crossover, ohmic, and concentration losses [
31,
32]. The equation for the actual cell voltage, considering the different losses, can be expressed as the following:
where
Eact takes into account both activation and crossover losses,
Eohm and
Econ indicate, respectively, ohmic and concentration losses, and
Er indicates the fuel cell reversible voltage, which depends on the temperature and pressure.
Under various simplifications [
32], Equation (4) can be written as the following:
where
α and
i0, transfer coefficient and exchange current density, respectively, are parameters involved in activation losses,
iloss is the lost current due to crossover fuel and the internal current,
Rfc is the ohmic fuel cell resistance, involved in ohmic losses, and
iL is the limiting current density related to concentration polarization losses.
Operating conditions affect all the terms in Equation (5) in a different way.
Er can be expressed as a function of temperature and partial pressure of the reactant, using the Nernst equation [
33].
If all methanol is not completely oxidized in the anodic catalytic layer (Equation (1)) before it can reach the membrane surface, it can pass through the membrane to the cathode side leading to fuel cell performance losses, an effect known as methanol crossover. In a direct methanol fuel cell, the main contribution to iloss is generally due to the crossover of methanol through the membrane.
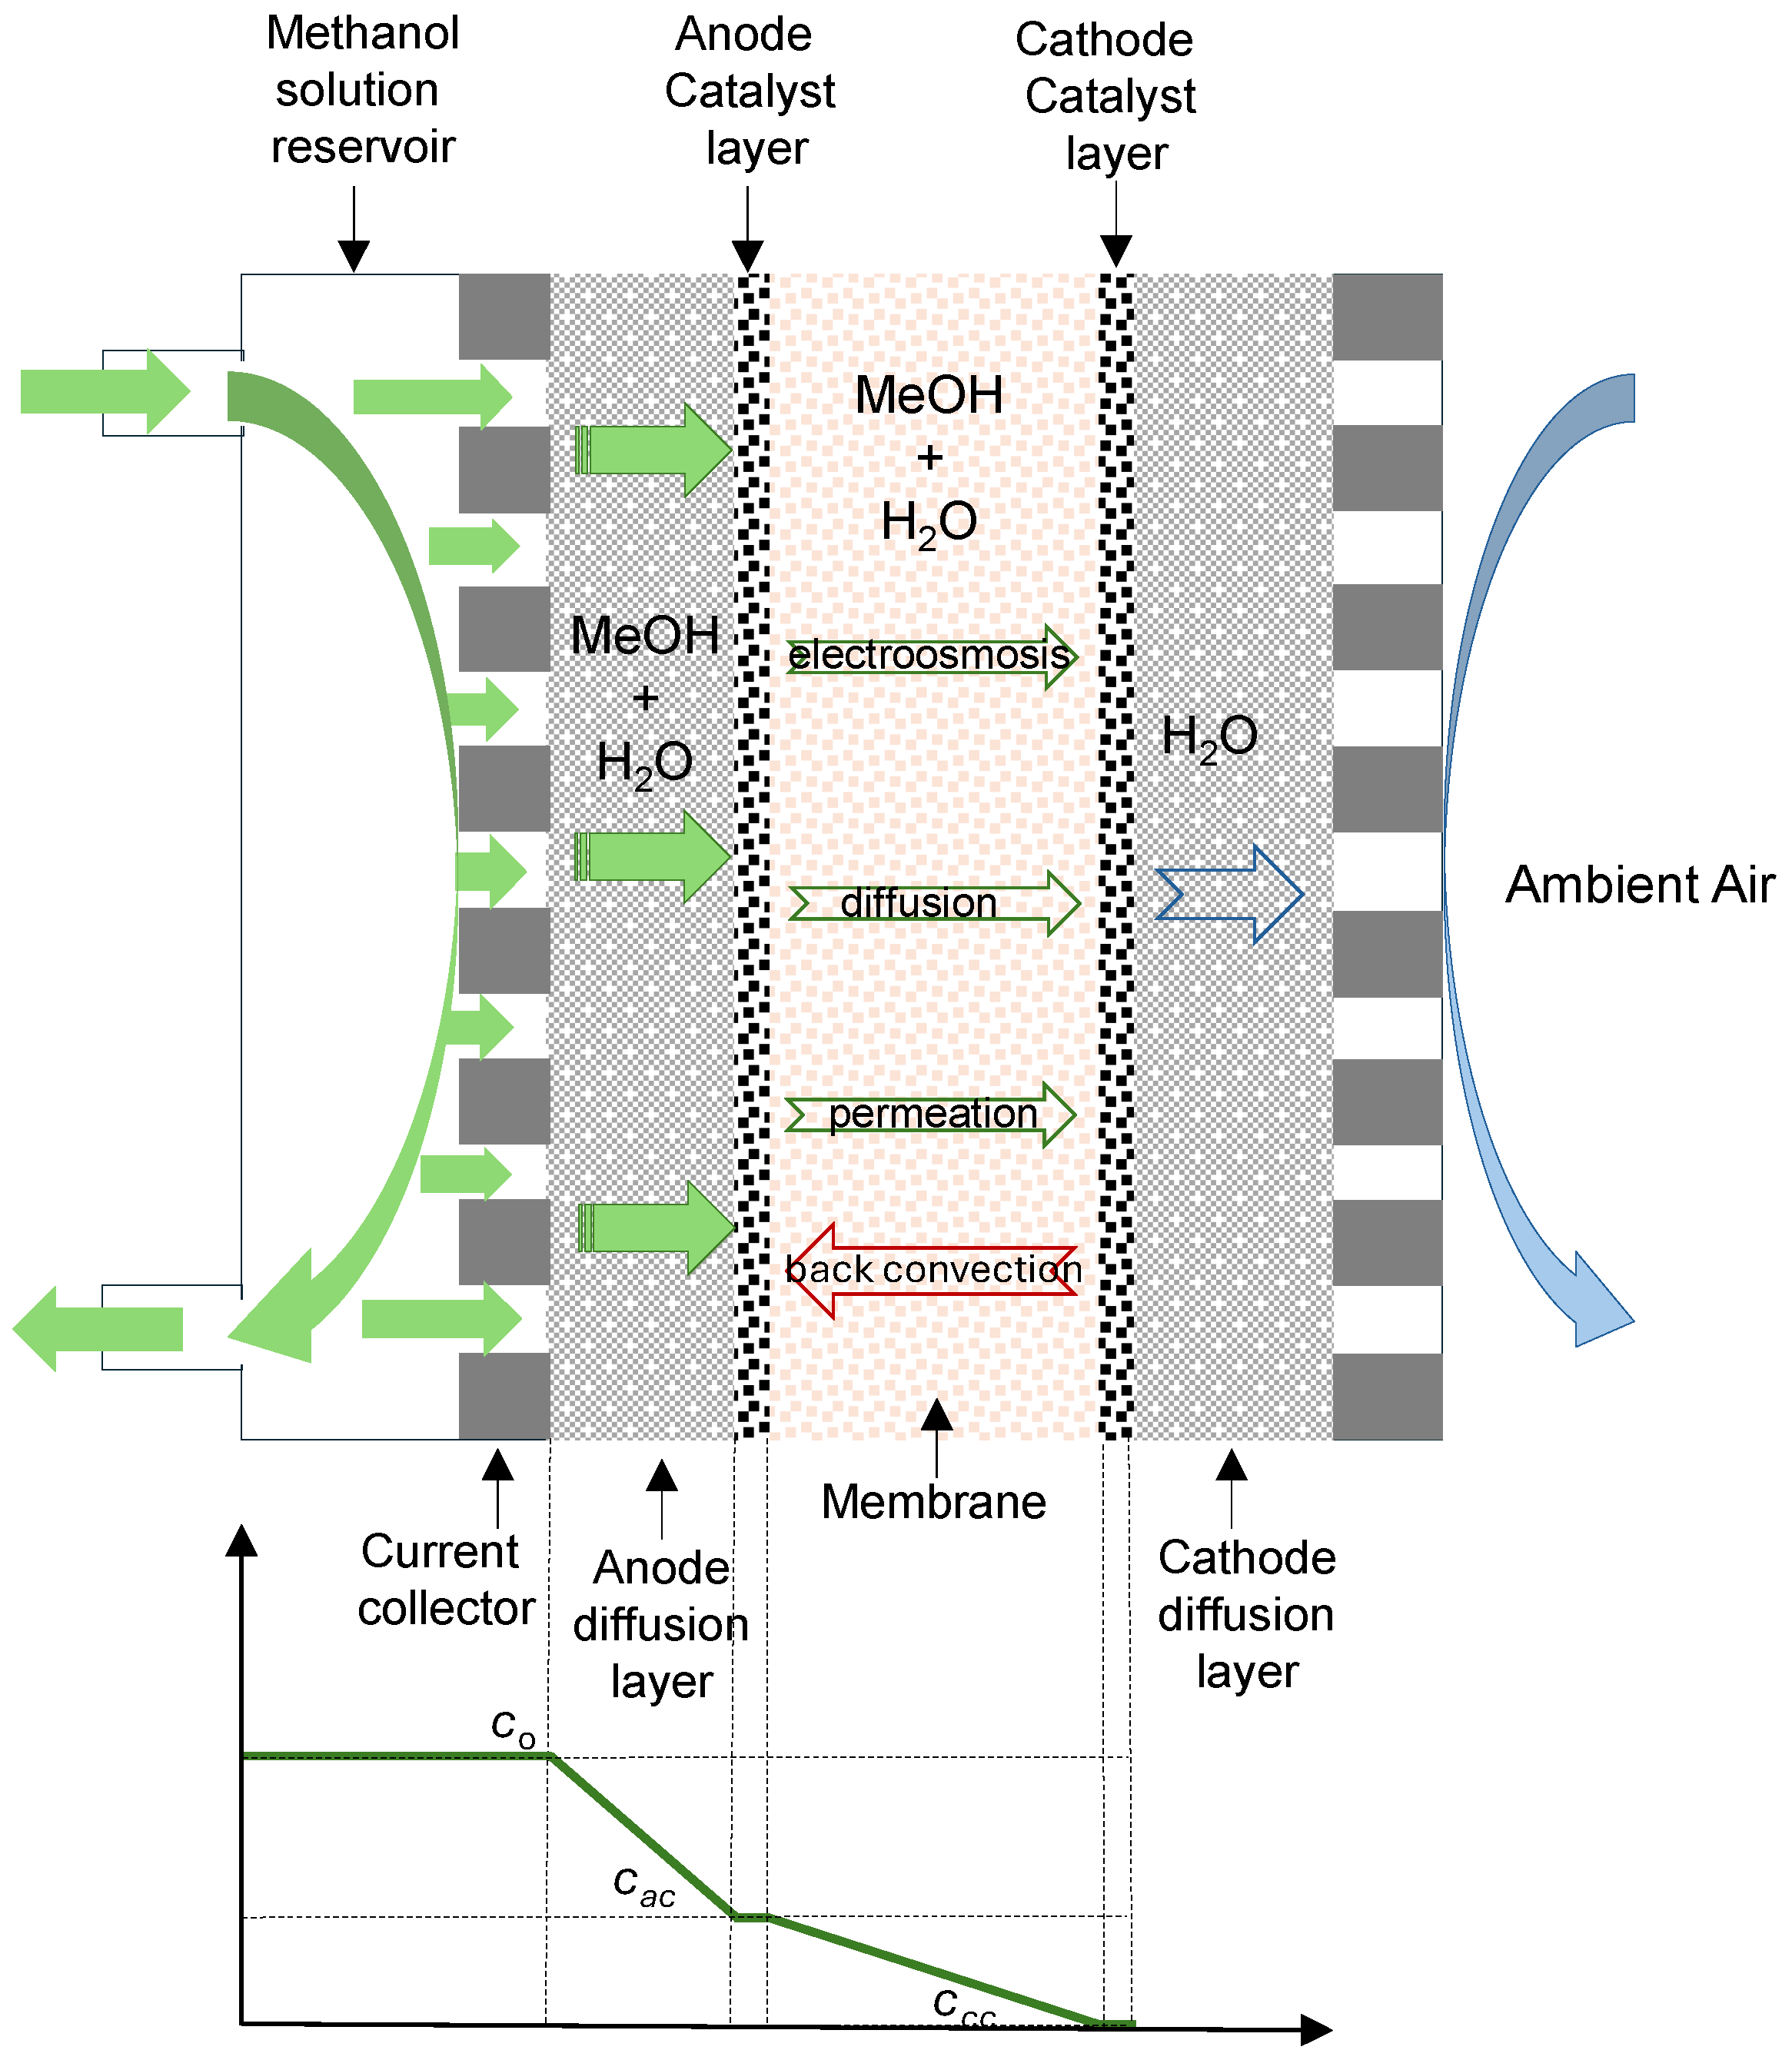
Figure 1 shows the different transport mechanisms in a direct methanol fuel cell operating in the semi-passive mode with a liquid feed. In this operating mode, the methanol–water solution is circulating in the anode compartment, and air is supplied to the cathode by natural convection. In the figure, the typical methanol concentration profile is also shown. Methanol and water transport through the anode diffusion layer by diffusion and convection to the catalytic layer, where the oxidation reaction takes place. If the proton exchange membrane (PEM) is not an ideal barrier to methanol, there will be a portion of unoxidized methanol which, together with water, crosses the membrane towards the cathode catalytic layer. This transport, named crossover, can occur by the means of three mechanisms, such as electro-osmotic drag by protons and diffusion and permeation due to concentration and pressure gradients, which are established between both electrodes. A return flow to the anode, named back convection, may also occur if the cathode pressure was larger than the anode pressure. However, in the semi-passive mode with an active anode, the anode pressure will be larger than that in the cathode, so, the back convection mechanism is not expected to occur.
Thus, methanol permeates from the anode to the cathode through the membrane via diffusion, convection, and electro-osmosis, and methanol crossover flux can be expressed as:
where
D is related to the effective diffusivity of methanol in the membrane and its thickness,
K is the effective hydraulic permeability and thickness of the membrane and viscosity of the solution, and
W is the electro-osmotic drag coefficient of water in the membrane. Δ
c and Δ
p are, respectively, the difference in concentration and pressure across the membrane, and
i is the current density. This flux affects the actual cell voltage.
Crossover also affects to the cell voltage at zero current, termed open circuit voltage (
OCV), that, according to Equation (5), can be expressed as:
Methanol crossover can be expressed as an equivalent crossover current density [
18]. By supposing that the contribution of methanol crossover is the main contribution to the current loss, it can be expressed as:
According to Equations (5)–(8), at zero current, methanol crossover will depend on the concentration and pressure differences existing between the anode and cathode and, so, on the anode methanol concentration and flow rate, affecting OCV. Er also depends on the pressure, and it will be different at different anode inlet pressures. With liquid water and methanol, according to Equation (1), flow rate will affect to the CO2 partial pressure in the anode compartment.
Under not-zero currents, the electro-osmotic contribution to methanol crossover will also affect the actual cell voltage.
3. Materials and Methods
A commercial single methanol fuel cell was used in this work. The electrodes were E-TEK, ELAT/VHL/DS/VS double-sided Version 2-ELAT with a Pt-Ru Ox Power (1:1 a/o) catalyst with a loading of 5.0 mg/cm2 on the anode, and an EFCG electrode with Toray carbon paper TGP-H-12o with a Pt black catalyst with a loading of 2.0 g/cm2 on the cathode. It uses a Nafion 115 membrane, manufactured by Dupont Inc. (Wilmington, DE, USA), as the electrolyte membrane.
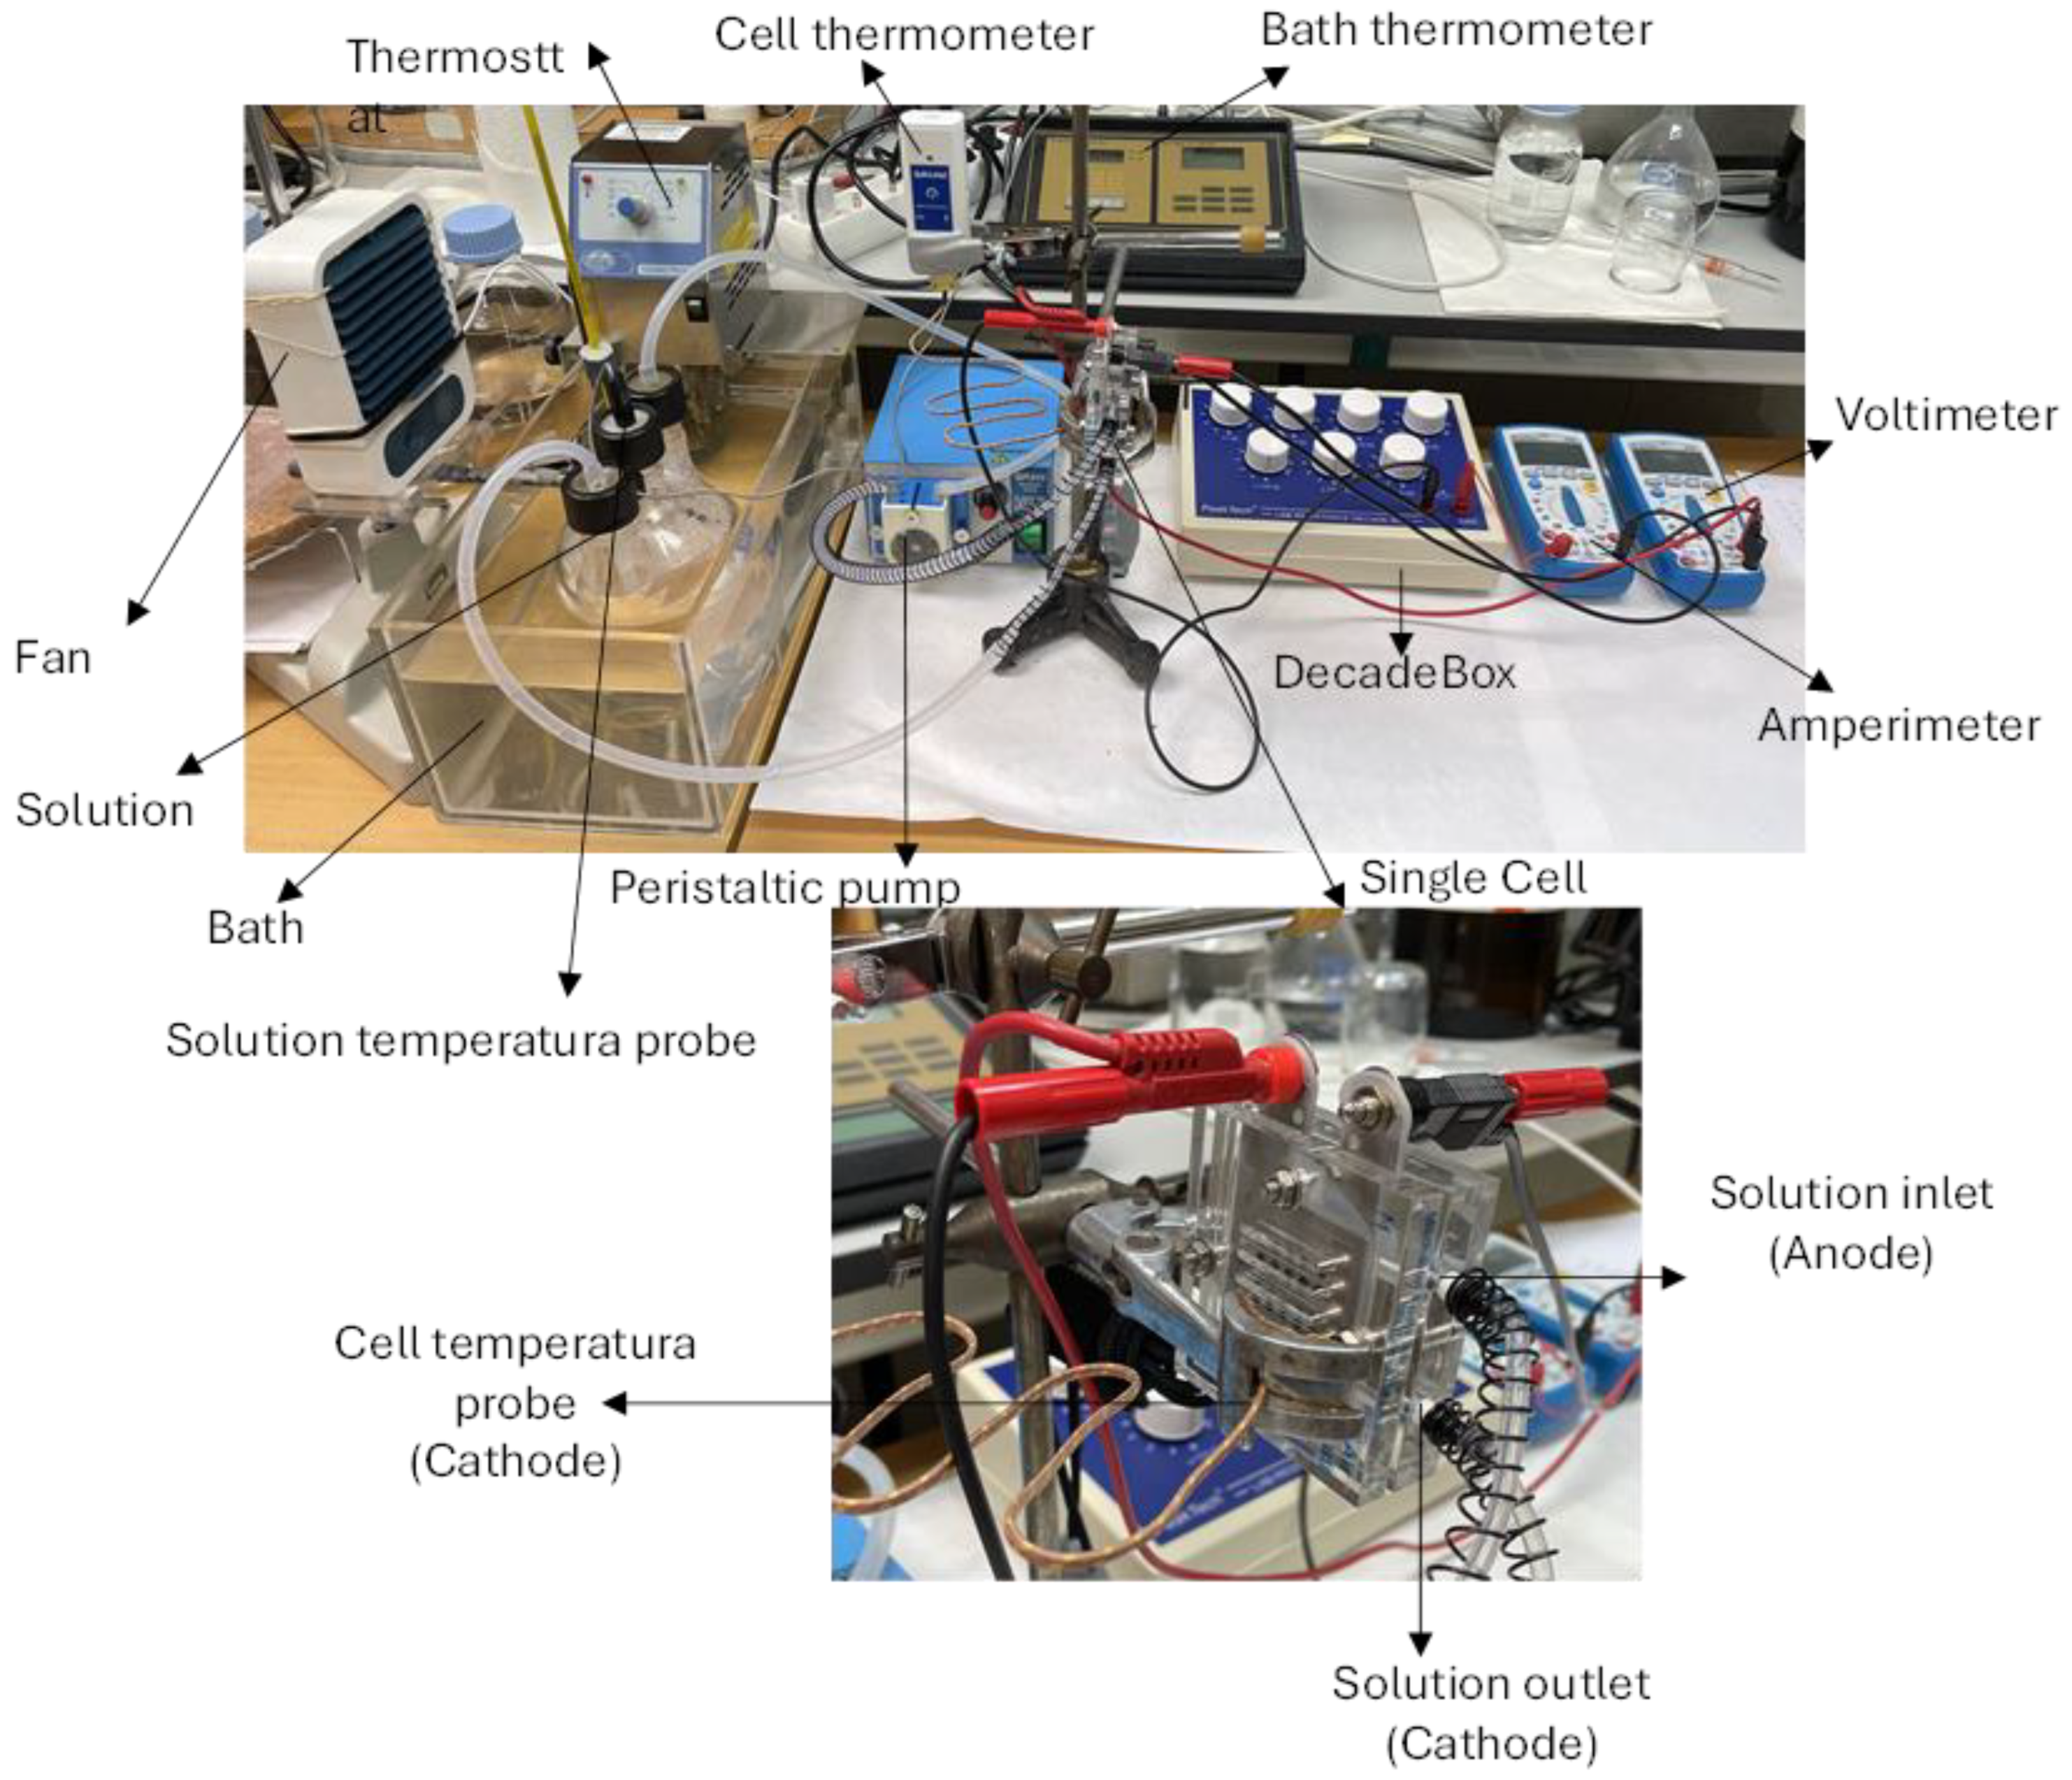
For the semi-active mode operation, methanol fuel with five different concentrations (0.15, 0.5, 1, 3, and 6% wt. methanol in water) was supplied at the anode by using a peristaltic pump which permitted us to vary the flow rate. This concentration range broadly covers the one typically used in direct methanol fuel cells. The temperature of the methanol fuel was controlled by means of a thermostat bath. To this end, the methanol–water solution was contained in a glass balloon immersed in the bath and made to circulate through the anode by means of the peristaltic pump which permitted us to vary the flow rate up to 8.9 g/s. Ambient air was supplied to the cathode. A fan was placed near the cathode to facilitate the circulation of air with uniform temperature and humidity towards the cathode side of the cell. Room temperature, pressure, and relativity humidity were, respectively, in the range 22–25 °C, 930–950 hPa, and 30–40%. Temperatures of the methanol fuel in the glass balloon and of the cathode surface were measured during the experiment. An image of the experimental device is shown in
Figure 2.
Current (I) and voltage (Ecell) were measured under different loads to obtain the corresponding polarization curves. The open circuit voltage (OCV) was obtained as the voltage at zero current. The maximum power value was obtained from the corresponding power–current curve in each experimental situation.
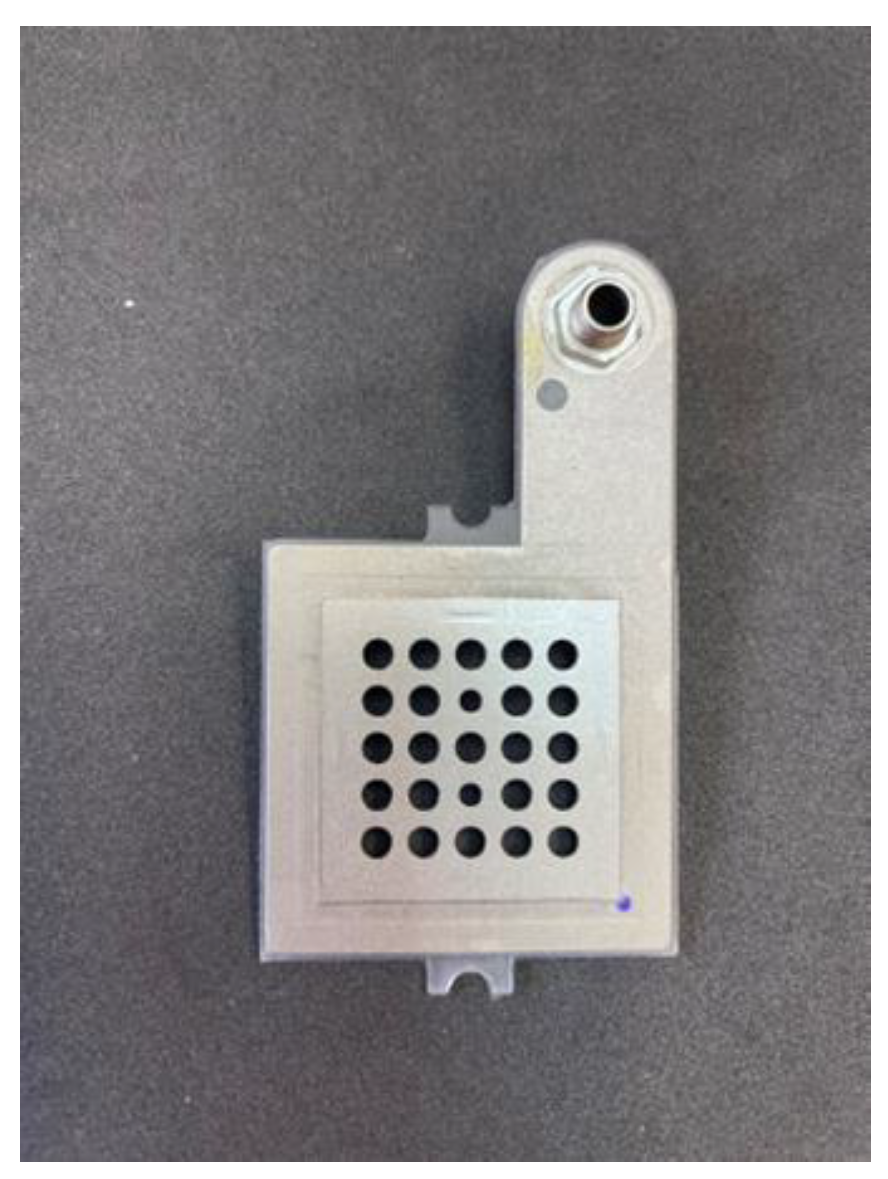
The area of the membrane electrode assembly was 3 cm × 3 cm. However, due to the geometry of the channels of access to the diffusion layer, pin channels in our case (see
Figure 3), the effective area was estimated to be 1.56 cm
2.
4. Results and Discussion
4.1. Peristaltic Pump Caracterization
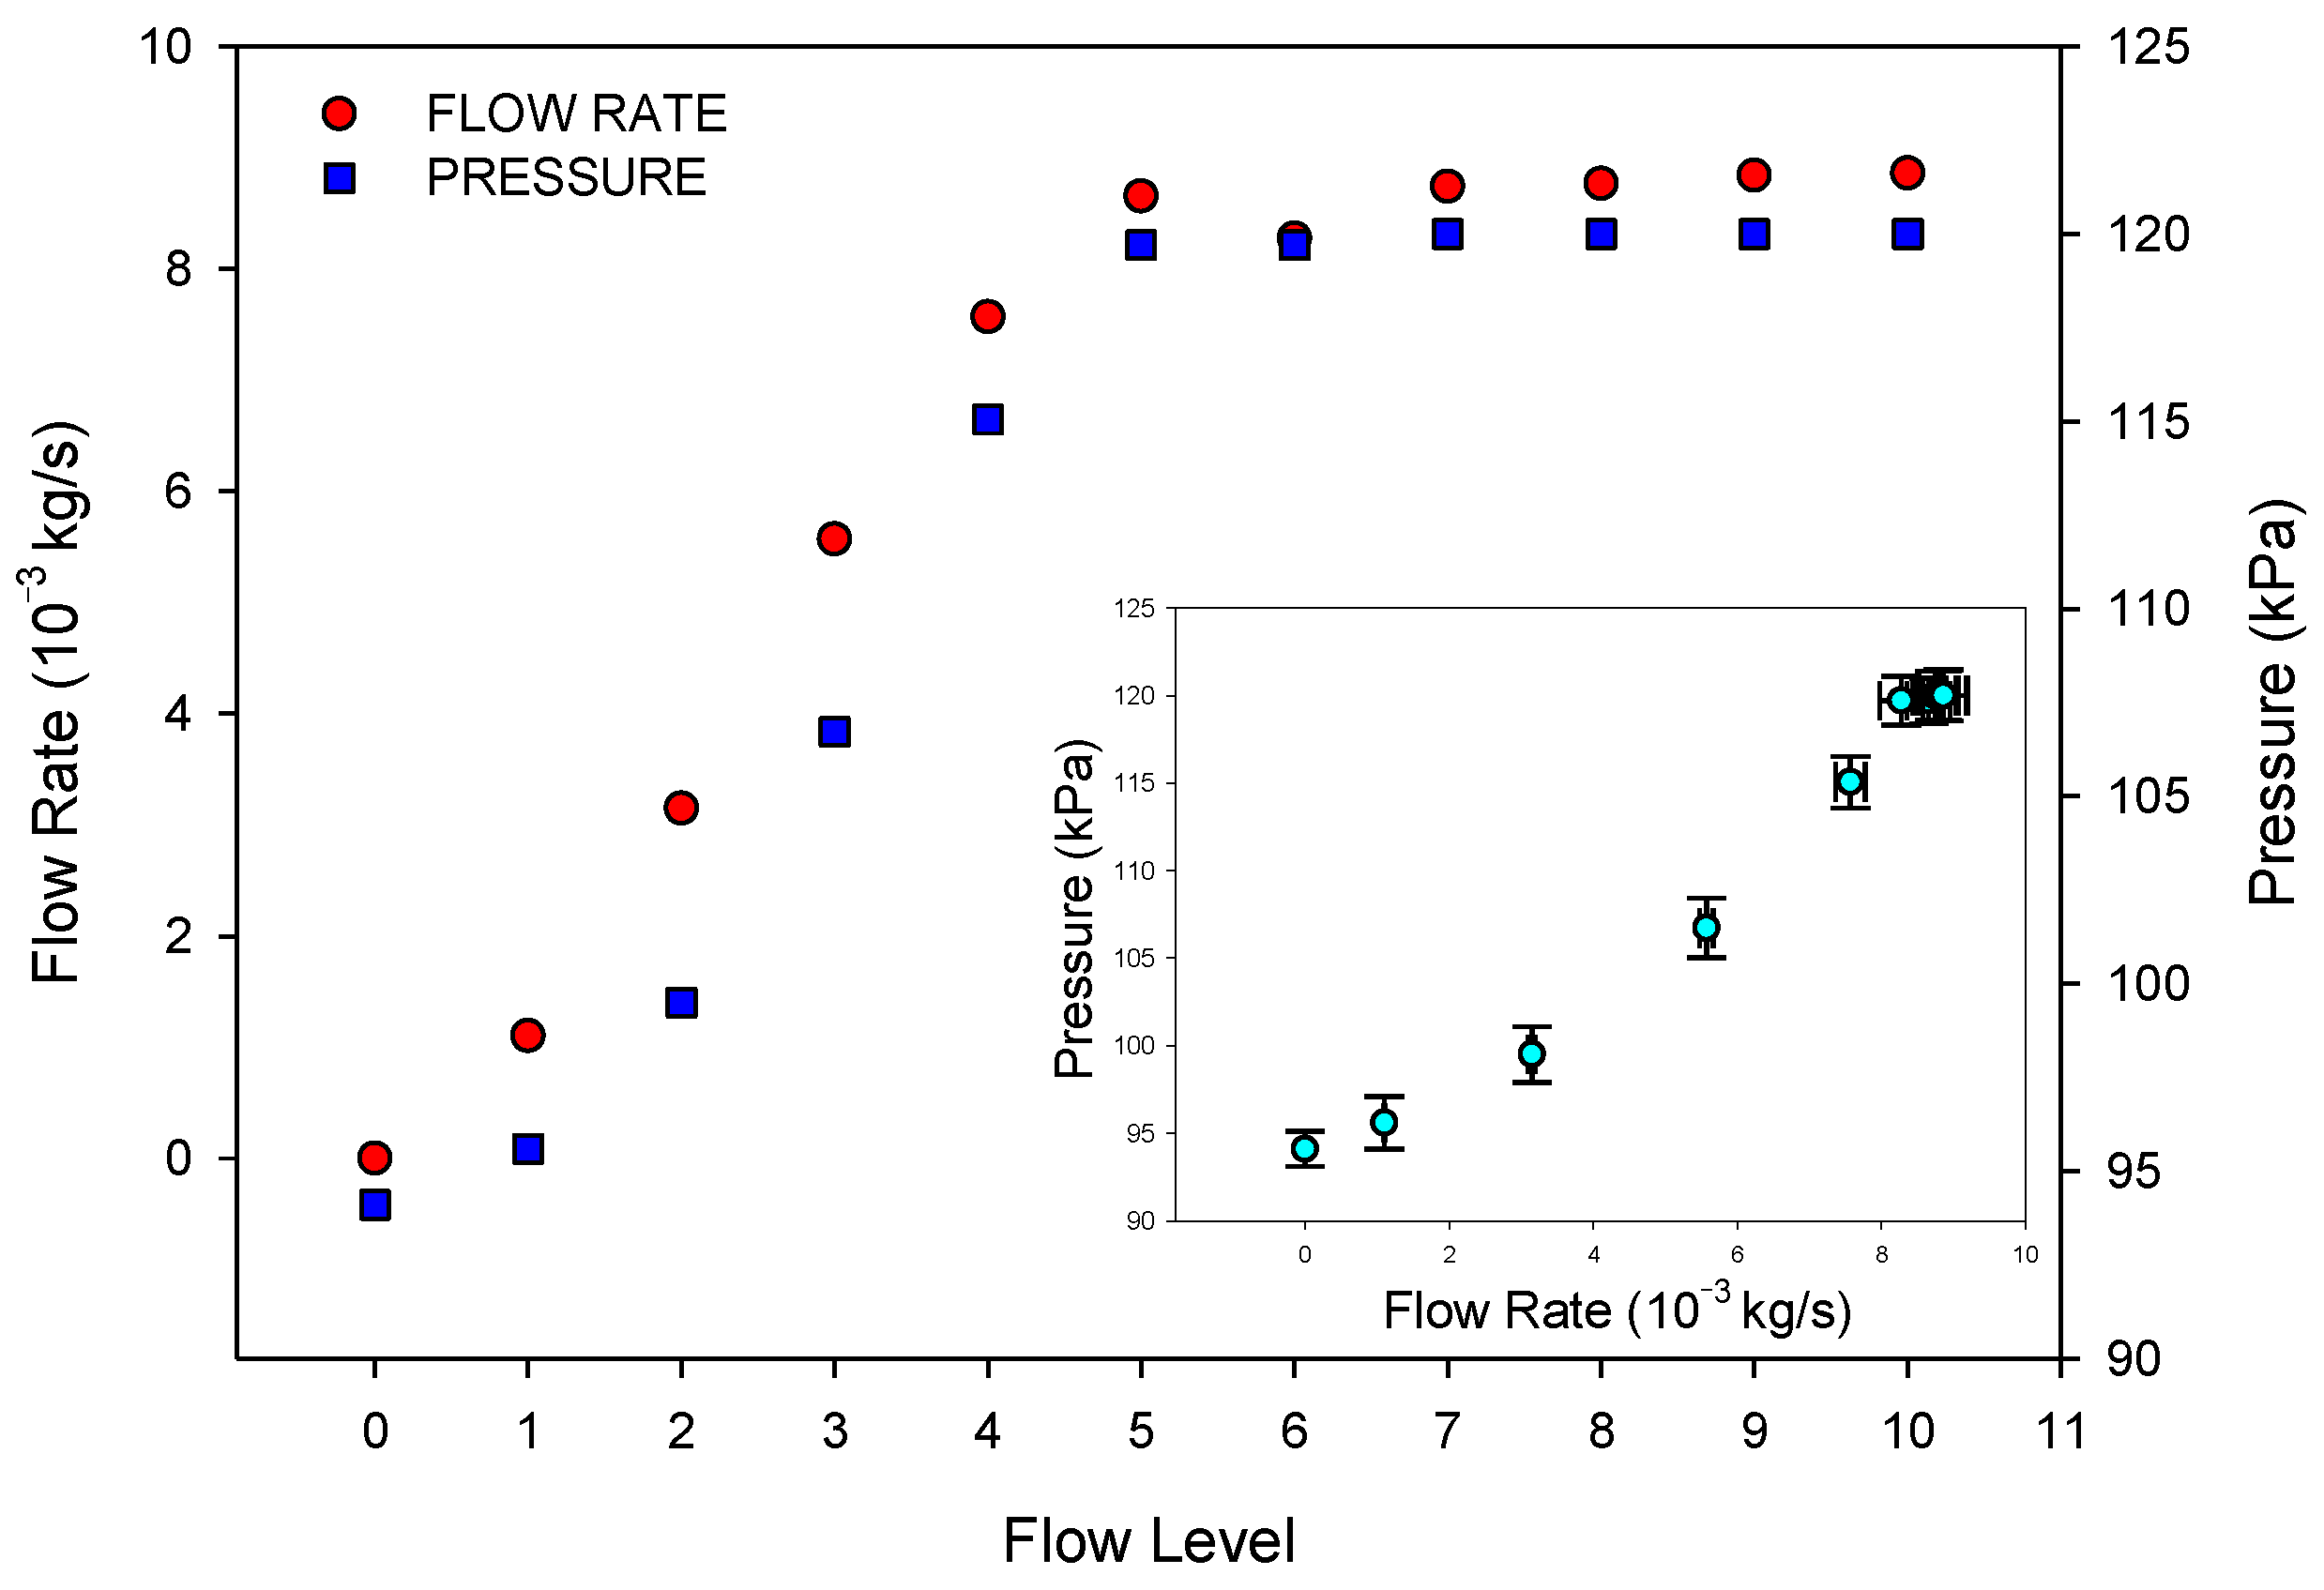
To measure the inlet pressure in the anode due to the flow rate of the methanol feed, a pressure sensor was placed at the anode inlet.
Figure 4 shows the measured values of the rate and pressure for each flow level of the pump. As can be observed, from level five, the flow rate was no longer significantly different, so measurements were made for five different flows up to this value (namely F1, F2, F3, F4, and F5). F0 corresponds to zero flow in the passive mode. The inlet pressure increases with the flow rate. The small figure inside
Figure 4 shows the pressure versus flow rate for the different flow levels.
As the pressure of the cathode was always the atmospheric pressure, it was always smaller than the anode pressure. Thus, the semi-passive mode would involve the existence of a pressure difference between anode and cathode. This is an important key in relation to the methanol crossover effect.
4.2. Open Circuit Voltage
The open circuit voltage has been measured in different experimental conditions.
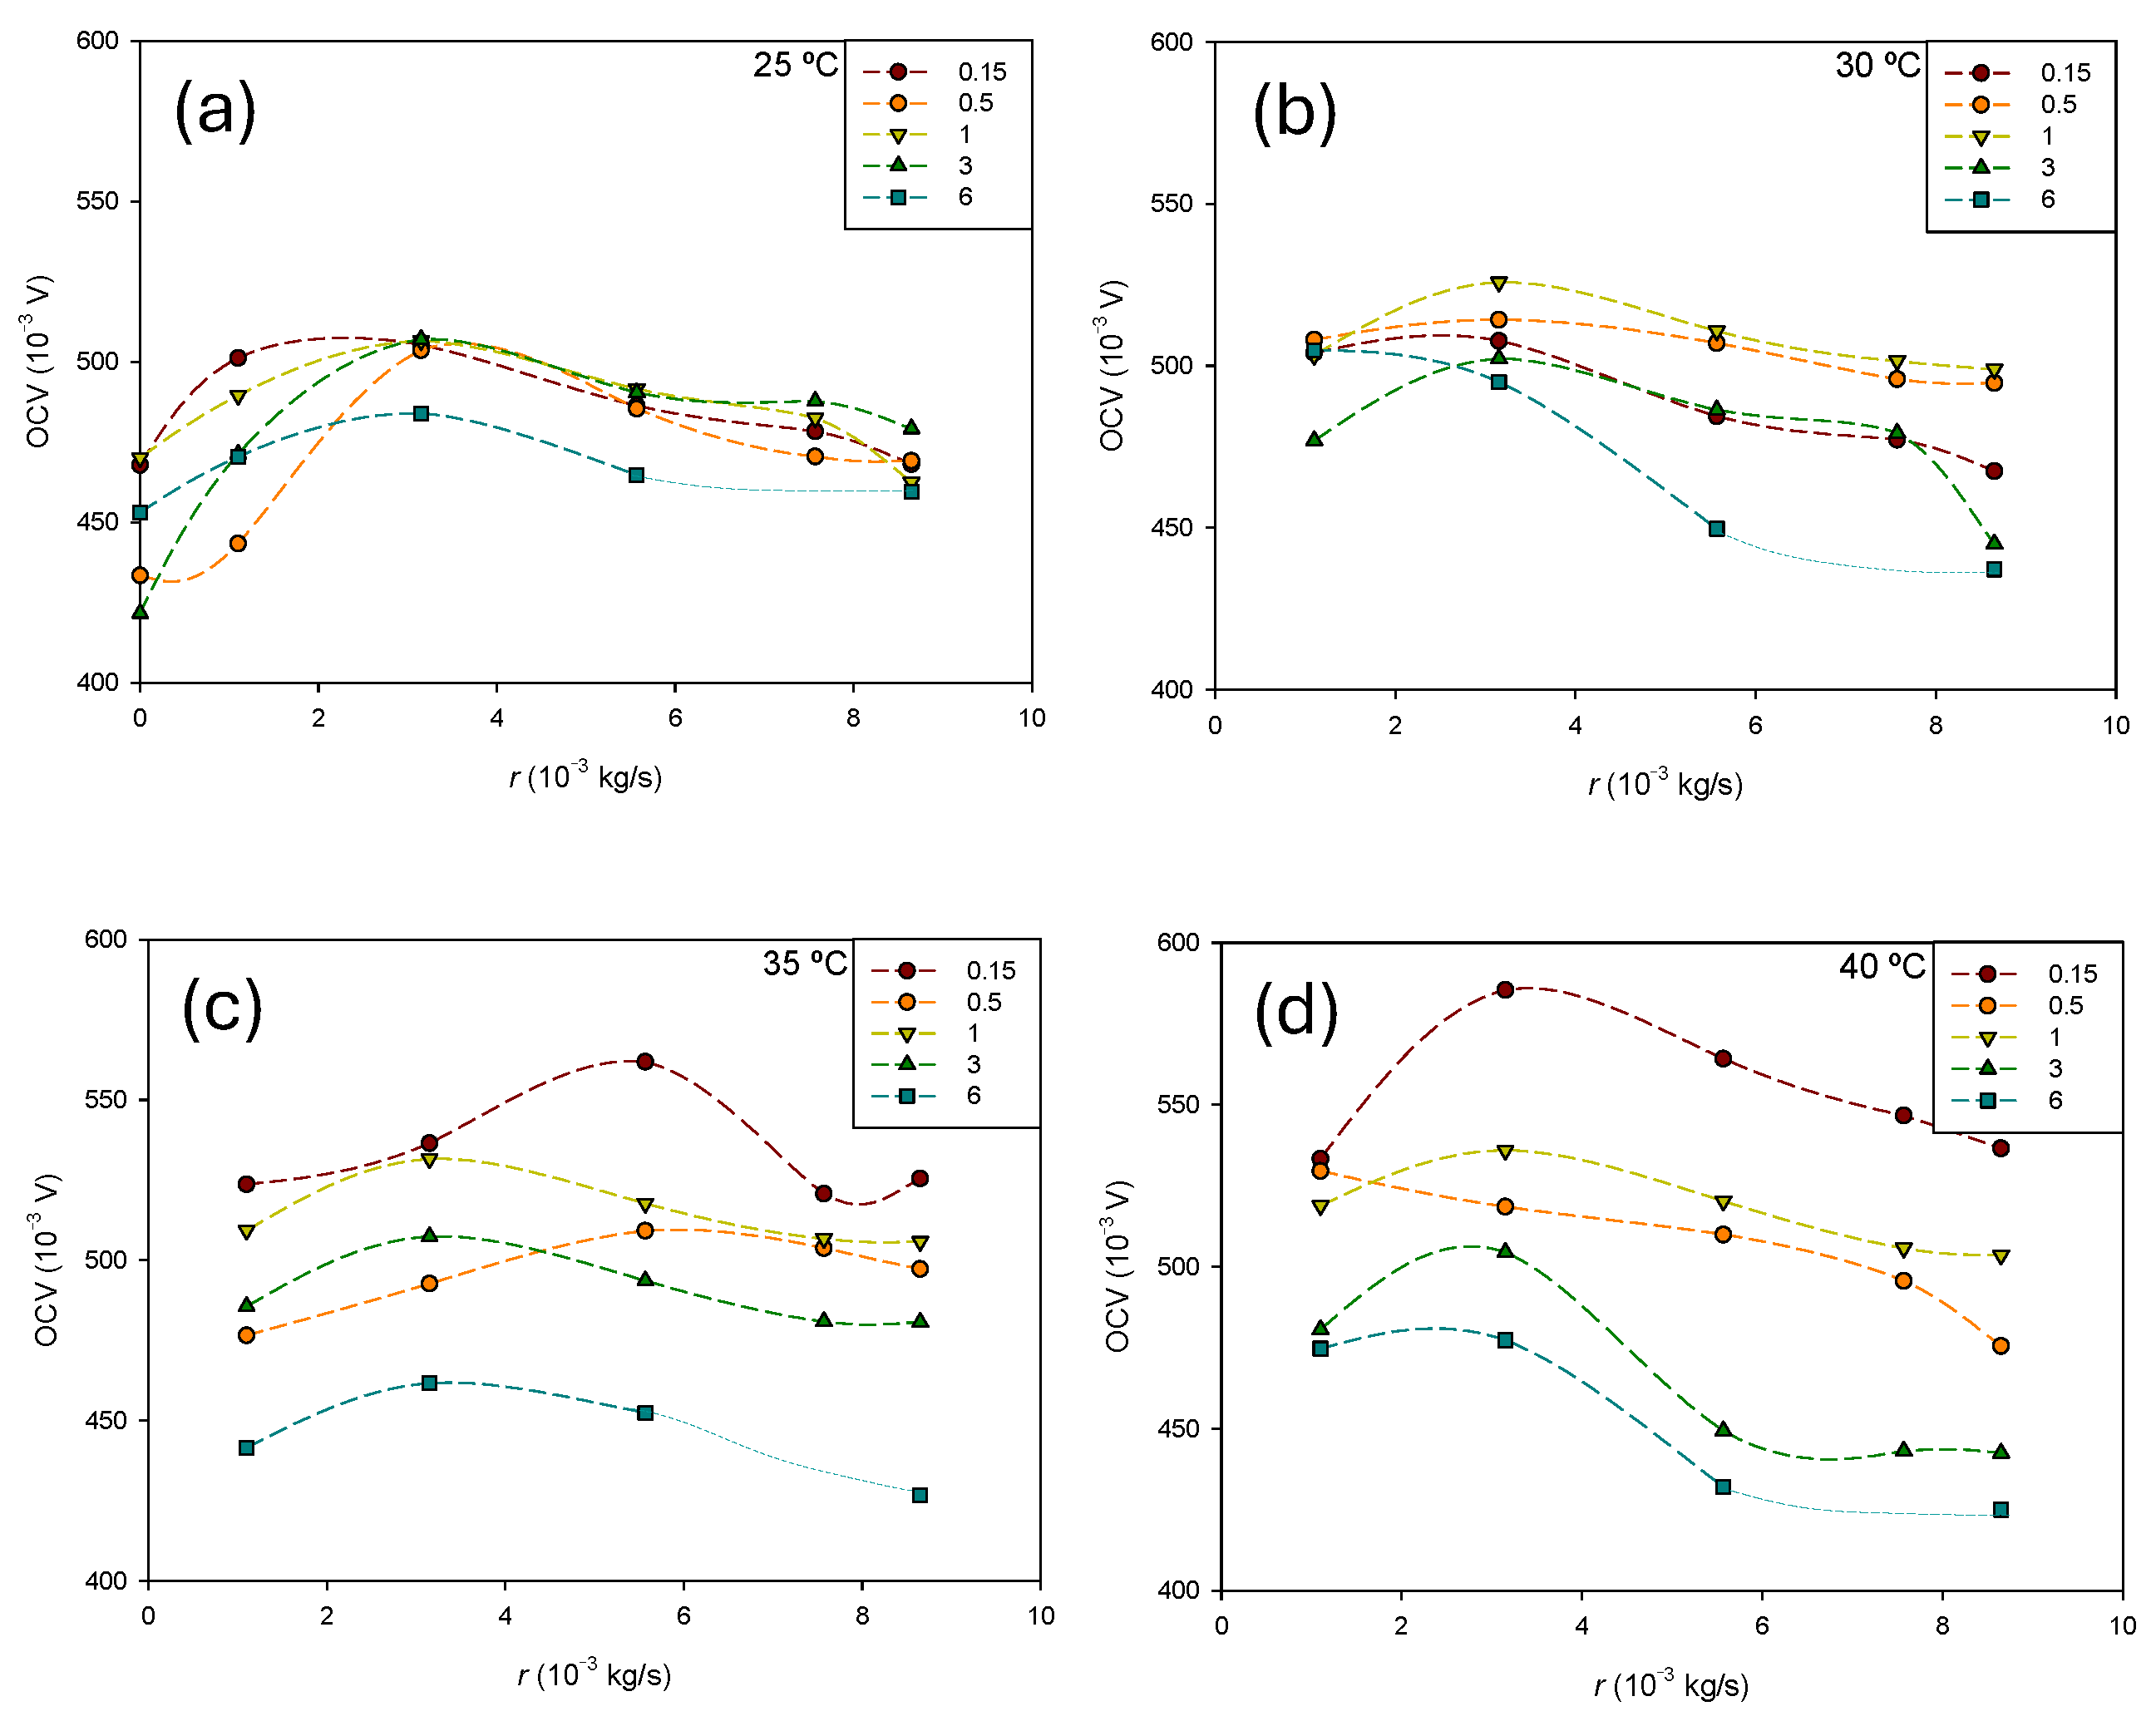
Figure 5 shows the influence of the methanol flow rate at different concentrations for each temperature. The same scale has been used for all temperatures for a better comparison of the results.
In general, the transition from the passive to semi-passive mode increases the
OCV at low methanol flow rates. As can be observed, the
OCV is influenced by the methanol flow rate, but the relationship is not straightforward. It depends on both the temperature and methanol concentration. The effect of concentration becomes more pronounced as the temperature increases. At 25 °C (
Figure 5a), the influence of the methanol concentration is lower at higher flows, while the opposite trend is observed at 40 °C (
Figure 5d). The accumulation of by-products like CO
2 is expected to be greater in the passive mode. The methanol flow facilitates efficient bubble detachment. However, the increase in the methanol inlet velocity may also enlarge bubble detachment diameters, potentially causing segmental plugging. Tong et al. [
23] showed that optimal selection of the methanol inlet velocity facilitates effective bubble detachment. Moreover, as the flow rate increases, the pressure difference between the anode and cathode also increases, leading to a rise in the transmembrane pressure difference. This, according to Equation (6), results in greater methanol permeation through the membrane and increased mass transport losses. Consequently, an optimal flow rate is expected to exist. Overall, the effect of the flow rate on the
OCV can vary depending on specific operating conditions and cell design. Striking a balance is essential to maximize performance.
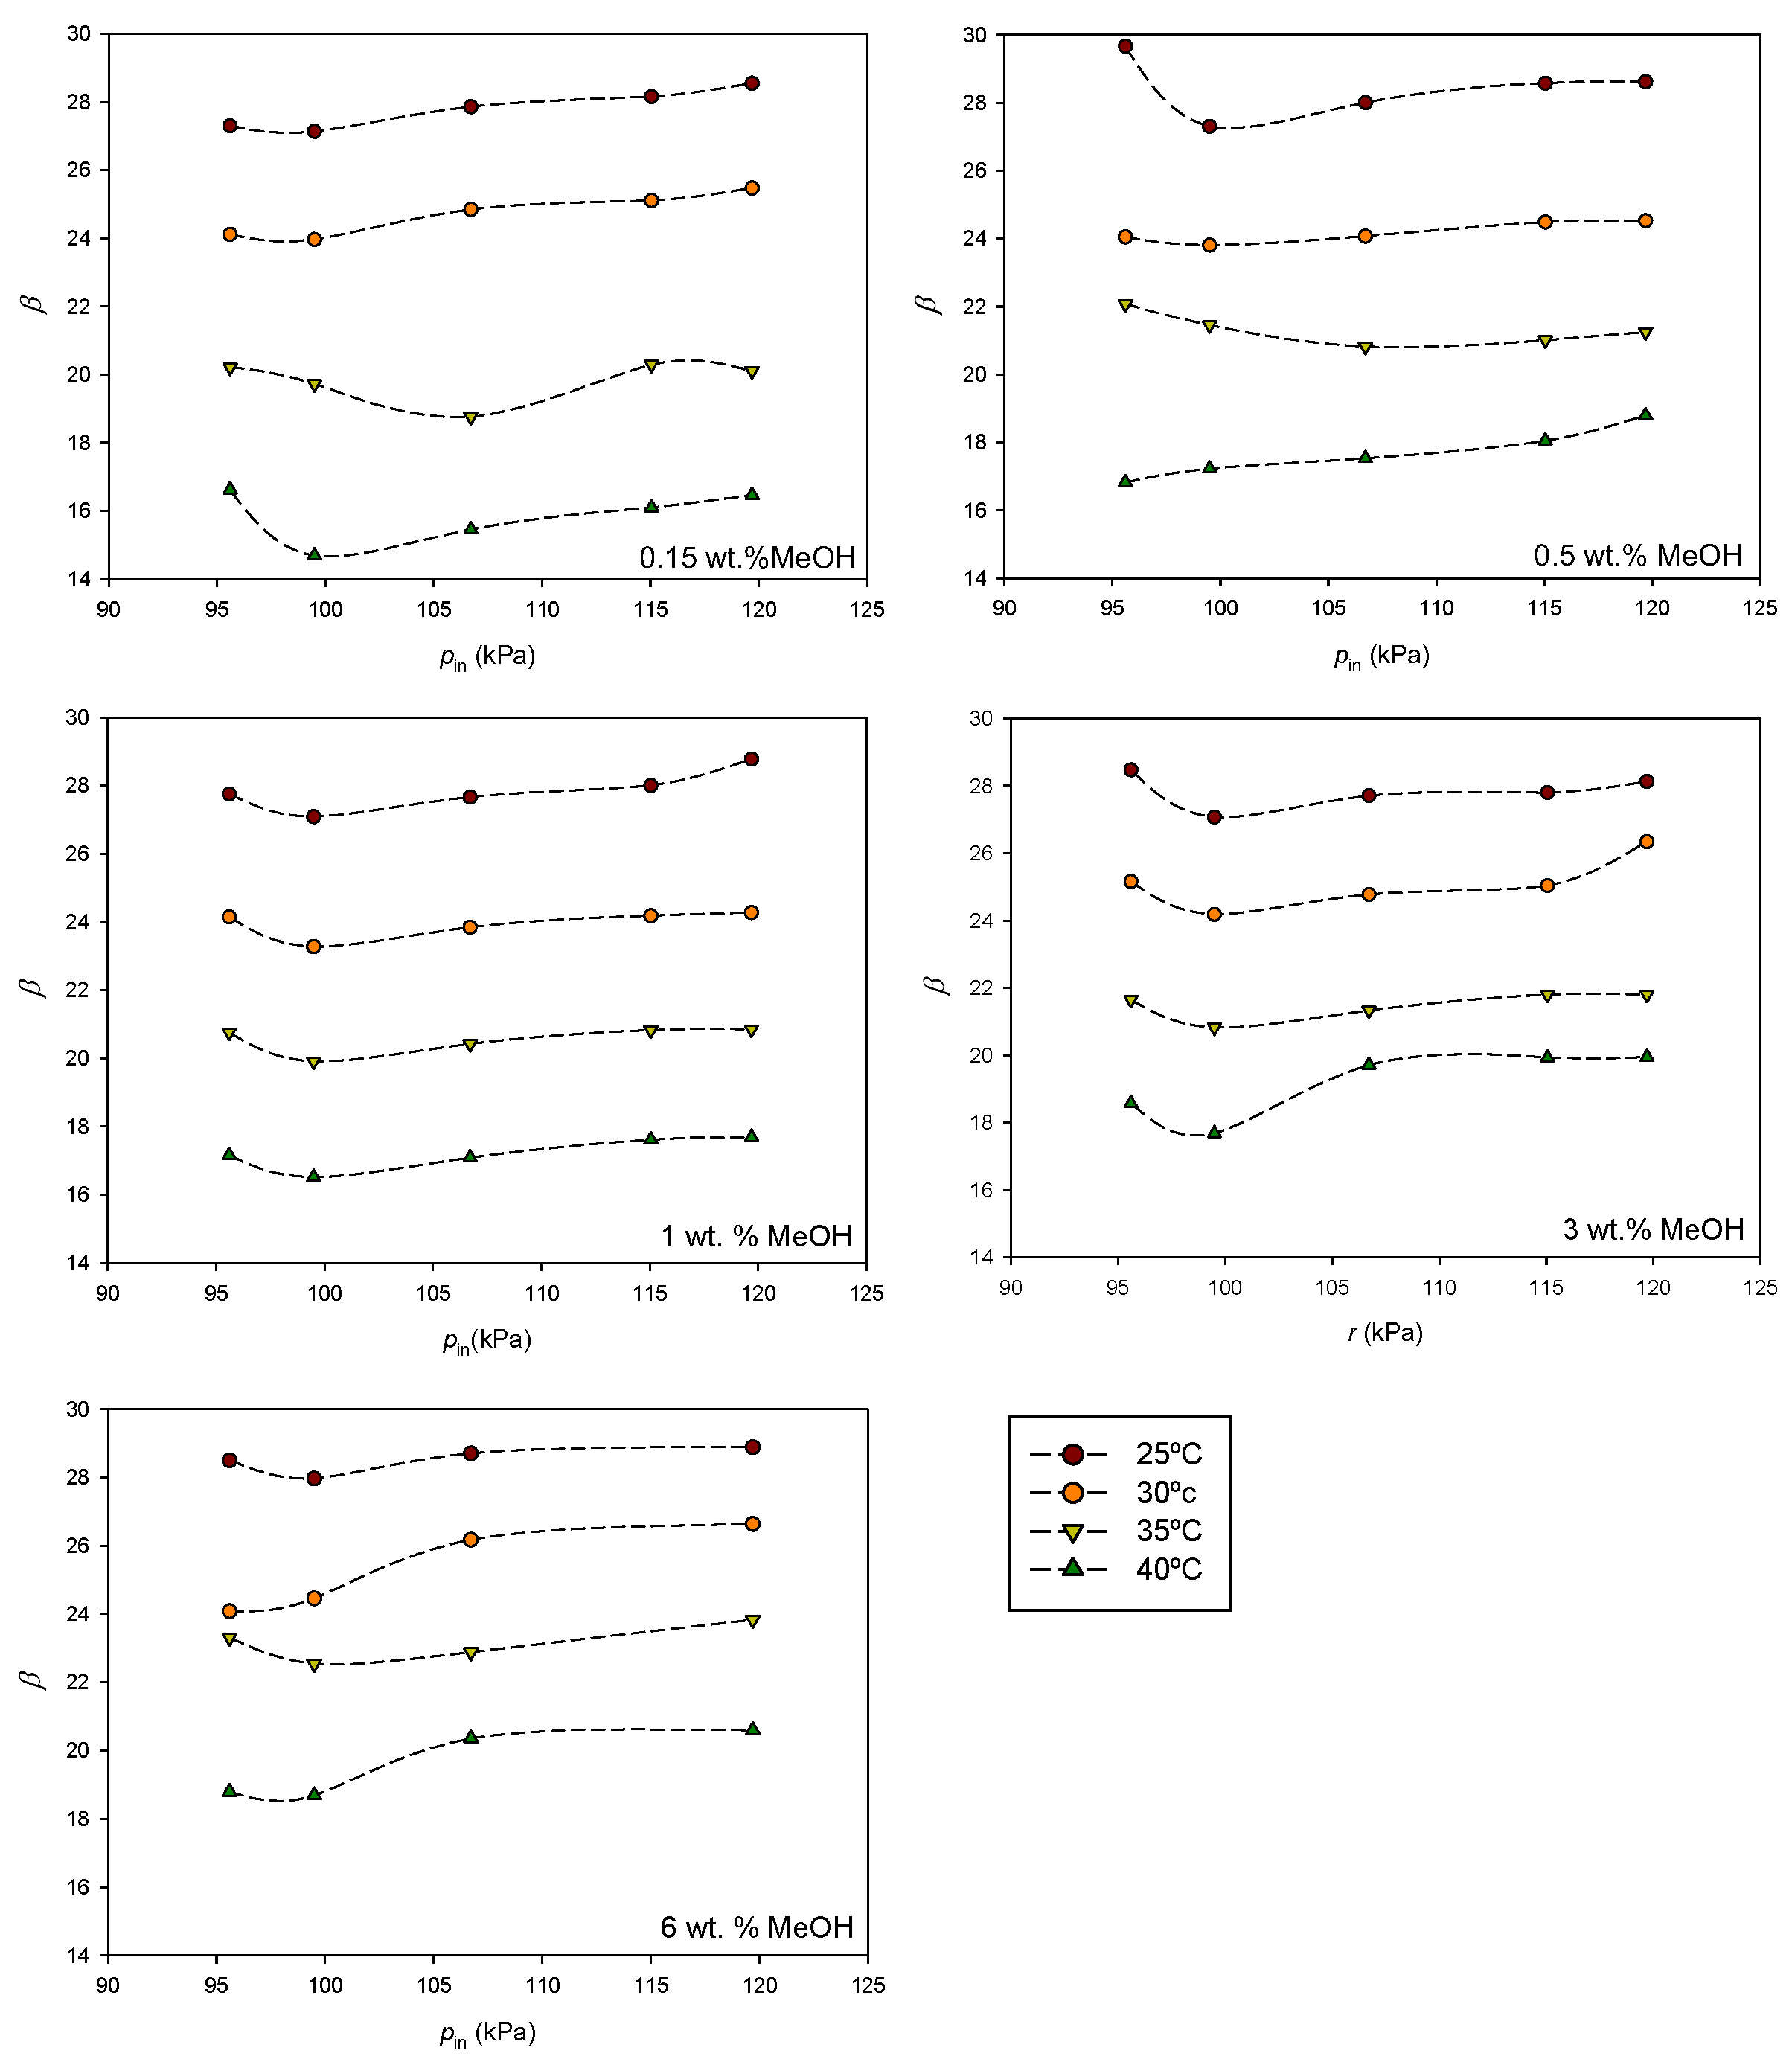
From Equation (7), a
β parameter can be defined as:
At a given concentration and temperature,
β serves as an indicator of the change in the
OCV due to the influence of the anode inlet pressure in the activation and the crossover losses. To estimate
β values for each temperature and pressure, reversible voltages
Er were previously calculated using data from the literature. These calculations consider the reaction enthalpy and entropy at 25 °C and atmospheric pressure, the temperature dependence of the specific heat of the reaction components, and the pressure effect as described by the Nernst equation [
32]. The results are presented in
Table 1.
As can be observed, the reversible voltage decreases with increasing temperature. At a given temperature, an increase in the anode pressure also reduces the reversible voltage. Using the data in
Table 1 and Equation (9), values of
β have been estimated under all conditions. The results are shown in
Figure 6.
Considering Equation (9), the dependence of parameter β on the inlet pressure must arise from the dependence of α, iloss, and i0 on the pressure. In general, the observed trend is similar across temperatures and concentrations. Beyond a certain flow level, parameter β increases with rising pressure. For the analyzed system, the effect of the inlet pressure becomes harmful, in general, when the anode pressure exceeds the cathode pressure by approximately 5–6 kPa.
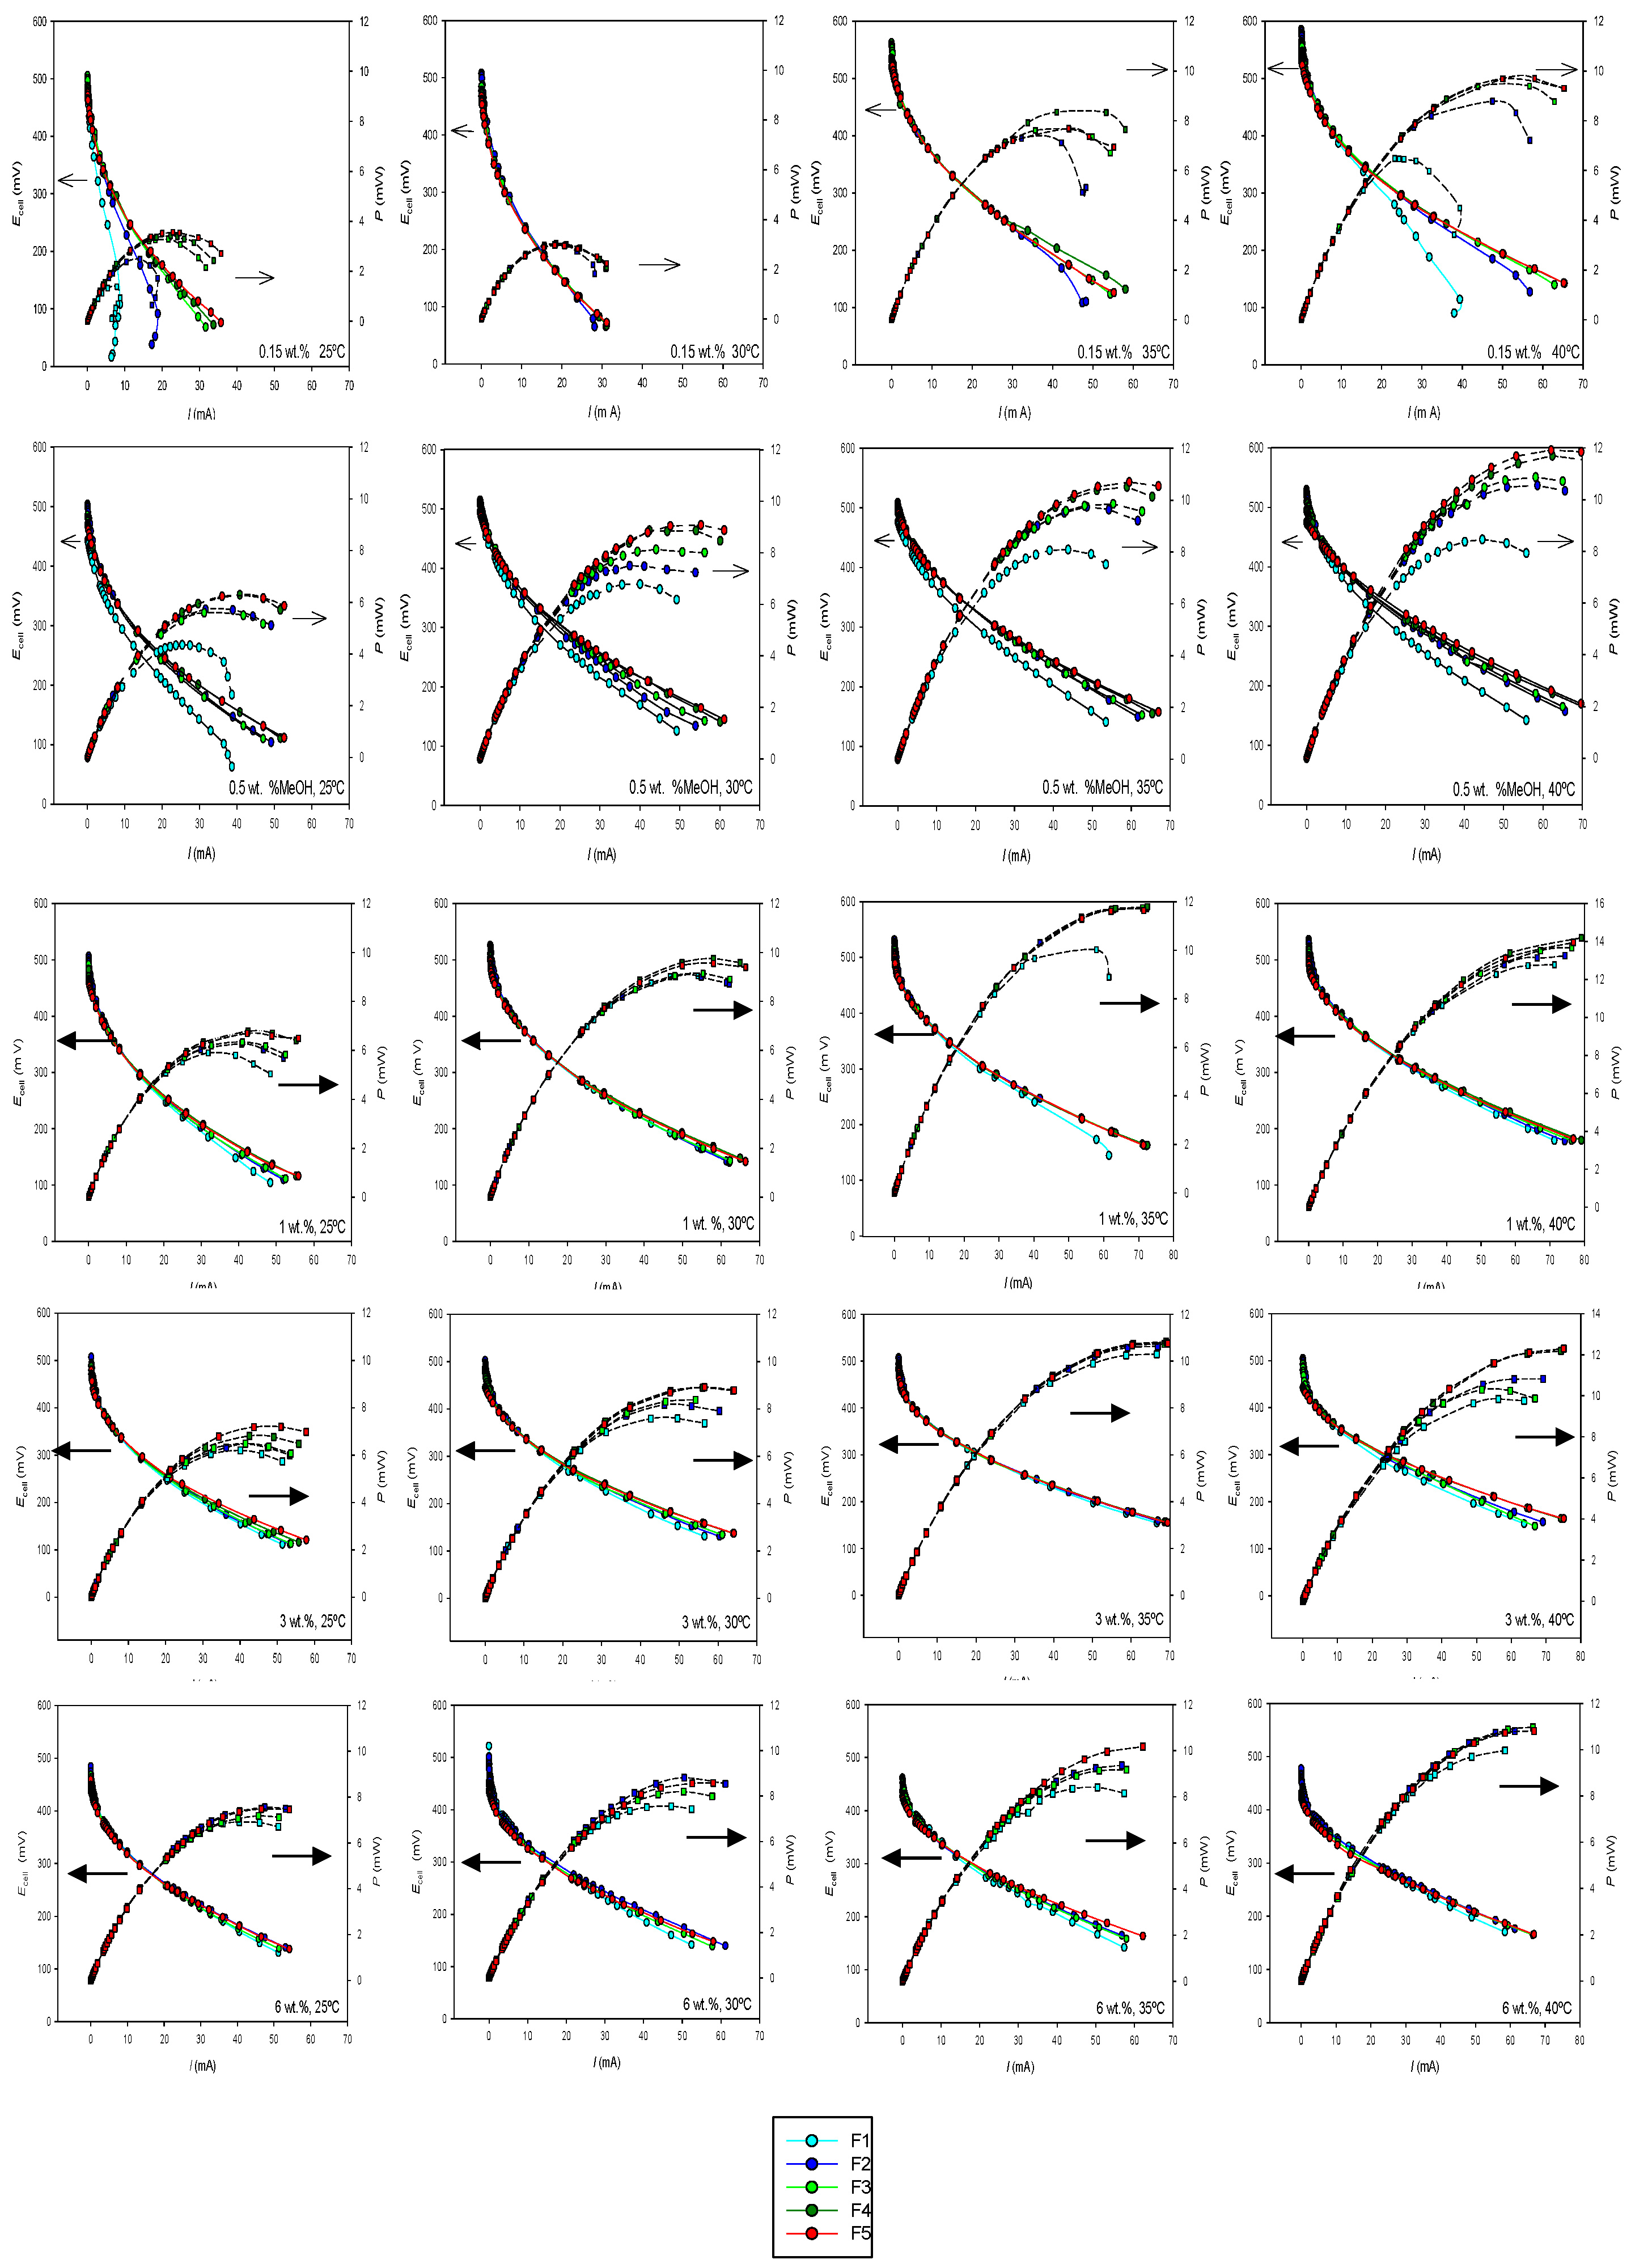
4.3. Polarization Curves
Current–voltage curves at different flow rates have been measured for each concentration and temperature. From them, the corresponding current–power curves were obtained.
Figure 7 presents the results obtained for all the systems. The same axes scale has been used across all figures, where possible, to facilitate comparison of the results. (The enlarged figures can be seen in
Figures S1–S5 in Supplementary Materials).
As observed, both temperature and methanol concentration influence the profiles of the current–voltage curves. Generally, higher currents are achieved at elevated temperatures, consistent with previous findings in the literature [
15]. The effect of concentration depends on both temperature and flow rate. We observed that, at the lowest concentrations analyzed, an increase in flow rate results in higher currents, particularly at low methanol flow rates. However, at the highest concentrations, the opposite effect is observed, depending on the flow rate. Using mini-direct methanol fuel cells in passive mode, Colmati et al. [
5] found that methanol concentrations near 2 mol × L
−1 gave the highest current levels. They observed, however, that when using methanol concentrations above 5 mol/L the performance of the mini-cell dropped, probably because the crossover of methanol increased too much.
The effect of the flow rate becomes more pronounced as the output current increases. At higher output currents, the flow rate has a more significant impact, particularly at lower concentrations, with higher currents observed at higher flow rates. At lower methanol concentrations, the effect of methanol flow is beneficial as it helps the methanol reach the catalytic area, thereby reducing concentration polarization losses. At these low concentrations, the effect of increased anode pressure on methanol crossover is smaller. However, as the methanol concentration increases, concentration polarization losses become less significant, and the effect of crossover due to increased anode pressure becomes more dominant.
Figure 7 shows that this trade-off between the two effects is also influenced by the temperature.
The effect of the operating parameters can also be examined by analyzing the corresponding current–power curves, also shown in
Figure 7. Cell power increases with current until the maximum value is reached. At a given methanol concentration, cell power increases with temperature. It is also evident that the effect of temperature is more pronounced at lower methanol concentrations. At a specific temperature, the influence of methanol concentration varies depending on its value. This effect will be further discussed in relation to the maximum power output of the cell. Regarding the impact of methanol flow rate, it is observed that its influence is more significant at lower methanol concentrations. As the concentration increases, the differences between the curves at varying flow rates become less pronounced.
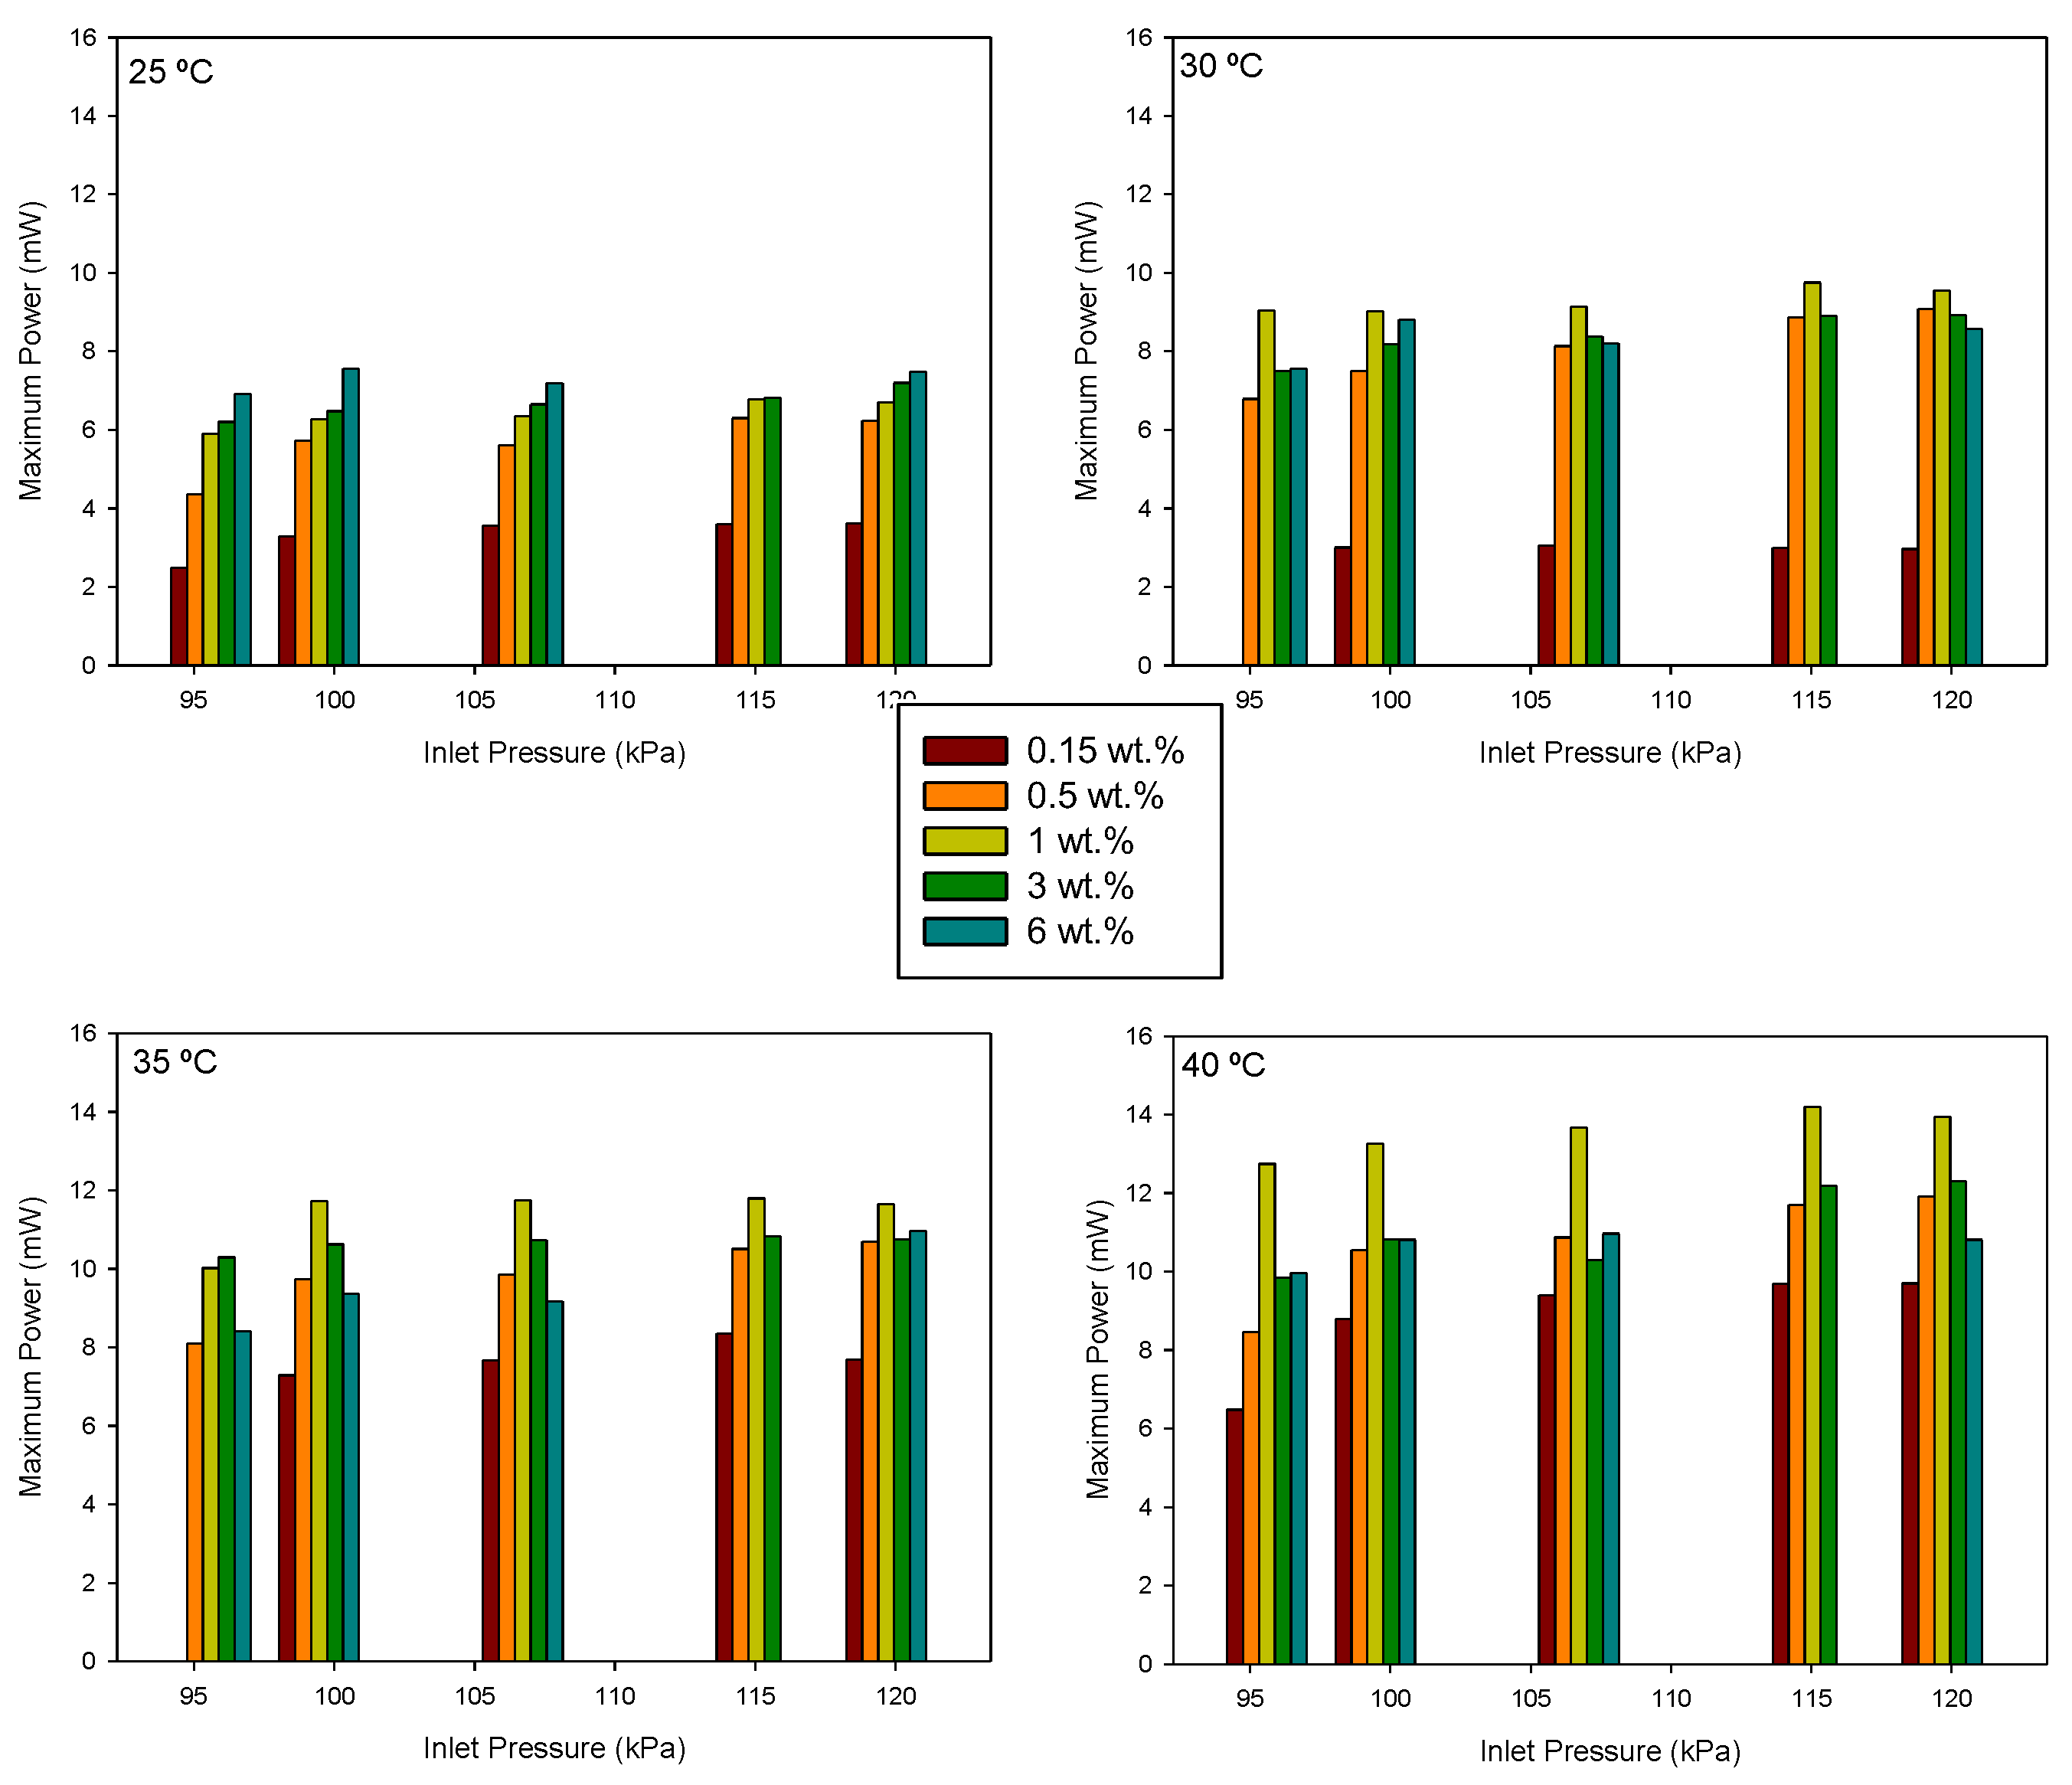
4.4. Maximum Power
From the current–power curves, the maximum power supplied by the cell under different experimental conditions was determined. The results are shown in
Figure 8, where the same axis scale has been used to facilitate comparison.
It is observed that, for all methanol concentrations, the maximum power increases with temperature. However, the effect of concentration varies depending on the temperature. A concentration increase reduces resistance loss and concentration polarization effects, but methanol crossover increases. Membrane methanol diffusion and hydraulic permeability increase with temperature [
11]. Therefore, an optimal concentration value is expected.
Table 2 presents the maximum power density values at ambient temperature (25 °C) for each concentration, along with the corresponding flow rates. At 25 °C, an increase in the concentration results in a higher maximum power density, but this maximum value is observed at lower flow rates as the concentration increases.
At ambient temperature, the highest value for the maximum power density was observed at a methanol concentration of 6 wt.% and flow level F2.
Table 3 presents the maximum power densities and their corresponding operating parameters for each methanol concentration. As shown, the highest value was achieved at the highest temperature, but with a 1 wt.% concentration.
These results suggest that the optimal flow level, and consequently, the optimal pressure difference between the anode and cathode, depends on the other operating parameters.
4.5. Maximum Efficiency
With the purpose of examining efficiency under the conditions of maximum power, the efficiency values were estimated for 1 and 6 wt.% methanol concentrations according to the following expression:
where
Eth indicates the thermoneutral potential, which can be calculated from the corresponding reaction enthalpy values. The values of
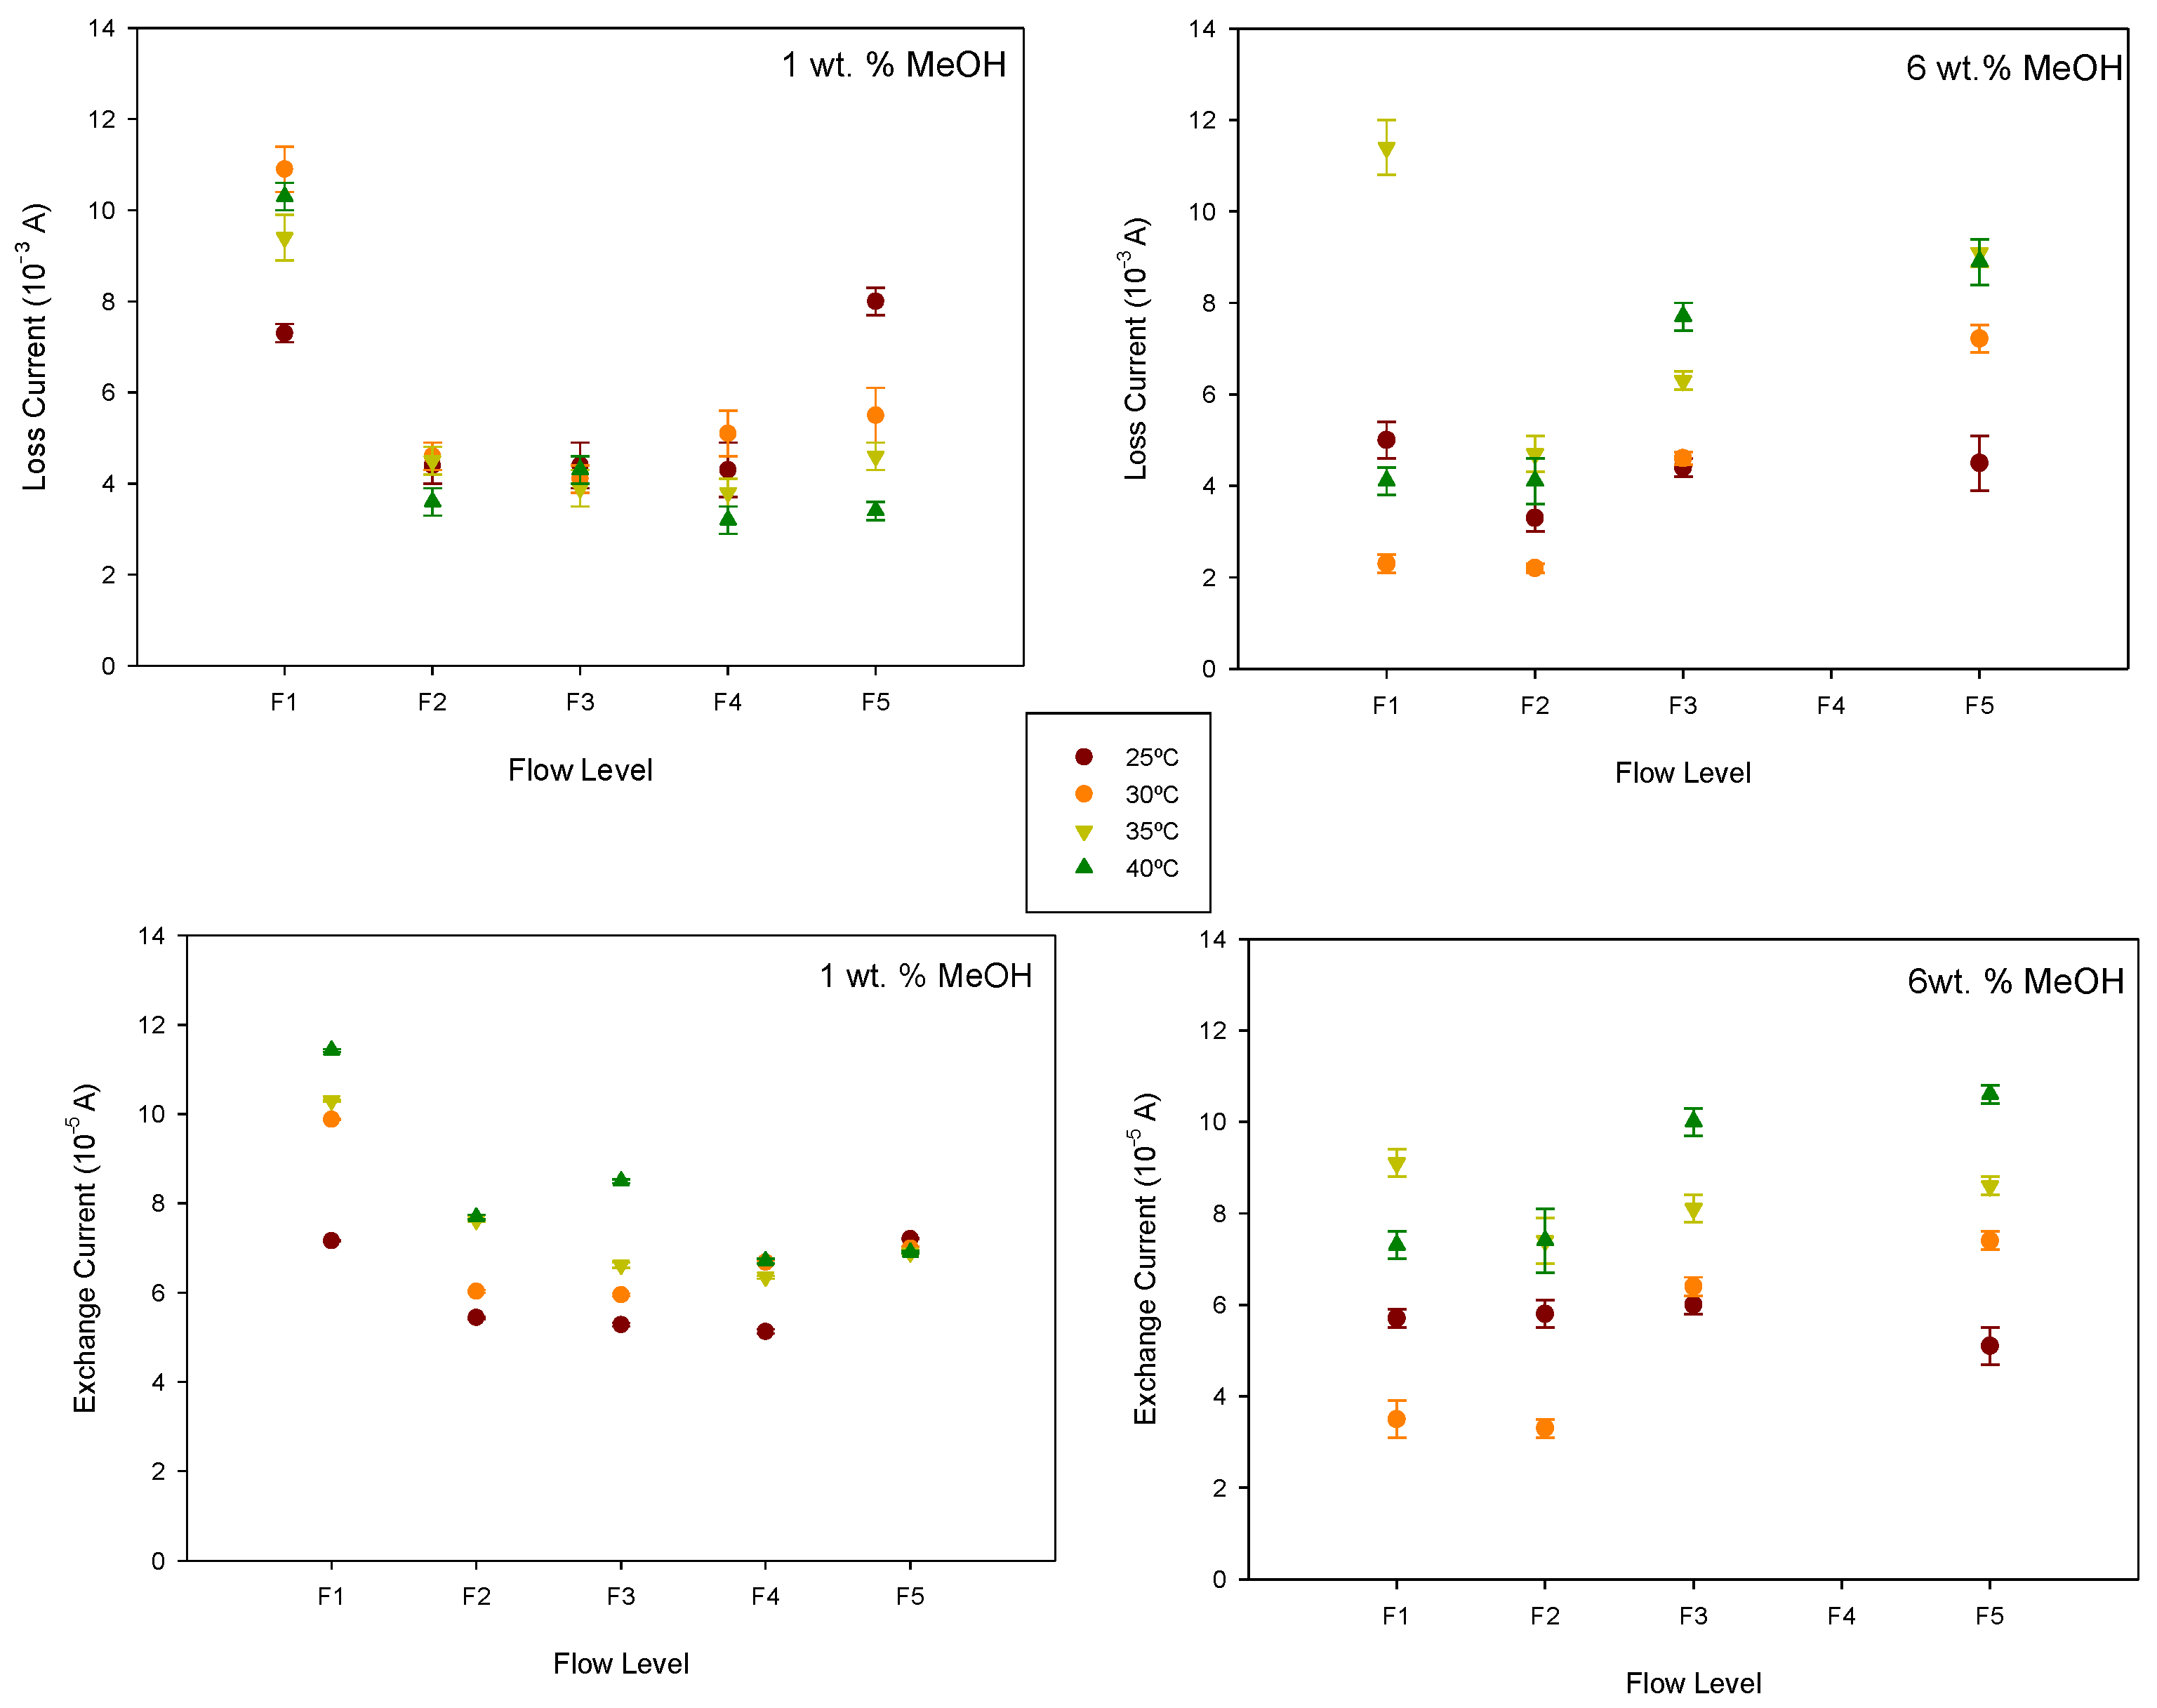
iloss were estimated from voltage–current curves at low currents by fitting experimental values to Equation (5). We assumed that, at very low currents, ohmic and polarization losses could be neglected. Transfer coefficients close to unity were obtained in all cases. The values of the loss current were of the order of 10
−3 A, and for the exchange current, values of the order of 10
−5 A were obtained. The results are shown in
Figure 9.
Although the effect of the methanol flow rate on the loss current depends on the anode methanol concentration and temperature, it is observed that the semi-passive mode generally reduces the loss current, likely due to the more uniform distribution of methanol. However, as the flow rate increases, the anode pressure also rises, which in turn favours methanol crossover. A minimum value for the loss current is observed at intermediate flow rates, which is more noticeable at a 6 wt.% concentration where the crossover effect is greater.
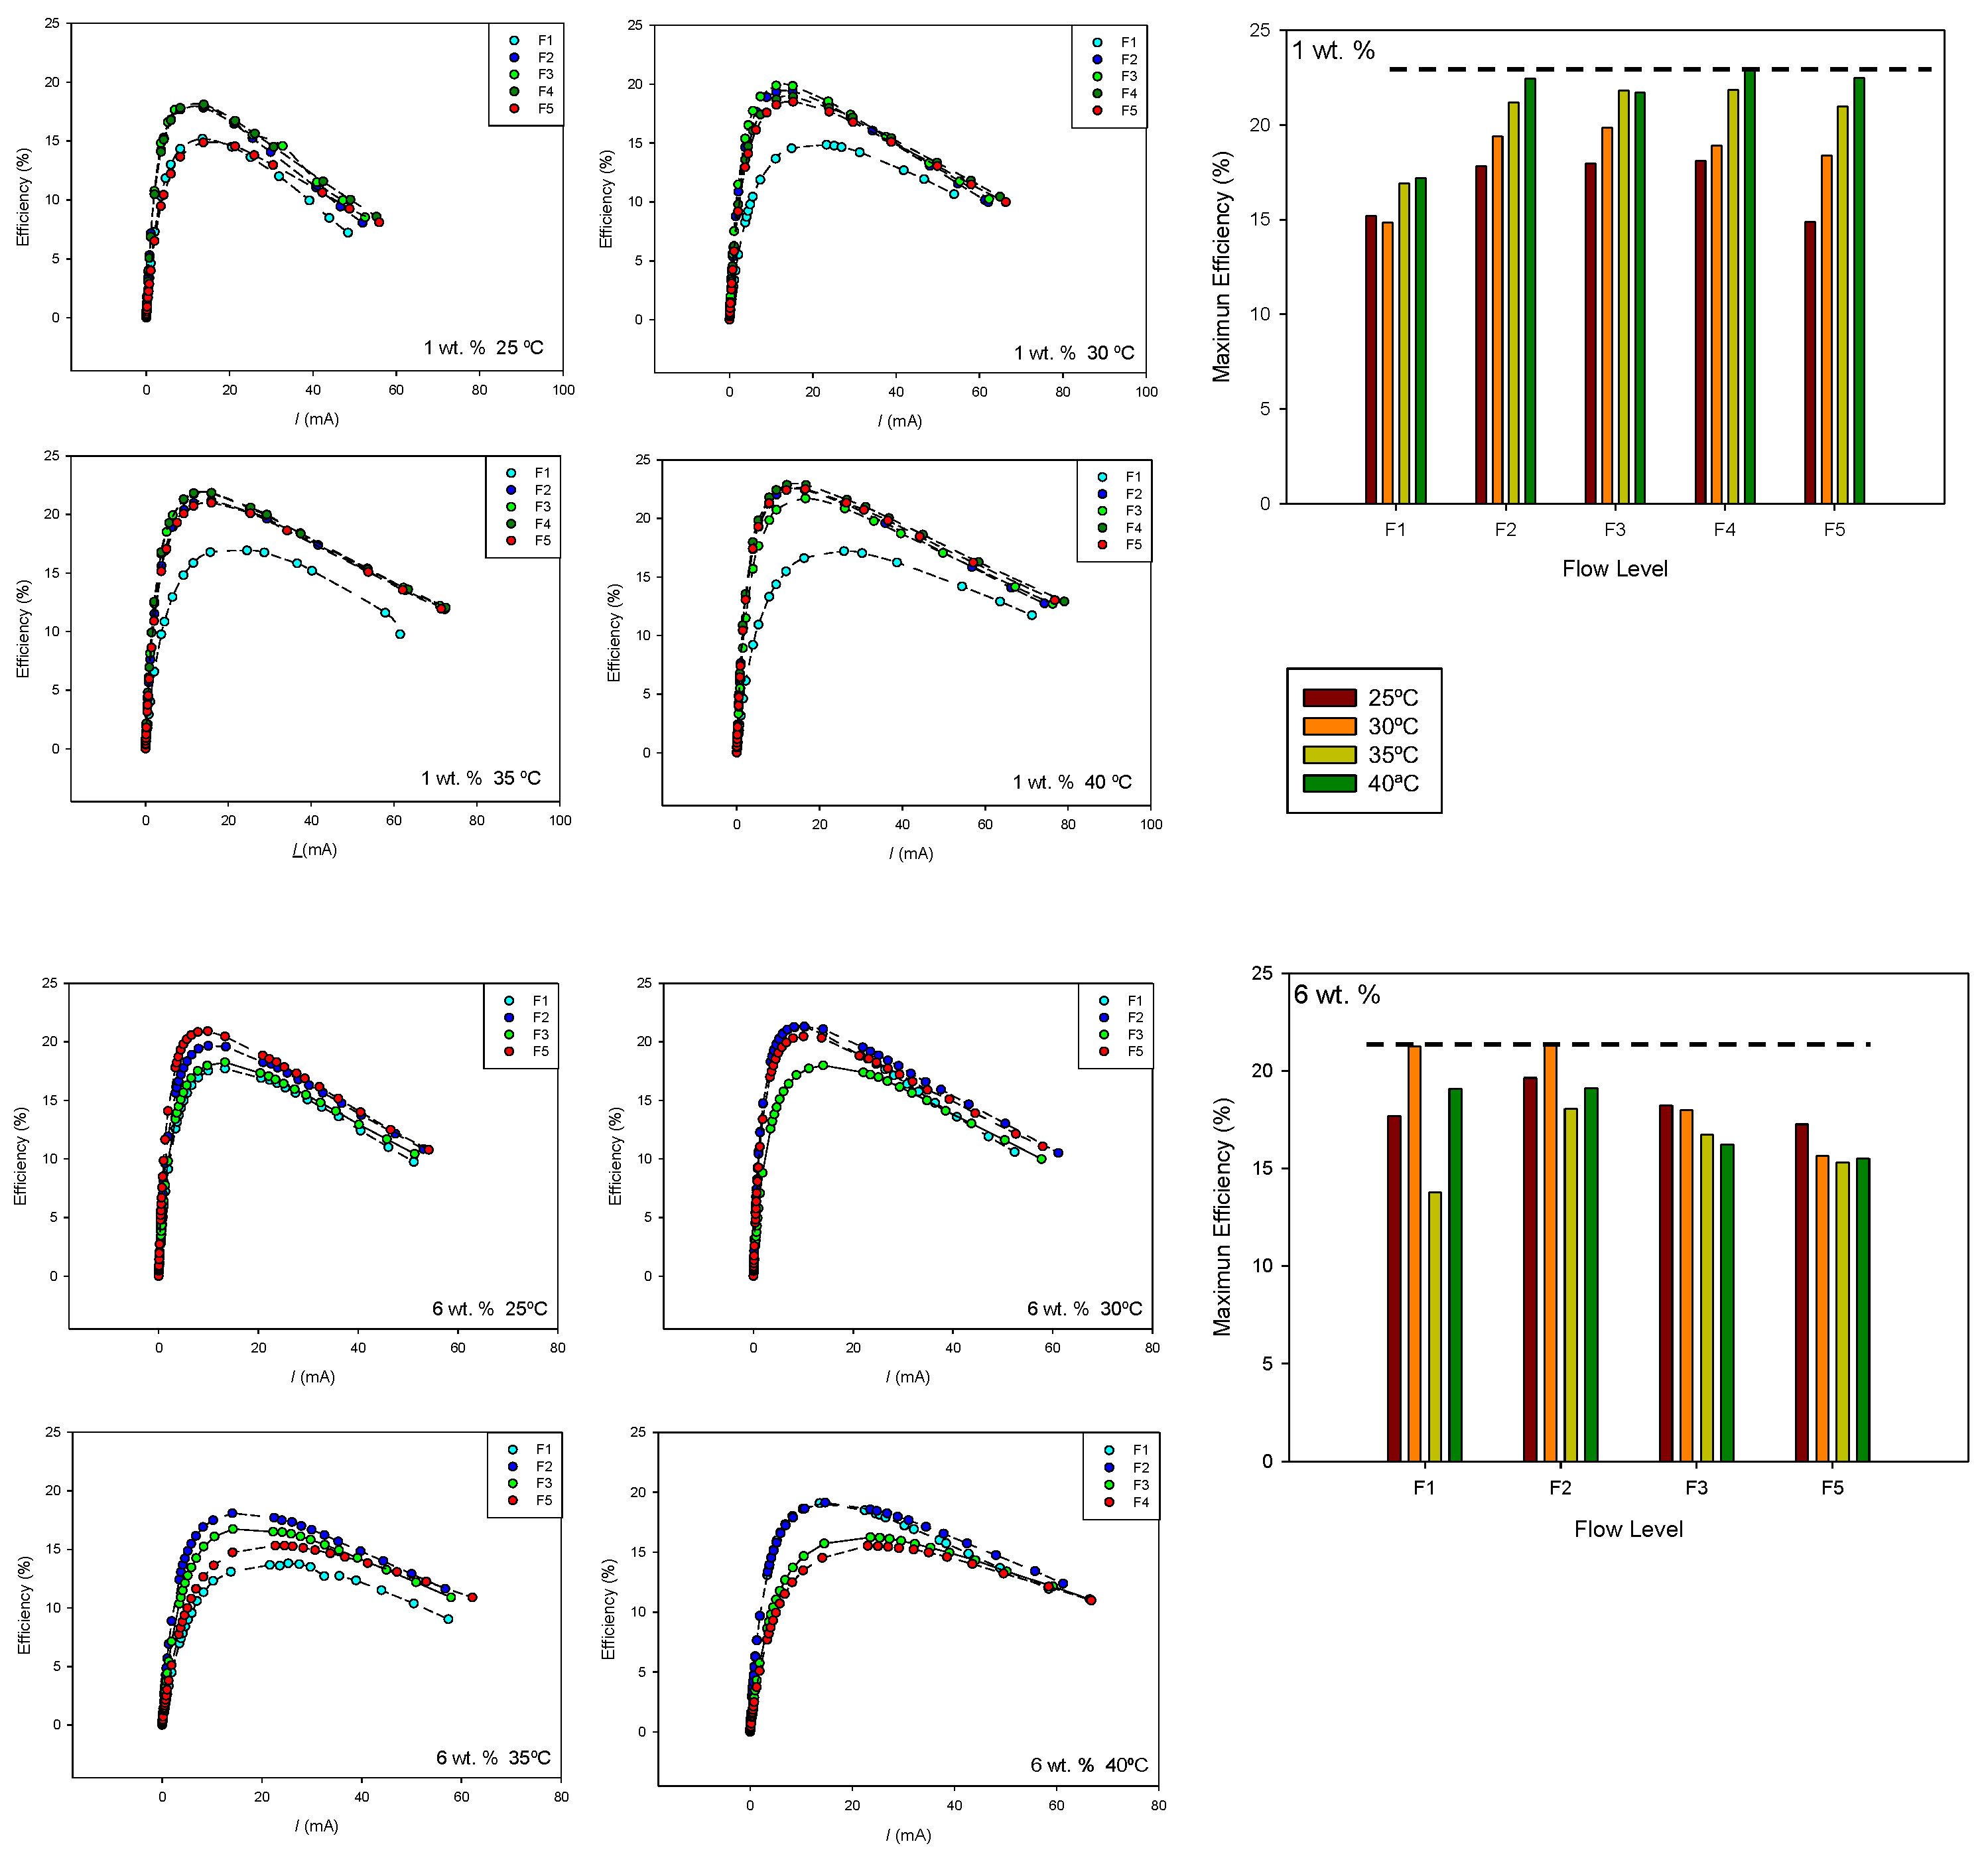
Figure 10 shows the efficiency–current curves obtained for 1 and 6 wt.% at the different temperatures and flow rates. The maximum efficiency value for each flow rate and temperature is also shown. As can be seen, both methanol concentration and temperature influence the effect of the flow rate on cell efficiency.
At 1 wt.% methanol concentration, higher efficiencies were obtained at higher temperatures. The maximum cell efficiency was also observed at flow level F4. At 6 wt.% methanol concentration, the maximum efficiency was observed at 30 °C and flow level F2. In this case, an increase in flow rate and temperature leads to lower efficiency values, probably due to an increase in the methanol crossover effect.
5. Conclusions
A mini-direct methanol fuel cell operating in semi-passive mode with an open cathode were evaluated. The influence of the anode methanol flow rate on the open-circuit voltage, maximum power, and fuel efficiency of the cell was analyzed for different methanol concentrations and temperatures.
The results show that, in general, switching from the passive to semi-passive mode increases the open-circuit voltage and cell power, improving fuel cell performance. However, a subsequent increase in the flow rate leads to a decrease in performance. An optimal flow rate value was observed, depending on methanol flow temperature and concentration.
At ambient temperature, maximum power was observed with a higher methanol concentration and a low flow rate. However, at higher temperatures, under the operating conditions analyzed (25–40 °C and 0.15–6 wt.%), maximum power was observed for a methanol concentration of 1 wt.% and a temperature of 40 °C. Under these operating conditions, the fuel cell also showed maximum efficiency.
The results seem to indicate that methanol circulation at low flow rates has a positive effect on fuel cell performance, probably because it enhances the uniform distribution of the reactant, reducing localized accumulation and improving the electrochemical reaction. Additionally, circulation can help remove CO2 produced during methanol oxidation, avoiding the formation of concentration gradients.
However, a subsequent increase in flow rate leads to a decrease in fuel cell performance, depending on concentration and temperature. This may be due to the methanol circulation causing a pressure difference between the anode and cathode which favours the methanol crossover effect. This effect is more pronounced at higher temperatures and concentrations, probably due to higher temperatures and concentrations favouring methanol crossover.
Proper management of the anode flow is necessary, depending on the temperature and methanol concentration.


