Article

Laboratory Modeling of the Bazhenov Formation Organic Matter Transformation in a Semi-Open System: A Comparison of Oil Generation Kinetics in Two Samples with Type II Kerogen

by
Anton G. Kalmykov
1,2,*,
Valentina V. Levkina
2,
Margarita S. Tikhonova
1,
Grigorii G. Savostin
1,2,
Mariia L. Makhnutina
1,
Olesya N. Vidishcheva
1,
Dmitrii S. Volkov
2,
Andrey V. Pirogov
2,
Mikhail A. Proskurnin
2 and
Georgii A. Kalmykov
1
1
Geology Department, M.V. Lomonosov Moscow State University, Leninskie Gory, 1, GSP-1, 119991 Moscow, Russia
2
Chemistry Department, M.V. Lomonosov Moscow State University, Leninskie Gory, 1-3, GSP-1, 119991 Moscow, Russia
*
Author to whom correspondence should be addressed.
Fuels 2025, 6(2), 22; https://doi.org/10.3390/fuels6020022
Submission received: 8 November 2024 / Revised: 11 January 2025 / Accepted: 16 January 2025 / Published: 25 March 2025

Abstract

:
In this study, Kerogen conversion and oil production laboratory modeling results in Bazhenov formation source rock samples (Western Siberia, Russia) are presented. Two samples from one well with a similar composition and immature type II kerogen, which were accumulated in the same deep-sea conditions, were used for this investigation. Hydrous pyrolysis was performed under 300 °C, with liquid products and a sample portion collected every 12 h to study kerogen parameters via pyrolysis and the synthetic-oil composition via GC–MS. The transformation of pyrolytic parameters was similar to the natural trend previously determined for Bazhenov source rocks with different maturities. The synthetic oils’ normal alkane composition and biomarker parameters transformed with time. Sedimentary conditions and lithology biomarker parameters presumed to be constant (Pr/Ph, Ph/C18, H29/H30, and DBT/Phen) changed depending on the heating duration. The oil maturation increased slightly. Differences between the samples were detected in hydrocarbon generation endurance (5 and 8 days), n-alkane composition, and C27/C29 and DBT/Phen. A hypothesis about the influence of kerogen variability and mineral matrix on oil production was made. This paper provides the basis for more detailed and accurate investigation of the factors affecting kerogen cracking and hydrocarbon formation.

1. Introduction

Two of the main recent energy resources, oil and gas, are produced primarily from conventional reservoirs. These resources are generated in source rocks and accumulate in the reservoirs through migration processes. It is noteworthy that if there are unconventional reservoirs (more than several-percent porosity) in source formation, hydrocarbons (HCs) can retain there, forming shale oil and shale gas deposits. But enhanced porosity is formed mainly as a result of hydrocarbon generation. This process in sediments is associated with the thermal decomposition of macromolecular organic matter (OM), kerogen, during geological evolution [1]. The amount of formed HCs depends on the concentration and initial structure of kerogen, as well as on the completeness of OM transformation due to geothermal evolution under the heat flows produced by different sources [2].
The study of OM transformation and oil and gas generation processes is a complex goal, and two main approaches are used. The most common is focused on the factual material investigation and creation of general geological concepts based on a single result. It has been determined that there are various kerogen types that differ in composition, characteristics, and, thus, transformation pathways. These differences, in turn, specify different compositions of generated HCs. In this case, a reservoir’s fluid characteristics depend on the accuracy of predictions on oil and gas generation processes in sedimentary basins. For this purpose, the conception of kerogen chemical structure and its individual chemical reaction behaviors during kerogen cracking is necessary.
One of the main problems of kerogen investigation is that even the same type of kerogen is nonuniform. Its structure may differ significantly in the number and position of functional groups and individual elements in bulk volumes [3,4]. As kerogen is macromolecular, it cannot be investigated using standard gas chromatography–mass spectrometry (GC–MS) methods. Other methods, such as FTIR and NMR, assess only individual features of the structure: the amount of aliphatic and aromatic carbon and hydrogen or the presence of individual functional groups or elements (double, triple, C=O, and –OH bonds) [5,6,7,8]. To estimate the kerogen structure, a mathematical modeling approach can be used. Several researchers have published studies on kerogen structure and transformation during oil and gas generation by estimating the positions of functional groups and single, double, and triple bonds [9,10,11,12,13]. However, these estimations are only assumptions. Also, as kerogen structure varies in terms of formation and depends on sedimentary conditions and secondary processes, an OM model should be created for each basin. Correspondingly, oil and gas generation processes should be investigated. Determining rock sample characteristics cannot provide sufficient information. Hence, modeling of oil and gas generation processes should be performed.
Another method of investigating the kerogen structure and its transformation during HC formation is to simulate HC generation. Among the modeling approaches to kerogen cracking processes, two methods are distinguished: computer and laboratory modeling. Basin modeling is the main computer method [14]. However, its primary purpose is to predict reservoir expansion by reconstructing the geological history on a regional level. Laboratory modeling is based on kerogen cracking experiments, where the geological time is equalized by the heating temperature. These studies can be performed in open systems using classical pyrolysis [15] or in closed systems [16,17,18,19]. There are also single studies in which a semi-open system was simulated using specialized complex equipment, including a dropping valve and a combined autoclave with a pressing jacket [20]. Different methods are used as there is a lack of agreement on which system is more similar to in situ process conditions. A semi-open system that allows part of the products to escape the reaction zone after exceeding a certain pressure is presumed to be the most similar one, though experiments using this system need much more effort and cannot be performed in one stage. The need for sophisticated equipment and a several-fold increase in the number of measurements makes semi-open systems uncommon. The compositions of the generated products in semi-open and closed systems are almost the same as those of HCs generated in situ. Closed hydrous pyrolysis is commonly performed in petroleum geochemistry and has been used for various formation investigations [21,22,23,24,25,26]. The aim of these experiments was to assess changes in the qualitative and quantitative composition of the generated HCs, including oil and bitumen biomarker parameters’ behavior under different experimental conditions [27,28,29,30,31]. However, most research has focused solely on the final product. The kinetics of HC composition alteration have been poorly investigated.
In this study, hydrous pyrolysis was applied to the Bazhenov formation (BF) source rocks, which are considered as one of the main oil-source strata in Russia [32]. The experiments based on BF samples heating with water are described in different publications [33,34]. However, they were performed on the exact samples, while BF has nonuniform characteristics through the section and area. The kerogen heterogeneity is expressed both in OM maturity and maceral composition variation [35,36,37,38]. Since various OMs have a different structure, the HC generation processes will be performed in a number of ways [39]. The mineral matrix variability can also affect the kerogen transformation process [40].
A hydrous pyrolysis investigation of two BF rocks samples from the same well, which were formed in similar sedimentary conditions, was performed. To study the kinetics of OM transformation and oil generation, a unique experiment in a semi-open system, which is a series of the closed-system hydrous pyrolysis experiments, was set up. At each stage, a part of the sample and produced synthetic oil were collected for the investigation. The design of the experiment shrinks the role of a generated HC secondary cracking. It also allows for investigating kerogen cracking kinetics. The aim of the study was to investigate kerogen transformation and oil generation and to assess the similarities and differences in the processes for the similar rock samples. Based on these results, the possibility of unifying the section will be verified, and some conclusions on the factors that may affect oil formation in the BF source rocks will be drawn.

2. Geological Setting

The Bazhenov formation (BF) is the largest oil and gas source stratum in the world. It is the main source rock of West Siberia and includes the following analogue formations: Tutleimskaya, Mulyminskaya, Maryanovskaya, Yanovstanovskaya, and Golchikhinskaya (Figure 1) [41].
BF contains OM in several forms: kerogen, hydrocarbon compounds physically bound to kerogen or mineral matrix, and movable HC compounds. If unconventional oil reservoirs were formed in the BF due to the kerogen transformation, movable HC might be recovered using hydraulic fracturing and other special technologies. The following features are characteristic for BF rocks: uneven and poorly predicted lateral and cross-section distribution of lithotypes and OM; its maturity; complex structures of the mineral matrix and the pore space; multicomponent composition of rocks and OM. With a huge distribution area of about 1.2 million km2, the thickness of BF sediments mainly does not exceed 50 m. Such a low thickness makes it almost impossible to use the seismic survey methods for the direct assessment of the deposit characteristics. Lateral BF rocks are substituted with the same-aged facies analogues: kerogen-saturated clay–carbonate–siliceous rocks are replaced by gray-colored clays, which are further displaced by sandy–silty glauconite-containing sediments penetrated on the periphery of the Bazhenov epicontinental paleobasin.
One of the main features of BF sediments is the specific rocks composition, which has no analogues in the West Siberian basin sections: an increased content of kerogen formed from aquagenic OM, a set of rock-forming minerals, determined by a different ratio of siliceous minerals (opal, cristobalite, tridymite, chalcedony, and quartz), carbonate and clay minerals. The main mineral compositions are clay–siliceous and siliceous, which were formed mainly by biogenic sedimentation [42] or the bacterial processing of sludge. Secondary processes proceeded at various stages of lithogenesis under the increased heat flow, which can lead to an unconventional reservoir forming. Meanwhile, rocks with relatively high porosity and permeability (up to 25% of pore space in radiolarites) are quite rare, and the entire thickness of BF is characterized by extremely low porosity values (less than 1%) and permeability (0.01–0.1 mD). Therefore, BF rocks have complex structures, and their transformation frequently occurs under elevated heat flow, which might affect the process of HC generation.

3. Materials and Methods

3.1. Sample Collection

To study the oil and gas generation process, two BF samples, Sample A and Sample B, taken from the middle of one section, were selected. The interval between the samples is 1 m. Both samples show similar properties. The rocks accumulated in uniform settings relative to the deep-water sea (water depth is less than 400 m). According to the X-ray diffractometry (XRD) results with a MiniFlex 600 X-ray diffractometer (Rigaku, Tokyo, Japan), samples are composed of silica (59.1 and 54.5%), clay minerals (22.4 and 17.2%), OM (8.4 and 17.1%, according to the pyrolysis investigations), and sodium feldspar (6.5 and 5.2%). There are almost no other minerals in the rocks (the content of pyrite and carbonates is less than 5% in total), and their composition can be considered similar. The reason for the difference might be in the minor difference of terrigene sediment ablation or bioproductivity local activation. Both processes do not affect the OM structure. Kerogen parameters are also almost identical: after removing all HCs with chloroform, hydrogen index (HI) parameters are 626 and 703 mg of HC/g TOC and Tmax = 430 °C, which characterizes the OM as an immature marine type.

3.2. Hydrous Pyrolysis

Hydrous pyrolysis was performed for laboratory modeling of oil and gas generation. Pulverized rock samples weighing 50 g were placed in an autoclave (Comvics, Moscow, Russia), and 50 mL of distilled water was added. Autoclaves were heated in the furnace (Oven, Moscow, Russia) under 300 °C, with a water vapor pressure of 90 atm. The experiment duration was 10 (Sample A) and 12.5 (Sample B) days and ended when the amount of released synthetic oil was less than 0.0001 g. During the hydrous pyrolysis, every 12 h, autoclaves were elicited from the furnace, cooled to room temperature, and opened; the released light synthetic oil was collected from the water surface using 10 mL of pentane (chemically pure, Ekos-1, Moscow, Russia). After removing the solvent from the generated HCs via evaporation and achieving a constant mass of fluid, the amount of produced synthetic oil was determined by weighing, with accuracy of 0.00005 g. Synthetic oil and water were separated with a dividing funnel. A total of 1 g of each heated sample was taken from the autoclave for pyrolysis measurements. A volume of 50 mL of water was then added to each autoclave, and the experiment was resumed.

3.3. Pyrolysis

Pyrolysis of the initial samples and powders taken from the autoclaves at each experiment stage was conducted on a HAWK Resource Workstation (Wildcat Technologies, Humble, TX, USA) at a heating rate of 25 °C/min from 300 °C to 650 °C. The sample weight for analysis was 30 ± 1 mg. Before pyrolysis, all samples were dried at a temperature of 87 °C for 2 days. To estimate kerogen properties, HCs were removed from the samples using chloroform (chemically pure, Ekos-1, Moscow, Russia). Extraction was carried out until the concentration in the solution reached 0.000625% or lower. The research methodology and the parameters to be determined are described in more detail previously [15].
The main measured parameters are S2 (mg HC/g rock) and Tmax (°C). The S2 parameter after extraction shows the potential of kerogen to generate HCs. Tmax is the temperature at which the maximum HC release occurs. The parameter determines the maturity of rock samples [15]. Among the calculated parameters, hydrogen index HI was used. HI (mg HC/g TOC) commonly decreases with an increase in OM maturity. Total organic carbon (wt. %) shows the total content of organic carbon in the sample. To determine OM concentration, the TOC value was multiplied by the proportion of carbon in the immature OM, which is 71% in the BF source rocks of the region. The accuracy of pyrolysis measurements relative to the WT2-HAWK-STD standard was ±10% for S2 and HI measurements, ±2 °C for Tmax, and ±5% for TOC. The calculations of other pyrolytic parameters given in the appendices were also described in detail previously [15].

3.4. Synthetic Oil Preparation for GC-MS Analysis

The obtained synthetic oils were separated into saturated and aromatic fractions according to SARA-analysis [43]. The asphaltenes were precipitated by adding a 40-fold excess of n-hexane (chemically pure, Ekos-1, Moscow, Russia) for 24 h and filtering.
Silica gel column chromatography with sequential elution with n-hexane (chemically pure, Ekos-1, Moscow, Russia) and toluene (chemically pure, Ekos-1, Moscow, Russia) was used for the further separation of saturated and aromatic fractions, respectively.
Thus, through hydrous pyrolysis, 20 and 25 synthetic oils were obtained from samples A and B. They were fractionated, and a total collection of 90 samples (45 of each fraction) was analyzed.

3.5. GC-MS Analysis

Gas chromatography (GC) with mass spectrometry (MS) was performed using a GC-MS chromatograph 8890 GC-5977B MSD (Agilent Technologies, Santa Clara, CA, USA) with a HP-5MS capillary column (30 m length × 0.5 mm internal diameter × 0.25 μm film thickness, Agilent Technologies, USA). Data collection and chromatogram processing were performed using MassHunter software (Agilent Technologies, USA, Version 12.1).
Helium was the carrier gas. The flow rate through the column was 1 cm3/min, the volume of injected sample was 1 mm3. The evaporator temperature was 290 °C, and the temperature of the interface was 300 °C. The MS data were acquired in a scan mode (m/z 35 ÷ 600 Da). The relative abundance of compounds was determined from peak areas using selected mass chromatograms for the integration of compounds. The temperature of the ion source was 230 °C, and the energy of ionizing electrons was 70 eV.
For aromatic fraction measurement, temperature conditions were set as follows: initial column temperature was maintained at 60 °C for 3 min, then increased to 180 °C at a rate of 15 °C/min, and then to 300 °C at a rate of 4 °C/min. Isothermal heating exposition at 300 °C was 6 min. The total analysis time was 56 min.
For saturated fraction measurements, temperature conditions were set as follows: the initial temperature was maintained at 60 °C for 3 min, then the temperature was increased to 180 °C at a rate of 27 °C/min, and then to 300 °C at a rate of 6 °C/min. Isothermal heating exposition at 300 °C lasted for 25 min. The total analysis time was 57 min.
The following parameters were used as reference parameters. Differences in sedimentary conditions and lithological composition of the source rocks were determined using following ratios: Pr (i-C19 wist)/Ph (phytan i-C20), H29 (17α(H),21β(H)-norgopan)/H30 (17α(H),21β(H)-gopan), t24 (C24H44 tricyclic terpan)/t23 (C23H42 tricyclic terpan), H35S/H34S (H35S-17α(H),21β(H),22(S)-pentaxisgohomogopan, H34S-17α(H),21β(H),22(S)-tetrakysgohomogopan), DBT/Phen (dibenzothiophene/phenanthrene ratio), and dia/(reg + dia)C27 (ratio of dia- and regular steranes C27). The contribution of OM of different nature is recorded by Pr/C17, Ph/C18 t23/H30, C29/C27 (the ratio of regular steranes C29 (propyl-cholestane)- and C27(cholestane)). To assess the maturity of the parent OM from which specific biomarkers were separated, the parameters Ts/(Ts + Tm) (Ts, 18α(H)-22,29,30-trisnorgopan; Tm, 17α(H)-22,29,30-trisnorgopan), MPI-1 (MPI-1 = 1.5(2MP + 3MP)/(P + 1MP + 9MP) MP is methylphenanthrene) were used. These parameters and their cut-off values are described in previous papers [44,45,46,47,48,49,50].

4. Results

Two kerogen-transformation laboratory modeling experiments used to study the oil and gas generation processes in the BF source rocks were performed. The samples pulverized to a 200-mesh powder had a similar composition with slightly higher amounts of silica and clay minerals in Sample A relative to Sample B (5% for each group of minerals), as well as a higher content of OM in Sample B (17.1 compared to 8.4 in Sample A). The experiments simulated a semi-open system, from which a part of the rock and generated synthetic oil were collected every 12 h.

4.1. The Results of Oil Generation Laboratory Modeling in a Semi-Open System

The pyrolysis results of the origin and heated samples after extraction (Figure 2) demonstrate kerogen properties’ (hydrogen index and Tmax) evolution during laboratory modeling. The pattern is equal to the theoretical aspects determined by Kozlova et al. when measuring rock samples with different maturities [36]. During the experiments, Tmax significantly increases only after 36–48 h of thermal treatment. Contrariwise, HI lowers from 600–700 mg HC/g TOC to 150–200 mg HC/g TOC during the first 48 h. In Sample B, the value of ca. 150 mg HC/g TOC was achieved in three stages (36 h). In Sample A, the most significant change of HI on ca. 250 mg HC/g TOC was promoted after the first 12 h, and then it took three more stages to achieve a value of 185 mg HC/g TOC. After 2 days of thermal treatment, the kerogen-transformation velocity lowers, and HI changes by less than 10–20 mg HC/g TOC for both samples. The difference in the kerogen-transformation process in the studied samples was also detected by the different resulting Tmax values. For Sample A, after 10 days, Tmax reached ca. 470 °C, while after 12.5 days of heating of Sample B, the value was ca. 450 °C. The pyrolysis results show the same trend of parameters evolution, but there was a difference between velocity and kerogen transformation efficiency for the samples.
The amount of synthetic oil produced for Sample B is higher than for Sample A (474 mg to 381 mg). The kinetics of product generation also differ significantly (Figure 3). For Sample A, the most intensive hydrocarbon generation is observed in the first 2 days. The maximum yield was obtained after the first 12 h, and then approximately the same amount of HC is released for 1.5 days. After 2 days, the yield decreases exponentially, reaching values close to 0 on the 6–7th day of the heating. For Sample B, two maximum yields of synthetic oil were recorded. The first was achieved after 1.5 days of hydrous pyrolysis, and the amount of generated oil was ca. 100 mg. The second maximum yield was established after 3.5 days of treatment and reached ca. 70 mg. The amount of releasing HC lowered to almost 0 on the 8–9th day of heating.

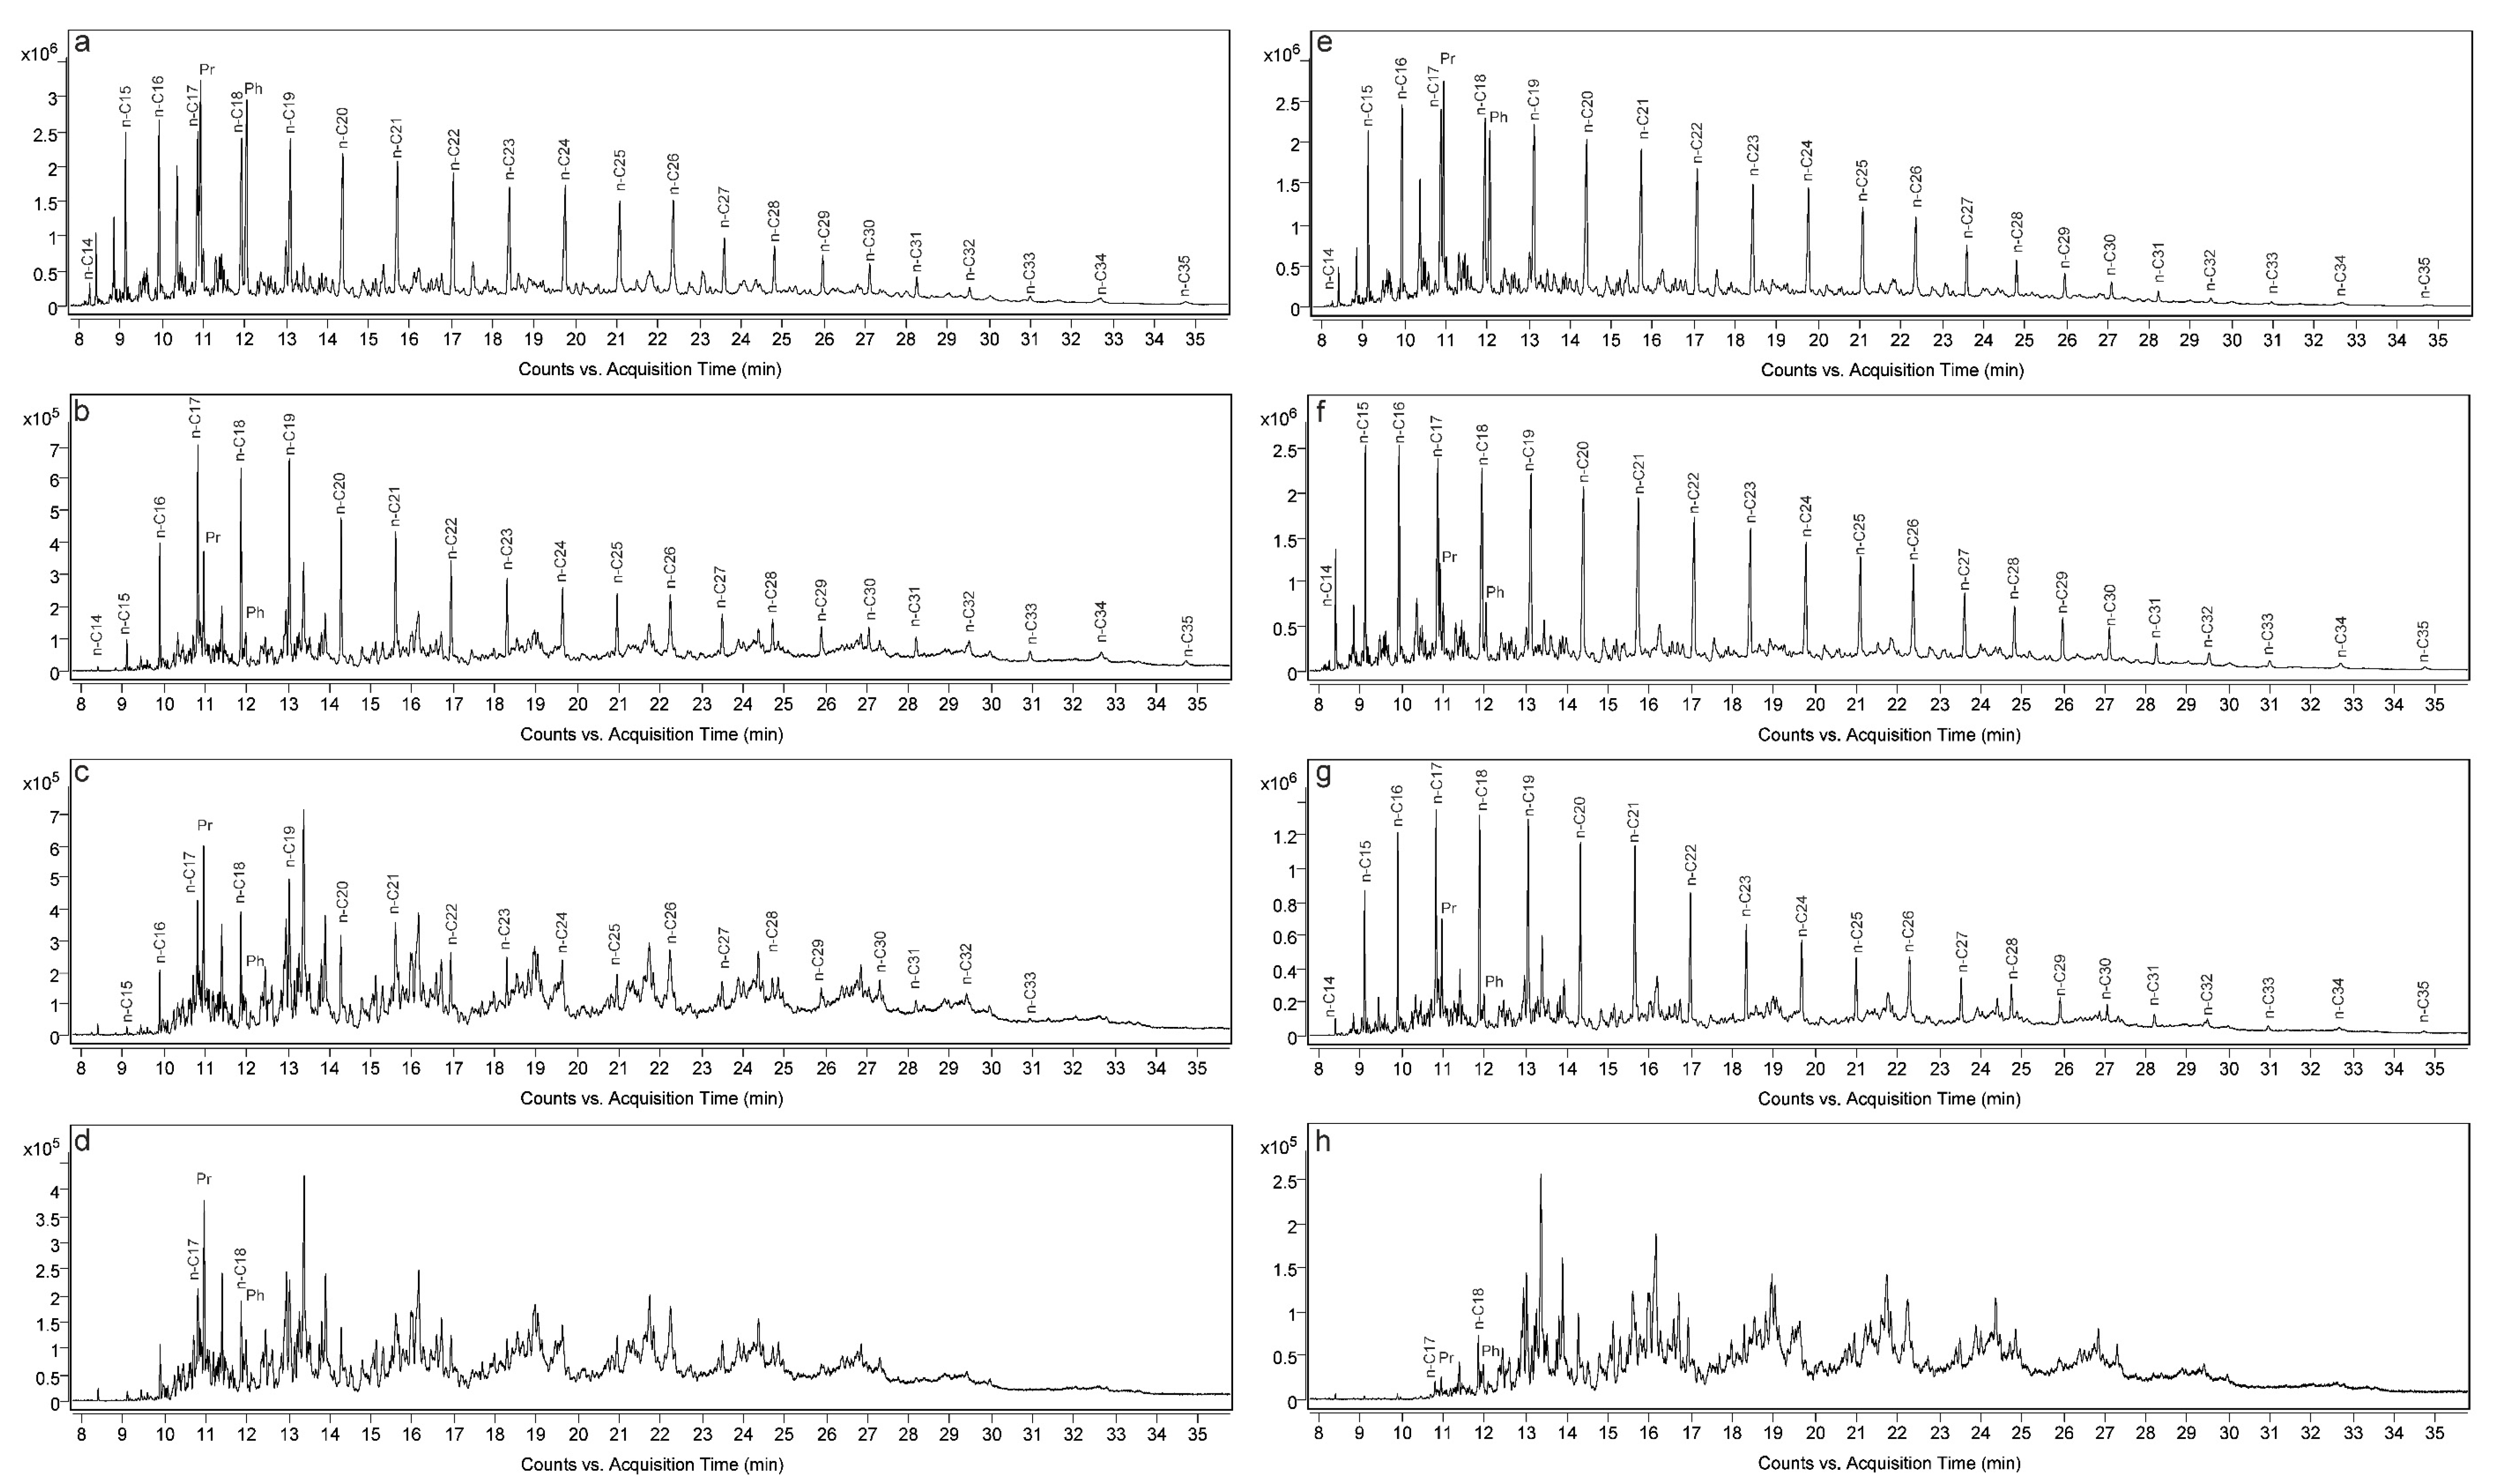
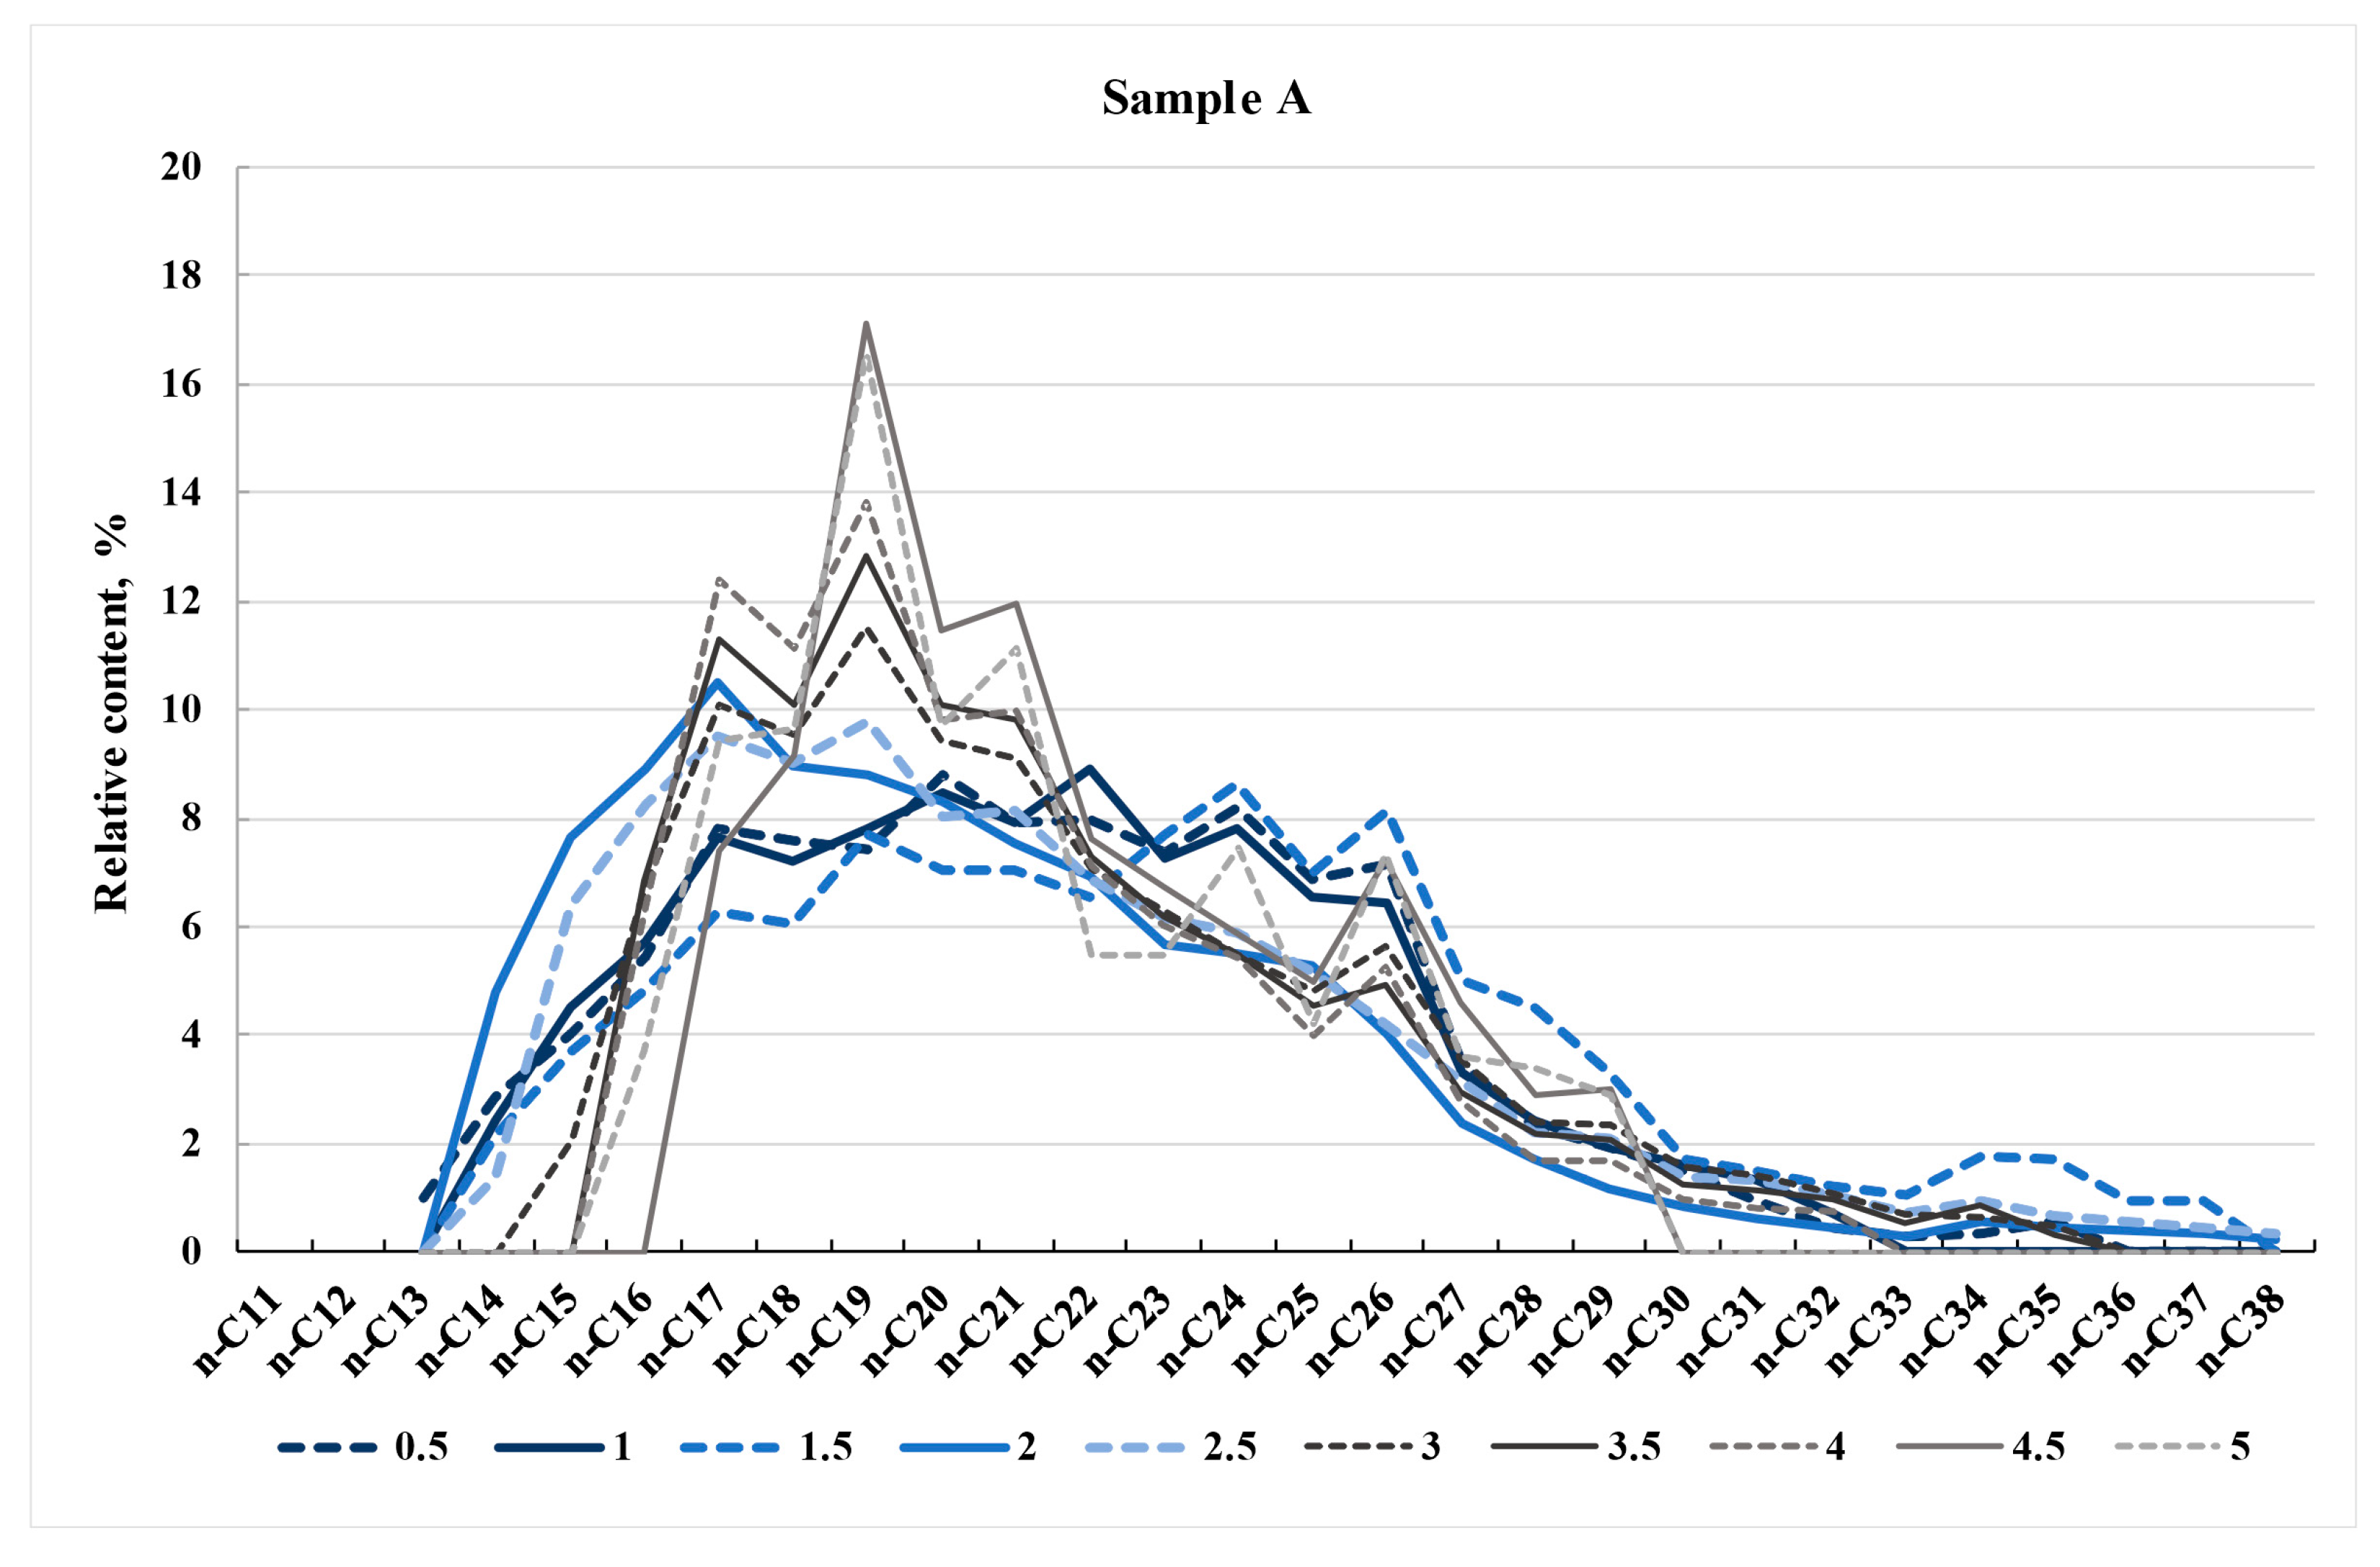
4.2. Normal Alkane Distribution in Synthetic Oils

Figure 4 shows 71 m/z mass fragments for normal alkane distribution in synthetic oils generated at different stages of hydrous pyrolysis (by the total ion current). N-alkanes were only determined in the first 5–8 days of the laboratory modeling.
In the synthetic oils produced after 5 days of the hydrous pyrolysis of Sample A, most n-alkanes were not identified, and only isoprenoids were detected. For Sample B, normal alkanes were found in oils till the end of day 8 of exposure. The yield of n-alkanes correlates well with the yield of maltenes during heating.
The percentage composition of n-alkanes in synthetic oils at each stage of the experiment was determined using GC–MS (Figure 5 and Figure 6). The synthetic oils generated in Sample A during 0.5–5 days contain C13 to C38 n-alkanes. In the first stages of the experiment (12–48 h), there was no explicit maximum in the composition. After the 3rd day of treatment, the n-alkane C19 became predominant. The secondary maxima for n-alkanes C17 and C21 were also detected. The longer the exposure, the greater the predominance of n-alkane C19 relative to the other ones in the synthetic oils (Figure 5). As mentioned above, only several n-alkanes could be determined in synthetic oils produced after the 5th day of the HC generation laboratory modeling.
The synthetic oils in Sample B contain n-alkanes C11-C36 (Figure 6). Similar to the Sample A synthetic oils, there is no explicit maximum in the n-alkane composition till 4.5 days of the experiment, and the distribution is almost identical. After the 5th day of hydrous pyrolysis, a well-defined double maximum related to the C19 and C21 in n-alkane composition is observed. Also, no compounds with a chain length of less than C16 and more than C30 are detected. After the 8th day, most n-alkanes are not found in these synthetic oils.

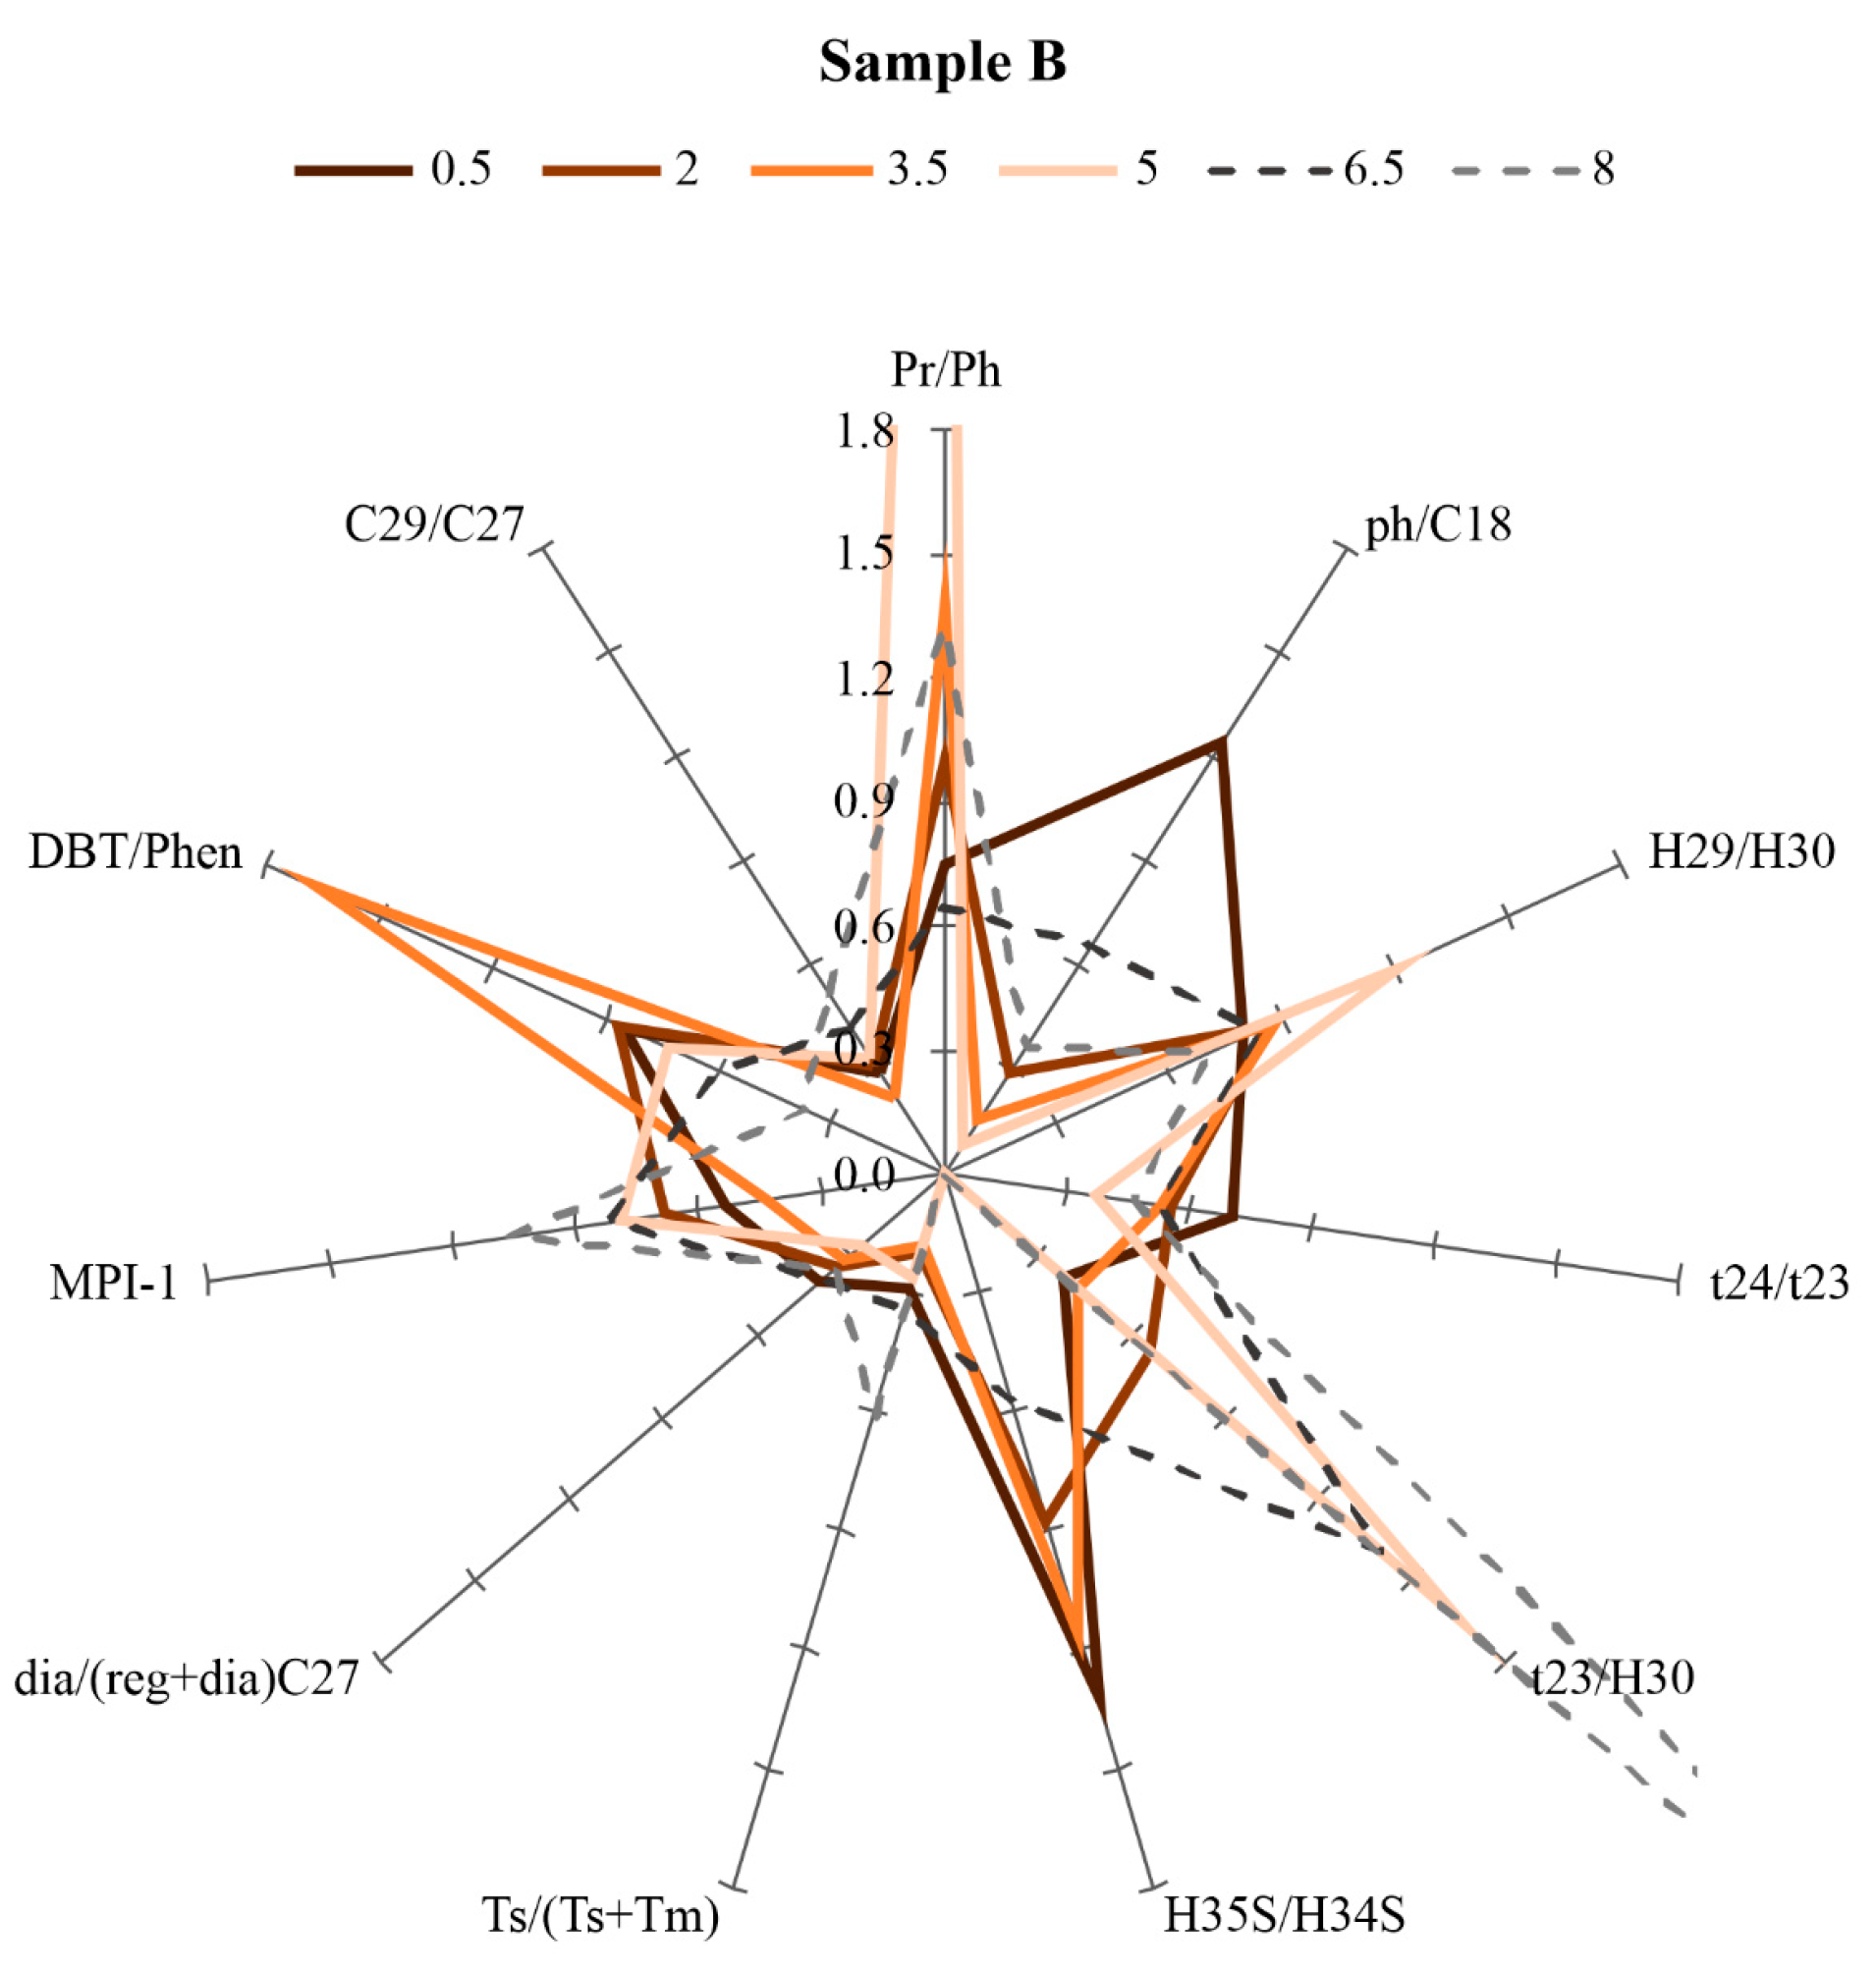
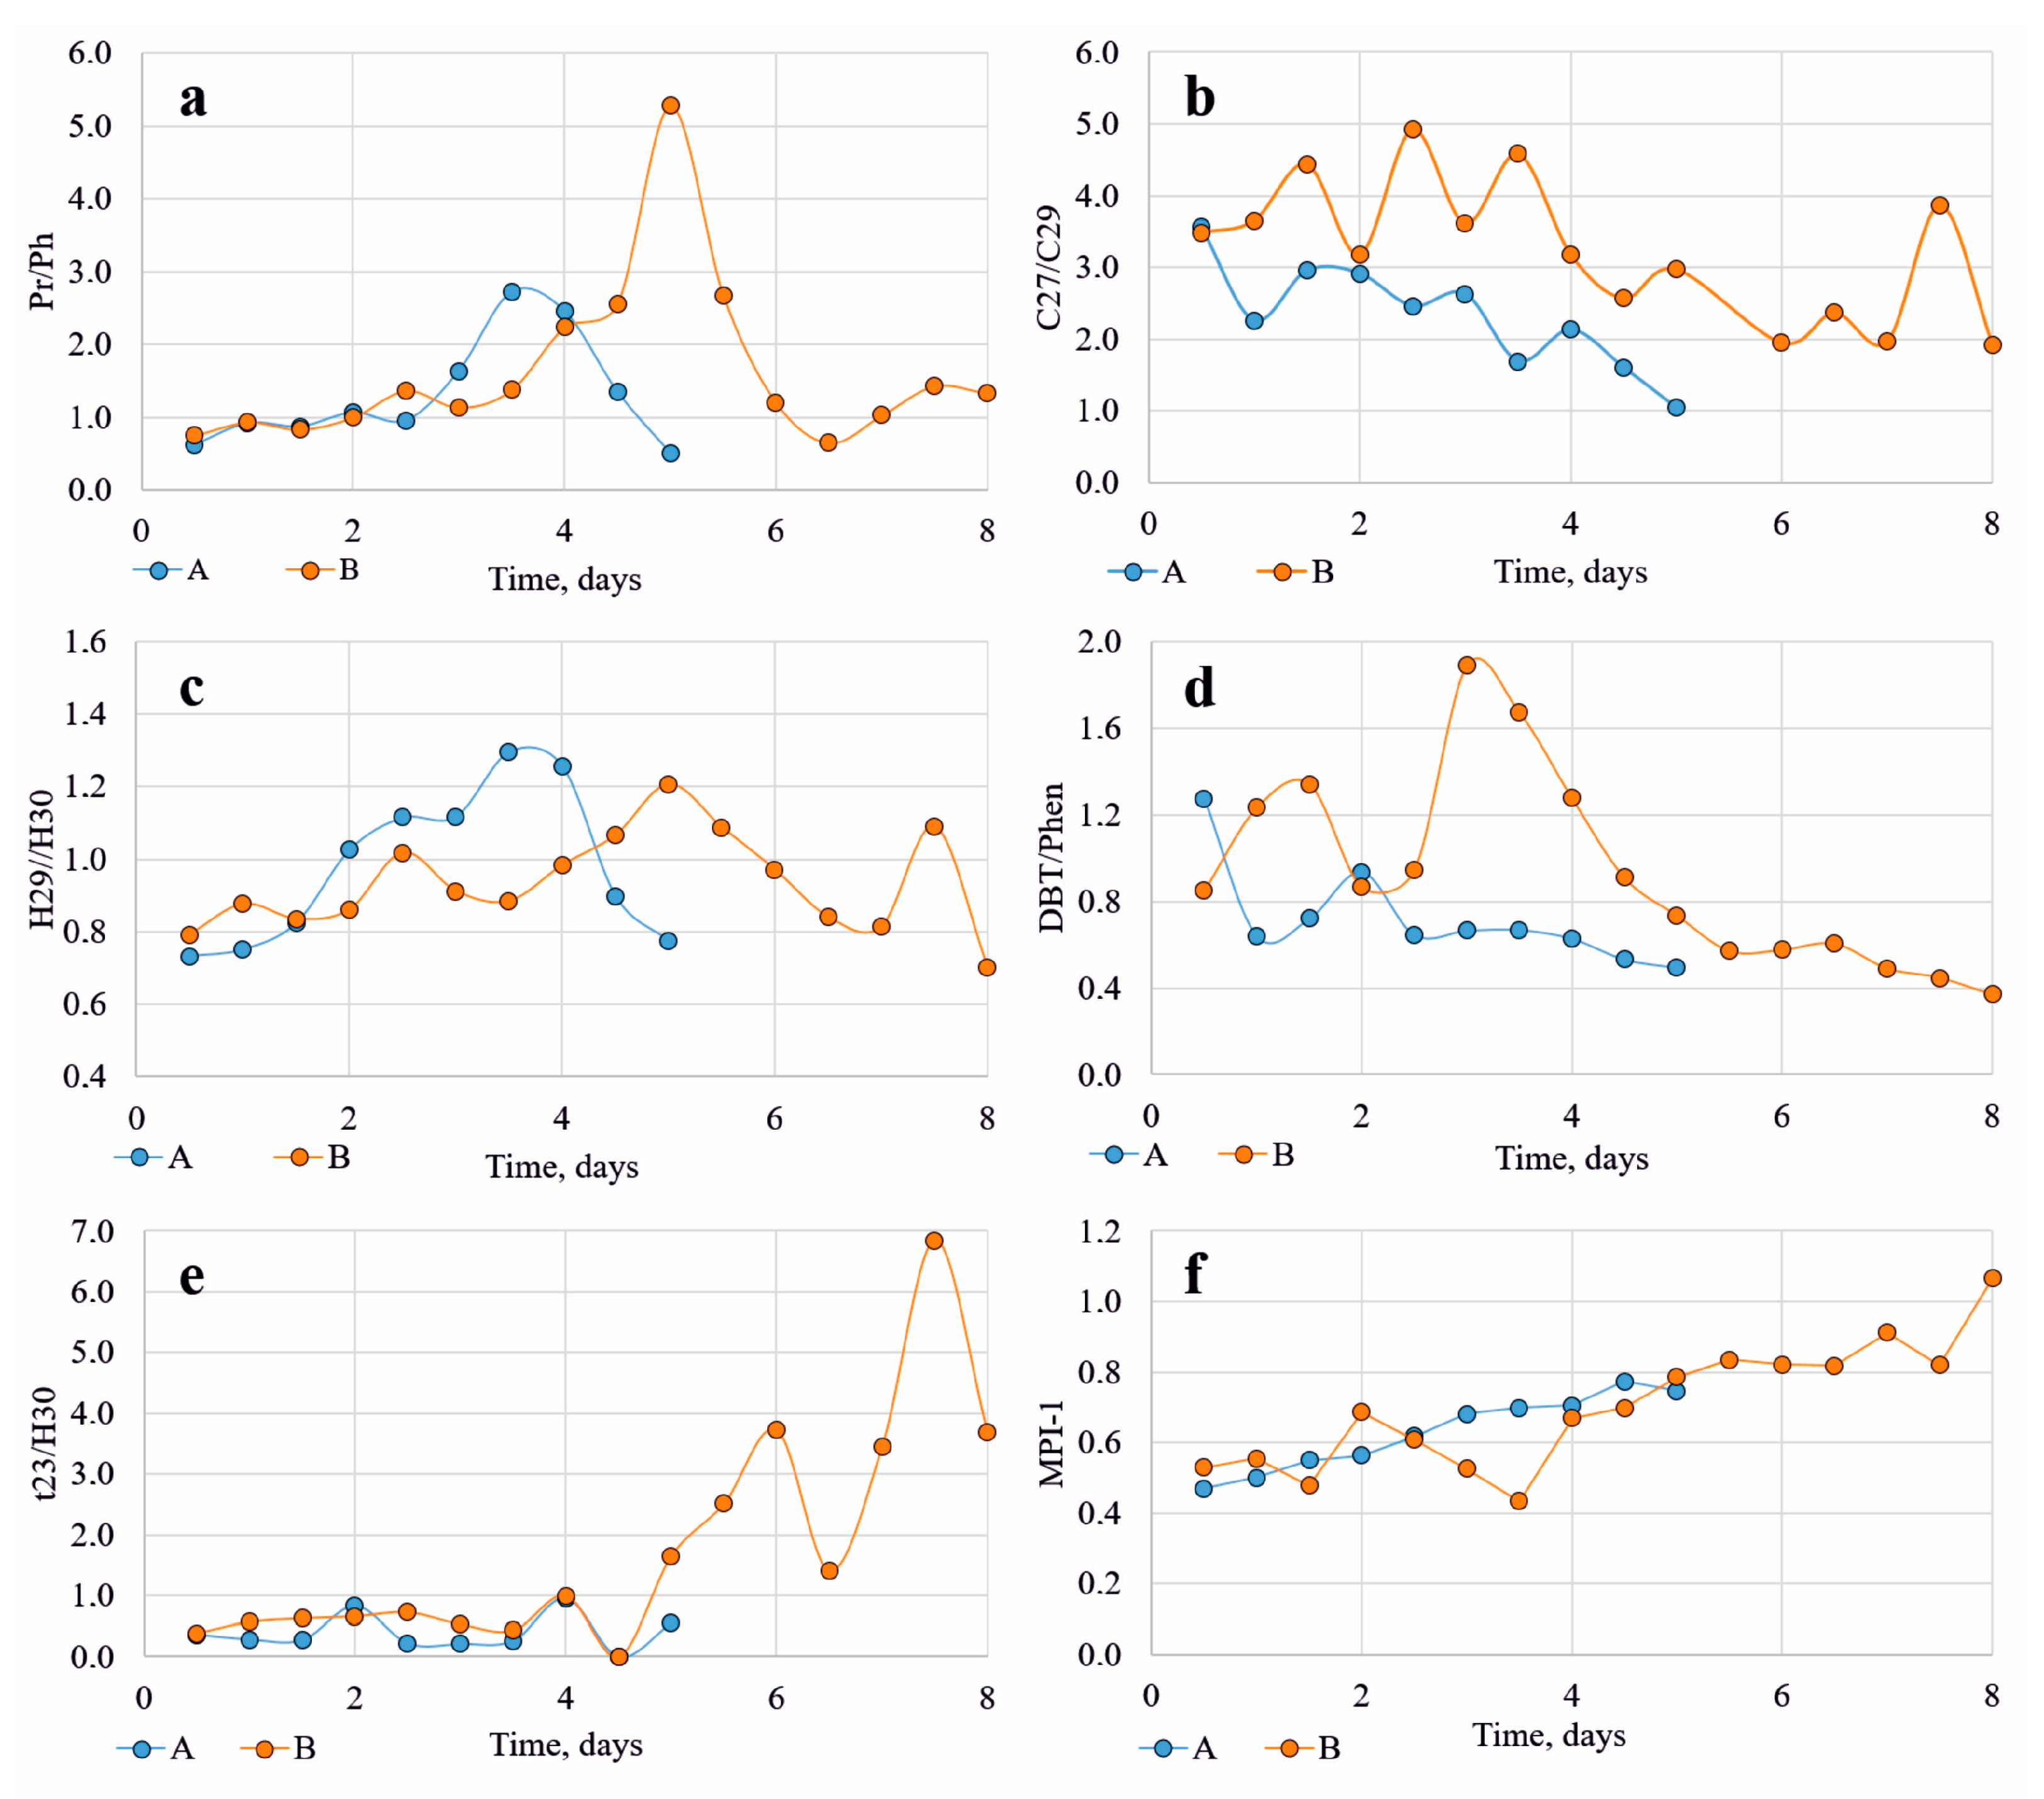
4.3. Biomarker Parameters of Synthetic Oils

The kinetics of the synthetic oil generation process were investigated by analyzing biomarker parameters. The GC–MS results show that during laboratory modeling, the amount and ratio of biomarkers vary. Figure 7 shows that the ratio of hopans H29 and H30 and terpans t23 and t24 changes during the hydrous pyrolysis. The amount of terpans (in comparison with hopanes) decreases with the increase in the thermal treatment duration, foremost in synthetic oils from Sample A.
The synthetic oils’ biomarker parameters (listed in methods) star diagrams for samples A and B were used to demonstrate changes in the molecular composition of the generated HC (Figure 8 and Figure 9). Similar to the n-alkane composition of oils generated from Sample A after the 5th day of the experiment, most biomarkers were not detected. The diagram shows that some of the biomarker parameters change in a fairly wide range. Thus, the parameters Pr/Ph, Ph/C18, H29/H30, and DBT/Phen, which are responsible for marine and continental, oxidizing and reducing sedimentary conditions, as well as for the contribution of clay and carbonate materials in a source rock, vary the most. On the other hand, the sedimentary condition parameters t24/t23, H35S/H34S и dia/(reg + dia)C27 do not vary significantly. Maturity biomarker parameters increase with the elongation of thermal treatment. For Sample B, more significant variations in the parameters t23/H30 and MPI-1 were recorded. Biomarkers were detected in synthetic oils through the first 8 days of the hydrous pyrolysis.
The dynamics of parameter variation with time were studied to investigate the differences between Samples A and B (Figure 10). Parameters Pr/Ph, H29/H30, t23/H30, and MPI-1 change with the same pattern. However, if the values for t23/H30 and MPI-1 are equal for the synthetic oils for the same duration of treatment, parameters Pr/Ph, H29/H30 achieve the same changes at different times. The maximum Pr/Ph ratio was specified in generated HC after 3.5 days of Sample A and 5 days of Sample B hydrous pyrolysis (Figure 10a). The most significant differences were recorded for C27/C29 and DBT/Phen parameters.
The results show that at the first stage of the experiment, almost all biomarker parameters in both samples are approximately equal between samples. The behavior of the Pr/Ph and H29/H30 parameters can be considered the same (Figure 10a,c). In both cases, the parameter values systematically grow to the maximum value, then decrease. The difference for the samples investigated is specified by the time the maximum value was achieved. For synthetic oils from Sample A, this time is 3.5–4 days, whereas 5 days are necessary for HCs in Sample B.
Significant differences have been found for parameters C27/C29 and DBT/Phen, in particular, the ratio of C27/C29 steranes, which shows a difference in the source-rock OM nature. In Sample A, synthetic oils systematically decrease from ca. 3.5 to 1. For Sample B, the values between 3 and 5 were recorded until the 4th day of hydrous pyrolysis. Then, C27/C29 slightly decreases to a value of 2. The DBT/Phen ratio in synthetic oils from Sample A decreases sharply during the first day of treatment, then it remains almost constant. In synthetic oils from Sample B, two maxima of ca. 1.3 and ca. 1.9 upon 1.5 and 3 days of the experiment were found. After the second one, a decrease in values up to ca. 0.4 with a substantially exponential pattern was determined.
For maturity parameters, Figure 10f shows the systematic growth of the MPI-1 parameter in the synthetic oils from both samples. The value of the Ts/(Ts + Tm) parameter increases with the same trend. The value of the t23/H30 parameter coincides during the first 5 days of hydrous pyrolysis (Figure 10, e), while, theoretically, it should stay constant. After day 5, t23 terpan was not detected in the synthetic oils from Sample A, while Sample B shows a sharp increase in t23/H30, attaining 7 after 7.5 days of the experiment.

5. Discussion

Several oil-generation processes in the source rocks’ behaviors were established based on the results of the kerogen transformation laboratory modeling experiment in the semi-open system. The parameters that characterize changes in the kerogen structure and the molecular composition of synthetic oils change differently. Theoretically, the process of the geological evolution of the hydrogen index, which expresses the hydrocarbon group number in the OM structure that can transform into HC, decreases with the kerogen maturity, while the Tmax parameter increases [51]. An increase in the Tmax parameter depends on the kerogen structure strengthening and, thus, on the necessity to apply more energy to release HC. The results of laboratory modeling in the semi-open system agree well with theoretical concepts [36] and other oil-generation experiments performed with a different methodology. In [52], researchers accomplished hydrous pyrolysis in a closed system for 48 h under 300–400 °C on source-rock samples with type II kerogen. Pyrolysis of the heated samples after extraction demonstrated the same changes of HI and Tmax in type II kerogen from different formations during maturation (Figure 11).
In the first stages of kerogen transformation, a significant decrease in HI and a slight increase in Tmax is observed. With an increase in applied energy (in terms of temperature and time of thermal treatment), HI lowers less intensively, and as the value of about 50–100 mg HC/g TOC is achieved, a significant increase in Tmax is found. The results are in good agreement with the pattern of the changes of pyrolytic parameters of BF rocks through maturation measured for samples from various wells [36]. Thus, hydrous pyrolysis experiments in a semi-open and closed systems can simulate kerogen transformation during geological evolution in situ.
The differences in kerogen pyrolysis parameters through the laboratory modeling of Samples A and B establish that the processes are not identical. In Sample A, HI decreases by ca. 1.5 times after 12 h, while in Sample B, the parameter decreases only by 50% after 24 h, and 36 h is enough to reach values less than 200 mg HC/g TOC. On the contrary, in Sample A, the decrease in HI is greater. It can be assumed that kerogen in Samples A and B differs in chemical structure, so different amounts of energy are necessary to break bonds and release HC, and the amount of these HC differs due to the applied energy.
The assumption above is confirmed by the yield of synthetic oils. Figure 3 shows that for Sample A, the maximum yield was produced after 12 h, whereas for Sample B, there are several generation steps that result in the maximum yields after 1.5 and 3.5 days of thermal treatment.
The assumption that kerogen in Samples A and B has different chemical structures and transforms via various pathways can be confirmed by the composition of the generated synthetic oils. Figure 5 and Figure 6 show that the proportion of normal alkanes in Samples A and B oils differs and varies significantly through the experiment. In the initial stages, a fairly broad distribution of compounds with different chain lengths was observed. After 3 days of treatment, n-alkane C19 becomes predominant in synthetic oils from Sample A, and for Sample B oils, the double maximum concentration of C19 and C21 was detected after 4.5 days. The termination of n-alkane generation was found after 5 days for Sample A and after 8 days for Sample B. A decrease in the short-chain n-alkane concentration and the presence of a large number of isoprenoids may indicate that at the final stages of kerogen evolution, its structure contains almost no saturated straight-chain HC groups, compounds with complicated presumably aromatic structure are formed, and the process might require high amount of energy applied with a low HC yield. As the yields at these stages lower significantly, the detected change in the synthetic oil composition would not be observed in experiments in a closed system [25].
A common feature in the n-alkane composition was observed for both samples. With an increase in the experiment time, a secondary maximum with C26 predominance was detected. Its evolution at a certain stage of hydrous pyrolysis indicates changes in kerogen structure. Either new HC radicals become available for cracking after releasing some amounts of synthetic oils, or kerogen structure realignment occurs. Another possible reason is that there are different kerogen macerals in the samples with various chemical structures. Investigations of BF OM maceral composition and their transformation under hydrous pyrolysis show that bioclasts and macerals formed from higher plants or animal organisms remain, entering the oil generation process under higher activation energies [38]. It can be assumed that the studied samples also contain such macerals, which, after 2.5 days for Sample A and 5 days for Sample B, begin to generate hydrocarbons. The difference in the generation initiation time may indicate that the structure of macerals might vary. This confirms the previously mentioned idea that the composition and structure of kerogen in these two samples investigated is different. The variation of the C27/C29 diasterans ratio confirms a difference in kerogen nature. Diasterans C27, C28, and C29 show the contribution of various components in the parent OM composition, such as higher plants, algae, phytoplankton, etc. [53]. In fact, these parameters confirm the initial difference in kerogen chemical structures found by other indirect signs.
The maturity biomarker parameters in synthetic oils show a gradual increase with the experimental duration. Such an increase does not correspond to a sharp and significant increase in the kerogen maturation according to pyrolysis data. Meanwhile, the results are in good agreement with the other kerogen maturation laboratory modeling results [49,54]. On the other hand, the composition of generated fluids is close to the natural ones [55]. Thus, if increased heat flow affects source rocks (within hydrothermal processes, seals, and intrusions), biomarker analysis results of maturity estimation could be inaccurate. Maturity biomarker parameter values might be lower as the isomerization processes proceed slower or are absent under high temperatures and pressures through hydrous pyrolysis [56,57,58,59,60]. Thus, kerogen maturity is better assessed by pyrolysis after extraction, which is in good agreement with in situ processes.
For some of the synthetic-oil biomarker parameters, the patterns with time are different from the trends established on well samples. The most significant difference was determined by the parameters that determine sedimentary conditions and the lithological composition of rocks. Ulmishek showed that the investigated rocks are accumulated in the same marine conditions at a large distance of ca. 200 km from the shoreline, which is confirmed by the trace amount of terrigenous material [61]. The mineral composition of the rocks is similar. Thus, the environmental conditions of the biomarker parameters should be the same and stay constant throughout the kerogen evolution [49]. The sedimentation conditions and rocks’ lithological composition parameters t24/t23, H35S/H34S, and dia/(reg + dia)C27 change insignificantly. However, other parameters (t23/H30, DBT/Phen) stay almost constant in the synthetic oils from Sample A, first increased, and then decreased in Sample B oils. The kerogen structure changes during hydrous pyrolysis caused by either HC release or the embedding into kerogen of both asphaltenes [52] and individual compounds, such as diasterans [62], might be the source of parameter variation. In addition, if diasterans embed the kerogen structure, their ratio changes during hydrous pyrolysis, and the corresponding biomarker parameters shift.
The catalytic effect of minerals on kerogen cracking might be another reason for the biomarker parameter variation. Individual minerals and kerogen are collocated in the rocks not uniformly, and through the kerogen transformation process, some minerals might get in contact with OM and stimulate or inhibit its transformation and different biomarker generation. This effect was illustrated dramatically in [40], where researchers added various minerals to the isolated kerogen and evaluated the released HC composition change through pyro-GC–MS. Their paper demonstrates a significant change in the generated HC composition depending on the added mineral.
Another parameter that varies in the synthetic oils released at different times is Pr/Ph. The parameter characterizes continental oxidative sedimentation conditions at Pr/Ph > 3 and marine reducing conditions at Pr/Ph < 1 values. The onset value of the parameter is ca. 1, which corresponds to relatively deep-sea sedimentation conditions that are consistent with the literature and the lithological description [32]. The maximum values achieved during hydrous pyrolysis are 2.8 in the synthetic oils from Sample A and >5 in Sample B HC. Such variations cannot be defined by the kerogen sedimentary conditions’ metamorphosis and are likely caused by the thermal influence on the composition of normal alkanes and their isomers.
Some variation in the maturity, sedimentation conditions, and lithological composition of rocks biomarker parameters between synthetic oils and natural fluids caused by the differences in the laboratory modelling and natural processes conditions is described in [27,28,49,63]. Meanwhile, other investigations show a similar composition of rock HC and synthetic oils [21,50].
Thus, the described processes might affect the kerogen structure and synthetic oils’ composition variation at different levels. The assumption that different maceral compositions affect the process most significantly might prevail. Meanwhile, the lack of information and methods to determine and construct kerogen structure did not allow us to investigate the process and role of various factors, such as the rock matrix catalytic or inhibitor role and the effect of experimental conditions. Combination of different optical and spectrometry methods might provide more data for the future prediction of in situ HC generation under different conditions and with the application of various technologies.

6. Conclusions

According to the results of the investigation, several conclusions on the process of OM transformation and hydrocarbon generation can be drawn. The hydrous pyrolysis in a semi-open system provides data for kerogen transformation and the dynamic pattern of oil and gas generation. (i) Step-by-step kerogen transformation was performed, and the pyrolysis parameters’ change through the experiment correspond to the trend determined for type II kerogen transformation in situ for the BF and other source rocks. The dynamic pattern draws indirect conclusions about the similarities and differences in the kerogen cracking in the two investigated samples. The time necessary to achieve the same maturity stage and differences in HI and Tmax parameter values under the same conditions of thermal treatment suggest that the kerogen structure in the samples varies. (ii) The composition of synthetic oils differs depending on hydrous pyrolysis duration. Diversity in oils from two samples was also found. As the sedimentary conditions are similar for both samples, variations in the n-alkane distribution over the experiment duration and between the samples and changes in the C27/C29 and Pr/Ph parameter suggest differences in kerogen structure. (iii) The variation in oil generation within two similar samples could be specified by the maceral composition of OM. Some researchers also report that the mineral matrix can affect the process of kerogen transformation, as some minerals could function as catalysts or inhibitors. Other authors suggest that kerogen rearrangement and embedding some HC compounds into the kerogen structure could take place through hydrous pyrolysis. The investigation methods for the characteristics affecting organic matter cracking should be improved, and a combination of optical and mass spectrometry methods should be used in different stages of hydrous pyrolysis in a semi-open system to detect all the processes in the system.

Supplementary Materials

The following supporting information can be downloaded at: https://www.mdpi.com/article/10.3390/fuels6020022/s1, Table S1: Pyrolysis results after the extraction of Sample A; Table S2: Pyrolysis results after the extraction of Sample B; Table S3: Amount of released malthenes in synthetic oils obtained from Samples A and B; Table S4: The relative distribution of n-alkanes in synthetic oil from Sample A in different stages of the experiment; Table S5: The relative distribution of n-alkanes in synthetic oil from Sample B in different stages of the experiment; Table S6: Values of biomarker parameters for Sample A; Table S7: Values of biomarker parameters for Sample B; Figure S1: Mass fragmentograms of phenanthrene, dibenzothiophene, and methylphenanthrenes: the duration of hydrous pyrolysis is 0.5 days; Figure S2: Mass fragmentograms of phenanthrene, dibenzothiophene, and methylphenanthrenes: the duration of hydrous pyrolysis is 1.0 day; Figure S3: Mass fragmentograms of phenanthrene, dibenzothiophene, and methylphenanthrenes: the duration of hydrous pyrolysis is 1.5 days; Figure S4: Mass fragmentograms of phenanthrene, dibenzothiophene, and methylphenanthrenes: the duration of hydrous pyrolysis is 2.0 days; Figure S5: Mass fragmentograms of phenanthrene, dibenzothiophene, and methylphenanthrenes: the duration of hydrous pyrolysis is 2.5 days; Figure S6: Mass fragmentograms of phenanthrene, dibenzothiophene, and methylphenanthrenes: the duration of hydrous pyrolysis is 3.0 days; Figure S7: Mass fragmentograms of phenanthrene, dibenzothiophene, and methylphenanthrenes: the duration of hydrous pyrolysis is 3.5 days; Figure S8: Mass fragmentograms of phenanthrene, dibenzothiophene, and methylphenanthrenes: the duration of hydrous pyrolysis is 4.0 days; Figure S9: Mass fragmentograms of phenanthrene, dibenzothiophene, and methylphenanthrenes: the duration of hydrous pyrolysis is 4.5 days; Figure S10: Mass fragmentograms of phenanthrene, dibenzothiophene, and methylphenanthrenes: the duration of hydrous pyrolysis is 5.0 days; Figure S11: Mass fragmentograms of phenanthrene, dibenzothiophene, and methylphenanthrenes: the duration of hydrous pyrolysis is 5.5 days; Figure S12: Mass fragmentograms of phenanthrene, dibenzothiophene, and methylphenanthrenes: the duration of hydrous pyrolysis is 6.0 days; Figure S13: Mass fragmentograms of phenanthrene, dibenzothiophene, and methylphenanthrenes: the duration of hydrous pyrolysis is 6.5 days; Figure S14: Mass fragmentograms of phenanthrene, dibenzothiophene, and methylphenanthrenes: the duration of hydrous pyrolysis is 7.0 days; Figure S15: Mass fragmentograms of phenanthrene, dibenzothiophene, and methylphenanthrenes: the duration of hydrous pyrolysis is 7.5 days; Figure S16: Mass fragmentograms of phenanthrene, dibenzothiophene, and methylphenanthrenes: the duration of hydrous pyrolysis is 8.0 days; Figure S17: Mass fragmentograms of phenanthrene, dibenzothiophene, and methylphenanthrenes: the duration of hydrous pyrolysis is 8.5 days; Figure S18: Mass fragmentograms of phenanthrene, dibenzothiophene, and methylphenanthrenes: the duration of hydrous pyrolysis is 9.0 days; Figure S19: Mass fragmentograms of phenanthrene, dibenzothiophene, and methylphenanthrenes: the duration of hydrous pyrolysis is 9.5 days; Figure S20: Mass fragmentograms of phenanthrene, dibenzothiophene, and methylphenanthrenes: the duration of hydrous pyrolysis is 10.0 days; Sample B; Mass fragmentograms of phenanthrene (Phen, m/z 178), dibenzothiophene (DBT, m/z 184) and methylphenanthrenes (MPs, m/z 192); Figure S21: Mass fragmentograms of phenanthrene, dibenzothiophene, and methylphenanthrenes: the duration of hydrous pyrolysis is 0.5 days; Figure S22: Mass fragmentograms of phenanthrene, dibenzothiophene, and methylphenanthrenes: the duration of hydrous pyrolysis is 1.0 day; Figure S23: Mass fragmentograms of phenanthrene, dibenzothiophene, and methylphenanthrenes: the duration of hydrous pyrolysis is 1.5 days; Figure S24: Mass fragmentograms of phenanthrene, dibenzothiophene, and methylphenanthrenes: the duration of hydrous pyrolysis is 2.0 days; Figure S25: Mass fragmentograms of phenanthrene, dibenzothiophene, and methylphenanthrenes: the duration of hydrous pyrolysis is 2.5 days; Figure S26: Mass fragmentograms of phenanthrene, dibenzothiophene, and methylphenanthrenes: the duration of hydrous pyrolysis is 3.0 days; Figure S27: Mass fragmentograms of phenanthrene, dibenzothiophene, and methylphenanthrenes: the duration of hydrous pyrolysis is 3.5 days; Figure S28: Mass fragmentograms of phenanthrene, dibenzothiophene, and methylphenanthrenes: the duration of hydrous pyrolysis is 4.0 days; Figure S29: Mass fragmentograms of phenanthrene, dibenzothiophene, and methylphenanthrenes: the duration of hydrous pyrolysis is 4.5 days; Figure S30: Mass fragmentograms of phenanthrene, dibenzothiophene, and methylphenanthrenes: the duration of hydrous pyrolysis is 5.0 days; Figure S31: Mass fragmentograms of phenanthrene, dibenzothiophene, and methylphenanthrenes: the duration of hydrous pyrolysis is 5.5 days; Figure S32: Mass fragmentograms of phenanthrene, dibenzothiophene, and methylphenanthrenes: the duration of hydrous pyrolysis is 6.0 days; Figure S33: Mass fragmentograms of phenanthrene, dibenzothiophene, and methylphenanthrenes: the duration of hydrous pyrolysis is 6.5 days; Figure S34: Mass fragmentograms of phenanthrene, dibenzothiophene, and methylphenanthrenes: the duration of hydrous pyrolysis is 7.0 days; Figure S35: Mass fragmentograms of phenanthrene, dibenzothiophene, and methylphenanthrenes: the duration of hydrous pyrolysis is 7.5 days; Figure S36: Mass fragmentograms of phenanthrene, dibenzothiophene, and methylphenanthrenes: the duration of hydrous pyrolysis is 8.0 days; Figure S37: Mass fragmentograms of phenanthrene, dibenzothiophene, and methylphenanthrenes: the duration of hydrous pyrolysis is 8.5 days; Figure S38: Mass fragmentograms of phenanthrene, dibenzothiophene, and methylphenanthrenes: the duration of hydrous pyrolysis is 9.0 days; Figure S39: Mass fragmentograms of phenanthrene, dibenzothiophene, and methylphenanthrenes: the duration of hydrous pyrolysis is 9.5 days; Figure S40: Mass fragmentograms of phenanthrene, dibenzothiophene, and methylphenanthrenes: the duration of hydrous pyrolysis is 10.0 days; Figure S41: Mass fragmentograms of phenanthrene, dibenzothiophene, and methylphenanthrenes: the duration of hydrous pyrolysis is 10.5 days; Figure S42: Mass fragmentograms of phenanthrene, dibenzothiophene, and methylphenanthrenes: the duration of hydrous pyrolysis is 11.0 days; Figure S43: Mass fragmentograms of phenanthrene, dibenzothiophene, and methylphenanthrenes: the duration of hydrous pyrolysis is 11.5 days; Figure S44: Mass fragmentograms of phenanthrene, dibenzothiophene, and methylphenanthrenes: the duration of hydrous pyrolysis is 12.0 days; Figure S45: Mass fragmentograms of phenanthrene, dibenzothiophene, and methylphenanthrenes: the duration of hydrous pyrolysis is 12.5 days; Sample A; Mass fragmentograms of alkanes (m/z 71); Figure S46: Mass fragmentograms of alkanes: the duration of hydrous pyrolysis is 0.5 days; Figure S47: Mass fragmentograms of alkanes: the duration of hydrous pyrolysis is 1.0 day; Figure S48: Mass fragmentograms of alkanes: the duration of hydrous pyrolysis is 1.5 days; Figure S49: Mass fragmentograms of alkanes: the duration of hydrous pyrolysis is 2.0 days; Figure S50: Mass fragmentograms of alkanes: the duration of hydrous pyrolysis is 2.5 days; Figure S51: Mass fragmentograms of alkanes: the duration of hydrous pyrolysis is 3.0 days; Figure S52: Mass fragmentograms of alkanes: the duration of hydrous pyrolysis is 3.5 days; Figure S53: Mass fragmentograms of alkanes: the duration of hydrous pyrolysis is 4.0 days; Figure S54: Mass fragmentograms of alkanes: the duration of hydrous pyrolysis is 4.5 days; Figure S55: Mass fragmentograms of alkanes: the duration of hydrous pyrolysis is 5.0 days; Figure S56: Mass fragmentograms of alkanes: the duration of hydrous pyrolysis is 5.5 days; Figure S57: Mass fragmentograms of alkanes: the duration of hydrous pyrolysis is 6.0 days; Figure S58: Mass fragmentograms of alkanes: the duration of hydrous pyrolysis is 6.5 days; Figure S59: Mass fragmentograms of alkanes: the duration of hydrous pyrolysis is 7.0 days; Figure S60: Mass fragmentograms of alkanes: the duration of hydrous pyrolysis is 7.5 days; Figure S61: Mass fragmentograms of alkanes: the duration of hydrous pyrolysis is 8.0 days; Figure S62: Mass fragmentograms of alkanes: the duration of hydrous pyrolysis is 8.5 days; Figure S63: Mass fragmentograms of alkanes: the duration of hydrous pyrolysis is 9.0 days; Figure S64: Mass fragmentograms of alkanes: the duration of hydrous pyrolysis is 9.5 days; Figure S65: Mass fragmentograms of alkanes: the duration of hydrous pyrolysis is 10.0 days; Figure S66: Mass fragmentograms of alkanes: the duration of hydrous pyrolysis is 0.5 days; Figure S67: Mass fragmentograms of alkanes: the duration of hydrous pyrolysis is 1.0 day; Figure S68: Mass fragmentograms of alkanes: the duration of hydrous pyrolysis is 1.5 days; Figure S69: Mass fragmentograms of alkanes: the duration of hydrous pyrolysis is 2.0 days; Figure S70: Mass fragmentograms of alkanes: the duration of hydrous pyrolysis is 2.5 days; Figure S71: Mass fragmentograms of alkanes: the duration of hydrous pyrolysis is 3.0 days; Figure S72: Mass fragmentograms of alkanes: the duration of hydrous pyrolysis is 3.5 days; Figure S73: Mass fragmentograms of alkanes: the duration of hydrous pyrolysis is 4.0 days; Figure S74: Mass fragmentograms of alkanes: the duration of hydrous pyrolysis is 4.5 days; Figure S75: Mass fragmentograms of alkanes: the duration of hydrous pyrolysis is 5.0 days; Figure S76: Mass fragmentograms of alkanes: the duration of hydrous pyrolysis is 5.5 days; Figure S77: Mass fragmentograms of alkanes: the duration of hydrous pyrolysis is 6.0 days; Figure S78: Mass fragmentograms of alkanes: the duration of hydrous pyrolysis is 6.5 days; Figure S79: Mass fragmentograms of alkanes: the duration of hydrous pyrolysis is 7.0 days; Figure S80: Mass fragmentograms of alkanes: the duration of hydrous pyrolysis is 7.5 days; Figure S81: Mass fragmentograms of alkanes: the duration of hydrous pyrolysis is 8.0 days; Figure S82: Mass fragmentograms of alkanes: the duration of hydrous pyrolysis is 8.5 days; Figure S83: Mass fragmentograms of alkanes: the duration of hydrous pyrolysis is 9.0 days; Figure S84: Mass fragmentograms of alkanes: the duration of hydrous pyrolysis is 9.5 days; Figure S85: Mass fragmentograms of alkanes: the duration of hydrous pyrolysis is 10.0 days; Figure S86: Mass fragmentograms of alkanes: the duration of hydrous pyrolysis is 10.5 days; Figure S87: Mass fragmentograms of alkanes: the duration of hydrous pyrolysis is 11.0 days; Figure S88: Mass fragmentograms of alkanes: the duration of hydrous pyrolysis is 11.5 days; Figure S89: Mass fragmentograms of alkanes: the duration of hydrous pyrolysis is 12.0 days; Figure S90: Mass fragmentograms of alkanes: the duration of hydrous pyrolysis is 12.5 days; Sample A; Mass fragmentograms of terpanes (m/z 191); Figure S91: Mass fragmentograms of terpanes: the duration of hydrous pyrolysis is 0.5 days; Figure S92: Mass fragmentograms of terpanes: the duration of hydrous pyrolysis is 1.0 day; Figure S93: Mass fragmentograms of terpanes: the duration of hydrous pyrolysis is 1.5 days; Figure S94: Mass fragmentograms of terpanes: the duration of hydrous pyrolysis is 2.0 days; Figure S95: Mass fragmentograms of terpanes: the duration of hydrous pyrolysis is 2.5 days; Figure S96: Mass fragmentograms of terpanes: the duration of hydrous pyrolysis is 3.0 days; Figure S97: Mass fragmentograms of terpanes: the duration of hydrous pyrolysis is 3.5 days; Figure S98: Mass fragmentograms of terpanes: the duration of hydrous pyrolysis is 4.0 days; Figure S99: Mass fragmentograms of terpanes: the duration of hydrous pyrolysis is 4.5 days; Figure S100: Mass fragmentograms of terpanes: the duration of hydrous pyrolysis is 5.0 days; Figure S101: Mass fragmentograms of terpanes: the duration of hydrous pyrolysis is 5.5 days; Figure S102: Mass fragmentograms of terpanes: the duration of hydrous pyrolysis is 6.0 days; Figure S103: Mass fragmentograms of terpanes: the duration of hydrous pyrolysis is 6.5 days; Figure S104: Mass fragmentograms of terpanes: the duration of hydrous pyrolysis is 7.0 days; Figure S105: Mass fragmentograms of terpanes: the duration of hydrous pyrolysis is 7.5 days; Figure S106: Mass fragmentograms of terpanes: the duration of hydrous pyrolysis is 8.0 days; Figure S107: Mass fragmentograms of terpanes: the duration of hydrous pyrolysis is 8.5 days; Figure S108: Mass fragmentograms of terpanes: the duration of hydrous pyrolysis is 9.0 days; Figure S109: Mass fragmentograms of terpanes: the duration of hydrous pyrolysis is 9.5 days; Figure S110: Mass fragmentograms of terpanes: the duration of hydrous pyrolysis is 10.0 days; Sample B; Mass fragmentograms of terpanes (m/z 191); Figure S111: Mass fragmentograms of terpanes: the duration of hydrous pyrolysis is 0.5 days; Figure S112: Mass fragmentograms of terpanes: the duration of hydrous pyrolysis is 1.0 day; Figure S113: Mass fragmentograms of terpanes: the duration of hydrous pyrolysis is 1.5 days; Figure S114: Mass fragmentograms of terpanes: the duration of hydrous pyrolysis is 2.0 days; Figure S115: Mass fragmentograms of terpanes: the duration of hydrous pyrolysis is 2.5 days; Figure S116: Mass fragmentograms of terpanes: the duration of hydrous pyrolysis is 3.0 days; Figure S117: Mass fragmentograms of terpanes: the duration of hydrous pyrolysis is 3.5 days; Figure S118: Mass fragmentograms of terpanes: the duration of hydrous pyrolysis is 4.0 days; Figure S119: Mass fragmentograms of terpanes: the duration of hydrous pyrolysis is 4.5 days; Figure S120: Mass fragmentograms of terpanes: the duration of hydrous pyrolysis is 5.0 days; Figure S121: Mass fragmentograms of terpanes: the duration of hydrous pyrolysis is 5.5 days; Figure S122: Mass fragmentograms of terpanes: the duration of hydrous pyrolysis is 6.0 days; Figure S123: Mass fragmentograms of terpanes: the duration of hydrous pyrolysis is 6.5 days; Figure S124: Mass fragmentograms of terpanes: the duration of hydrous pyrolysis is 7.0 days; Figure S125: Mass fragmentograms of terpanes: the duration of hydrous pyrolysis is 7.5 days; Figure S126: Mass fragmentograms of terpanes: the duration of hydrous pyrolysis is 8.0 days; Figure S127: Mass fragmentograms of terpanes: the duration of hydrous pyrolysis is 8.5 days; Figure S128: Mass fragmentograms of terpanes: the duration of hydrous pyrolysis is 9.0 days; Figure S129: Mass fragmentograms of terpanes: the duration of hydrous pyrolysis is 9.5 days; Figure S130: Mass fragmentograms of terpanes: the duration of hydrous pyrolysis is 10.0 days; Figure S131: Mass fragmentograms of terpanes: the duration of hydrous pyrolysis is 10.5 days; Figure S132: Mass fragmentograms of terpanes: the duration of hydrous pyrolysis is 11.0 days; Figure S133: Mass fragmentograms of terpanes: the duration of hydrous pyrolysis is 11.5 days; Figure S134: Mass fragmentograms of terpanes: the duration of hydrous pyrolysis is 12.0 days; Figure S135: Mass fragmentograms of terpanes: the duration of hydrous pyrolysis is 12.5 days; Sample A; Mass fragmentograms of steranes (m/z 217); Figure S136: Mass fragmentograms of steranes: the duration of hydrous pyrolysis is 0.5 days; Figure S137: Mass fragmentograms of steranes: the duration of hydrous pyrolysis is 1.0 day; Figure S138: Mass fragmentograms of steranes: the duration of hydrous pyrolysis is 1.5 days; Figure S139: Mass fragmentograms of steranes: the duration of hydrous pyrolysis is 2.0 days; Figure S140: Mass fragmentograms of steranes: the duration of hydrous pyrolysis is 2.5 days; Figure S141: Mass fragmentograms of steranes: the duration of hydrous pyrolysis is 3.0 days; Figure S142: Mass fragmentograms of steranes: the duration of hydrous pyrolysis is 3.5 days; Figure S143: Mass fragmentograms of steranes: the duration of hydrous pyrolysis is 4.0 days; Figure S144: Mass fragmentograms of steranes: the duration of hydrous pyrolysis is 4.5 days; Figure S145: Mass fragmentograms of steranes: the duration of hydrous pyrolysis is 5.0 days; Figure S146: Mass fragmentograms of steranes: the duration of hydrous pyrolysis is 5.5 days; Figure S147: Mass fragmentograms of steranes: the duration of hydrous pyrolysis is 6.0 days; Figure S148: Mass fragmentograms of steranes: the duration of hydrous pyrolysis is 6.5 days; Figure S149: Mass fragmentograms of steranes: the duration of hydrous pyrolysis is 7.0 days; Figure S150: Mass fragmentograms of steranes: the duration of hydrous pyrolysis is 7.5 days; Figure S151: Mass fragmentograms of steranes: the duration of hydrous pyrolysis is 8.0 days; Figure S152: Mass fragmentograms of steranes: the duration of hydrous pyrolysis is 8.5 days; Figure S153: Mass fragmentograms of steranes: the duration of hydrous pyrolysis is 9.0 days; Figure S154: Mass fragmentograms of steranes: the duration of hydrous pyrolysis is 9.5 days; Figure S155: Mass fragmentograms of steranes: the duration of hydrous pyrolysis is 10.0 days; Sample B; Mass fragmentograms of steranes (m/z 217); Figure S156: Mass fragmentograms of steranes: the duration of hydrous pyrolysis is 0.5 days; Figure S157: Mass fragmentograms of steranes: the duration of hydrous pyrolysis is 1.0 day; Figure S158: Mass fragmentograms of steranes: the duration of hydrous pyrolysis is 1.5 days; Figure S159: Mass fragmentograms of steranes: the duration of hydrous pyrolysis is 2.0 days; Figure S160: Mass fragmentograms of steranes: the duration of hydrous pyrolysis is 2.5 days; Figure S161: Mass fragmentograms of steranes: the duration of hydrous pyrolysis is 3.0 days; Figure S162: Mass fragmentograms of steranes: the duration of hydrous pyrolysis is 3.5 days; Figure S163: Mass fragmentograms of steranes: the duration of hydrous pyrolysis is 4.0 days; Figure S164: Mass fragmentograms of steranes: the duration of hydrous pyrolysis is 4.5 days; Figure S165: Mass fragmentograms of steranes: the duration of hydrous pyrolysis is 5.0 days; Figure S166: Mass fragmentograms of steranes: the duration of hydrous pyrolysis is 5.5 days; Figure S167: Mass fragmentograms of steranes: the duration of hydrous pyrolysis is 6.0 days; Figure S168: Mass fragmentograms of steranes: the duration of hydrous pyrolysis is 6.5 days; Figure S169: Mass fragmentograms of steranes: the duration of hydrous pyrolysis is 7.0 days; Figure S170: Mass fragmentograms of steranes: the duration of hydrous pyrolysis is 7.5 days; Figure S171: Mass fragmentograms of steranes: the duration of hydrous pyrolysis is 8.0 days; Figure S172: Mass fragmentograms of steranes: the duration of hydrous pyrolysis is 8.5 days; Figure S173: Mass fragmentograms of steranes: the duration of hydrous pyrolysis is 9.0 days; Figure S174: Mass fragmentograms of steranes: the duration of hydrous pyrolysis is 9.5 days; Figure S175: Mass fragmentograms of steranes: the duration of hydrous pyrolysis is 10.0 days; Figure S176: Mass fragmentograms of steranes: the duration of hydrous pyrolysis is 10.5 days; Figure S177: Mass fragmentograms of steranes: the duration of hydrous pyrolysis is 11.0 days; Figure S178: Mass fragmentograms of steranes: the duration of hydrous pyrolysis is 11.5 days; Figure S179: Mass fragmentograms of steranes: the duration of hydrous pyrolysis is 12.0 days; Figure S180: Mass fragmentograms of steranes: the duration of hydrous pyrolysis is 12.5 days.

Author Contributions

Conceptualization, A.G.K., V.V.L., M.S.T., D.S.V. and A.V.P.; methodology, G.G.S. and A.G.K.; software, V.V.L., O.N.V. and M.L.M.; validation, A.G.K., D.S.V., A.V.P., M.A.P. and G.A.K.; formal analysis, G.G.S., O.N.V. and M.L.M.; investigation, V.V.L., G.G.S., M.S.T. and O.N.V.; resources, A.G.K.; data curation, V.V.L.; writing—original draft preparation, A.G.K., V.V.L., M.S.T. and M.L.M.; writing—review and editing, D.S.V., A.V.P., M.A.P. and G.A.K.; visualization, V.V.L., M.S.T. and M.L.M.; supervision, A.G.K. and G.A.K.; project administration, G.G.S.; funding acquisition, M.A.P. All authors have read and agreed to the published version of the manuscript.

Funding

This work was supported by the Russian Science Foundation, project 24-13-00197.

Data Availability Statement

The original contributions presented in this study are included in the article/Supplementary Materials. Further inquiries can be directed at the corresponding author.

Acknowledgments

This study was carried out using the equipment of the Central Collective Use Center of Moscow State University “Technologies for Obtaining New Nanostructured Materials and Their Comprehensive Study”, acquired by Moscow State University under the program for updating the instrumentation base within the framework of the national project “Science” and the Development Program of Moscow State University. The authors would like to appreciate Yulia A. Kotochkova and Tatiana V. Grigorenko for their contribution to this article’s improvement.

Conflicts of Interest

The authors declare no conflicts of interest.

References

  1. Durand, B. Kerogen: Insoluble Organic Matter from Sedimentary Rocks; Editions Technip: Paris, France, 1980. [Google Scholar]
  2. Tegelaar, E.W.; de Leeuw, J.W.; Derenne, S.; Largeau, C. A reappraisal of kerogen formation. Geochim. Cosmochim. Acta 1989, 53, 3103–3106. [Google Scholar] [CrossRef]
  3. Hutton, A.; Bharati, S.; Robl, T. Chemical and Petrographic Classification of Kerogen/Macerals. Energy Fuels 1994, 8, 1478–1488. [Google Scholar] [CrossRef]
  4. Peters, K.; Walters, C.; Mankiewicz, P. Evaluation of kinetic uncertainty in numerical models of petroleum generation. AAPG Bull. 2006, 90, 387–403. [Google Scholar] [CrossRef]
  5. McFarlane, R.A.; Gentzis, T.; Goodarzi, F.; Hanna, J.V.; Vassallo, A.M. Evolution of the chemical structure of Hat Creek resinite during oxidation: A combined FT-IR photoacoustic, NMR and optical microscopic study. Int. J. Coal Geol. 1993, 22, 119–147. [Google Scholar] [CrossRef]
  6. Wang, Q.; Ye, J.-B.; Yang, H.-Y.; Liu, Q. Chemical Composition and Structural Characteristics of Oil Shales and Their Kerogens Using Fourier Transform Infrared (FTIR) Spectroscopy and Solid-State 13C Nuclear Magnetic Resonance (NMR). Energy Fuels 2016, 30, 6271–6280. [Google Scholar] [CrossRef]
  7. Panattoni, F.; Mitchell, J.; Fordham, E.J.; Kausik, R.; Grey, C.P.; Magusin, P.C.M.M. Combined High-Resolution Solid-State 1H/13C NMR Spectroscopy and 1H NMR Relaxometry for the Characterization of Kerogen Thermal Maturation. Energy Fuels 2021, 35, 1070–1079. [Google Scholar] [CrossRef]
  8. He, X.; Liu, X.; Nie, B.; Song, D. FTIR and Raman spectroscopy characterization of functional groups in various rank coals. Fuel 2017, 206, 555–563. [Google Scholar] [CrossRef]
  9. Behar, F.; Vandenbroucke, M. Chemical modelling of kerogens. Org. Geochem. 1987, 11, 15–24. [Google Scholar] [CrossRef]
  10. Liang, T.; Zou, Y.-R.; Zhan, Z.-W.; Lin, X.-H.; Shi, J.; Peng, P. An evaluation of kerogen molecular structures during artificial maturation. Fuel 2020, 265, 116979. [Google Scholar] [CrossRef]
  11. Liu, Y.; Liu, S.; Zhang, R.; Zhang, Y. The molecular model of Marcellus shale kerogen: Experimental characterization and structure reconstruction. Int. J. Coal Geol. 2020, 246, 103833. [Google Scholar] [CrossRef]
  12. Siskin, M.; Scouten, C.G.; Rose, K.D.; Aczel, T.; Colgrove, S.G.; Pabst, R.E. Detailed Structural Characterization of the Organic Material in Rundle Ramsay Crossing and Green River Oil Shales. In Composition, Geochemistry and Conversion of Oil Shales; Kluwer Academic Publishers: New York, UK, 1995; pp. 143–158. [Google Scholar] [CrossRef]
  13. Vandenbroucke, M.; Largeau, C. Kerogen origin, evolution and structure. Org. Geochem. 2007, 38, 719–833. [Google Scholar] [CrossRef]
  14. Hantschel, T.; Kauerauf, A. Fundamentals of Basin and Petroleum System Modeling; Springer Science & Business Media: Berlin, Germany, 2009. [Google Scholar]
  15. Behar, F.; Beaumont, V.D.E.B.; Penteado, H.L.D.B. Rock-Eval 6 Technology: Performances and Developments. Oil Gas Sci. Technol. 2001, 56, 111–134. [Google Scholar] [CrossRef]
  16. Burnham, A.K. Pyrolysis in Open Systems. In Global Chemical Kinetics of Fossil Fuels: How to Model Maturation and Pyrolysis; Springer International Publishing: Cham, Switzerland, 2017; pp. 107–169. [Google Scholar]
  17. Lewan, M.D. Laboratory Simulation of Petroleum Formation. In Organic Geochemistry: Principles and Applications; Engel, M.H., Macko, S.A., Eds.; Springer: Boston, MA, USA, 1993; pp. 419–442. [Google Scholar]
  18. Horsfield, B.; Disko, U.; Leistner, F. The micro-scale simulation of maturation: Outline of a new technique and its potential applications. Geol. Rundsch. 1989, 78, 361–373. [Google Scholar] [CrossRef]
  19. Behar, F.; Kressmann, S.; Rudkiewicz, J.L.; Vandenbroucke, M. Experimental simulation in a confined system and kinetic modelling of kerogen and oil cracking. Org. Geochem. 1992, 19, 173–189. [Google Scholar] [CrossRef]
  20. Wu, Y.; Ji, L.; He, C.; Zhang, Z.; Zhang, M.; Sun, L.; Su, L.; Xia, Y. The effects of pressure and hydrocarbon expulsion on hydrocarbon generation during hydrous pyrolysis of type-I kerogen in source rock. J. Nat. Gas Sci. Eng. 2016, 34, 1215–1224. [Google Scholar] [CrossRef]
  21. Lewan, M.D. Effects of thermal maturation on stable organic carbon isotopes as determined by hydrous pyrolysis of Woodford Shale. Geochim. Cosmochim. Acta 1983, 47, 1471–1479. [Google Scholar] [CrossRef]
  22. Ruble, T.E.; Lewan, M.D.; Philp, R.P. New Insights on the Green River Petroleum System in the Uinta Basin from Hydrous Pyrolysis Experiments. AAPG Bull. 2001, 85, 1333–1371. [Google Scholar] [CrossRef]
  23. Curtis, J.B.; Kotarba, M.J.; Lewan, M.D.; Więcław, D. Oil/source rock correlations in the Polish Flysch Carpathians and Mesozoic basement and organic facies of the Oligocene Menilite Shales: Insights from hydrous pyrolysis experiments. Org. Geochem. 2004, 35, 1573–1596. [Google Scholar] [CrossRef]
  24. Li, R.; Jin, K.; Lehrmann, D.J. Hydrocarbon potential of Pennsylvanian coal in Bohai Gulf Basin, Eastern China, as revealed by hydrous pyrolysis. Int. J. Coal Geol. 2008, 73, 88–97. [Google Scholar] [CrossRef]
  25. Spigolon, A.L.D.; Lewan, M.D.; de Barros Penteado, H.L.; Coutinho, L.F.C.; Mendonça Filho, J.G. Evaluation of the petroleum composition and quality with increasing thermal maturity as simulated by hydrous pyrolysis: A case study using a Brazilian source rock with Type I kerogen. Org. Geochem. 2015, 83–84, 27–53. [Google Scholar] [CrossRef]
  26. Han, H.; Guo, C.; Zhong, N.-N.; Pang, P.; Chen, S.-J.; Lu, J.-G.; Gao, Y. Pore structure evolution of lacustrine shales containing Type I organic matter from the Upper Cretaceous Qingshankou Formation, Songliao Basin, China: A study of artificial samples from hydrous pyrolysis experiments. Mar. Pet. Geol. 2019, 104, 375–388. [Google Scholar] [CrossRef]
  27. Eglinton, T.I.; Douglas, A.G. Quantitative study of biomarker hydrocarbons released from kerogens during hydrous pyrolysis. Energy Fuels 1988, 2, 81–88. [Google Scholar] [CrossRef]
  28. Peters, K.E.; Moldowan, J.M.; Sundararaman, P. Effects of hydrous pyrolysis on biomarker thermal maturity parameters: Monterey Phosphatic and Siliceous members. Org. Geochem. 1990, 15, 249–265. [Google Scholar] [CrossRef]
  29. Michels, R.; Landais, P.; Torkelson, B.E.; Philp, R.P. Effects of effluents and water pressure on oil generation during confined pyrolysis and high-pressure hydrous pyrolysis. Geochim. Cosmochim. Acta 1995, 59, 1589–1604. [Google Scholar] [CrossRef]
  30. Lewan, M.; Henry, A. Gas: Oil Ratios for Source Rocks Containing Type-I, -II, -IIS, and -III Kerogens as Determined by Hydrous Pyrolysis; US Geological Survey: Reston, VA, USA, 1999. [Google Scholar]
  31. Rushdi, A.I.; BaZeyad, A.Y.; Al-Awadi, A.S.; Al-Mutlaq, K.F.; Simoneit, B.R.T. Chemical characteristics of oil-like products from hydrous pyrolysis of scrap tires at temperatures from 150 to 400 °C. Fuel 2013, 107, 578–584. [Google Scholar] [CrossRef]
  32. Kontorovich, A.E.; Yan, P.A.; Zamirailova, A.G.; Kostyreva, E.A.; Eder, V.G. Classification of rocks of the Bazhenov Formation. Russ. Geol. Geophys. 2016, 57, 1606–1612. [Google Scholar] [CrossRef]
  33. Kalmykov, A.G.; Gafurova, D.R.; Tikhonova, M.S.; Vidishcheva, O.N.; Ivanova, D.A.; Man’ko, I.E.; Korost, D.V.; Bychkov, A.Y.; Kalmykov, G.A. The Influence of the Composition of Rocks from High-Carbon Formations on the Process of Oil and Gas Generation: The Results of Laboratory Modeling. Mosc. Univ. Geol. Bull. 2021, 76, 191–203. [Google Scholar] [CrossRef]
  34. Savostin, G.G.; Kalmykov, A.G.; Ivanova, D.A.; Kalmykov, G.A. Experimental data on organic matter maturation investigation in one sample of the Bazhenov shale formations (Western Siberia). Mosc. Univ. Bull. 2023, 78, 805–814. [Google Scholar] [CrossRef]
  35. Kontorovich, A.E.; Bogorodskaya, L.I.; Borisova, L.S.; Burshtein, L.M.; Ismagilov, Z.P.; Efimova, O.S.; Kostyreva, E.A.; Lemina, N.M.; Ryzhkova, S.V.; Sozinov, S.A.; et al. Geochemistry and Catagenetic Transformations of Kerogen from the Bazhenov Horizon. Geochem. Int. 2019, 57, 621–634. [Google Scholar] [CrossRef]
  36. Kozlova, E.V.; Fadeeva, N.P.; Kalmykov, G.A.; Balushkina, N.S.; Pronina, N.V.; Poludetkina, E.N.; Kostenko, O.V.; Yurchenko, A.Y.; Borisov, R.S.; Bychkov, A.Y.; et al. Geochemical technique of organic matter research in deposits enrich in kerogene (the Bazhenov Formation, West Siberia). Mosc. Univ. Geol. Bull. 2015, 70, 409–418. [Google Scholar] [CrossRef]
  37. Leushina, E.; Mikhaylova, P.; Kozlova, E.; Polyakov, V.; Morozov, N.; Spasennykh, M. The effect of organic matter maturity on kinetics and product distribution during kerogen thermal decomposition: The Bazhenov Formation case study. J. Pet. Sci. Eng. 2021, 204, 108751. [Google Scholar] [CrossRef]
  38. Marunova, D.A.; Pronina, N.V.; Kalmykov, A.G.; Ivanova, D.A.; Kalmykov, G.A. Organic matter maturation stages in Tutleim formation rocks depending on maceral composition. Mosc. Univ. Bull. 2021, 1, 86–97. [Google Scholar] [CrossRef]
  39. Lin, R.; Patrick Ritz, G. Studying individual macerals using i.r. microspectrometry, and implications on oil versus gas/condensate proneness and “low-rank” generation. Org. Geochem. 1993, 20, 695–706. [Google Scholar] [CrossRef]
  40. Salter, T.L.; Watson, J.S.; Sephton, M.A. Effects of minerals (phyllosilicates and iron oxides) on the responses of aliphatic hydrocarbon containing kerogens (Type I and Type II) to analytical pyrolysis. J. Anal. Appl. Pyrolysis 2023, 170, 105900. [Google Scholar] [CrossRef]
  41. Bogatyreva, I.Y.; Kotochkova, Y.A.; Balushkina, N.S.; Khotylev, O.V.; Fomina, M.M.; Tyurina, N.A.; Yablonovskiy, B.I.; Kalmykov, G.A. Structural-Facies Typification of Sections of the Bazhenov High-Carbon Formation of the West Siberian Basin. Mosc. Univ. Geol. Bull. 2024, 79, 263–281. [Google Scholar] [CrossRef]
  42. Vishnevskaya, V.S.; Amon, E.O.; Kalmykov, G.A.; Gatovsky, Y.A. Radiolarians and Their Role in the Study of Stratigraphy and Paleogeography of Shale Oil Basins (Based on the Example of the Bazhenovo Formation in Western Siberia and the Arctic). Paleontol. J. 2024, 58, 25–39. [Google Scholar] [CrossRef]
  43. ASTM D2007-19; Standard Test Method for Characteristic Groups in Rubber Extender and Processing Oils and Other Petroleum-Derived Oils by the Clay-Gel Absorption Chromatographic Method. ASTM International: West Conshohocken, PA, USA, 2024. [CrossRef]
  44. Palacas, J.G.; Anders, D.E.; King, J.D. South Florida Basin—A Prime Example of Carbonate Source Rocks of Petroleum. In Petroleum Geochemistry and Source Rock Potential of Carbonate Rocks; Palacas, J.G., Ed.; American Association of Petroleum Geologists: Tulsa, OK, USA, 1984; Volume 18. [Google Scholar]
  45. ten Haven, H.L.; de Leeuw, J.W.; Sinninghe Damsté, J.S.; Schenck, P.A.; Palmer, S.E.; Zumberge, J.E. Application of biological markers in the recognition of palaeohypersaline environments. Geol. Soc. Lond. Spec. Publ. 1988, 40, 123–130. [Google Scholar] [CrossRef]
  46. Czochanska, Z.; Gilbert, T.D.; Philp, R.P.; Sheppard, C.M.; Weston, R.J.; Wood, T.A.; Woolhouse, A.D. Geochemical application of sterane and triterpane biomarkers to a description of oils from the Taranaki Basin in New Zealand. Org. Geochem. 1988, 12, 123–135. [Google Scholar] [CrossRef]
  47. Peters, K.E.; Moldowan, J.M. Effects of source, thermal maturity, and biodegradation on the distribution and isomerization of homohopanes in petroleum. Org. Geochem. 1991, 17, 47–61. [Google Scholar] [CrossRef]
  48. Waples, D.W.; Machihara, T. Biomarkers for Geologists: A Practical Guide to the Application of Steranes and Triterpanes in Petroleum Geology; Cambridge University Press: Cambridge, UK, 2009; Volume 129, p. 793. [Google Scholar]
  49. Peters, K.E.; Walters, C.C.; Moldowan, J.M. The Biomarker Guide: Volume 1: Biomarkers and Isotopes in the Environment and Human History, 2nd ed.; Cambridge University Press: Cambridge, UK, 2004; Volume 1. [Google Scholar]
  50. Peters, K.E.; Walters, C.C.; Moldowan, J.M. The Biomarker Guide: Volume 2: Biomarkers and Isotopes in Petroleum Systems and Earth History, 2nd ed.; Cambridge University Press: Cambridge, UK, 2004; Volume 2. [Google Scholar]
  51. Tissot, B.P.; Welte, D.H. Petroleum Formation and Occurrence; Springer: Berlin/Heidelberg, Germany, 2013. [Google Scholar]
  52. Shao, X.; Pang, X.; Li, M.; Qian, M.; Hu, T.; Li, Z.; Zhang, H.a.; Xu, Y. Hydrocarbon retention in lacustrine shales during thermal maturation: Insights from semi-open system pyrolysis. J. Pet. Sci. Eng. 2020, 184, 106480. [Google Scholar] [CrossRef]
  53. Peters, K.; Clarke, M.E.; Dasgupta, U.; MacCaffrey, M.E.; Lee, C.Y. Recognition of an Infracambrian source rock based on biomarkers in the Baghewala-1 oil, India. AAPG Bull. 1995, 79, 1481–1494. [Google Scholar] [CrossRef]
  54. Lockhart, R.S.; Meredith, W.; Love, G.D.; Snape, C.E. Release of bound aliphatic biomarkers via hydropyrolysis from Type II kerogen at high maturity. Org. Geochem. 2008, 39, 1119–1124. [Google Scholar] [CrossRef]
  55. Lewan, M.; Birdwell, J. Application of Uniaxial Confining-Core Clamp with Hydrous Pyrolysis in Petrophysical and Geochemical Studies of Source Rocks at Various Thermal Maturities. In Proceedings of the SPE/AAPG/SEG Unconventional Resources Technology Conference, Denver, CO, USA, 12–14 August 2013. [Google Scholar]
  56. Arysanto, A.; Burnaz, L.; Zheng, T.; Littke, R. Geochemical and petrographic evaluation of hydrous pyrolysis experiments on core plugs of Lower Toarcian Posidonia Shale: Comparison of artificial and natural thermal maturity series. Int. J. Coal Geol. 2024, 284, 104459. [Google Scholar] [CrossRef]
  57. Mackenzie, A.S.; McKenzie, D. Isomerization and aromatization of hydrocarbons in sedimentary basins formed by extension. Geol. Mag. 1983, 120, 417–470. [Google Scholar] [CrossRef]
  58. Suzuki, N. Estimation of maximum temperature of mudstone by two kinetic parameters; epimerization of sterane and hopane. Geochim. Cosmochim. Acta 1984, 48, 2273–2282. [Google Scholar] [CrossRef]
  59. Rullkötter, J.; Marzi, R. Natural and artificial maturation of biological markers in a Toarcian shale from northern Germany. Org. Geochem. 1988, 13, 639–645. [Google Scholar] [CrossRef]
  60. Marzi, R.; Rullkötter, J.; Perriman, W.S. Application of the change of sterane isomer ratios to the reconstruction of geothermal histories: Implications of the results of hydrous pyrolysis experiments. Org. Geochem. 1990, 16, 91–102. [Google Scholar] [CrossRef]
  61. Ulmishek, G.F. Petroleum Geology and Resources of the West Siberian Basin, Russia. U.S. Geol. Surv. Bull. 2001, 2201-G, 49. [Google Scholar] [CrossRef]
  62. Chen, J.; Peng, P.a. A comparative study of free and bound bitumens from different maturesource rocks with Type III kerogens. Org. Geochem. 2017, 112, 1–15. [Google Scholar] [CrossRef]
  63. Lewan, M.D. Evaluation of petroleum generation by hydrous phrolysis experimentation. Philos. Trans. R. Soc. Lond. Ser. A Math. Phys. Sci. 1985, 315, 123–134. [Google Scholar] [CrossRef]
Figure 1. Bazhenov formation and its analogue distribution in West Siberia.
Fuels 06 00022 g001
Figure 2. Modified van Krevelen diagram of the kerogen transformation in the investigated samples. Yellow lines indicate the trend of kerogen transformation in BF source rocks.
Fuels 06 00022 g002
Figure 3. Amount of released synthetic oil from Samples A and B depending on the duration of hydrous pyrolysis.
Fuels 06 00022 g003
Figure 4. Comparison of alkanes and the distribution for a series of synthetic oils obtained from samples A (ad) and B (eh). The registration mode of the selected ion is m/z 71. Duration of hydrous pyrolysis: (a,e)—1 day; (b,f)—3 days; (c,g)—5 days; (d,h)—10 days.
Fuels 06 00022 g004
Figure 5. Relative distribution of n-alkanes in synthetic oil from Sample A at different stages of the experiment. The numbers indicate the time of exposure in days.
Fuels 06 00022 g005
Figure 6. Relative distribution of n-alkanes in synthetic oil from Sample B at different stages of the experiment. The numbers indicate the time of exposure in days.
Fuels 06 00022 g006
Figure 7. Change in terpan and hopane biomarkers on a 191 m/z mass fragment for samples A (ad) and B (eh). Duration of hydrous pyrolysis: (a,e) 0.5 days; (b,f) 2 days; (c,g) 3.5 days; (d,h) 5 days.
Fuels 06 00022 g007
Figure 8. Star diagram for the main biomarker parameters in synthetic oils from Sample A at different stages of the experiment. The numbers indicate the time of hydrous pyrolysis in days.
Fuels 06 00022 g008
Figure 9. Star diagram for the main biomarker parameters in the synthetic oils from Sample B at different stages of the experiment. The numbers indicate the time of hydrous pyrolysis in days.
Fuels 06 00022 g009
Figure 10. The biomarker parameter changes in synthetic oils of Samples A and B through experiment time ((a), Pr/Ph; (b), C27/C29; (c), H29/H30; (d), DBT/Phen; (e), t23/H30; and (f), MPI-1).
Fuels 06 00022 g010
Figure 11. Modified van Krevelen diagram of the kerogen changes in different samples [52]. Yellow lines indicate the trend of kerogen transformation in BF source rocks.
Fuels 06 00022 g011
Disclaimer/Publisher’s Note: The statements, opinions and data contained in all publications are solely those of the individual author(s) and contributor(s) and not of MDPI and/or the editor(s). MDPI and/or the editor(s) disclaim responsibility for any injury to people or property resulting from any ideas, methods, instructions or products referred to in the content.

