Article

Exploration of Changes in Coal Pore Characteristics and Gas Adsorption Characteristics Based on Influence of Stress

1
School of Emergency Management and Safety Engineering, China University of Mining and Technology (Beijing), Beijing 221116, China
2
School of Mechanical and Automotive Engineering, Qingdao University of Technology, Qingdao 266520, China
3
China Coal Science and Engineering Group, Shenyang Research Institute, Fushun 113122, China
4
State Key Laboratory of Coal Mine Safety Technology, Fushun 113122, China
*
Author to whom correspondence should be addressed.
Fuels 2024, 5(4), 698-714; https://doi.org/10.3390/fuels5040038
Submission received: 29 August 2024 / Revised: 27 September 2024 / Accepted: 2 October 2024 / Published: 18 October 2024
(This article belongs to the Topic Evolution of Land-Based Gas Turbines)

Abstract

:
As the mining depth increases, the effect of stress on the gas adsorption of coal gradually becomes significant. There are significant differences in the pore volume, specific surface area, and adsorption characteristics of coal before and after stress. In this study, the porosity variation characteristics of coal were studied using axial and confining pressure loading processes, and volumetric stress was introduced to characterize the pore variation law of coal under triaxial stress. By calculating the stress values at different burial depths, gas isothermal adsorption experiments were conducted on coal under different stress effects. The Langmuir equation, D-A equation, and Freundlich empirical formula were used to fit the adsorption experimental results. Combining experiments and models to predict the adsorbed and free gas content under stress, we described the gas adsorption law of coal under different stress effects.

1. Introduction

Coalbed methane, also known as gas, has been severely affected by gas disasters in coal mines in recent years. With the continuous development of the social economy, shallow coal resources are gradually depleting, and the mining of deep coal resources is also facing increasingly serious gas disasters [1]. According to the statistics presented in Figure 1 of recent coal mine accidents and gas accidents in China, it can be seen that coal mine accidents have decreased significantly year by year, and the state of coal mine safety continues to improve [2]. However, gas remains a hidden danger to coal mine safety, and the situation remains severe. It has long been the biggest threat to the development of coal mine safety [3].
The gas adsorption law of coal is one of the key factors affecting the estimation of coal seams’ gas content [4]. Domestic and international experts and scholars have conducted many studies on the influence of different influencing factors on the gas adsorption characteristics of coal, such as the coal rank, coal composition, coal moisture content, and temperature [5,6,7]. A large amount of research has been conducted by previous researchers on the factors affecting coal’s gas adsorption [8,9]. However, there is relatively little research on the influence of stress on the gas adsorption law of coal, and a unified understanding has not yet been formed [10]. The study of the gas adsorption law of coal usually adopts the isothermal adsorption experiment of coal and draws the isothermal adsorption curve based on the experimental adsorption equilibrium pressure and calculated adsorption amount [11]. Under reservoir conditions, coal’s adsorption of gas will produce an expansion effect. When the expansion is limited, it will lead to changes in the in situ stress state, which in turn will cause changes in the pore volume and surface area of coal. The adsorption characteristics of coal are closely related to both, indicating that stress is one of the most important factors affecting the adsorption characteristics of coal [12].
The Langmuir equation, D-A isothermal adsorption model, and Freundlich adsorption model are effective in characterizing the gas isothermal adsorption experimental results for coal. Research on adsorption models by domestic and international scholars has been ongoing [13]. Through experimental verification and applicability analysis of the model, it is hoped that the model can be further optimized. Although there are many models describing coal adsorption, there is still controversy over which theory best fits the adsorption by coal of gas; researchers therefore measured this using the adsorption constants of nine different coal samples using the high-pressure capacity method and analyzed the relationship between the adsorption constants and the degree of coal metamorphism [14,15]. They found that as the degree of coal metamorphism increased, the adsorption constant a’s value gradually increased, and the trend was approximately linear. Ma et al. [16] conducted gas isothermal adsorption experiments on coal with different moisture contents using a gas constant tester. As the moisture content increased, the amount of gas adsorption by the coal decreased. The Langmuir adsorption constant a decreased with the increase in moisture content, while the adsorption constant b showed a linear increasing trend. Chen et al. [17] found in their experiments on anthracite that the gas adsorption capacity and Langmuir constant a both decreased with increasing temperatures, while the Langmuir constant b increased significantly.
At present, research on the pore structure of coal mainly focuses on the influence of high temperatures and high pressure, while there is little research on the influence of stress on the pore characteristics of coal, such as the pore volume, specific surface area, and porosity [18]. As the mining depth increases, the influencing factors of tectonic stress gradually become significant. However, the tectonic stress is similar to mining stress, in that I also has a significant impact on the porosity and permeability of coal. A large number of granular pores are developed in the abnormal area of coal 6# in Xieqiao Mine, indicating a high degree of granular mylonitization in the coal body, serious internal damage to the coal body under the influence of structural stress, and that the development of pores is disorganized. During fluid migration, the broken mineral particles are easy to roll, thus blocking the fluid channel, resulting in poor permeability of the coal seam [19]. Furthermore, with the deepening mining of the 15# coal seam working face in Yangquan Coalfield, the overlying and underlying coal seams will undergo deformation or extension movements, thereby changing the original stress field in the coal seams and forming adjacent pressure zones. When the coal seam deforms and fails due to changes in the stress field, it forms internal separation fractures and vertically and horizontally fractured fractures, and gas path fault zones are generated and extended, which can improve the permeability of the gas flow in the coal and rock. When characterizing the gas adsorption characteristics of coal using granular coal, the influence of tectonic stress is ignored, which is different from the actual state of coal seams [20].
In this work, we conducted research on the gas adsorption law of coal under different stress effects, simulated the in situ stress state of coal seams with different burial depths through triaxial stress loading, analyzed the gas adsorption law of coal under different stress effects, and provided basic theoretical support for predicting the gas content in deep coal seams and preventing gas disasters.

2. Coal Seam Pore Analysis and Mathematical Model of Adsorption

2.1. Experimental Coal Samples

The experimental coal samples were collected from the Fifth Mine of Yangquan Coal Industry (Group) Co., Ltd. (Yangquan, China). The coal seam is fresh and exposed in the working face, which consists of anthracite coal. The coal quality is relatively hard, and the collected coal sample was processed. During the sample preparation process, the coring machine was set to drill at a constant and slow speed to ensure the integrity of the drilled coal sample. The final preparation of several coal sample specimens mainly included a moisture content of 1.37%, ash content of 12.86%, and volatile content of 12.93%.
Yangquan Coalfield is located on the northeast side of Qinshui Basin in Shanxi Province, on the west side of the Taihang Mountain anticline. It is basically a monocline structure inclined towards the northeast. The main coal-bearing strata are the Taiyuan Formation of the Carboniferous System and the Shanxi Formation of the Permian System. According to the “Method for Determining the True Density of Coal”, the density of the collected coal samples was measured. The porosity of the coal was calculated based on the “Method for Calculating the Porosity of Coal and Rock”. The coal sample had a density of 1.61 g/cm3, a true density of 1.78 g/cm3, and a porosity of 9.55%.

2.2. Pore Characterization Method for Coal

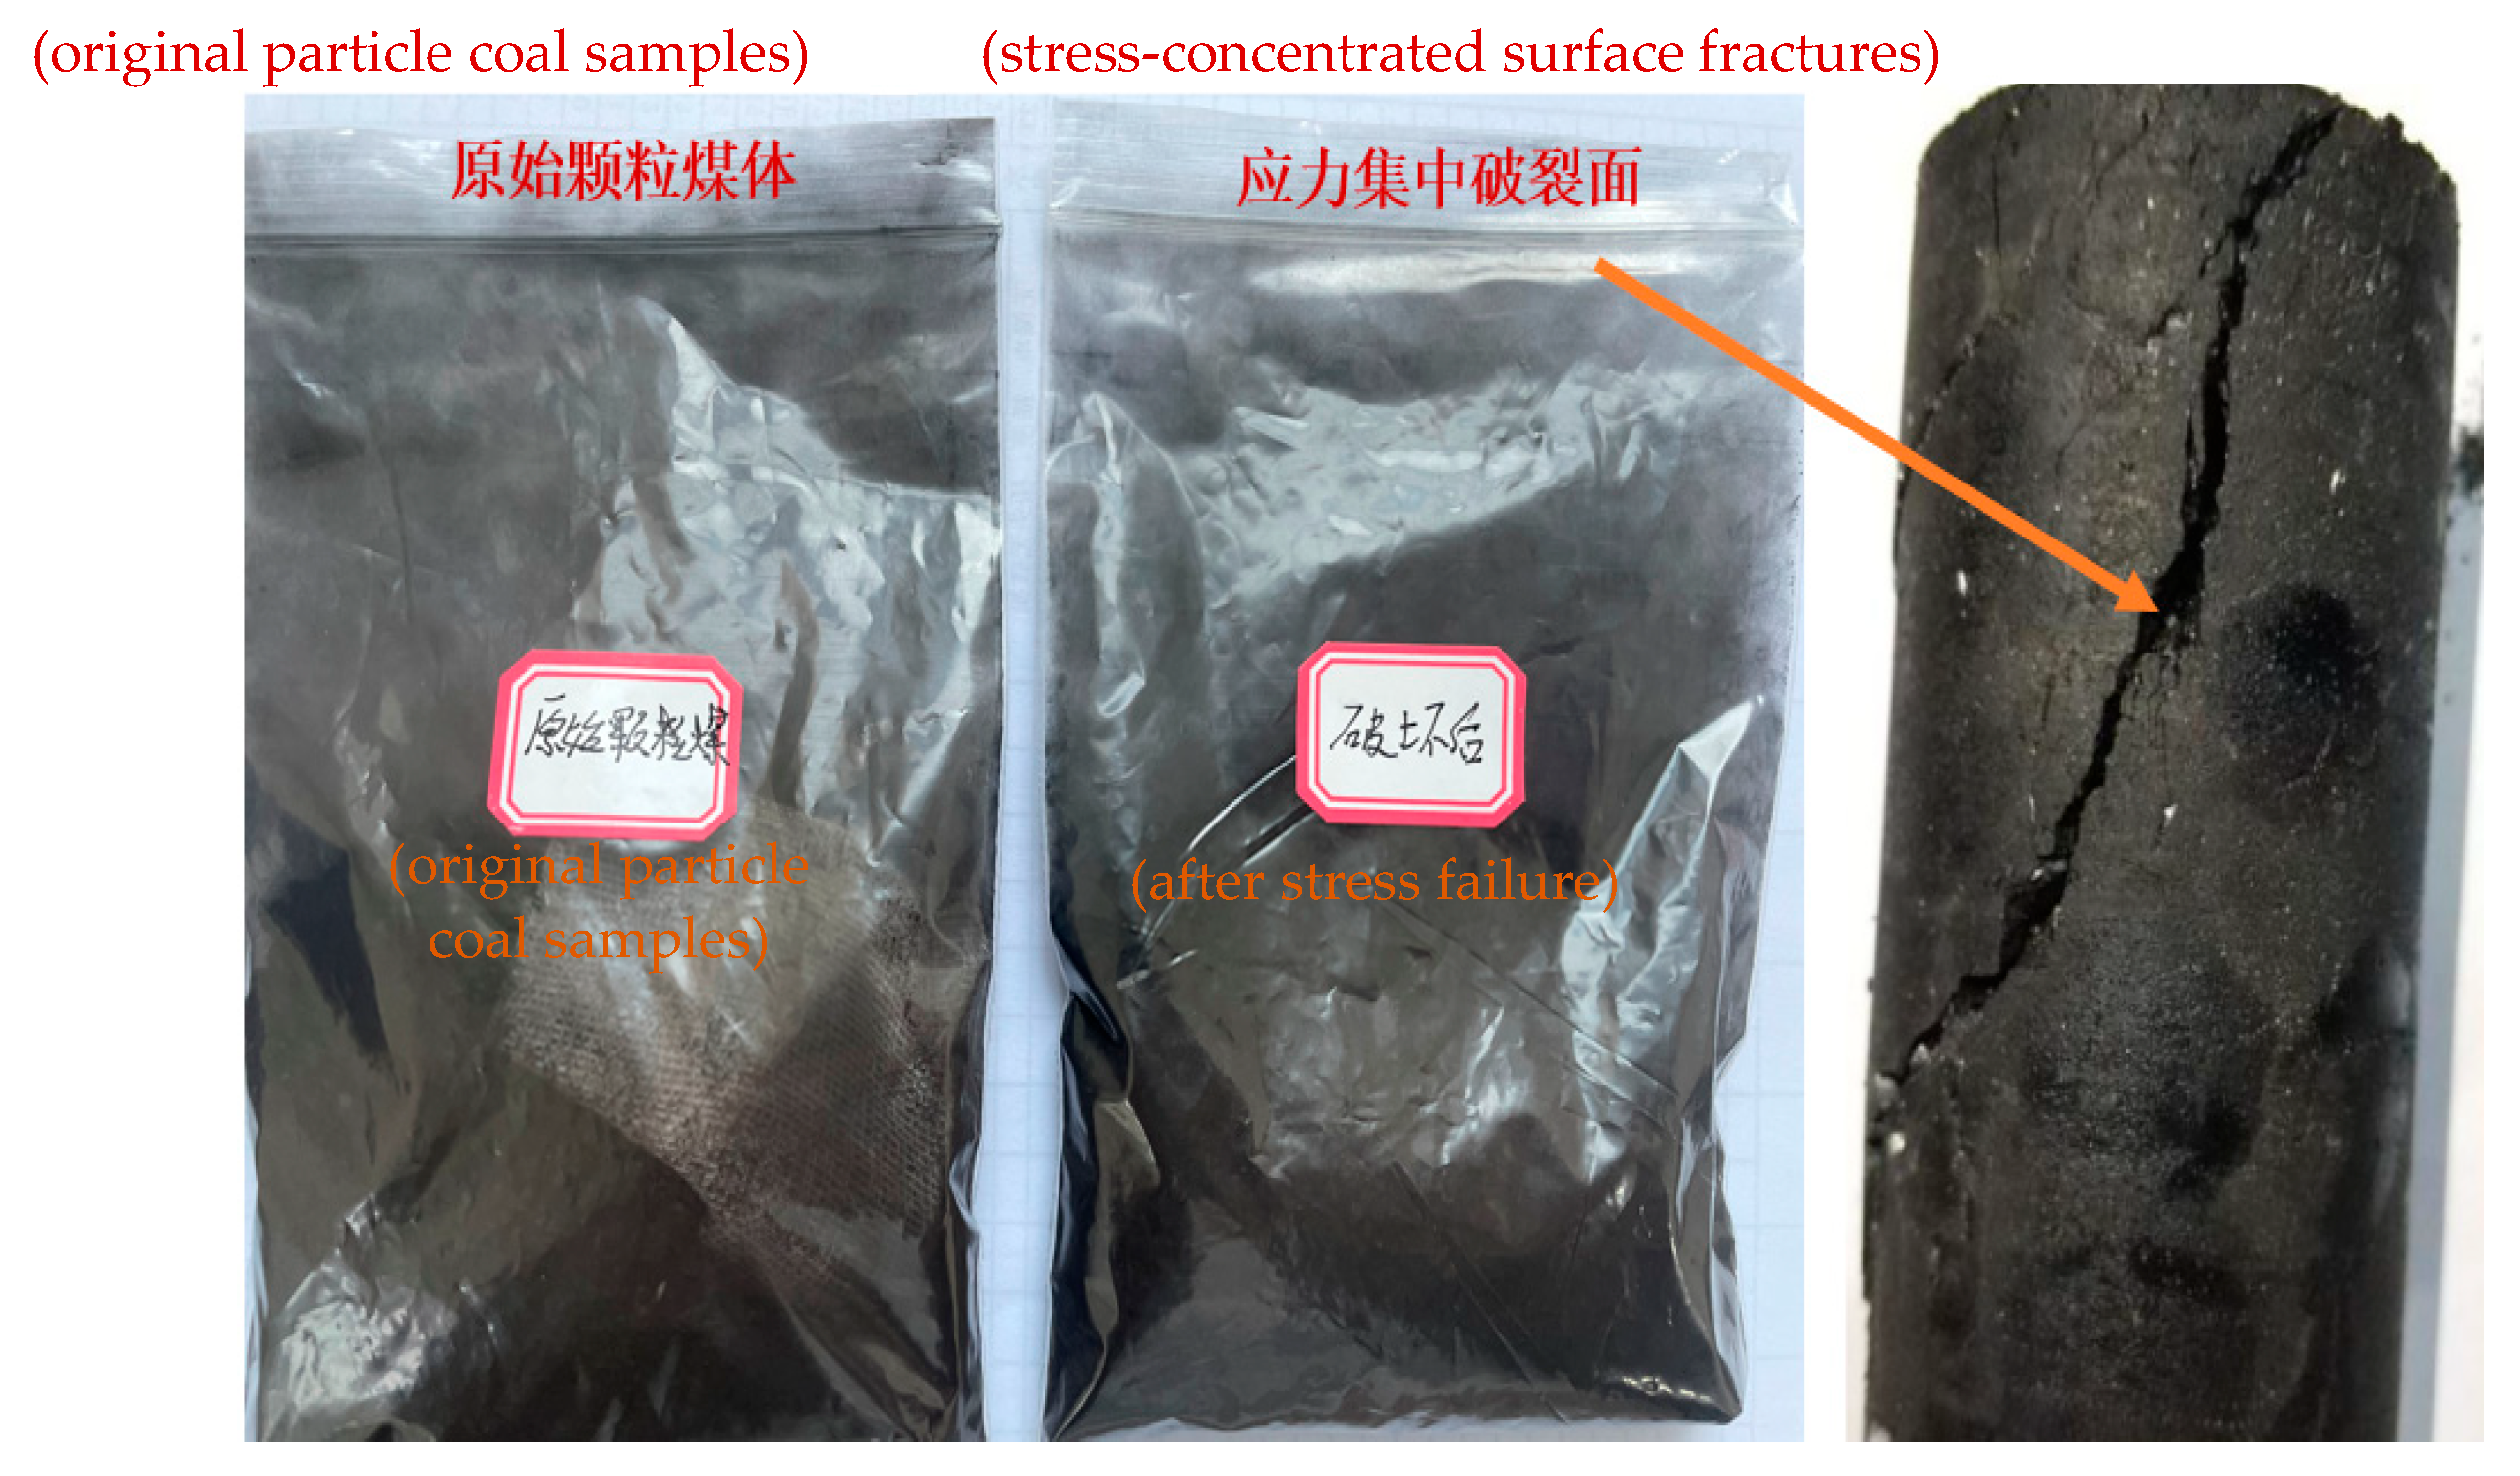
The pore volume and specific surface area of coal in different pore size ranges can provide information on the pore structure. The pore structure of coal is very complex, ranging from the smallest micropores (<10 nm) to the larger mesopores (100–1000 nm) to the largest macropores (>1000 nm) according to the current Houghton decimal classification system used in the domestic coal industry. The porosity of coal refers to the physical properties of coal reservoirs, which are generally characterized by parameters such as the pore volume, specific surface area, and porosity [21]. Stress loading not only causes macroscopic damage to coal samples, as shown in Figure 2, but also has a certain influence on the microscopic pore structure of coal. In order to explore the changes in pore volume and specific surface area of coal before and after stress action, the pore volumes of original particle coal samples (without stress action) and particle coal samples with stress-concentrated surface fractures (after stress failure) were measured using the mercury intrusion method. The specific surface area of the coal before and after stress action was measured using the low-temperature liquid nitrogen adsorption method.

2.2.1. Pore Volume Measurement

This experiment used the Auto Pore IV fully automatic mercury intrusion meter (Micromeritics, Norcross, Georgia, United States). Based on the cumulative amount of mercury entering the pores of coal samples under different pressures, the pore volume corresponding to the pore size can be calculated. The relationship between the pore size of coal that mercury liquid can enter into and the applied pressure conforms to the following equation [22]:
P = 2 σ cos θ r
P is the external pressure applied during mercury injection in MPa; σ is the surface tension of mercury in 0.0048 N/m; θ is the infiltration angle between the pore surface of coal and the mercury column, taken based on a calculation; r is the pore radius in nm.

2.2.2. Pore Volume Measurement

The instrument used for the determination of the pores’ specific surface area in the experiment was the ASAP 2020 physical adsorption instrument (Micromeritics, Norcross, GA, USA). Due to the van der Waals force, nitrogen molecules reach an approximate monolayer adsorption equilibrium state on the surface of solid substances. Based on the proportional relationship between the adsorption amount and the adsorbate surface area, the specific surface area of the tested substance was calculated. The relationship between the relative pressure of nitrogen and its pore condensation curvature can be expressed using the following equation [23]:
r k = 0.414 ln ( p / p 0 )
r k is the critical pore radius at which capillary condensation occurs, known as the Kelvin radius, nm.
The liquid nitrogen adsorption method can determine the effective pore size of coal in the range of 2–400 nm. Based on the experimental data on liquid nitrogen adsorption and the desorption of coal samples before and after stress, the specific surface area of each pore size segment of the coal sample was calculated.

2.3. Characterization of Coal Porosity Under Stress

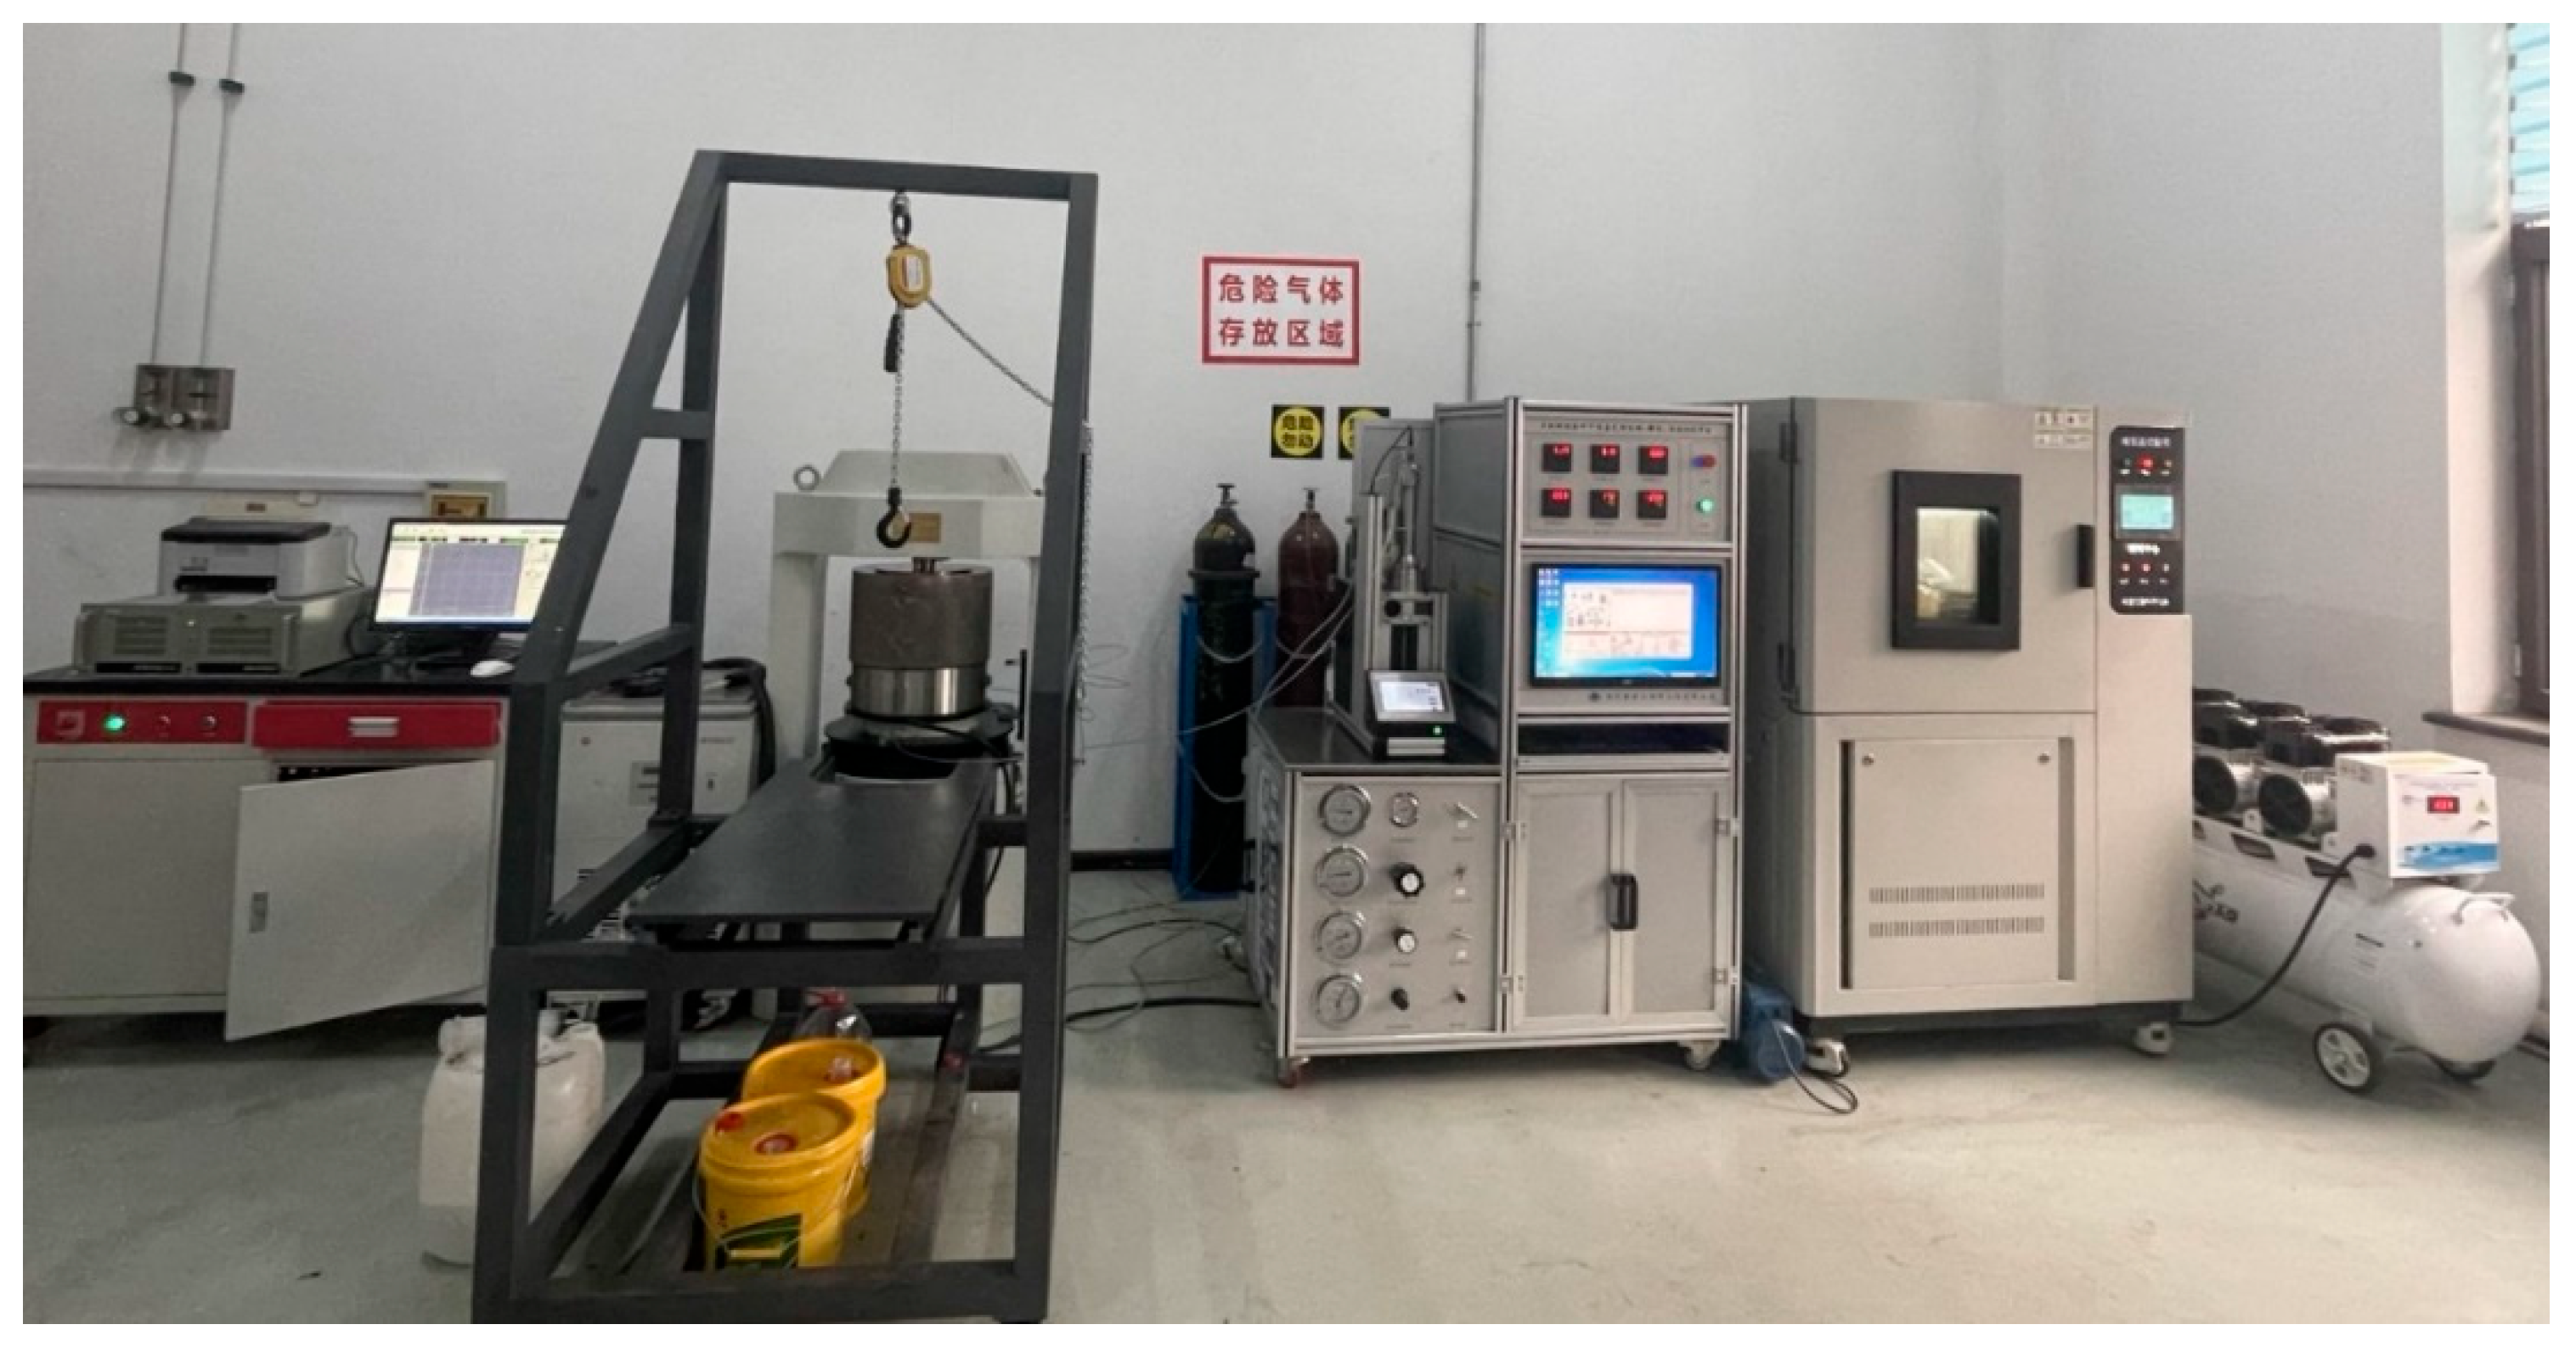
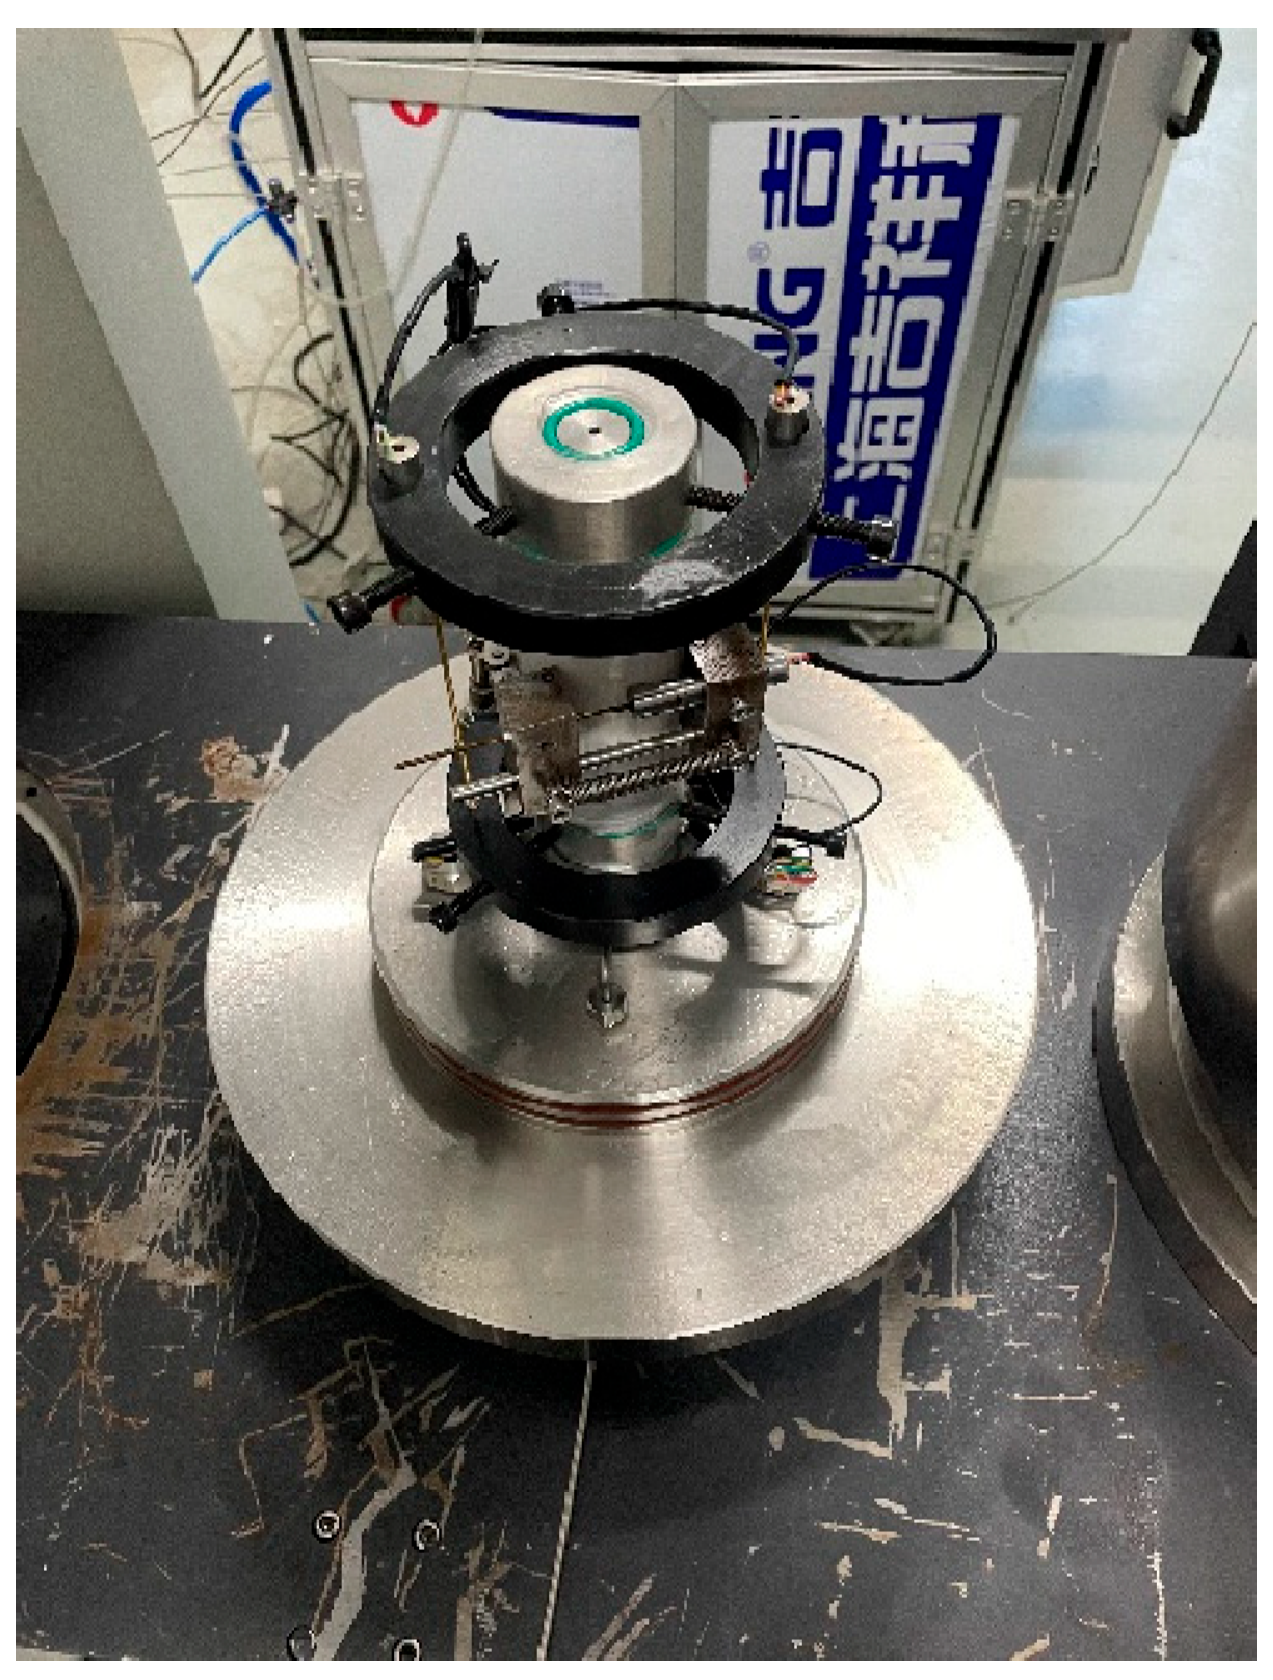
From a microscopic perspective, coal undergoes changes in pores and fractures under stress, while from a macroscopic perspective, it undergoes changes in porosity. Using the gas adsorption experimental platform of coal under a force load presented in Figure 3, experiments were conducted to determine the porosity of coal under different stress effects. Based on the experimental results, a quantitative characterization relationship between the coal porosity and stress was constructed.
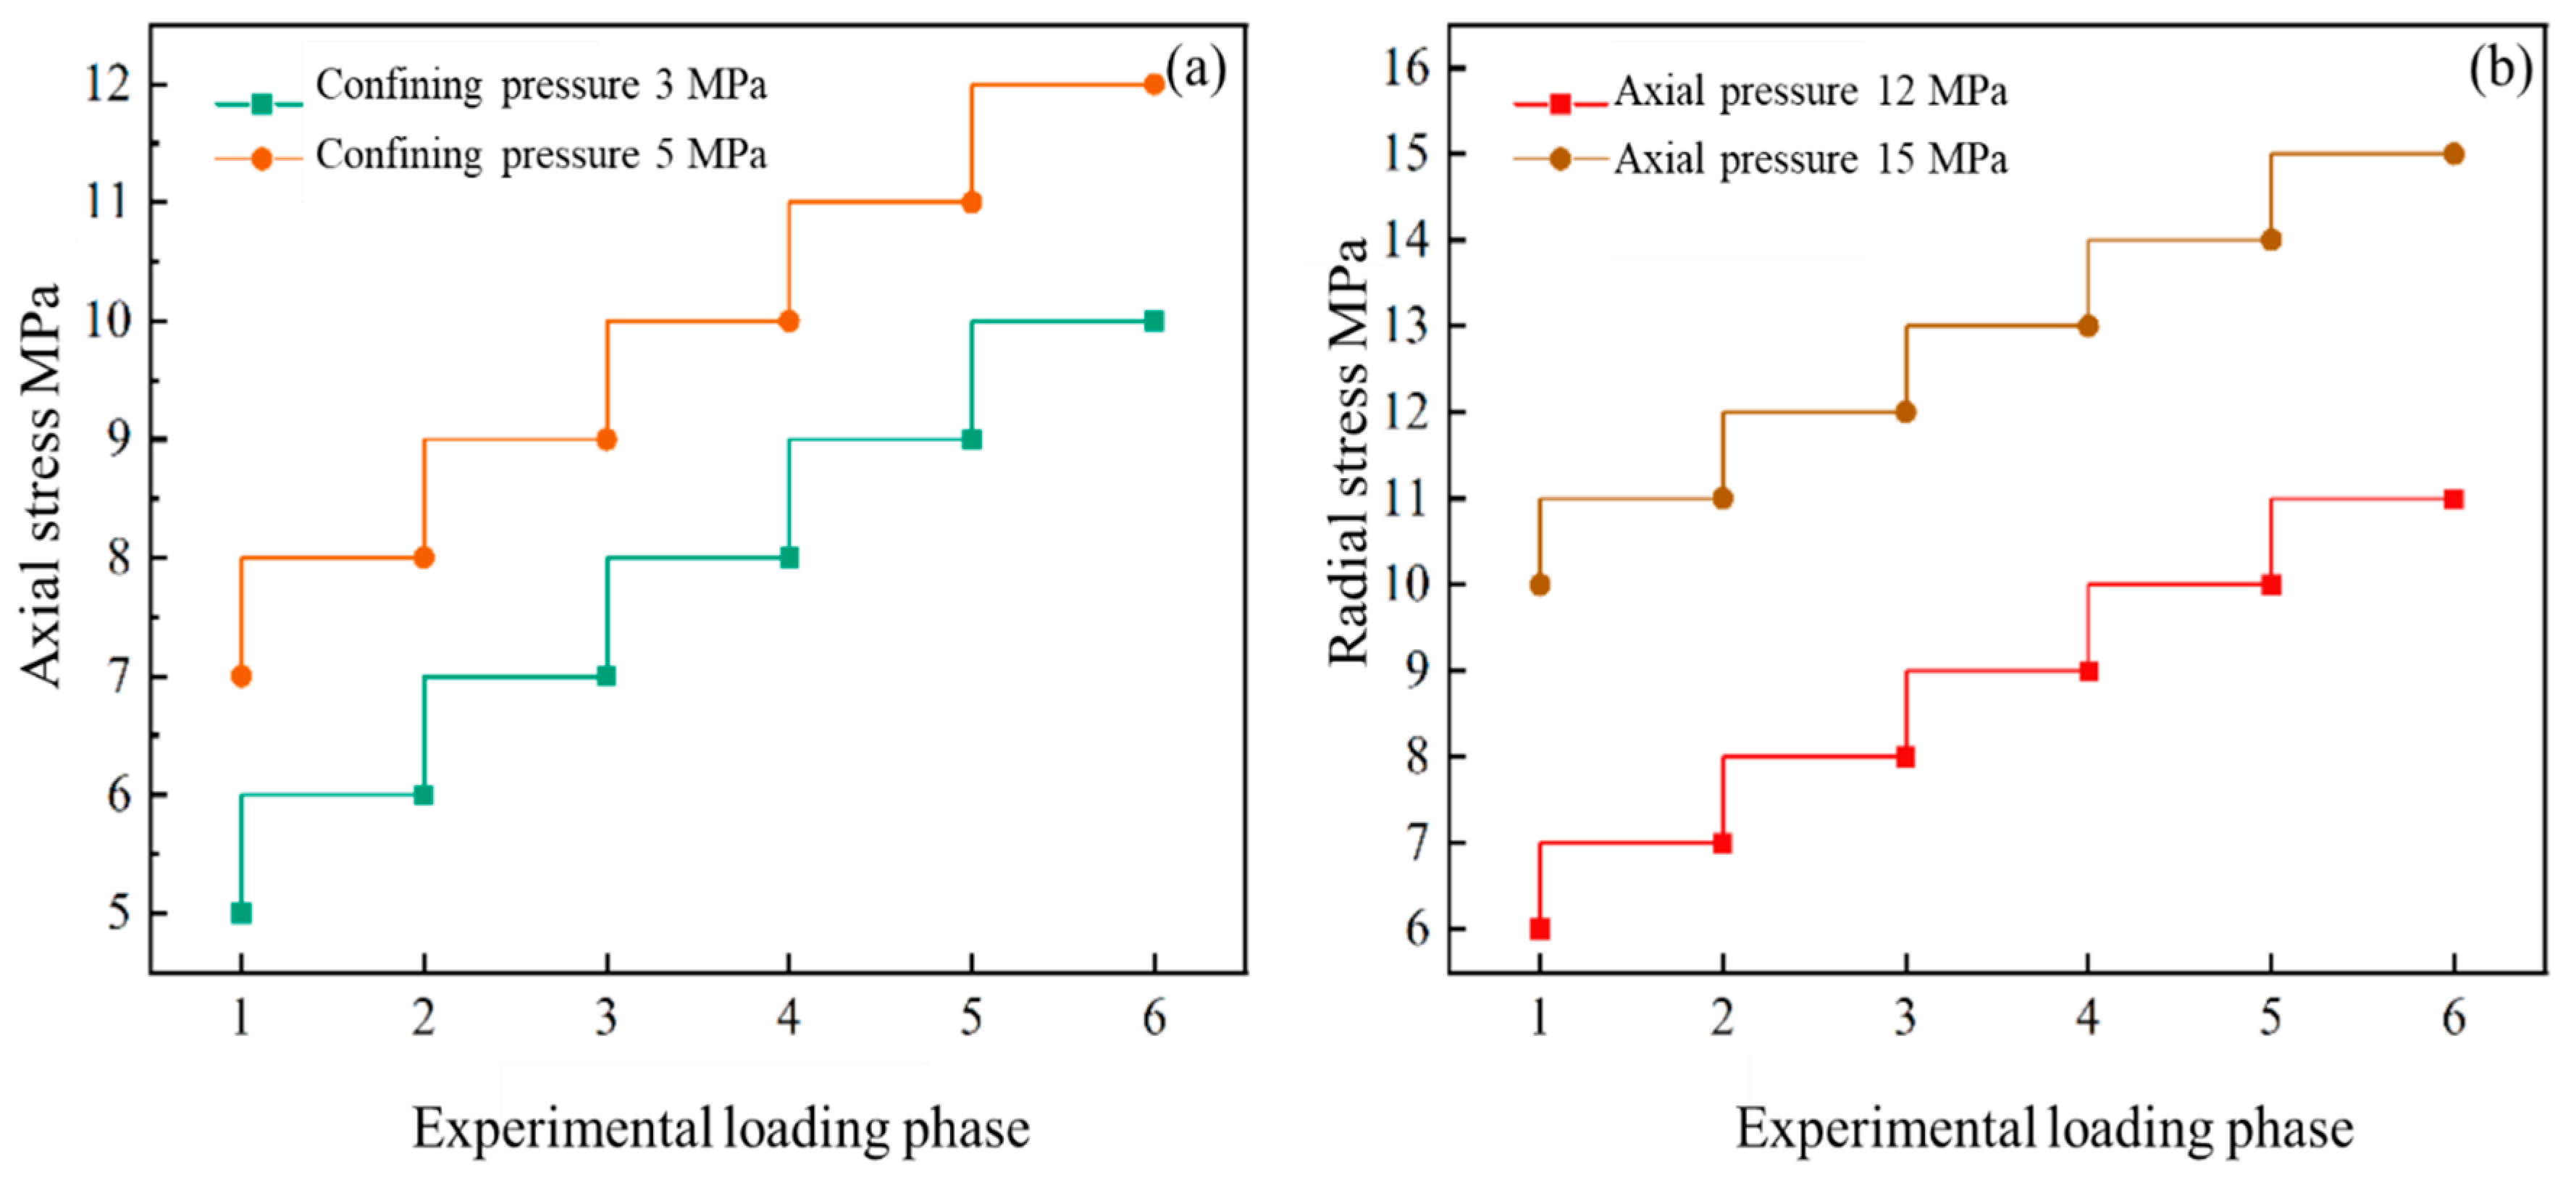
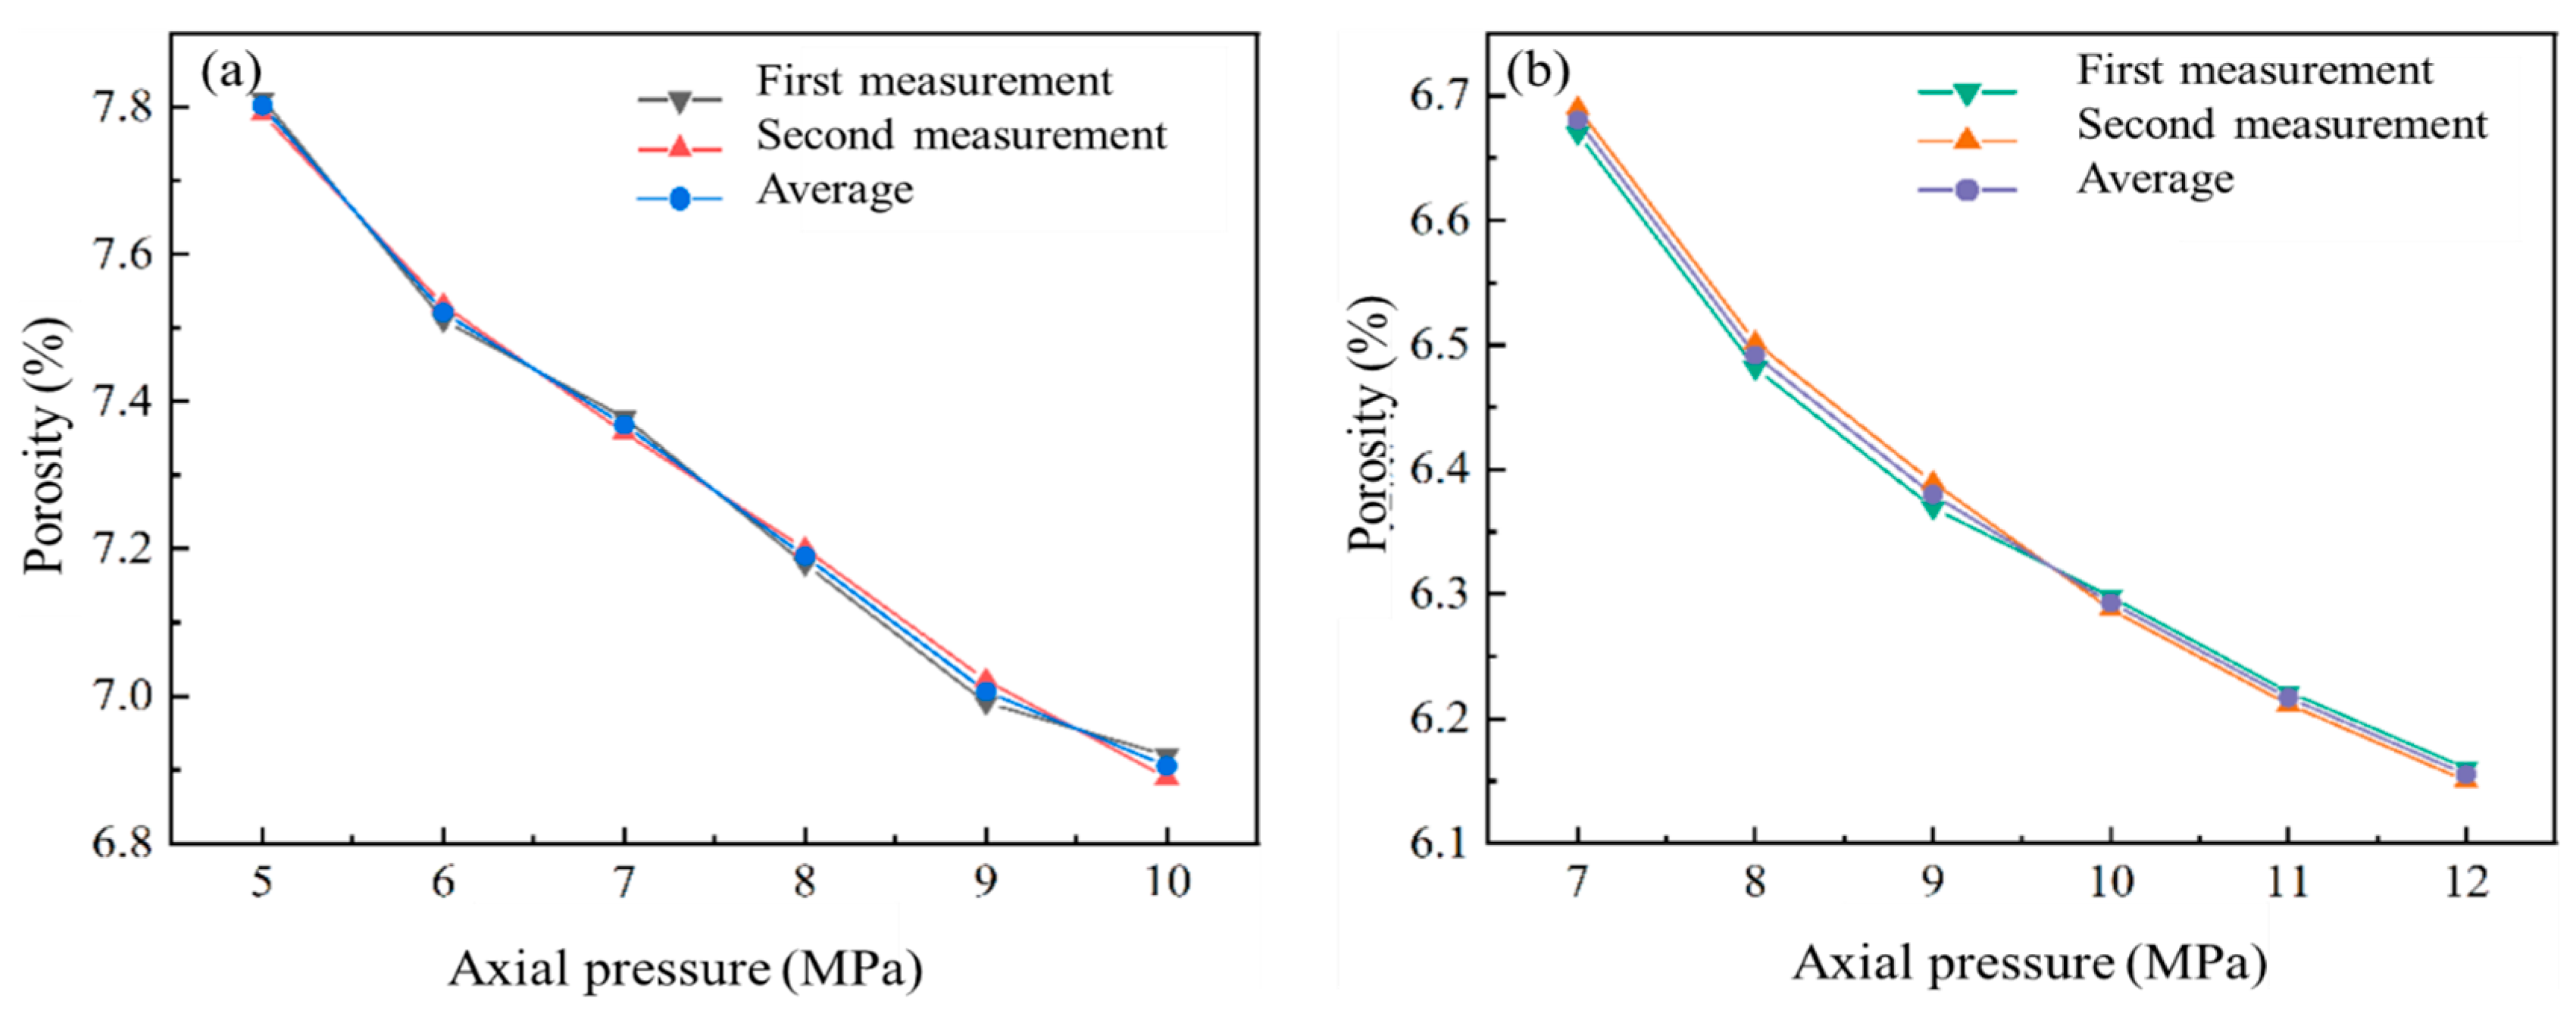
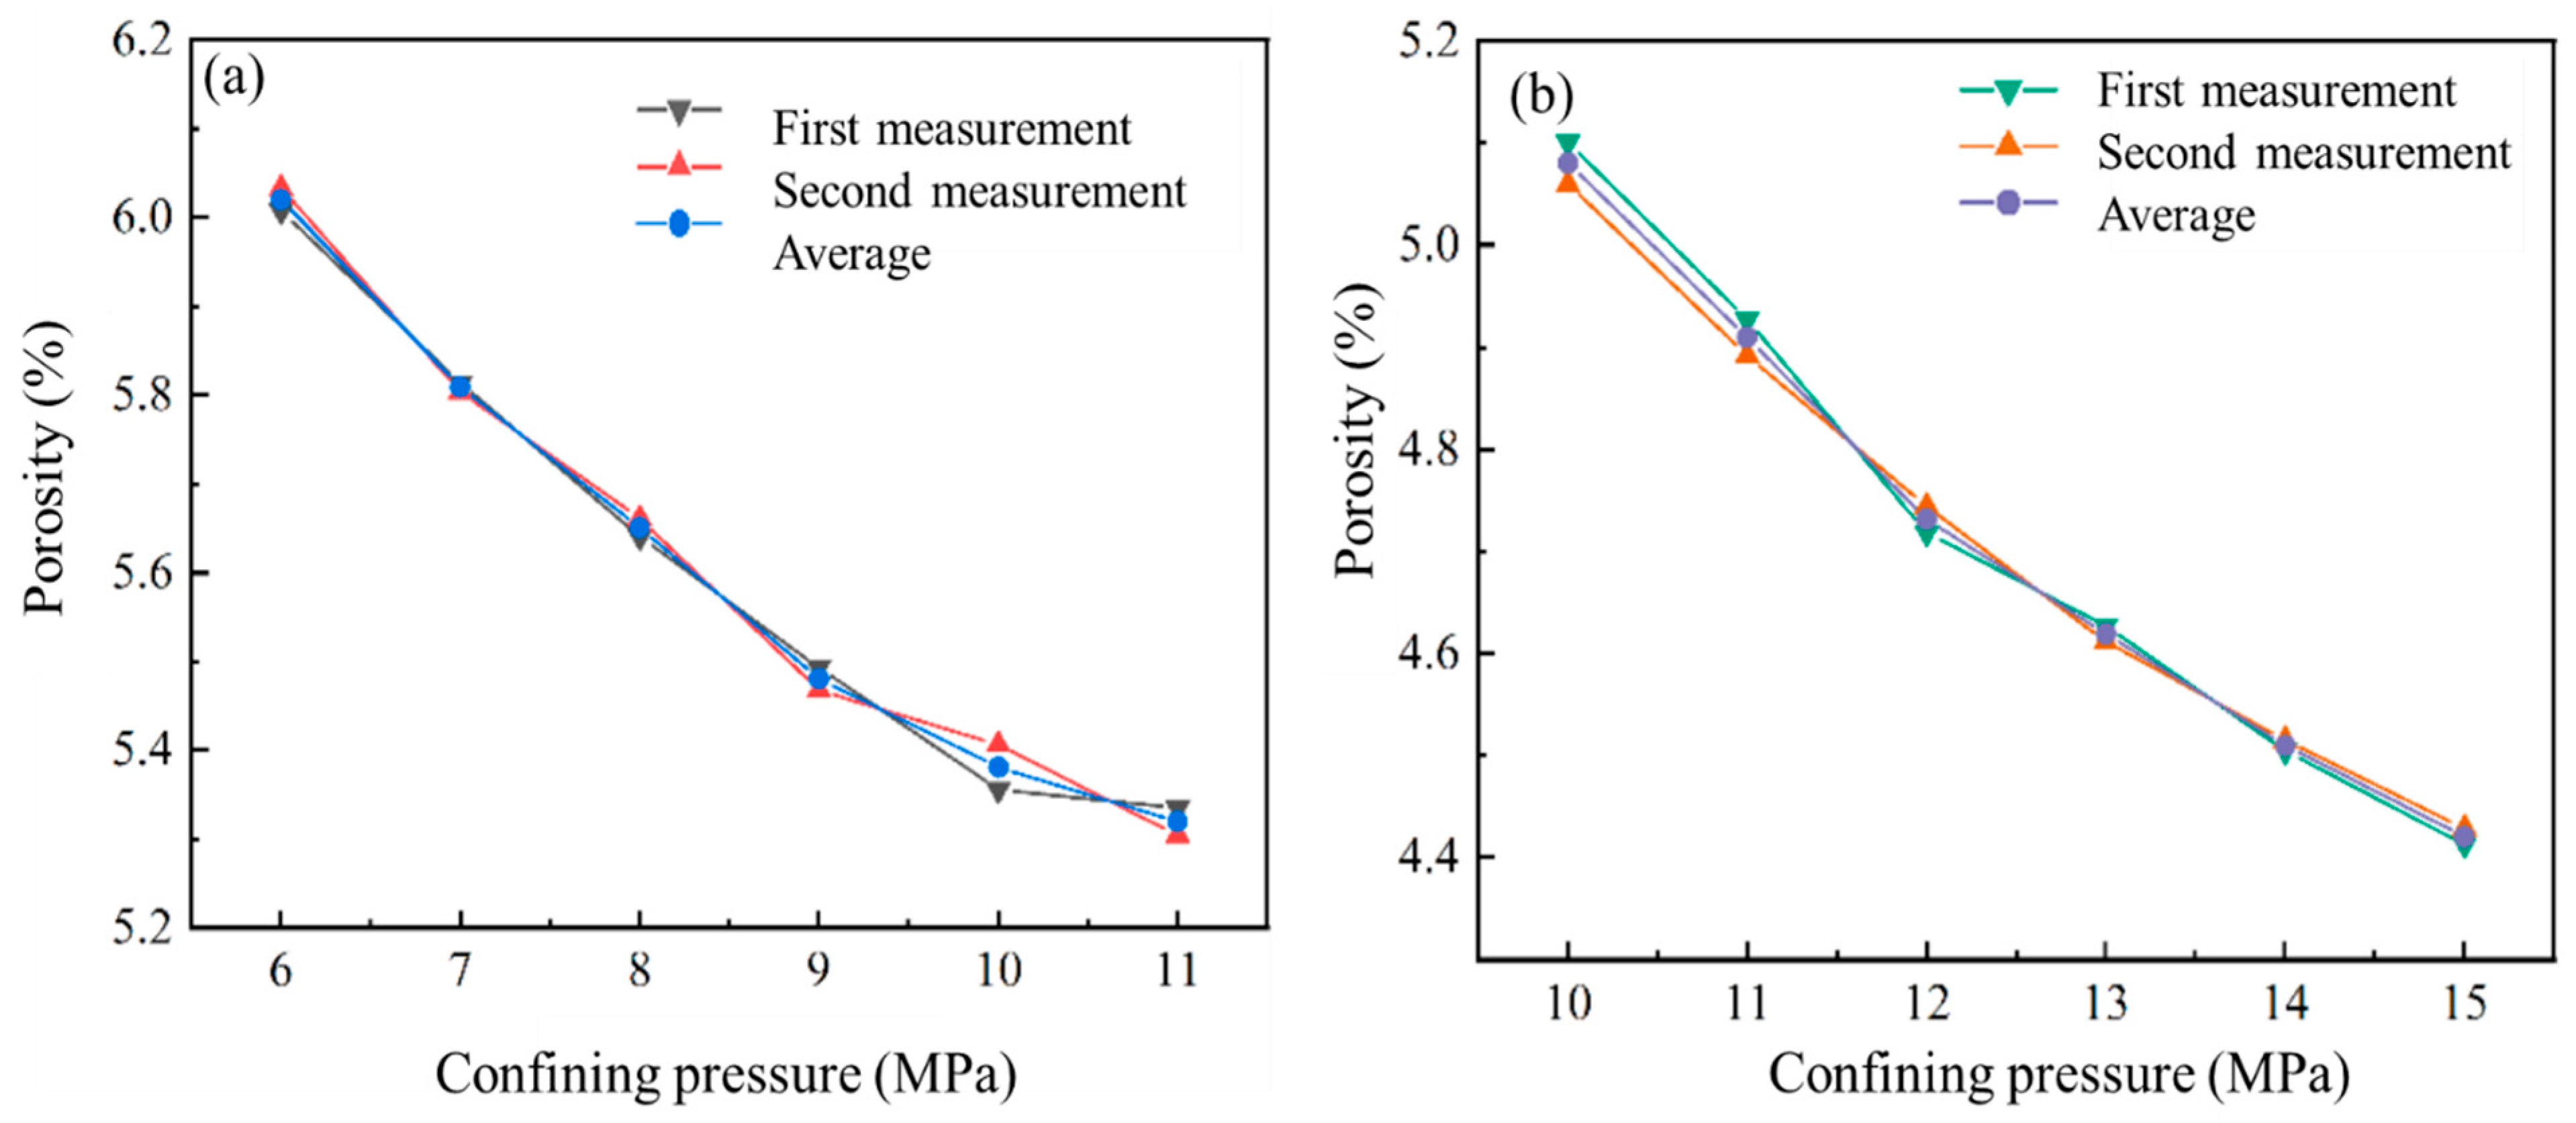
Under the condition of a constant experimental temperature of 30 °C, two loading methods were used to determine the porosity of coal: ① We used variable axial compression loading under constant confining pressures of 3 MPa and 5 MPa. The confining pressure was first fixed, and then, the axial pressure was increased to a certain load to measure the porosity of coal under this stress state. Then, the axial pressure was increased to a larger load, and the porosity of coal under this stress state was measured again. ② To determine the variable confining pressure loading under constant axial pressures of 12 MPa and 15 MPa, we first fixed the axial pressure and then increased the confining pressure to a certain load, measured the porosity of the coal under this stress state, and then increased the confining pressure to a larger load to measure the porosity of the coal under this stress state again.
The two loading methods described above were sequentially carried out according to Figure 4, and the porosity of the coal under different stress effects was measured.

2.4. Gas Adsorption Experiment for Coal Under Stress

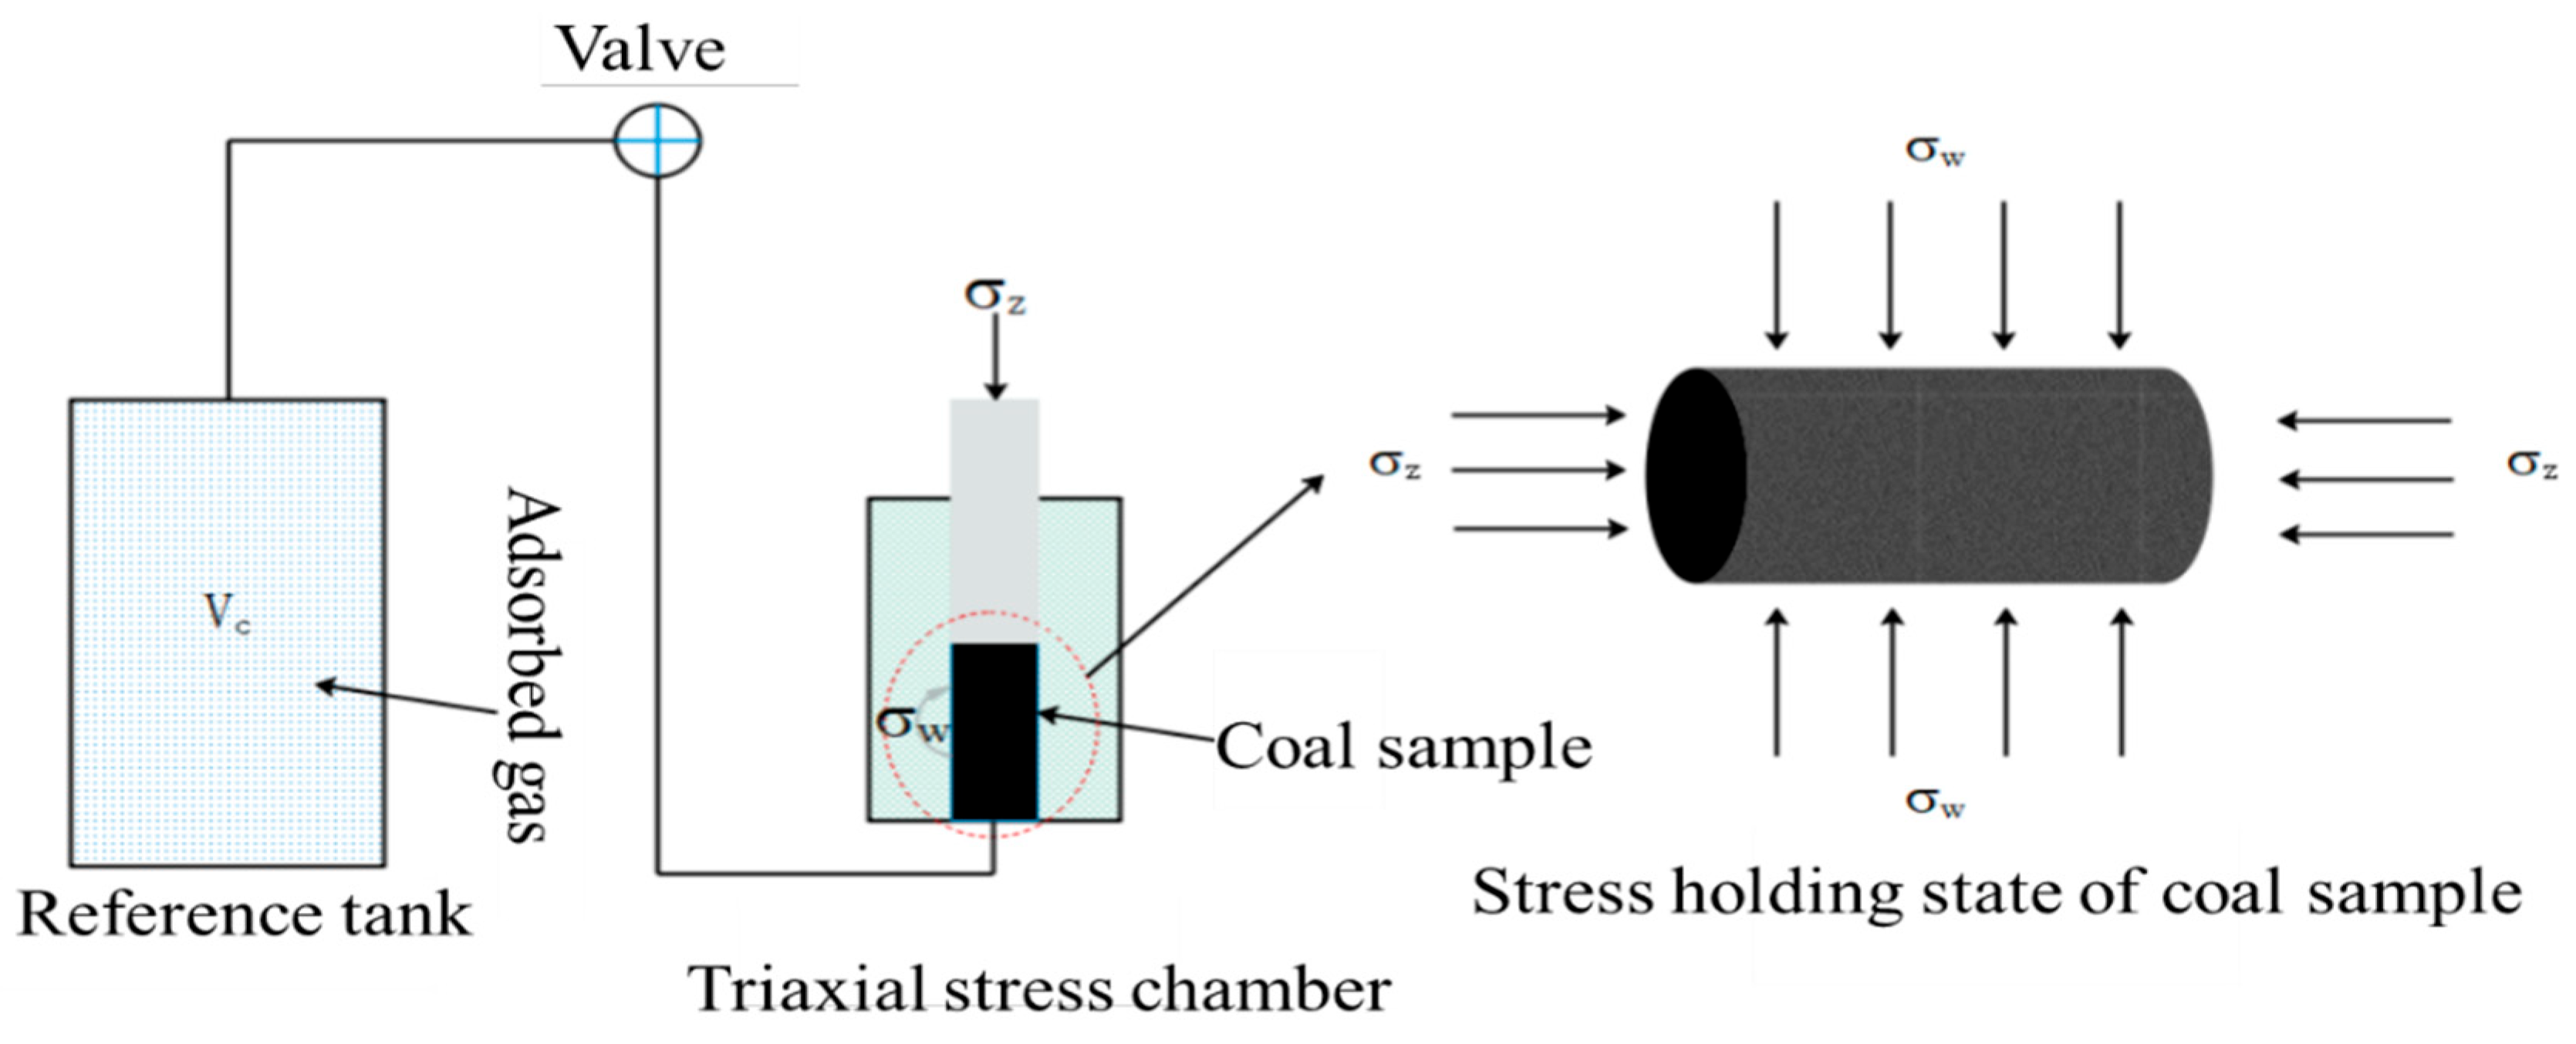
Isothermal adsorption experiments are usually divided into two testing methods: dynamic and static. The dynamic method is further divided into the atmospheric flow method and the chromatography method, while the static method is divided into the weight method and the capacity method. The measurement principle is shown in Figure 5, and the gas adsorption capacity of coal is calculated based on the gas state equation.
This study used the capacity method in the static method to conduct isothermal gas adsorption experiments on coal under different stress conditions. We placed the prepared raw coal specimen in a triaxial stress chamber (as shown in Figure 6). When the coal sample was loaded in the triaxial stress chamber and reached the stress value set in the experiment, we measured the pore volume of the coal sample in the triaxial stress chamber. Then, we performed a vacuum operation on the experimental device, adjusted the pressure-regulating valve to fill a certain pressure of methane gas into the upstream reference tank and pipeline, and recorded the pressure, P1, at this time. We opened the valve to connect the upstream reference tank and the triaxial stress chamber. At this time, the coal sample began to adsorb gas. After reaching adsorption equilibrium, we read the pressure of the upstream reference tank again and recorded it as P2. The adsorption capacity of the coal sample can be calculated based on the initial value and equilibrium value of the gas pressure in the upstream reference tank, as well as the pore volume of the pipeline system and coal sample.
The methane gas was filled into the triaxial stress chamber through the upstream reference tank and pipeline. After the adsorption equilibrium of raw coal was reached, the total volume of methane filled into the triaxial stress chamber was calculated using Equation (3) [24]:
Q c = 273.15 × V C ( 273.15 + t 0 ) × 0.101325 P 1 Z 1 P 2 Z 2
Q c is the total volume of free gas and adsorbed gas adsorbed by the raw coal in equilibrium, cm3; V C is the volume of the upstream reference tank and pipeline, cm3; P 1 is the equilibrium pressure before inflation of the upstream reference tank and inflation pipeline, MPa; P 2 is the equilibrium pressure after inflation of the upstream reference tank and pipeline, MPa; Z 1 is the compression factor of the methane under pressure and the experimental temperature and is dimensionless; Z 2 is the compression factor of the methane under pressure and the experimental temperature and is dimensionless; t 0 is the experimental temperature, °C.
Due to the fact that the triaxial stress chamber is filled with hydraulic oil, the dead volume in the chamber refers to the pore volume of coal. After the adsorption equilibrium of raw coal is reached, the free gas volume in the triaxial stress chamber is the free gas volume [25]:
Q y = 273.15 × P 2 × V P ( 273.15 + t 0 ) × Z 2 × 0.101325
Q y is the free gas volume of the coal in the triaxial stress chamber under adsorption equilibrium pressure, cm3; V P is the pore volume of the coal in the triaxial stress chamber, cm3; P 2 is the adsorption equilibrium pressure, MPa; t 0 is the experimental temperature, °C; Z 2 is the balance of the compression factor of methane at pressure and the experimental temperature and is dimensionless.
After the adsorption equilibrium of raw coal is reached, the volume of the adsorbed gas under standard conditions can be calculated using Equation (5):
Q x = Q c Q y

3. Results and Discussion

3.1. Differential Pore Volume of Coal

The most widely used Hodott decimal classification system in the coal industry includes micropores [26], small pores, mesopores, and macropores. Micropores are the main gas storage sites that make up the specific surface area of coal and adsorb gas; small pores are the spaces where capillary condensation and gas diffusion occur; mesopores belong to the slow laminar gas permeation space; and macropores belong to the strong turbulent gas permeation field. According to the connectivity of pores, the pores in coal can be divided into closed pores, semiclosed pores, cross-linked pores, and through-pores, as shown in Figure 7a, and the shape of the pores can be divided into layered pores, columnar pores, ink bottle pores, conical pores, and interstitial pores, as shown in Figure 7b. Stress loading not only causes macroscopic damage to coal samples, it also causes serious changes to the microscopic pore structure of coal.
Based on the mercury intrusion test data of the coal samples before and after stress, a curve was drawn for the pressure and volume of the mercury intrusion (retreat). As shown in Figure 8, the mercury evolution curves of the coal samples before and after stress show different characteristics. There is a significant hysteresis loop in the entire mercury evolution process of the coal samples without stress, indicating that there are many open pores. However, after stress failure, the hysteresis loop of the coal samples is smaller than that of coal samples without stress, indicating that the number of open pores in the coal samples decreases and the number of semiclosed pores increases after stress, leading to poor connectivity of the coal samples and diminished gas adsorption. The stress action destroys the pore volume of coal, resulting in an increase in the pore volume of large and medium pores, a decrease in the pore volume of micropores and small pores, and an overall decrease in pore volume. Similarly, Wang et al. [22] used activated carbon as a natural gas adsorbent and measured the natural gas desorption capacity of activated carbon at 3.4 MPa and 7.0 MPa, respectively. The experimental results showed that the specific surface area and pore volume below 4.0 nm or 6.0 nm were the two key factors affecting the natural gas desorption capacity per unit mass of activated carbon. However, due to the effect of gas stagnation, the amount of natural gas desorbed from the micropores was only a part of the total desorption capacity of the activated carbon. This result indicates that the microporous structure has a significant impact on gas adsorption. Sun et al. [27] used a certain amount of calcium chloride, silica gel, and expanded graphite to prepare a composite adsorbent. Nitrogen gas was used as the carrier gas, which had little effect on the ammonia adsorption capacity. However, at lower temperatures and higher partial ammonia pressures, the composite adsorbent had a better adsorption effect on the ammonia, indicating that the adsorption capacity of coal is closely related to the partial pressure.

3.2. Differences in Pore Specific Surface Area of Coal

From Figure 9, it can be seen that the overall trends in the coal sample adsorption and desorption curves before and after stress are very similar, with adsorption hysteresis loops that are mainly concentrated in Zone III. We determined the pore development morphology of the coal based on the hysteresis loops generated by different relative pressures during the adsorption–desorption process. We divided the adsorption and desorption isotherms of the coal into Zones I ( 0 < p / p 0 0.2 ), II ( 0.2 < p / p 0 0.5 ), and III ( 0.5 < p / p 0 < 1 ), which correspond to different pore structures. Among them, the adsorption curve and desorption curve in Zone I basically overlap, with good reversibility. The pores in this area are mostly nonpermeable, with the pores being closed at one end. The adsorption curve in Zone II gradually separates, indicating the presence of some blind holes in this area. As shown in Figure 9, there is a significant hysteresis loop in Zone III, with the pores mainly consisting of layered pores and cylindrical pores with openings at both ends. At a relative pressure of 0.5, the desorption curve of the coal shows a significant turning point, indicating that the coal sample also contains ink-bottle-shaped pores. When the relative pressure approaches ( p / p 0 ) 1, there is a significant difference in the degree of coal adsorption and desorption, indicating that a stress loading failure has an impact on the pore structure of coal.

3.3. Gas Adsorption Data Fitting

3.3.1. Langmuir Equation Fitting of Adsorption Data

The Langmuir equation is an isothermal equation obtained by assuming that the adsorption system is in dynamic equilibrium [28]. The Langmuir equation for single gas adsorption is as follows:
V = a b P 1 + b P
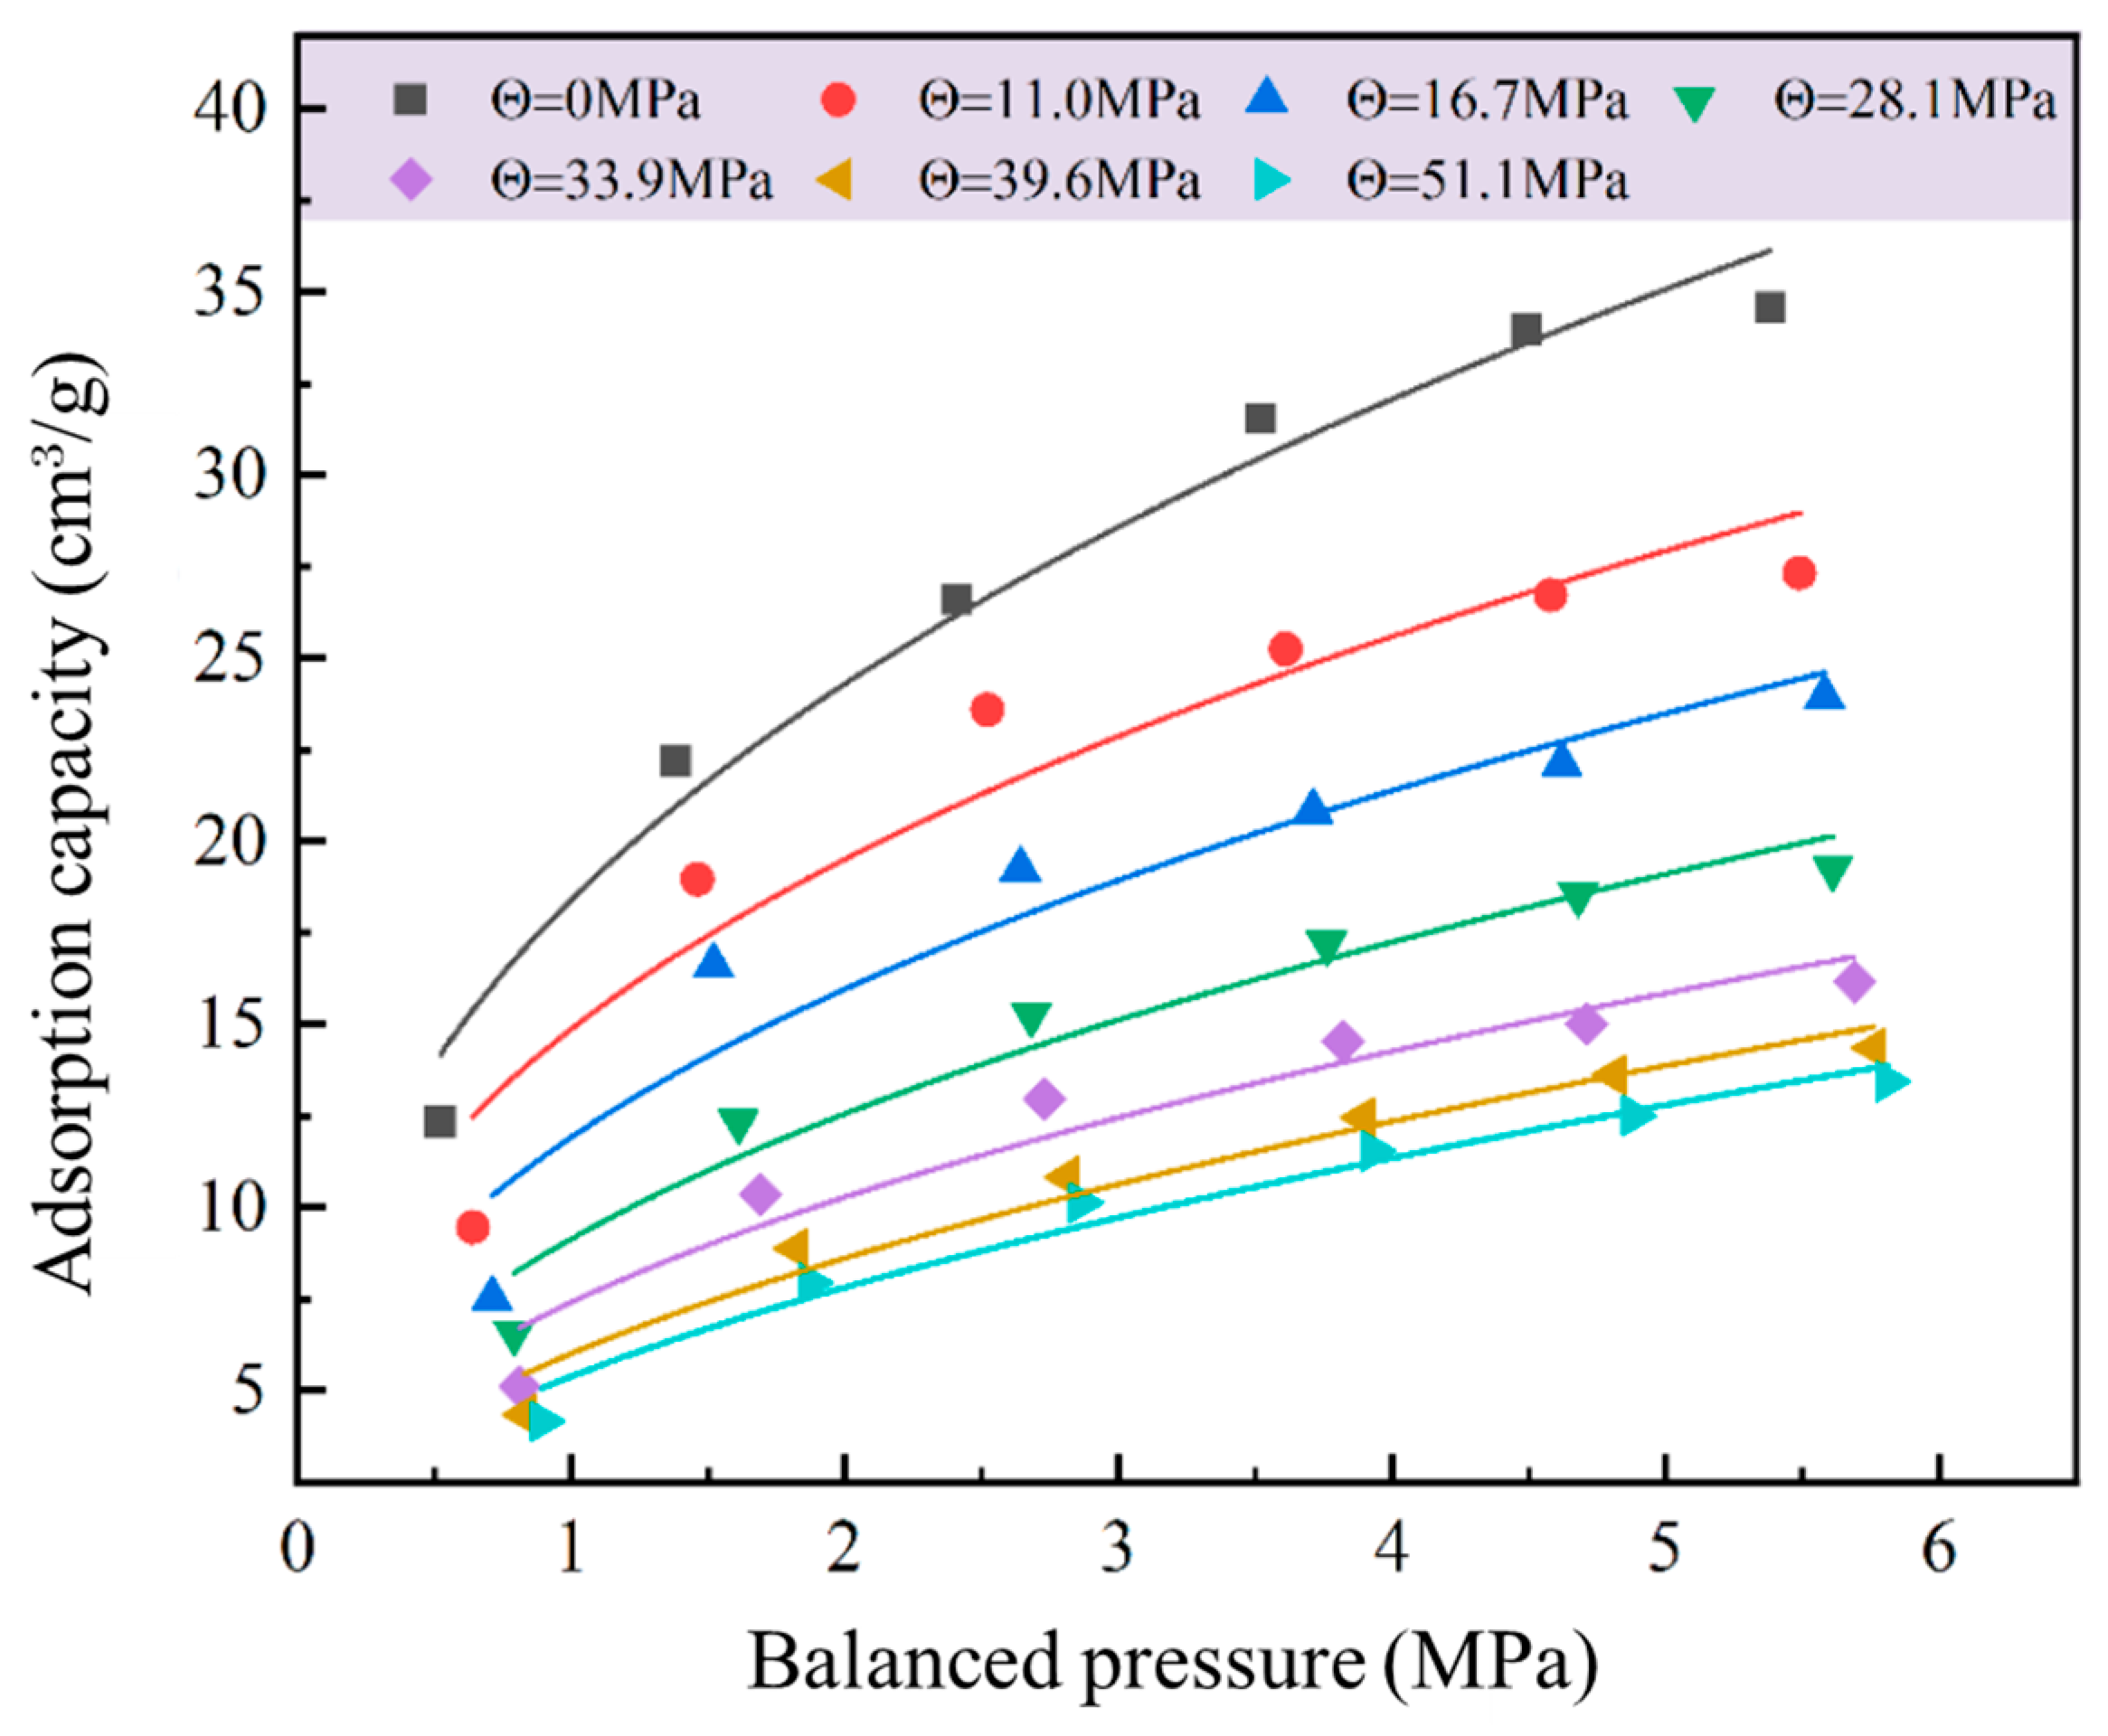
V is the adsorption volume, cm3/g; a is the Langmuir adsorption constant, cm3/g; b is the Langmuir pressure constant, MPa−1; P is the gas pressure, MPa. Using the adsorption equilibrium pressure as the x-axis and the adsorption capacity as the y-axis, plot the adsorption experimental data into a scatter plot. Fit the experimental data to obtain the Langmuir isotherm adsorption curve, as shown in Figure 10. This allows for the correlation coefficient R2 between the Langmuir adsorption constant parameter and the characterization curve to be determined.
The shape of the gas isotherm adsorption curve of coal under different stresses conforms to the characteristics of Type I adsorption isotherms, indicating that the gas adsorption of coal under stress belongs to the physical adsorption of single molecular layers. The fitting results show that the correlation coefficients between the isotherm adsorption amount and the Langmuir equation are all above 0.9728, indicating a high degree of agreement. As the volume stress increases, the adsorption constants a and b both show a decreasing trend, and the increase in volume stress inhibits the gas adsorption of coal.

3.3.2. Dubinin–Astakhov Equation Fitting of Adsorption Data

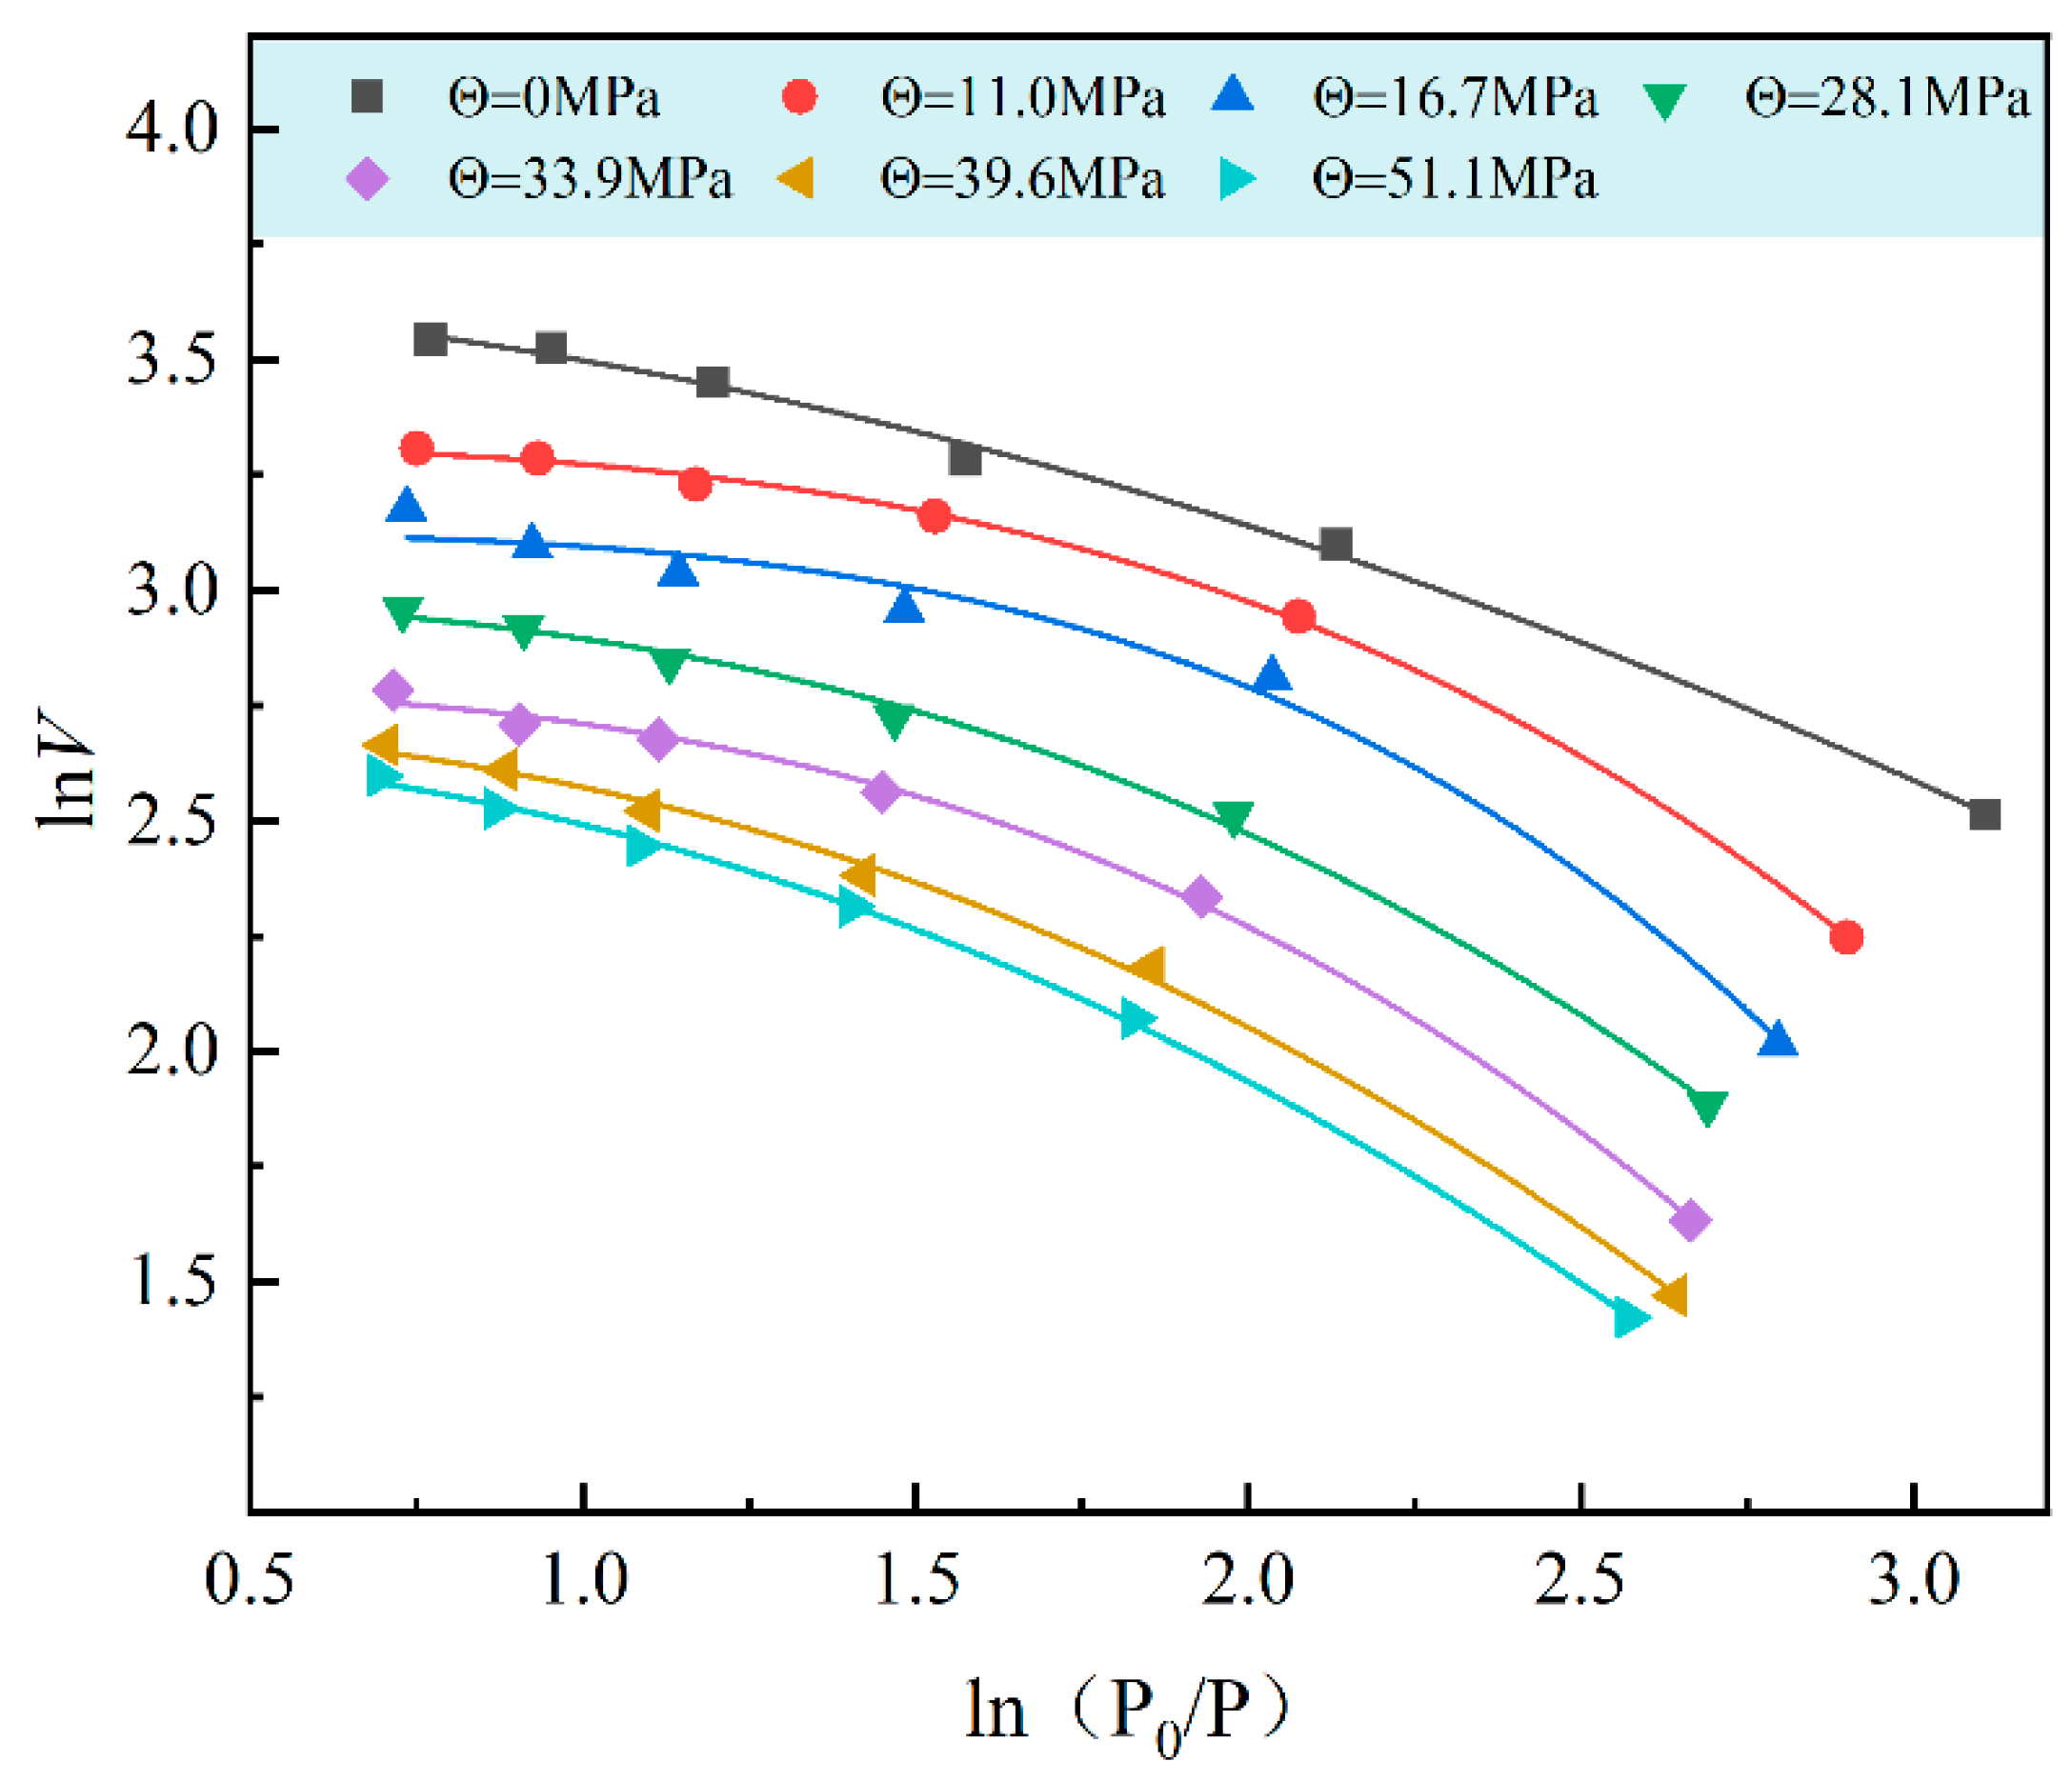
In order to verify whether the gas adsorption isotherm of coal under different stress conditions conforms to the equation, the equation is deformed, and the logarithm is taken to obtain the following [29,30]:
ln V = ln V 0 R T E n ln P 0 P n
V is the gas adsorption capacity, cm3/g; V 0 is the maximum gas adsorption capacity, cm3/g; R is the gas constant, 8.314 J/(mol‧K); for the experimental temperature, take 303.15 K; E is the characteristic adsorption energy, J/mol; P is the adsorption equilibrium pressure, MPa; P0 is the saturated vapor pressure of methane, MPa; n is a constant, reflecting the degree of unevenness on the coal surface.
The saturated vapor pressure of methane is calculated using Dubinin’s formula [29]:
P 0 = P c T T c 2
To verify whether the gas adsorption isotherms of coal under different stress conditions conform to the D-A equation, it is known from the D-A equation that the saturated vapor pressure of methane must be known to calculate the adsorbed amount of gas. According to Equation (8), the critical pressure of methane is 4.6 MPa and the critical temperature is 190.56 K for calculating the vapor pressure of methane. Draw the experimental adsorption data as a scatter plot using the horizontal axis and the vertical axis and fit the experimental data to obtain an isothermal adsorption curve, as shown in Figure 11.
From Figure 11, it can be seen that the variation pattern of the maximum gas adsorption V0, obtained by fitting the D-A equation, is consistent with the fitting result of the Langmuir equation. As the volume stress Θ increases, the maximum gas adsorption of coal gradually decreases, and the decrease amplitude gradually becomes gentle. However, the maximum gas adsorption capacity obtained by fitting the D-A equation is generally smaller than the fitting result of the Langmuir equation. The reason for this is that the maximum gas adsorption capacity obtained by fitting the D-A equation represents the amount of gas adsorbed by the micropores of the coal sample, while the adsorption constant obtained by fitting the Langmuir equation reflects the gas adsorption capacity of all the pores in the coal sample. Therefore, it is normal for the maximum adsorption capacity of the D-A equation to be smaller than the limit of the adsorption capacity of the Langmuir equation. As the volume stress increases, the constant reflecting the unevenness of the coal surface shows a decreasing trend overall. The reason is that the increase in volume stress causes the coal matrix and skeleton matrix to gradually shrink, leading to a decrease in the unevenness of the coal.

3.3.3. Freundlich Equation Fitting of Adsorption Data

The Freundlich empirical formula is a pure mathematical expression that is widely used due to its simple form of expression [31]. The Freundlich equation is shown in Equation (9):
V = K b P n
n is the Freundlich model parameters; K b is the binding constant. Plot the adsorption experimental data into a scatter plot using the adsorption equilibrium pressure as the x-axis and the adsorption capacity as the y-axis. Fit the experimental data to obtain an isothermal adsorption curve, as shown in Figure 12.
From Figure 12, it can be seen that the correlation coefficient of the Freundlich equation fitting is the lowest at 0.8838 and the highest at 0.9883. The combination constant K b gradually decreases and the change tends to be gentle with the increase in volume stress. For the parameter n of the Friedrich model, as the volume stress increases from 0 MPa to 51.1 MPa, the model parameter n shows an approximately linear positive correlation with the increase in volume stress.

3.3.4. Comparison of Isothermal Adsorption Equations

In order to objectively evaluate the accuracy of the Langmuir model, D-A model, and Freundlich empirical formula fitting equations, the average relative error E m r was used to quantitatively compare the gas adsorption capacity of coal in the three fitting equations. The calculation formula is as follows:
E m r = 1 N i = 1 N V i V e V i × 100 %
E m r is the average relative error, %; Vi is the experimental value of the gas adsorption capacity of coal, cm3/g; Ve is the fitted value of the gas adsorption capacity of coal, cm3/g; N is the number of adsorption experiments under a certain stress.
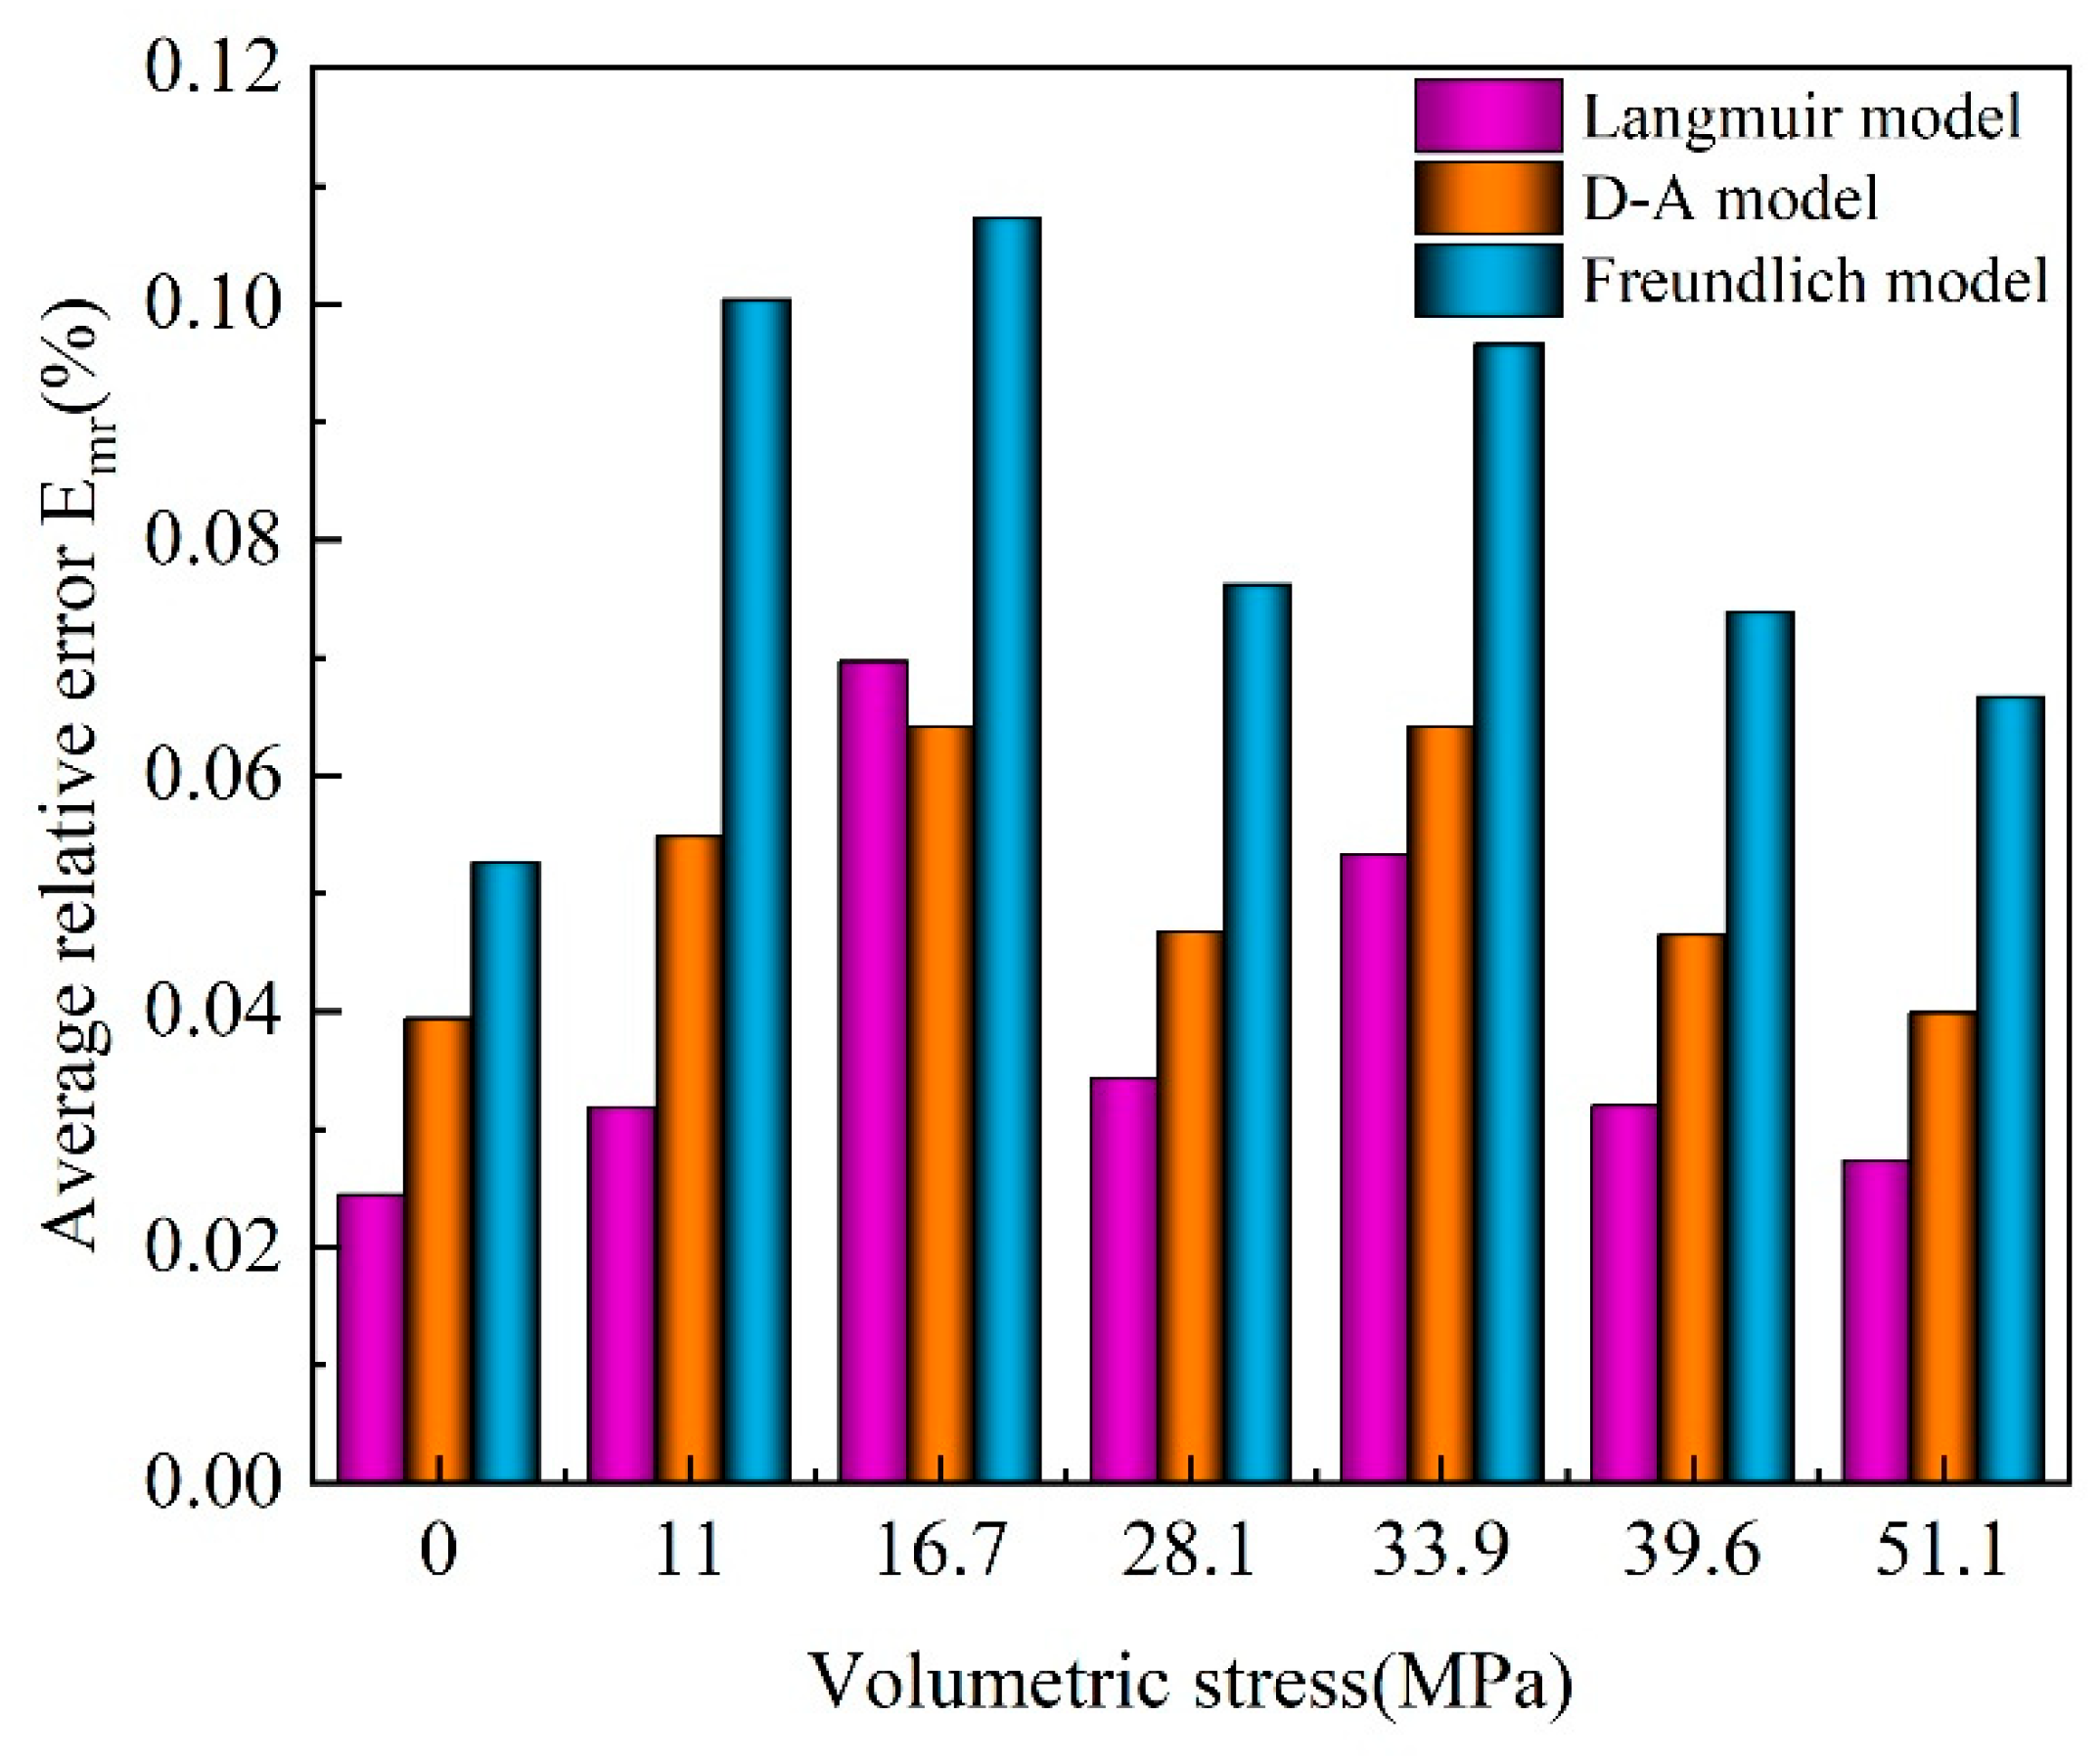
This study only lists the measured and fitted equation gas adsorption values of coal under a volume stress of 11.0 MPa, as shown in Table 1. The average relative error between the measured and calculated results under other volumetric stresses is shown in Figure 13.
The theoretical data of coal gas adsorption under different stress effects were calculated using the Langmuir model, D-A model, and Freundlich empirical formula and compared with the experimental results. It is not difficult to see from Figure 13 that the average relative error of the Langmuir model is smaller than that of the D-A model and Freundlich empirical formula, indicating that the Langmuir equation can better represent the experimental data of coal gas adsorption under different stress effects.

3.4. Indirect Method for Measuring Coal Seam Gas Content

In the large pores and cracks of coal, gas mainly exists in a free state. Its content is mainly controlled by factors such as the temperature, pressure, and porosity, satisfying the gas state equation. Its gas content can be expressed as follows [22]:
X y = V a P T 0 T P 0 Z
X y is the free gas content of coal, cm3/g; Va is the pore volume per unit mass of coal, cm3/g; P is the gas pressure, MPa; T 0 , P 0 is the absolute temperature (273.15 K) and pressure (0.101325 MPa) under standard conditions; T is the temperature of the coal seam, K.
Among them, the pore volume per unit mass of coal can be expressed as follows [29,30]:
V a = φ ρ
φ is the porosity of coal, %; ρ is the coal reservoir density g/cm3.
Furthermore, considering the influencing stress factors, the Langmuir equation can be used to calculate the gas adsorption capacity of coal, which can be characterized as follows:
V = a b P 1 + b P × η
η is the stress correction coefficient and is dimensionless; Θ is the volume stress, MPa.
The use of the stress correction factor as a function of volumetric stress is expressed as follows:
η = e 0.02379 Θ
Substituting Equation (14) into Equation (13) yields the following:
V = a b P 1 + b P e 0.02379 Θ
The relationship between a and b and the volumetric stress can be determined through the following experiments.

3.4.1. Calculation of Free Gas Quantity Under Stress Influence

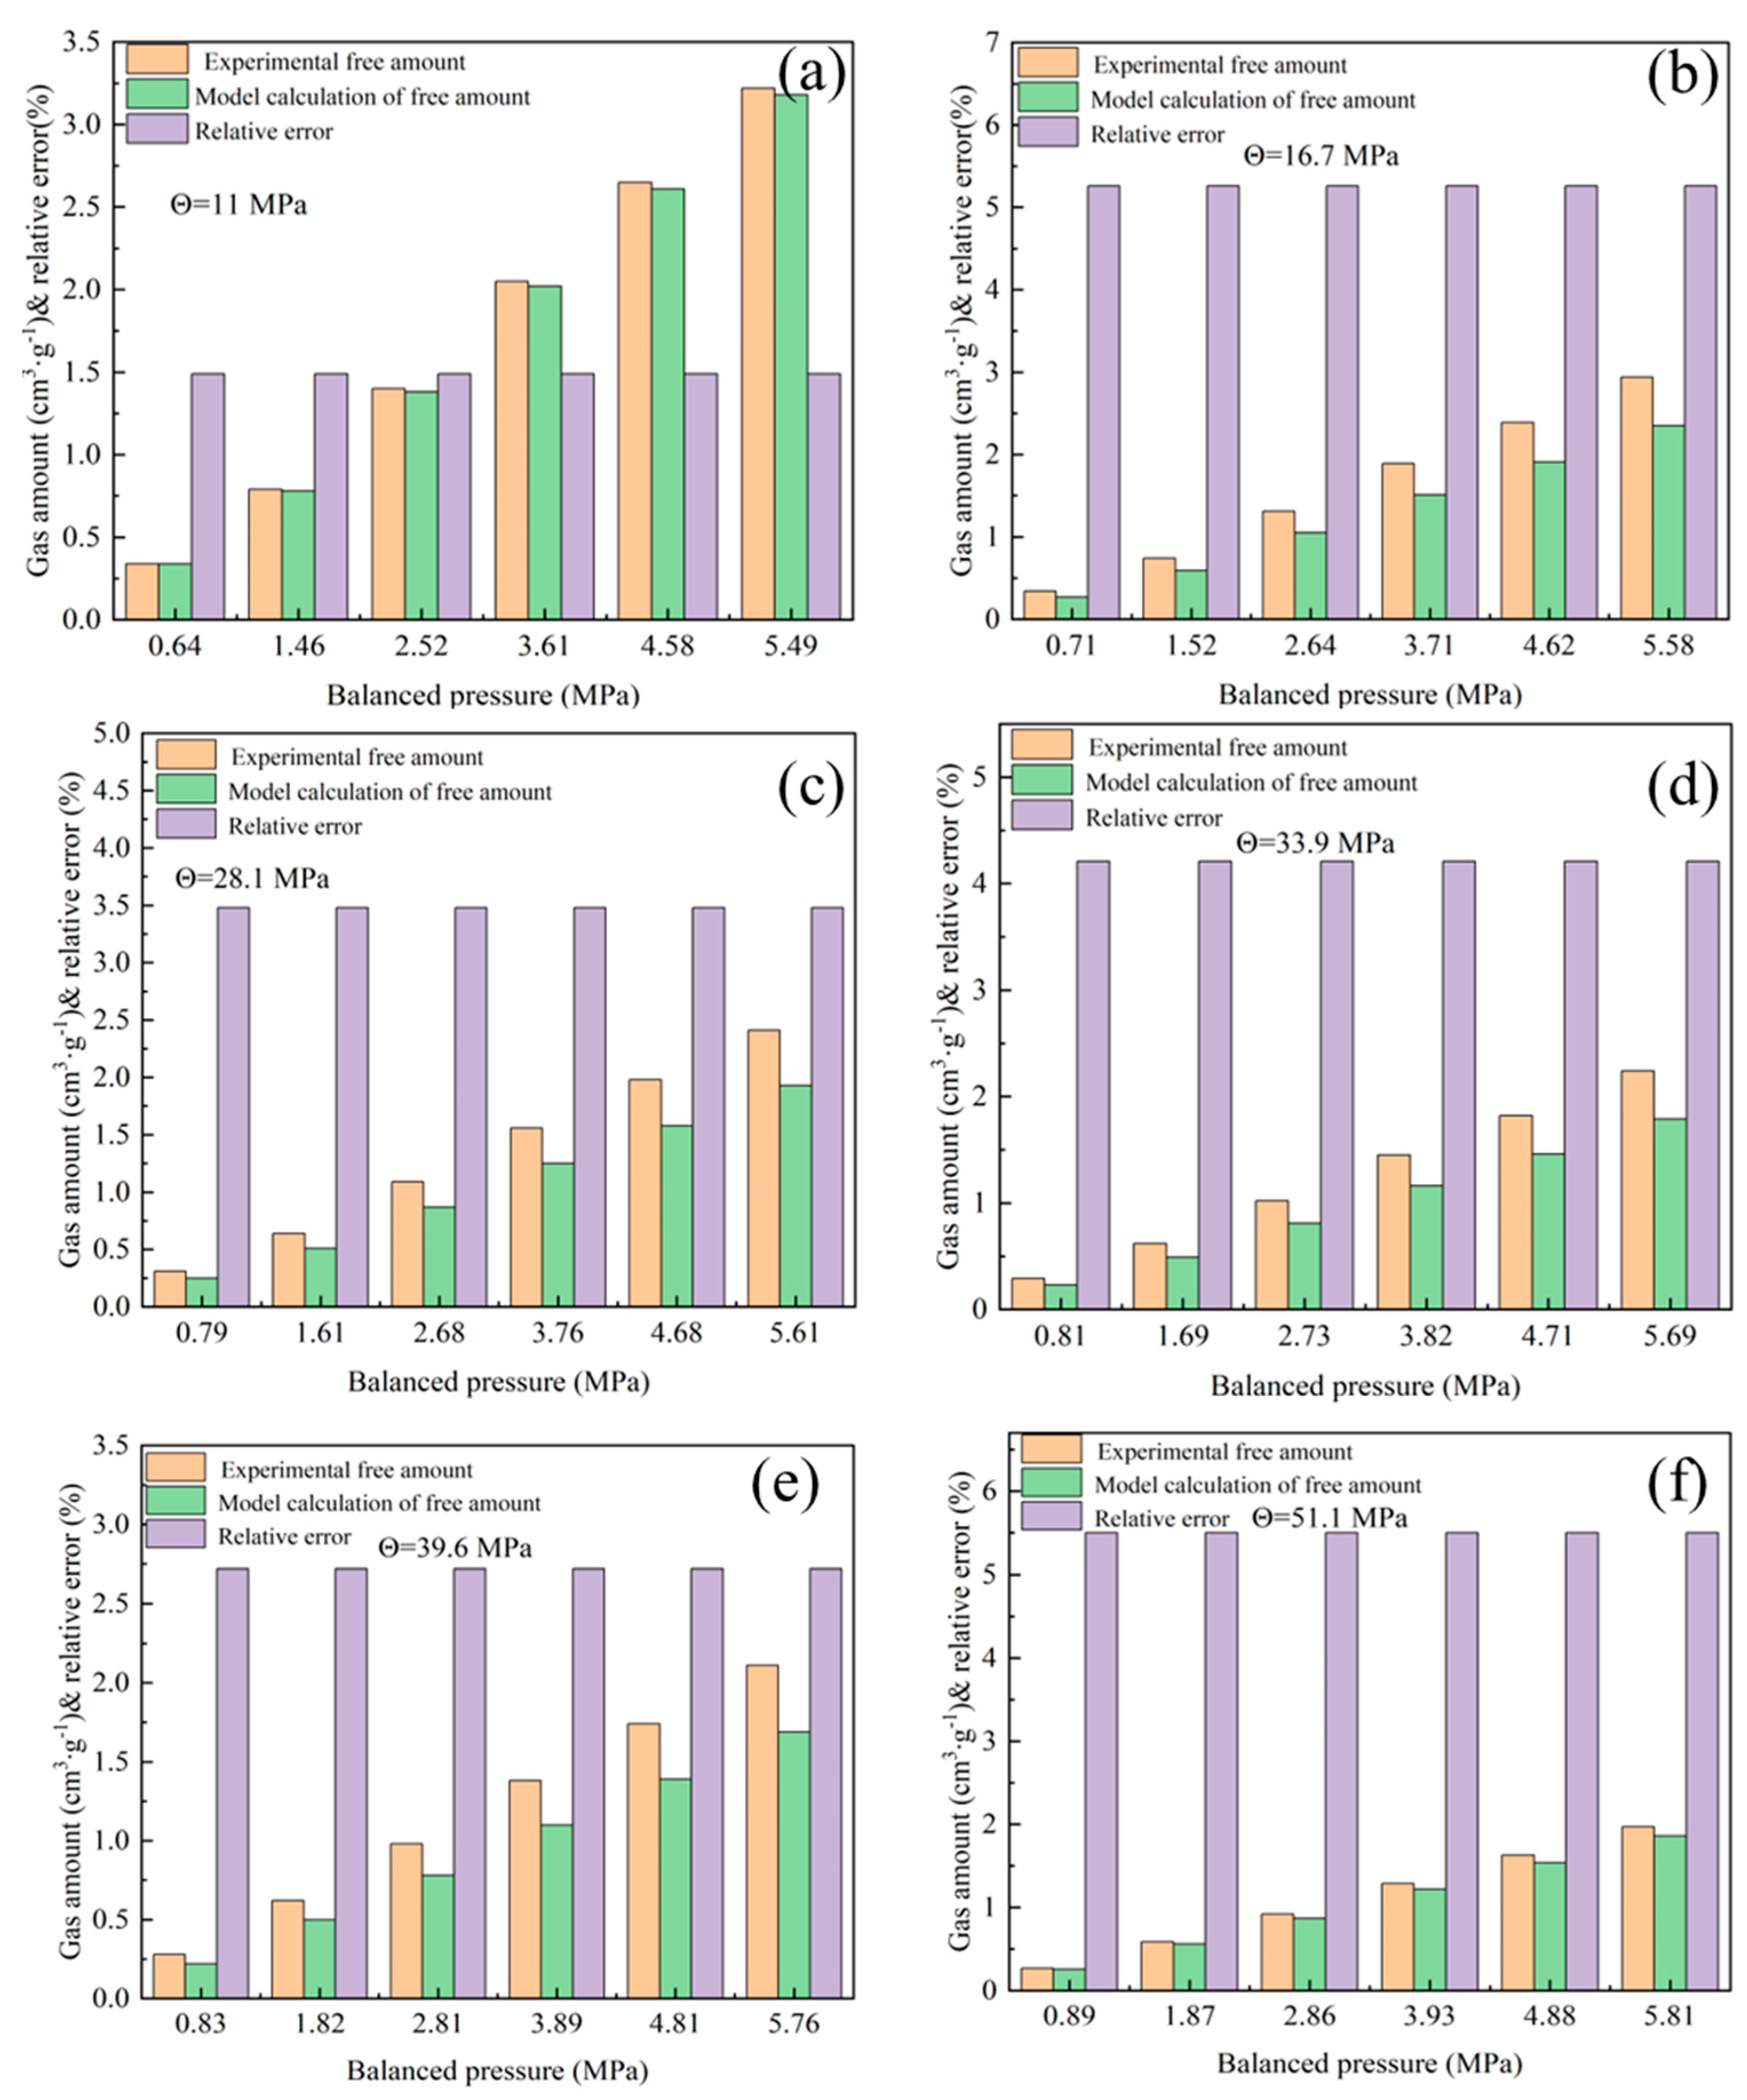
Measure the free gas content during the experiment under a volume stress range of 11.0–51.1 MPa and compare it with the calculation of the free gas content of coal under different stress conditions. The porosity of coal plays an important role in calculating the free gas content and is also a key factor in the error between model calculation values and experimental values. Figure 14 shows the model calculation and experimental test values of the free gas content of coal under different stresses. When the volume stress is 11.0 MPa, the relative error is 1.49%, and when the volume stress is 16.7 MPa, the relative error is 5.26%. The volumetric stress is 28.1 MPa, with a relative error of 3.48%. When the volumetric stress is 33.9 MPa, the relative error is 4.21%. The volumetric stress is 39.6 MPa, with a relative error of 2.72%. When the volumetric stress is 51.1 MPa, the relative error is 5.50%. The average relative error between the calculated free gas content and the experimental free gas content under different volume stresses is 3.78%, indicating that the model can characterize the relationship between the free gas content and volume stress more accurately.

3.4.2. Calculation of Gas Adsorption Capacity of Coal Under Stress Influence

In order to improve the accuracy of the prediction results more intuitively, the experimental results of the coal gas adsorption under different stress effects were compared with the prediction results based on the influencing Langmuir stress factor. The coefficient formulas for a and b obtained above were used, and their relative errors were calculated to determine the accuracy of the model. The results are shown in Figure 15. The maximum error between the calculated gas adsorption capacity model of coal under different stress conditions and the experimental test value is 9.22%, and the minimum error is 0.06%. The volumetric stress is 11.0 MPa, with an average relative error of 4.76%. The volumetric stress is 16.7 MPa, with an average relative error of 3.64%. The volumetric stress is 28.1 MPa, with an average relative error of 5.57%. The volumetric stress is 33.9 MPa, with an average relative error of 2.57%. The volumetric stress is 39.6 MPa, with an average relative error of 1.63%. The volumetric stress is 51.1 MPa, with an average relative error of 6.15%. The average relative error between the calculated adsorption capacity of the model and the experimental adsorption capacity under different volume stresses is 4.54%, indicating that the model can characterize the relationship between the gas adsorption capacity and volume stress more accurately.

4. Conclusions

In this study, the pore volume and specific surface area of raw coal and coal samples from surfaces with stress-concentrated fractures were measured by mercury injection and the liquid nitrogen method. The axial pressure increased from 7 MPa to 12 MPa, and the porosity decreased by 0.52. When the axial pressure increased by 1 MPa, the porosity decreased by 0.104 on average. When the confining pressure increased from 10 MPa to 15 MPa, the porosity of the coal decreased by 0.66. When the confining pressure increased by 1MPa each time, the porosity decreased by 0.132 on average. Based on the isothermal adsorption experimental data of coal under different stresses, the Langmuir equation, D-A equation, and Freundlich empirical formula were used to fit the data. It was found that the Langmuir equation, D-A equation, and Freundlich empirical formula all have a high degree of fit to the experimental data of coal isothermal adsorption under different stress conditions, and all of them are good representations of the coal isothermal adsorption experiments under different stress conditions. By calculating the theoretical data of coal gas adsorption under different stresses with three equations and comparing them with the experimental data, it was found that the average relative error of the Langmuir model was <D-A model < Freundlich empirical formula, indicating that the Langmuir equation can describe the law of coal gas adsorption under different stresses more accurately. The relationship between the adsorption constants a and b and the volume stress was determined. The Langmuir equation was used to fit the adsorption constants a and b of the coal under different stresses, and the amounts of free gas and adsorption under different volume stresses were calculated. The average relative error between the calculated free amount and the experimental free amount of the model under different volume stresses was 3.78%, indicating that the model can characterize the relationship between the free amount of gas and volume stress more accurately. The average relative error between the calculated adsorption capacity of the model and the experimental adsorption capacity under different volume stresses is 4.54%, indicating that the model can characterize the relationship between the gas adsorption capacity and volume stress more accurately.

Author Contributions

Conceptualization, S.-K.R.; Methodology, L.-J.Q., H.-Q.Z., J.-F.S. and S.-K.R.; Validation, L.-J.Q., J.-F.S. and S.-K.R.; Formal analysis, L.-J.Q. and S.-K.R.; Investigation, H.-Q.Z. and S.-K.R.; Resources, J.-F.S. and S.-K.R.; Data curation, H.-Q.Z. and J.-F.S.; Writing—original draft, L.-J.Q. and J.-F.S.; Writing—review & editing, L.-J.Q.; Supervision, J.-F.S.; Project administration, H.-Q.Z.; Funding acquisition, H.-Q.Z. All authors have read and agreed to the published version of the manuscript.

Funding

This research received no external funding.

Data Availability Statement

Data is contained within the article.

Acknowledgments

The authors are very grateful for the funding from the high-level talent introduction fund of Qingdao University of Technology.

Conflicts of Interest

Author Shao-Kui Ren was employed and studied by the company China Coal Science and Engineering Group, Shenyang Research Institute, and the author declares that there are no competitive financial interests. The remaining authors declare that the research was conducted in the absence of any commercial or financial relationships that could be construed as a potential conflict of interest.

References

  1. Perera, M.S.A.; Ranjith, P.G.; Choi, S.K.; Airey, D.A. Numerical Simulation of Gas Flow Through Porous Sandstone and Its Experimental Validation. Fuel 2011, 90, 547–554. [Google Scholar] [CrossRef]
  2. Viete, D.R.; Ranjith, P.G. The Effect of CO2 On the Geomechanical and Permeability Behaviour of Brown Coal: Implications for Coal Seam CO2 Sequestration. Int. J. Coal Geol. 2006, 66, 204–216. [Google Scholar] [CrossRef]
  3. Li, Z.Q.; Liu, Y.; Xu, Y.P. Investigation of Methane Diffusion in Low-Rank Coals by a Multiporous Diffusion Model. J. Nat. Gas Sci. Eng. 2016, 33, 97–107. [Google Scholar] [CrossRef]
  4. Li, X.C.; Li, Z.B.; Ren, T.; Nie, B.S.; Xie, L.; Huang, T. Effects of Particle Size and Adsorption Pressure on Methane Gas Desorption and Diffusion in Coal. Arabian J. Geosci. 2019, 12, 794. [Google Scholar] [CrossRef]
  5. Wang, L.; Cheng, L.B.; Cheng, Y.P.; Liu, S.M.; Guo, P.K.; Jin, K. A New Method for Accurate and Rapid Measurement of Underground Coal Seam Gas Content. J. Nat. Gas Sci. Eng. 2015, 26, 1388–1398. [Google Scholar] [CrossRef]
  6. Yao, Y.B.; Liu, D.M.; Yan, T.T. Geological and Hydrogeological Controls on the Accumulation of Coalbed Methane in the Weibei field, southeastern Ordos Basin. Int. J. Coal Geol. 2014, 121, 148–159. [Google Scholar] [CrossRef]
  7. Li, Z.Q.; Liu, Y.; Xu, Y.P. Gas Diffusion Mechanism in Multi-Scale Pores of Coal Particles and New Diffusion Model of Dynamic Diffusion Coefficient. J. China Coal Soc. 2016, 41, 633–643. [Google Scholar]
  8. Li, B.B.; Yang, K.; Xu, P.; Xu, J.; Yuan, M.; Zhang, M. An Experimental Study on Permeability Characteristics of Coal with Slippage and Temperature Effects. J. Petrol. Sci. Eng. 2019, 175, 294–302. [Google Scholar] [CrossRef]
  9. Guo, H.J.; Yuan, L.; Cheng, Y.P.; Wang, K.; Xu, C.; Zhou, A.T. Effect of Moisture on the Desorption and Unsteady-State Diffusion Properties of Gas in Low-Rank Coal. J. Nat. Gas Sci. Eng. 2018, 57, 45–51. [Google Scholar] [CrossRef]
  10. Hou, S.H.; Wang, X.M.; Wang, X.J.; Yuan, Y.D.; Pan, S.D.; Wang, X.M. Pore Structure Characterization of Low Volatile Bituminous Coals with Different Particle Size and Tectonic Deformation Using Low Pressure Gas Adsorption. Int. J. Coal Geol. 2017, 183, 1013. [Google Scholar] [CrossRef]
  11. Mastalerz, M.; Hampton, L.; Drobniak, A.; Loope, H. Significance of Analytical Particle Size in Low-Pressure N2 and CO2 Adsorption of Coal and Shale. Int. J. Coal Geol. 2017, 178, 122–131. [Google Scholar] [CrossRef]
  12. Wang, L.G.; Cheng, Y.P.; Li, W.; Lu, S.Q.; Xu, C. Component Fractionation of Temporal Evolution in Adsorption-Desorption for Binary Gas Mixtures on Coals from Haishiwan Coal Mine. Int. J. Min. Sci. Technol. 2013, 23, 201–205. [Google Scholar] [CrossRef]
  13. Zhang, H.; Zhang, X.B.; Zhang, Y.G.; Wang, Z.Z. The Characteristics of Methane Adsorption Capacity and Behavior of Tectonic Coal. Front. Earth Sci. 2023, 10, 1034341. [Google Scholar] [CrossRef]
  14. Zhou, Y.A.; Sun, W.J.; Chu, W.; Liu, X.Q.; Jing, F.L.; Xue, Y. Theoretical Insight into the Enhanced CH4 Desorption via H2O Adsorption on Different Rank Coal Surfaces. J. Energy Chem. 2016, 25, 677–682. [Google Scholar] [CrossRef]
  15. Chen, X.J.; Liu, J.; Wang, L.; Qi, L.-L. Influence of Pore Size Distribution of Different Metamorphic Grade of Coal on Adsorption Constant. J. China Coal Soc. 2013, 38, 285–300. [Google Scholar]
  16. Zheng, C.; Ma, D.; Chen, Y. Research Progress Micro Effect of Water on Coalbed Methane Adsorption/Desorption. Coal Sci. Technol. 2023, 51, 256–268. [Google Scholar]
  17. Chen, C.G.; Xian, X.; Xian, X.F. The Dependence of Temperature to the Adsorption of methane on anthracite coal and its char. Coal Conver. 1995, 38, 89–92. [Google Scholar]
  18. Gan, H.; Nandi, S.P.; Walker, P.L., Jr. Nature of the Porosity in American Coals. Fuel 1972, 51, 272–277. [Google Scholar] [CrossRef]
  19. Yuan, A.Y.; Yang, X.L.; Hou, J.L.; Fu, G.S. Comprehensive Characterization of Pore Structure in Coal Seams with Abnormal Gas Emission in Deep Close Range Coal Seam Clusters. Coal Sci. Tech. 2024, 1–12. [Google Scholar]
  20. Gensterblum, Y.; Merkel, A.; Busch, A.; Krooss, B.M. High-Pressure CH4 and CO2 Isotherms as a Function of Coal Maturity and the Influence of Moisture. Int. J. Coal Geol. 2013, 118, 45–57. [Google Scholar] [CrossRef]
  21. Zhong, L.W.; Zhang, H.; Yun, Z.R. Influence of Specific Pore Area and Pore Volume of Coal on Adsorption Capacity. Coal Geol. Explor. 2002, 30, 26–29. [Google Scholar]
  22. Wang, Q.; Wang, Z.F.; Dai, J.H.; Zhang, K.J.; Wang, L.L. Study on Methane Adsorption Characteristics of Anthracite in Deep Coal Seam. Saf. Coal Mines 2021, 52, 28–33. [Google Scholar]
  23. Qin, L.; Wang, P.; Lin, H.F.; Long, H. Research on Fractal Characteristics of Coal Freezing with Low Temperature Liquid Nitrogen Using Nitrogen Adsorption Method and Mercury Intrusion Method. J. Mini Saf. Eng. 2023, 40, 184–193. [Google Scholar]
  24. Wang, Z.; Cheng, Y.; Zhang, K. Characteristics of Microscopic Pore Structure and Fractal Dimension of Bituminous Coal by Cyclic Gas Adsorption/Desorption: An Experimental Study. Fuel 2018, 232, 495–505. [Google Scholar] [CrossRef]
  25. Yao, Y.; Liu, D.; Tang, D. Fractal Characterization of Adsorption-Pores of Coals from North China: An Investigation on CH4 Adsorption Capacity of coals. Int. J. Coal Geol. 2008, 73, 27–42. [Google Scholar] [CrossRef]
  26. Dubinin, M.M. The Potential Theory of Adsorption of Gases and Vapors for Adsorbents with Energetically Nonuniform Surfaces. Chem. Rev. 1960, 60, 235–241. [Google Scholar] [CrossRef]
  27. Song, S.B.; Liu, J.F.; Yang, D.S.; Ni, H.Y.; Huang, B.X.; Zhang, K. Pore Structure Characterization and Permeability Prediction of Coal Samples Based on SEM Images. J. Nat. Gas Sci. Eng. 2019, 67, 160–171. [Google Scholar] [CrossRef]
  28. Langmuir, I. The adsorption of Gases on Plane Surfaces of Glass, Mica and Platinum. J. Am. Chem. Soc. 1918, 40, 1361–1403. [Google Scholar] [CrossRef]
  29. Brunauer, S.; Emmett, P.H.; Teller, E. Adsorption of Gases in Multimolecular Layers. J. Am. Chem. Soc. 1938, 60, 309–319. [Google Scholar] [CrossRef]
  30. Sun, Y.H.; Jiang, Y.; Chen, J.H.; Cheng, J.Y.; Wang, H.M. Effect of Structure of Carbon Adsorbent on Desorption Amount of Natural Gas. Low Car. Chem. Chem. 2003, 1, 5–7. [Google Scholar]
  31. Dutka, B. CO2 and CH4 Sorption Properties of Granular Coal Briquettes Under in Situ States. Fuel 2019, 247, 228–236. [Google Scholar] [CrossRef]
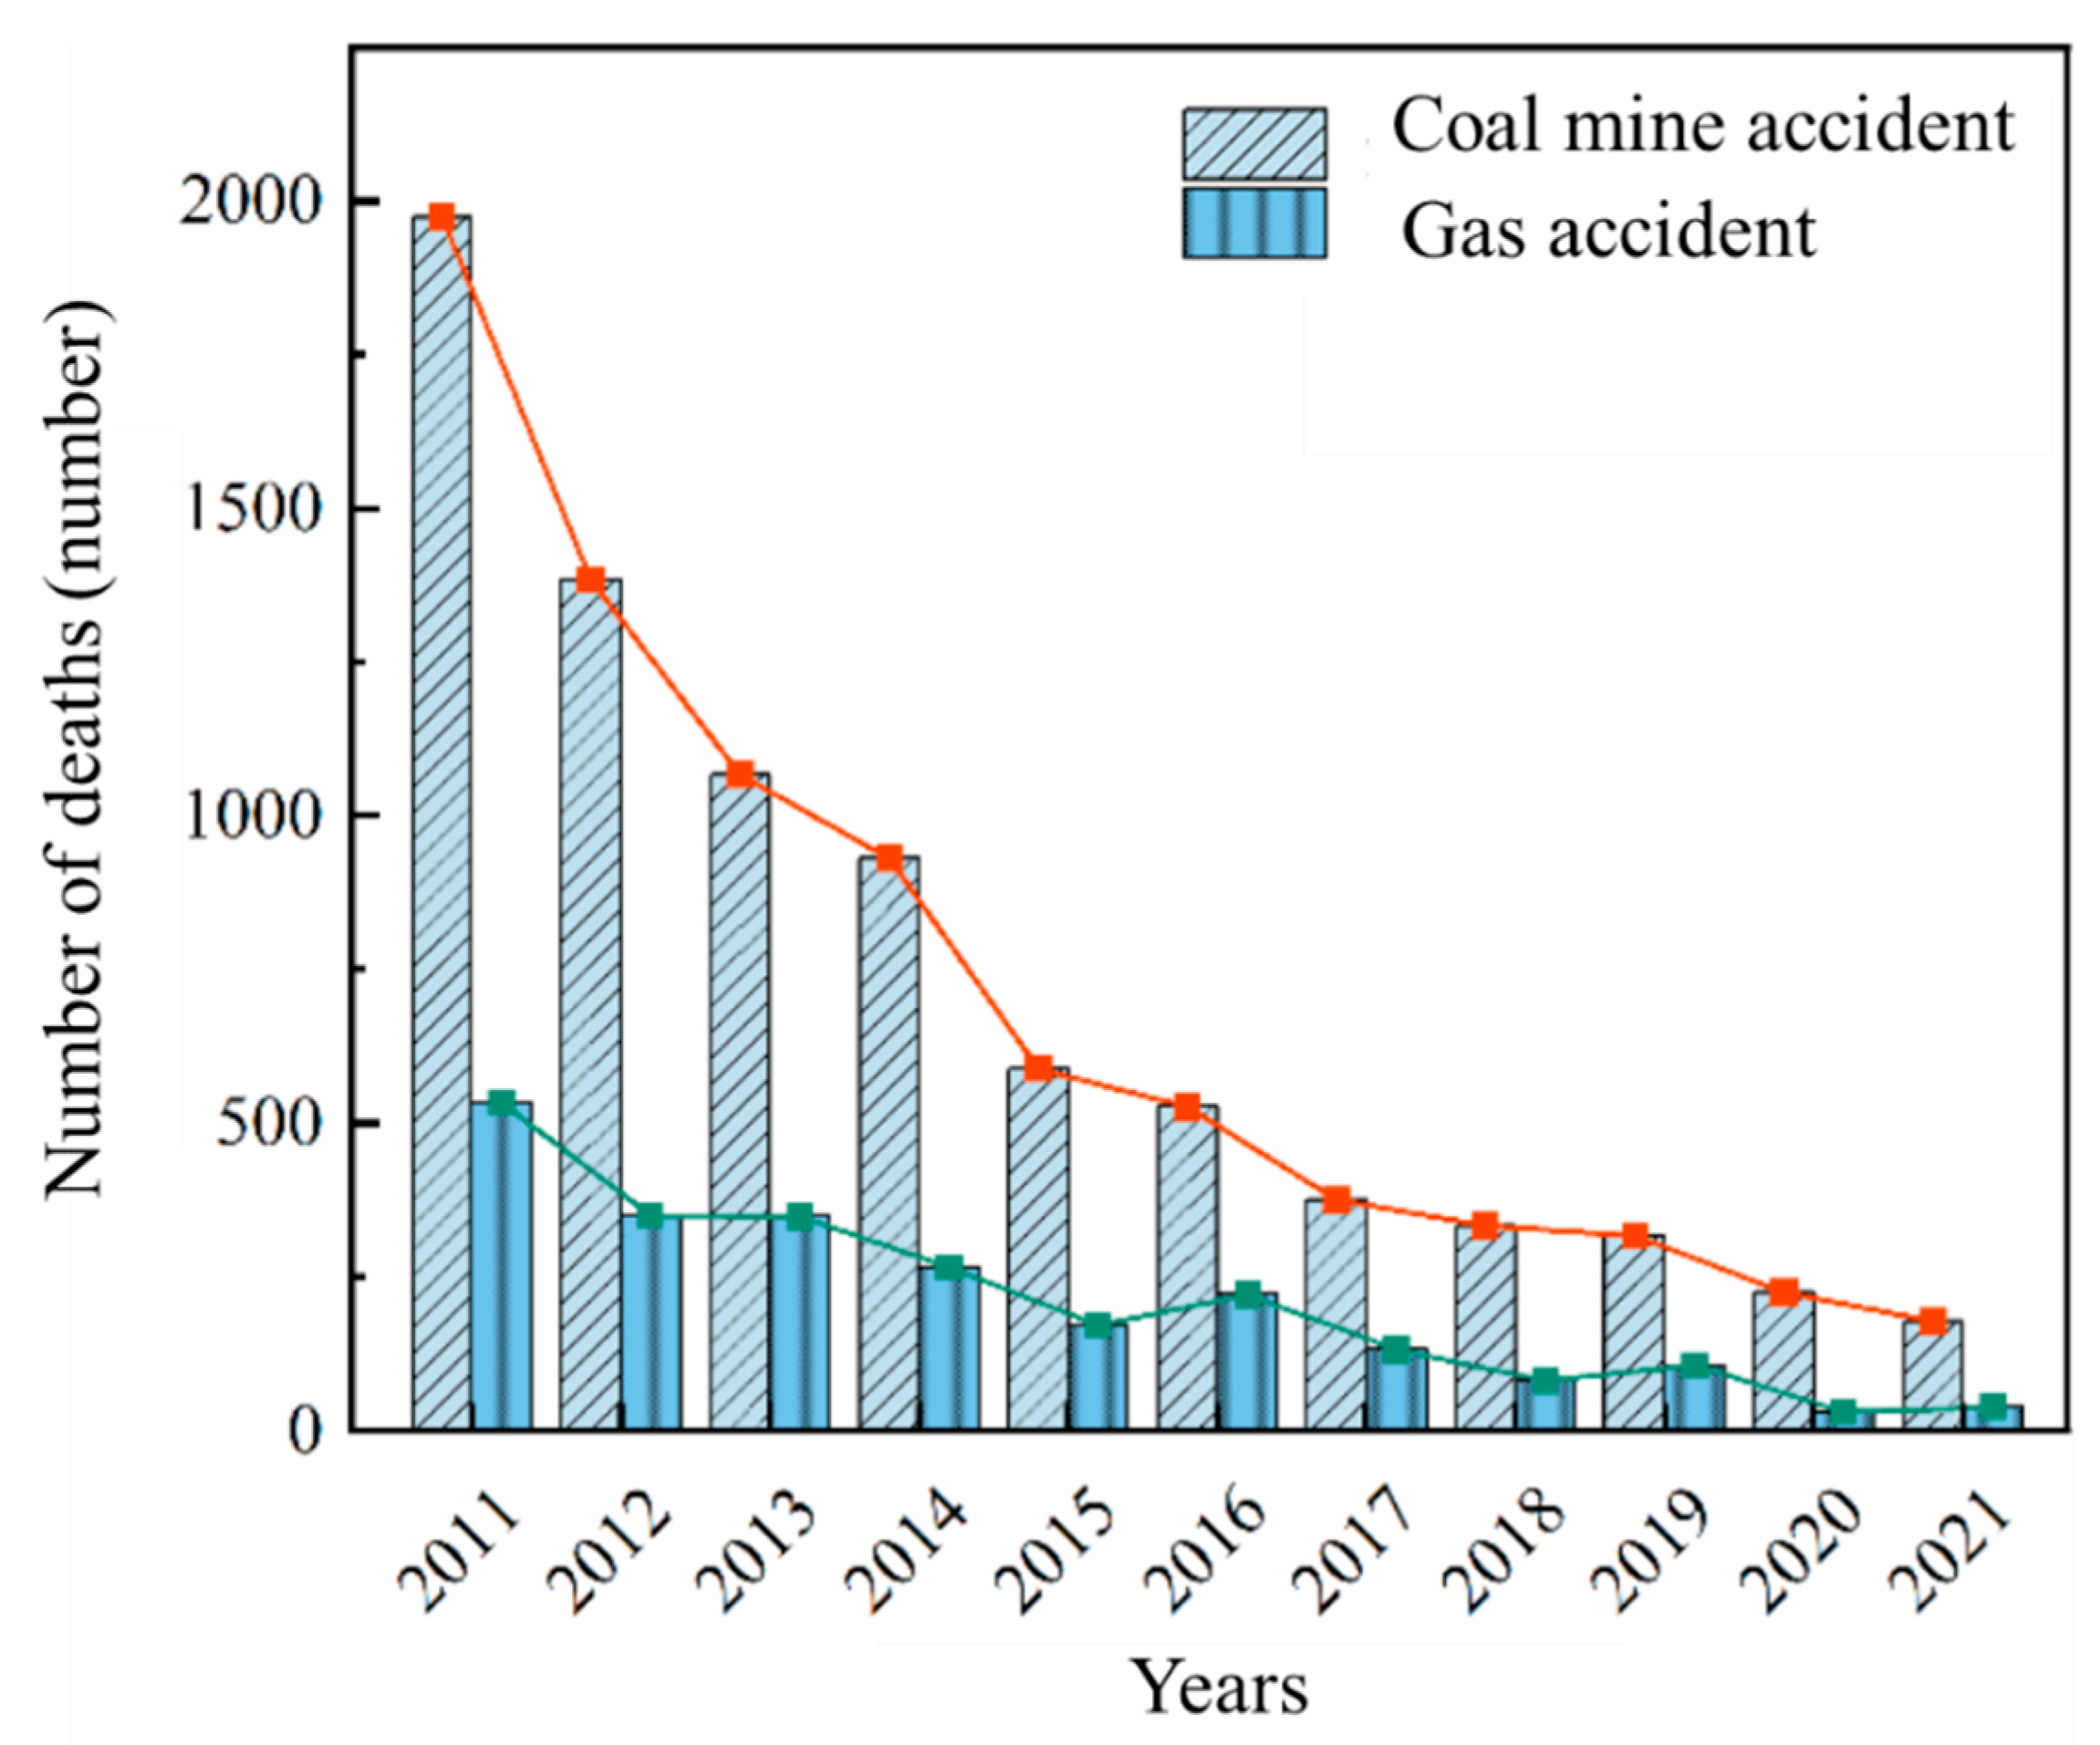
Figure 1. Death toll of coal mine accidents and gas accidents from 2011 to 2021.
Fuels 05 00038 g001
Figure 2. Sampling images and positions after stress load failure.
Fuels 05 00038 g002
Figure 3. Experimental platform for gas adsorption of coal under stress load.
Fuels 05 00038 g003
Figure 4. Stress loading method: (a) axial compression and (b) confining pressure.
Fuels 05 00038 g004
Figure 5. Gas isothermal adsorption experiment of coal under different stress effects using capacity method.
Fuels 05 00038 g005
Figure 6. Coal sample installation process.
Fuels 05 00038 g006
Figure 7. The different pore types of coal: (a) connection types of holes and (b) types of pore shapes.
Fuels 05 00038 g007
Figure 8. Variation trend in porosity of coal during axial compression loading: (a) confining pressure of 3MPa and (b) confining pressure of 5 MPa (two repeated experiments).
Fuels 05 00038 g008
Figure 9. Variation trend in porosity of coal during axial compression loading: (a) confining pressure of 3MPa and (b) confining pressure of 5 MPa (two repeated experiments).
Fuels 05 00038 g009
Figure 10. Langmuir fitting curve for gas adsorption data of coal under different stress conditions.
Fuels 05 00038 g010
Figure 11. D-A equation fitting curve for gas adsorption data of coal under different stress conditions.
Fuels 05 00038 g011
Figure 12. Freundlich equation fitting curve for gas adsorption data of coal under different stress conditions.
Fuels 05 00038 g012
Figure 13. The average relative error, Emr, between the measured and calculated results under different volume stresses.
Fuels 05 00038 g013
Figure 14. Comparison between experimental free gas adsorption of coal under different stresses and model’s calculated values: (a) 11 MPa; (b) 16.7 MPa; (c) 28.1 MPa; (d) 33.9 MPa; (e) 39.6 MPa; (f) 51.1 MPa.
Fuels 05 00038 g014
Figure 15. Comparison of experimental and model calculated values of gas adsorption of coal under different stresses: (a) 11 MPa; (b) 16.7 MPa; (c) 28.1 MPa; (d) 33.9 MPa; (e) 39.6 MPa; (f) 51.1 MPa.
Fuels 05 00038 g015
Table 1. Measurement and calculation results of gas adsorption capacity of coal under volume stress of 11.0 MPa.
Balanced Pressure/MPaExperimental Value/cm3 g−1Fitting Equation Adsorption Capacity/cm3 g−1
Langmuir ModelD-A ModelFreundlich Empirical Formula
0.649.4510.058.4412.49
1.4618.9617.9617.7517.23
2.5223.5822.5922.6221.32
3.6125.2425.3024.6724.53
4.5826.7226.8925.5226.92
5.4927.3127.9725.9328.89
Average relative error E m r /%3.195.4810.04
Disclaimer/Publisher’s Note: The statements, opinions and data contained in all publications are solely those of the individual author(s) and contributor(s) and not of MDPI and/or the editor(s). MDPI and/or the editor(s) disclaim responsibility for any injury to people or property resulting from any ideas, methods, instructions or products referred to in the content.