1. Introduction
With more stringent emissions regulations, and the increasing pressure on the industry to transition to electric and electrified vehicles, the feasibility of the ICE is one of the most prominent issues in the automotive industry at present. Despite the increased prevalence of electric vehicles, shortcomings in infrastructure, technological developments, and consumer engagement have limited the rate of transition. In this intermediate period, a solution to both appease legislative requirements and facilitate the increased development of the electrified infrastructure is required. Alternative fuels provide a viable solution to this pressing issue, with a particular focus on the use of biofuels in commercial Internal Combustion Engine (ICE) vehicles. Recent landmarks in the feasibility of biofuels have been achieved with the widespread adoption of E10 fuel on forecourts throughout the UK [
1], with the 10% bioethanol content being used to reduce harmful emissions such as CO
2 and NOx [
1,
2] and prolong the use of ICEs.
Biofuels are an alternative fuel comprising gasoline and a bioethanol additive, available in varying concentrations globally. The UK has recently adopted E10, a 10% bioethanol mixture, as a standard on forecourts, and projections show a greater reliance on these alternative fuels in the future [
3]. Biofuels allow the reduction in CO
2 emissions as they are assumed to be net carbon zero across their lifespan, with production techniques centered around the fermentation of natural biomass, such as sugar cane. The implementation of these fuels can now allow the prolonged use of ICEs by reducing their harmful output, and they go a long way to alleviating the fears of OEMs surrounding emissions legislation and fleet emissions fines into the millions of GBP.
The emissions standards that OEMs are currently striving to adhere to are focused on the reduction in carbon dioxide emissions, with fleetwide CO
2 emissions dictating potential fines for OEMs within the industry. Widespread legislative changes are expected to change the face of the industry, with an 80 g/km target set for 2025 and a further reduction to 60 g/km by 2030 [
4], and these impending changes are driving the industry to find new innovative solutions for the reduction in emissions. Alongside the adoption of biofuels, with their relative benefit to emissions, hardware developments have focused on the downsizing of the ICE to maximize efficiency and operate in more frugal regions, with higher brake mean effective pressures (BMEPs).
One potentially catastrophic side-effect of the use of biofuels, within modern, direct-injection downsized engines, is the prevalence of low-speed pre-ignition (LSPI). As a stochastic in the cylinder combustion phenomenon, LSPI is the uncontrolled autoignition of fuel before the initiation of the spark, leading to high peak pressures and the advent of knock and potentially damaging end-gas knock events. While being sporadic in nature, the recent development of the aforementioned downsized engines has increased the prevalence of this phenomenon, with the operating conditions and thermal environment providing the ideal opportunity for LSPI events. LSPI is also one of the major implications of the widespread adoption of higher-ethanol-content biofuels, for which there is minimal understanding, and it is the main area of focus of this report. Being a catastrophic event which impacts both the efficiency of the vehicle and the longevity of hardware, this is a pressing concern for OEMs and is currently an area of prominent focus in the design and development of new ICEs.
With the increased prominence of LSPI, OEMs encounter challenges in detecting and developing mitigating solutions, as the testing of the hardware is intrusive, expensive, and often damaging due to the nature of end-gas knock events. A non-intrusive and cost-effective method of understanding the fundamentals of LSPI, and following best design practices for mitigation, is the use of engine modeling software. The minimization of destructive testing is a key consideration when developing the next generation of ICEs, where the development of an accurate simulation tool can revolutionize the concept development cycle and provide a modular solution for the efficient design of hardware.
Key considerations when developing a simulation tool surround the real-world relevance of the data and the ability to accurately simulate the inherent variability within the engine operation envelope. The work completed in this study is future-proofed and accommodates rapid technological developments expected throughout the industry considering further electrification and low emissions requirements.
This paper primarily focuses on the role of biofuel concentration on LSPI, and the fundamental driving factors influencing both the severity and frequency of LSPI events in a representative downsized gasoline engine. This is achieved through the development of a 1D engine simulation tool created in the Ricardo WAVE simulation tool, with the use of real-world LSPI and operational data to ensure the real-world relevance and accuracy of the generated results.
Section 2 addresses the current industry understanding and findings on LSPI, with the controversy surrounding the effects of biofuels and the key determining factor in LSPI initiation, while considering the role of the Ricardo WAVE simulation tool in this study and existing studies surrounding the application of the software in engine, and LSPI, testing.
Section 3 covers the main body of this report, analyzing the technical achievement throughout the project. The development of the model tool is detailed, with comparisons to real-world data being used for ratification of the applicability of the tool. The primary findings highlight the overall trend in bioethanol content and LSPI, considering both the frequency and severity of events, and the probability of LSPI events developing into catastrophic end-gas knock events. A more in-depth analysis is then conducted into the driving factors behind these trends to highlight the dominant trends and causes. A study into mitigating techniques, primarily focusing on the role of double injection and pilot injections, provides insight into future strategies in fighting LSPI, and
Section 4 presents the conclusions found in this study and future work and recommendations found as a consequence of this study.
2. Background
LSPI is a relatively new phenomenon. The fundamental driving factor in modern gasoline engines is the downsizing of hardware and the increase in BMEPs [
5]. LSPI is also deemed to be a sporadic, or stochastic, phenomenon, capable of leading to end-gas knock events that would likely have catastrophic effects on the longevity of ICEs [
6]. Studies have been conducted on the fundamental principles of LSPI [
7], as well as specific studies on the effect of fuel composition and its role in the phenomenon. The industry currently focuses on the role of fuel–lubricant interactions [
5,
8,
9], particularly looking at hotspots on the cylinder wall, caused by both fuel–lubricant interactions and the presence of particulate matter [
10]. Further credence is given to the use of dual-injection strategies in a mitigating capacity.
This study is motivated by [
6,
8,
9] on the viability of this technique within the simulation tool.
Both experimental and numerical techniques for LSPI identification and testing exist in industry, albeit with a current primary focus on experimental techniques. This trend highlights the gap in the industry for a well-developed simulation tool to exist, which is a motivation for this study in which the feasibility of a simulation tool is analyzed.
Agreement exists on the primary operational region to analyze, between 1000 and 3000 rpm [
6], where BMEPs fluctuate between 10 and 22 bar [
6] and LSPI events are most prevalent. Steady-state testing is the most common type in LSPI detection, although Haenel et al. [
6] developed a transient cycle to give more real-world credence to the results of their study, a decision that highlights the quality of their work and that informed the decision to include a transient operation test in this study. Haenel at al. [
5] also took a pioneering approach to the implementation of an LSPI detection algorithm which considers a 2% mass fraction burned in the 5-crank-angle-degree window prior to TDC as the initiation of an LSPI event. Other research only considered occurrences that resulted in an end-gas knock event, defined by surpassing a threshold pressure, such as LSPI [
6,
9], which can eliminate less severe LSPI events and minimize potentially viable data that can further understanding.
The final consideration in the experimental methodology is the use of control conditions and the potential for the isolation of variables to allow a more in-depth analysis of the governing mechanisms behind LSPI. Different approaches include the stringent control of operational conditions like ambient and operating temperatures, alongside the control of fuel injection [
5,
9,
10], while other approaches consider the application of a variable test program, cyclically changing operating conditions, and an injection strategy [
7,
8,
11,
12,
13,
14] to understand each individual impact on LSPI. In this study, a hybrid approach of running baseline-controlled tests, followed by investigating variable isolation, harnesses the benefits of each approach. Studies also exist on the role of biofuels in both LSPI and traditional knock events [
5,
7,
8,
15,
16].
A great focus in a range of papers was the role of fuel–lubricant interactions [
7,
8,
9,
13], with a particular focus on the interaction of fuel droplets within the fluid film layer [
8,
9]. Conclusions centered around an increased LSPI frequency due to impingement hotspots on the cylinder wall initiating autoignition of the fuel. Alongside this, and in direct relation to this study, the effects of bioethanol concentration also focused on the likelihood of impingement, with the chemical composition of the bioethanol deemed a likely cause of increased wall wetting [
8,
9] and, in turn, an increased impingement likelihood. Another aspect directly tied to the chemistry of bioethanol is the laminar flame speed [
5,
10] within the combustion phase and its impact on LSPI intensity, which is a key consideration, with higher-intensity LSPI events being the most pressing concern due to the potential for high-damage scenarios for the hardware.
One hypothesis was the correlation between bioethanol concentration and LSPI frequency centered around the charge cooling effect of the ethanol and the consequential increased wall impingement [
8,
9].
Haenel et al. [
5], however, also identified the unusual trend in LSPI severity, where the critical blends were E20 and E30, with a relatively high frequency and severity, and with others ratifying this finding, suggesting that charge cooling [
5] and flame speed impacts [
5,
10] caused the E50 fuel to have a larger LSPI frequency, but with fewer significant end-gas knock events. These findings informed the test matrix for this study, focusing on these critical blends and extreme blends of high and low bioethanol concentrations. In complete contrast to these findings, increasing the LSPI frequency with ethanol content [
8,
10,
17,
18] has also been apportioned to the decreased volatility of the bioethanol composition [
8], resulting in a lower probability for autoignition prior to TDC. One non-combustion-related reason for this could be the previously mentioned detection algorithms not allowing the detection of low-level LSPI events, not resulting in an end-gas knock event. In this circumstance, the correlation between these findings and those of Haenel et al. [
5] could be apportioned to the decreasing severity of LSPI events in high-concentration blends. As most LSPI testing solutions are currently experimental, a gap in the market is highlighted for an effective simulation tool capable of providing a non-intrusive numerical simulation able to effectively emulate test cell data.
3. Model Development
The development of an effective and efficient simulation tool is key to the success of this project, with the key project aims and deliverables dependent on the success of the tool developed.
The simulation tool was built within the Ricardo Wave software environment, utilizing the built-in flow networks to effectively represent real-world parameters of a representative downsized gasoline direct-injection engine. By integrating VECTIS RFlame auto-ignition delay tables [
19] with the advanced kinetics sub-model, the LSPI and autoignition phenomena could be accurately represented, with the simulation data output to MATLAB for post-processing and analysis. A diagram detailing the high-level operation of the simulation tool is shown in
Figure 1.
The Ricardo Wave domain handles the management of engine operation and flows, while accommodating the auto-ignition delay tables generated within Rflame through the application of the detailed kinetics knock sub-model and a pre-established communication network. The engine geometry, shown in
Figure 2, consists of a series of junctions, with communicable boundary conditions and controlled flow, allowing the accurate simulation of engine operation.
Ambient conditions for the model, along with cylinder and engine block geometry, are defined from both real-world operational data and engine-specific documentation. Operational parameters are set via a case execution, with differing cases, detailed in the test matrix for this study, allowing the efficient updating and modification of the tool for an array of scenarios. Other operational data, specifically surrounding heat transfer and combustion modeling, are defined initially before a tuning process is completed to align output data with relevant real-world test data, detailed below.
In addition to the detection window, this method encompasses a rolling average to isolate events with a deviation from the previous 50 cycles of more than 20%. When detecting an event, the algorithm highlights this cycle as an LSPI event, and then excludes this value and the following values deviating from the mean from the subsequent rolling average to ensure that future events are measured from the quasi-average combustion cycle. An illustration of the detection zone and LSPI cycle compared to a normal combustion cycle is shown in
Figure 3.
Individual LSPI detections are saved as events, with the core operational data summarized in the form of peak pressure; the start of ignition, defined as the point where the pressure difference from the rolling average supersedes the 20% threshold; and the cycle number.
Bioethanol is derived from the fermentation of biomass [
2]. Ethanol tends to have a higher autoignition resistance [
5], accompanied by a higher latent heat of evaporation (HoV), and associated charge cooling. Modeling is generally centered around the pure combustion interactions found within ethanol blends, giving ignitability and octane ratings more prominence.
4. Experimentation Results
The primary role of this study is to determine the effect of bioethanol concentration on LSPI, and to aid in the understanding of this trend, a test matrix is designed, consisting of both baseline tests and an array of ethanol blend concentrations: E10 (EN228), E20, E30, E50, and E85.
The first ethanol blend to be tested was the E10 blend, consisting of 10% bioethanol, which is a blend of great importance in light of the recent deployment of E10 gasoline as the standard forecourt fuel across the UK and many European countries. This fuel is assumed to be the baseline for testing, with the fuel already deemed acceptable for use in road vehicles, and the fuel used in the experimental data the model was tuned to match.
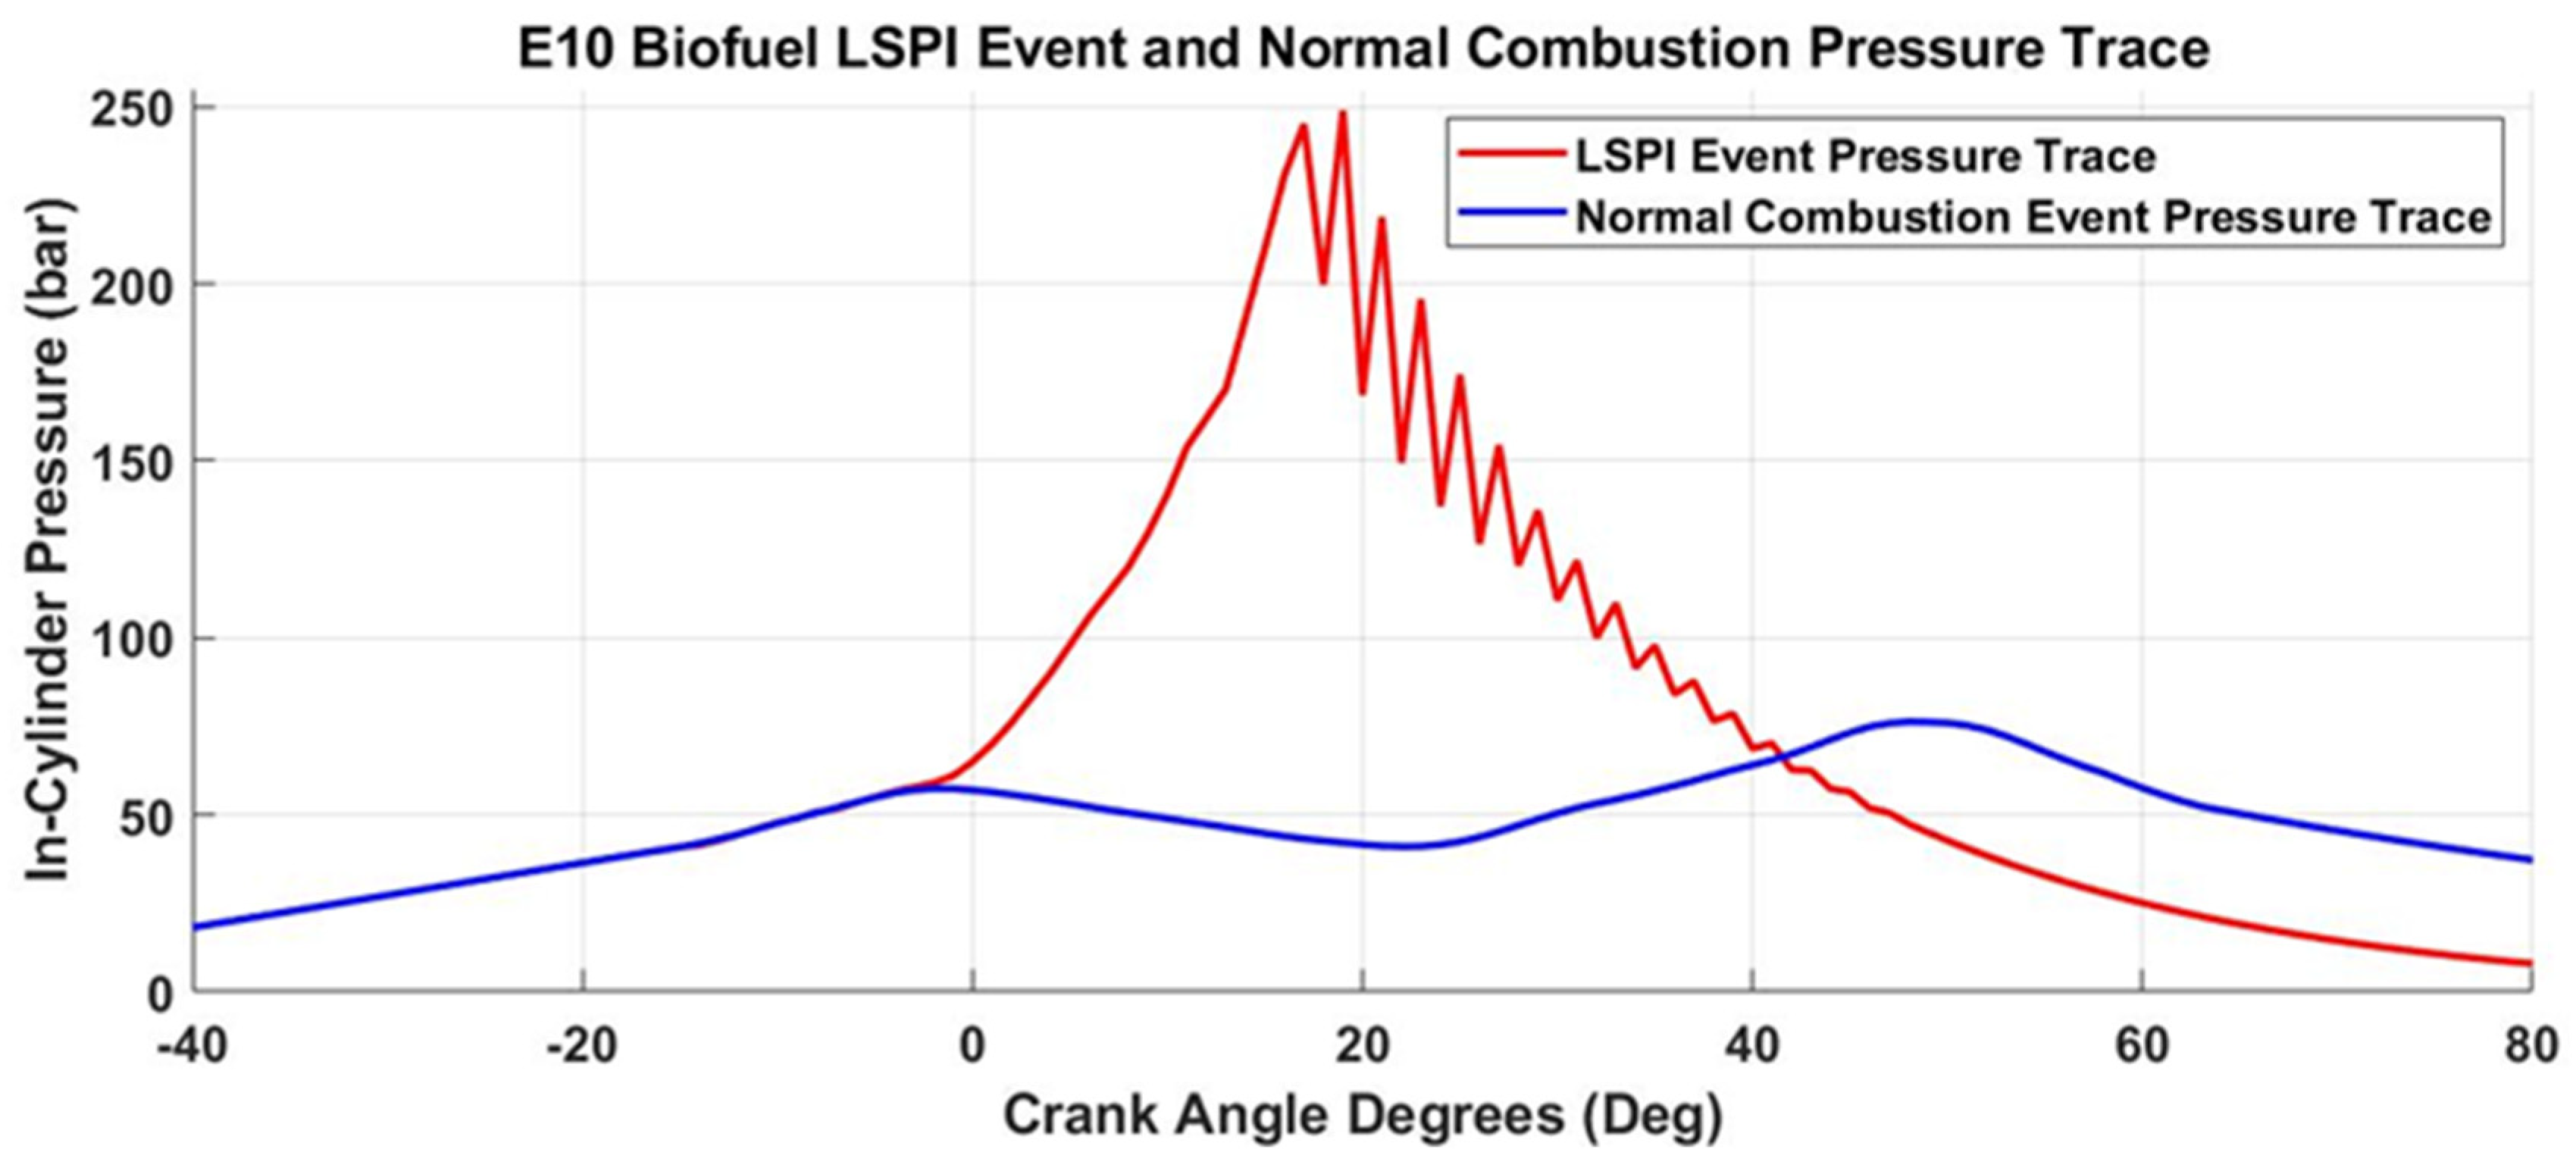
Figure 4 shows an example LSPI event alongside the standard combustion profile for this fuel, highlighting the significance of an LSPI event on the hardware within the vehicle, showing a large peak pressure with considerable knock, highlighted by the oscillations in pressure after the peak pressure occurs.
The non-filtered output of the simulation tool highlights the sporadic pressure gradient after the LSPI event, highlighting the end-gas knock event categorized as a harmful combustion event. Despite seeing the rapid pressure variations in the trace, no information is available on the propagation of the flame front across the cylinder, where these pressure variations would generally indicate multiple points of propagation and a variable burn rate causing spikes. The start of ignition is at a ~5° crank angle before top dead center (BTDC), triggering an LSPI detection event, with a large pressure rise at approximately 330% of the normal combustion peak. In normal combustion, there are two distinct pressure peaks, which are absent in the LSPI event, where the early peak pressure and advanced start of ignition eliminate the role of valve interaction and a consequential pressure drop.
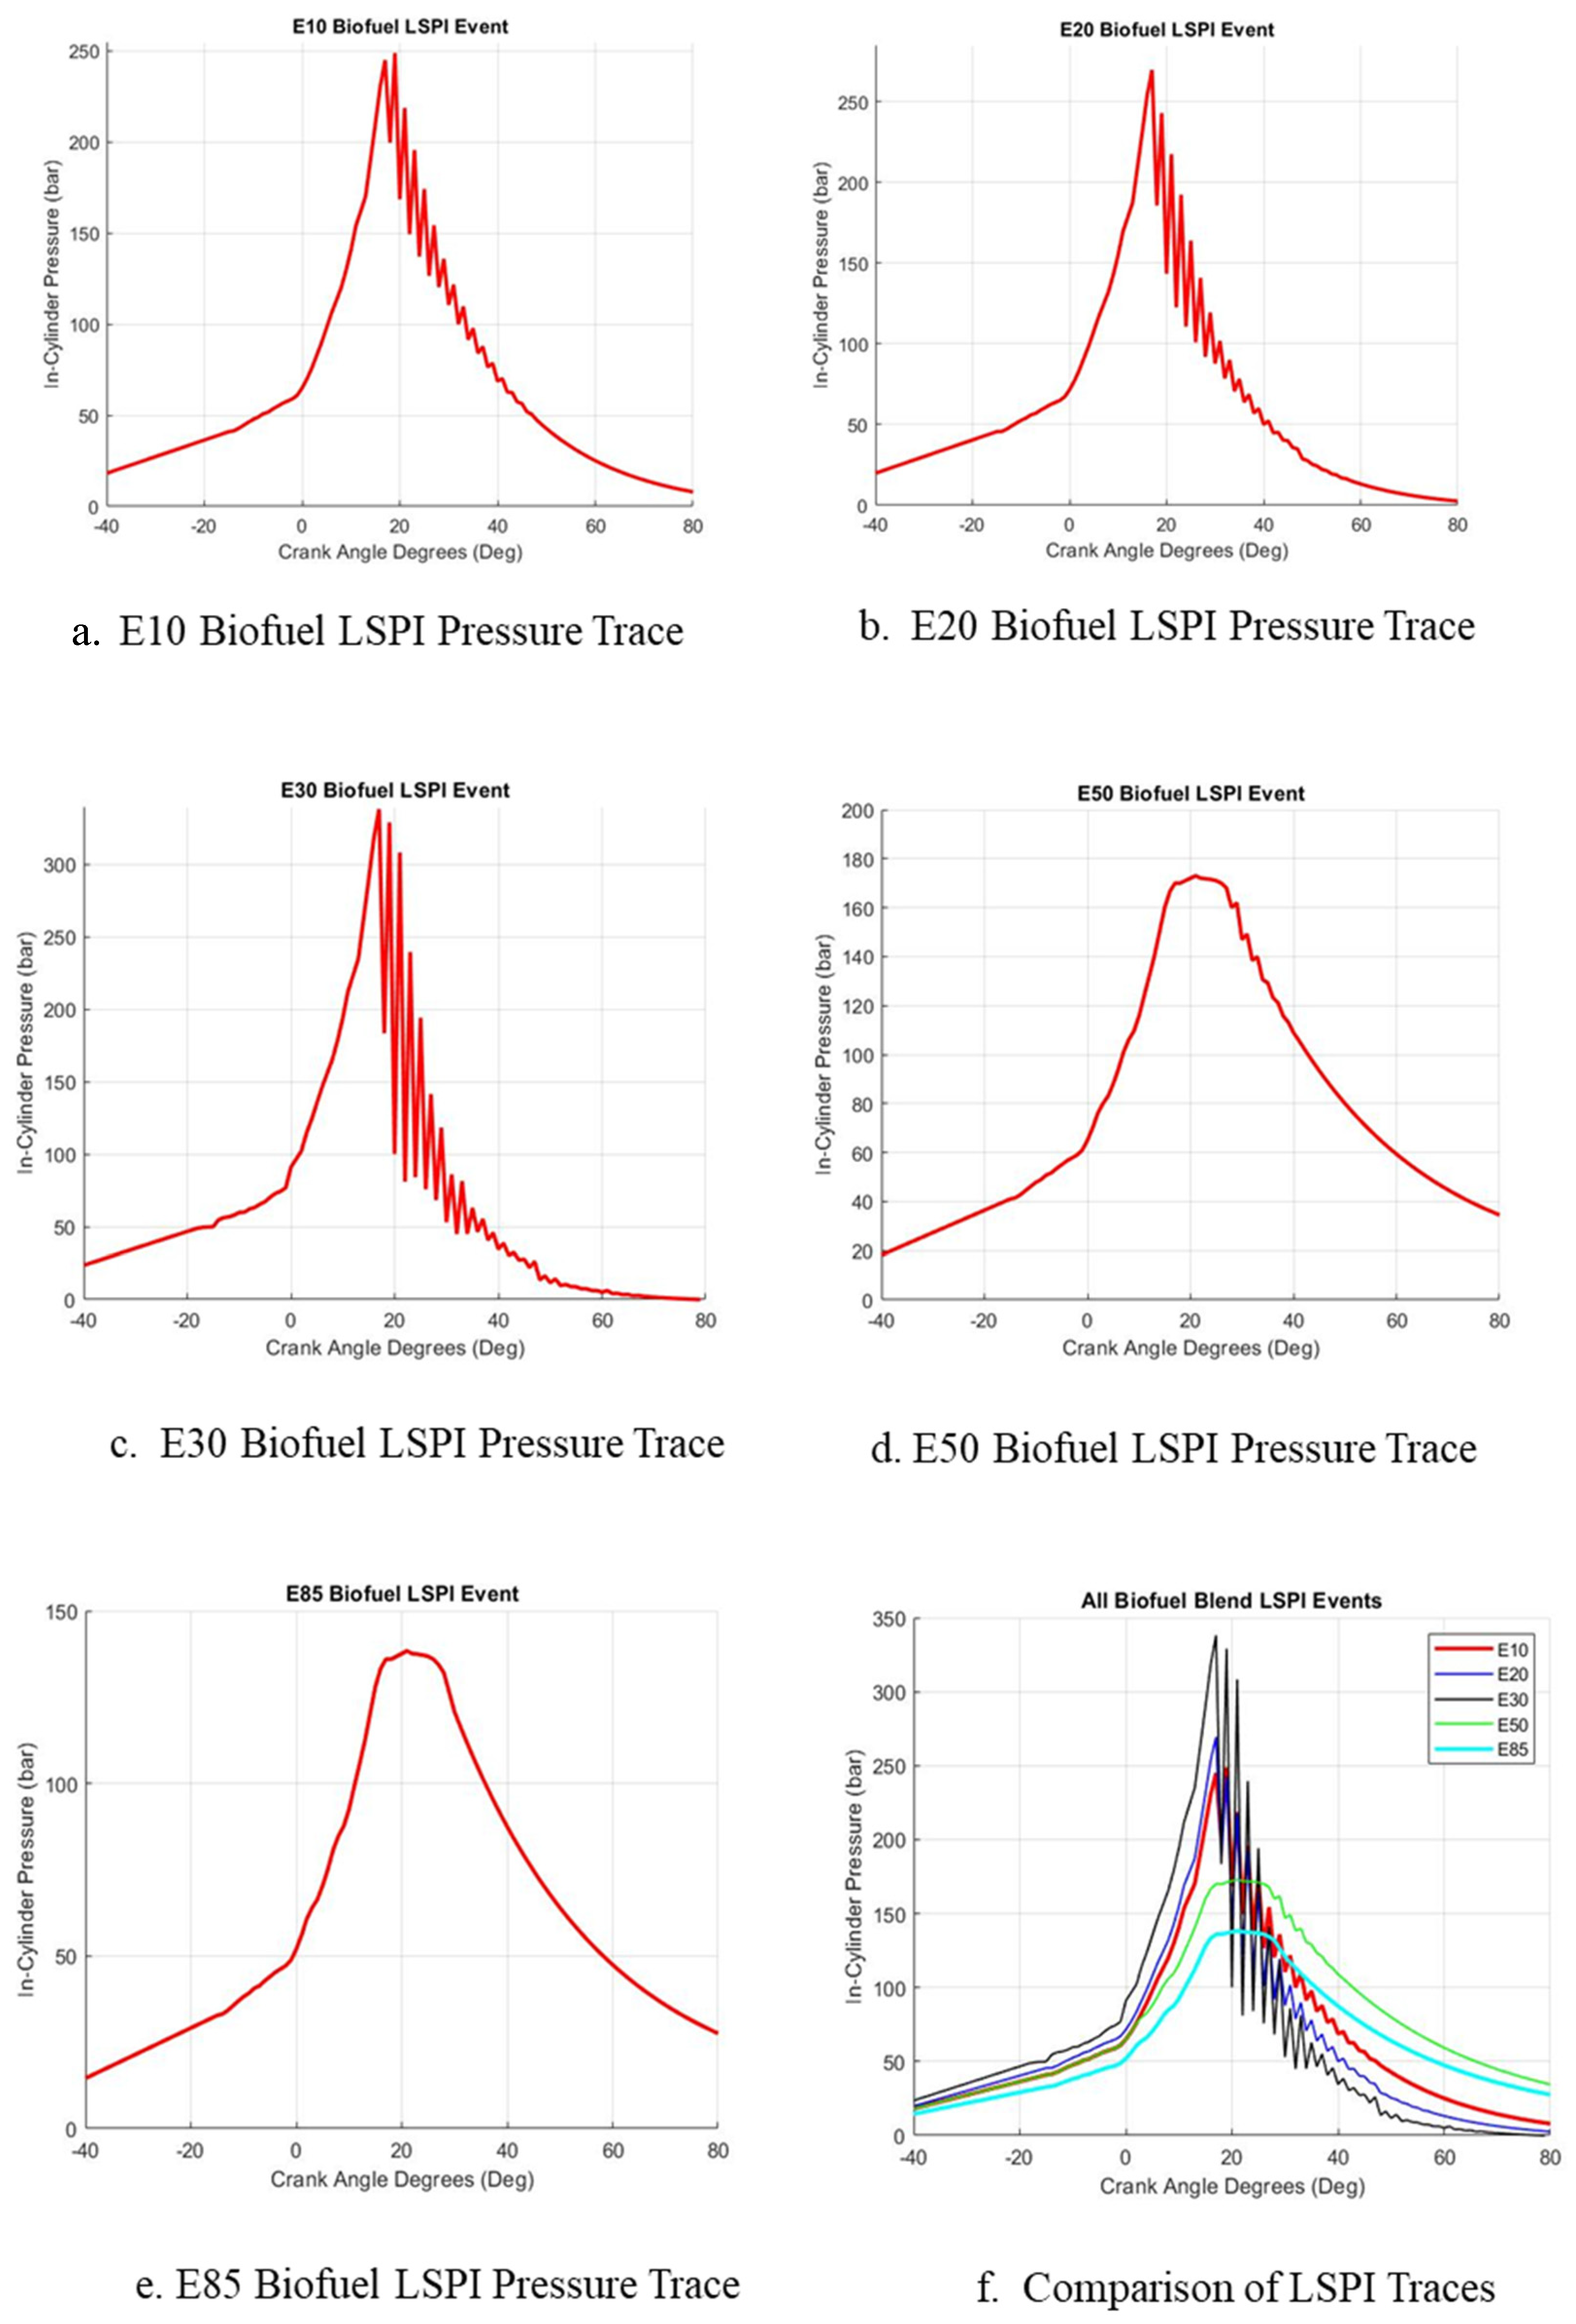
A summary of the initial findings for each of the ethanol blends is shown in the following section, highlighting the governing trend in ethanol concentration with LSPI. The effect of ethanol concentration on LSPI is immediately apparent in the pressure traces produced from the simulation, with an array of distributions across each gasoline blend. Representative examples, averaging each LSPI event, are shown in
Figure 5.
From this, the effect that ethanol concentration has on the probability of end-gas knock events occurring can be clearly seen, with a reduction in pressure oscillations indicating knock, clear with the E50 and E85 fuels, while end-gas knock is clearly evident on tests utilizing the blends from E10 to E30. The overlay of each average pressure trace shown in
Figure 6 highlights the changes to both peak pressure and crank angle at which peak pressure occurs.
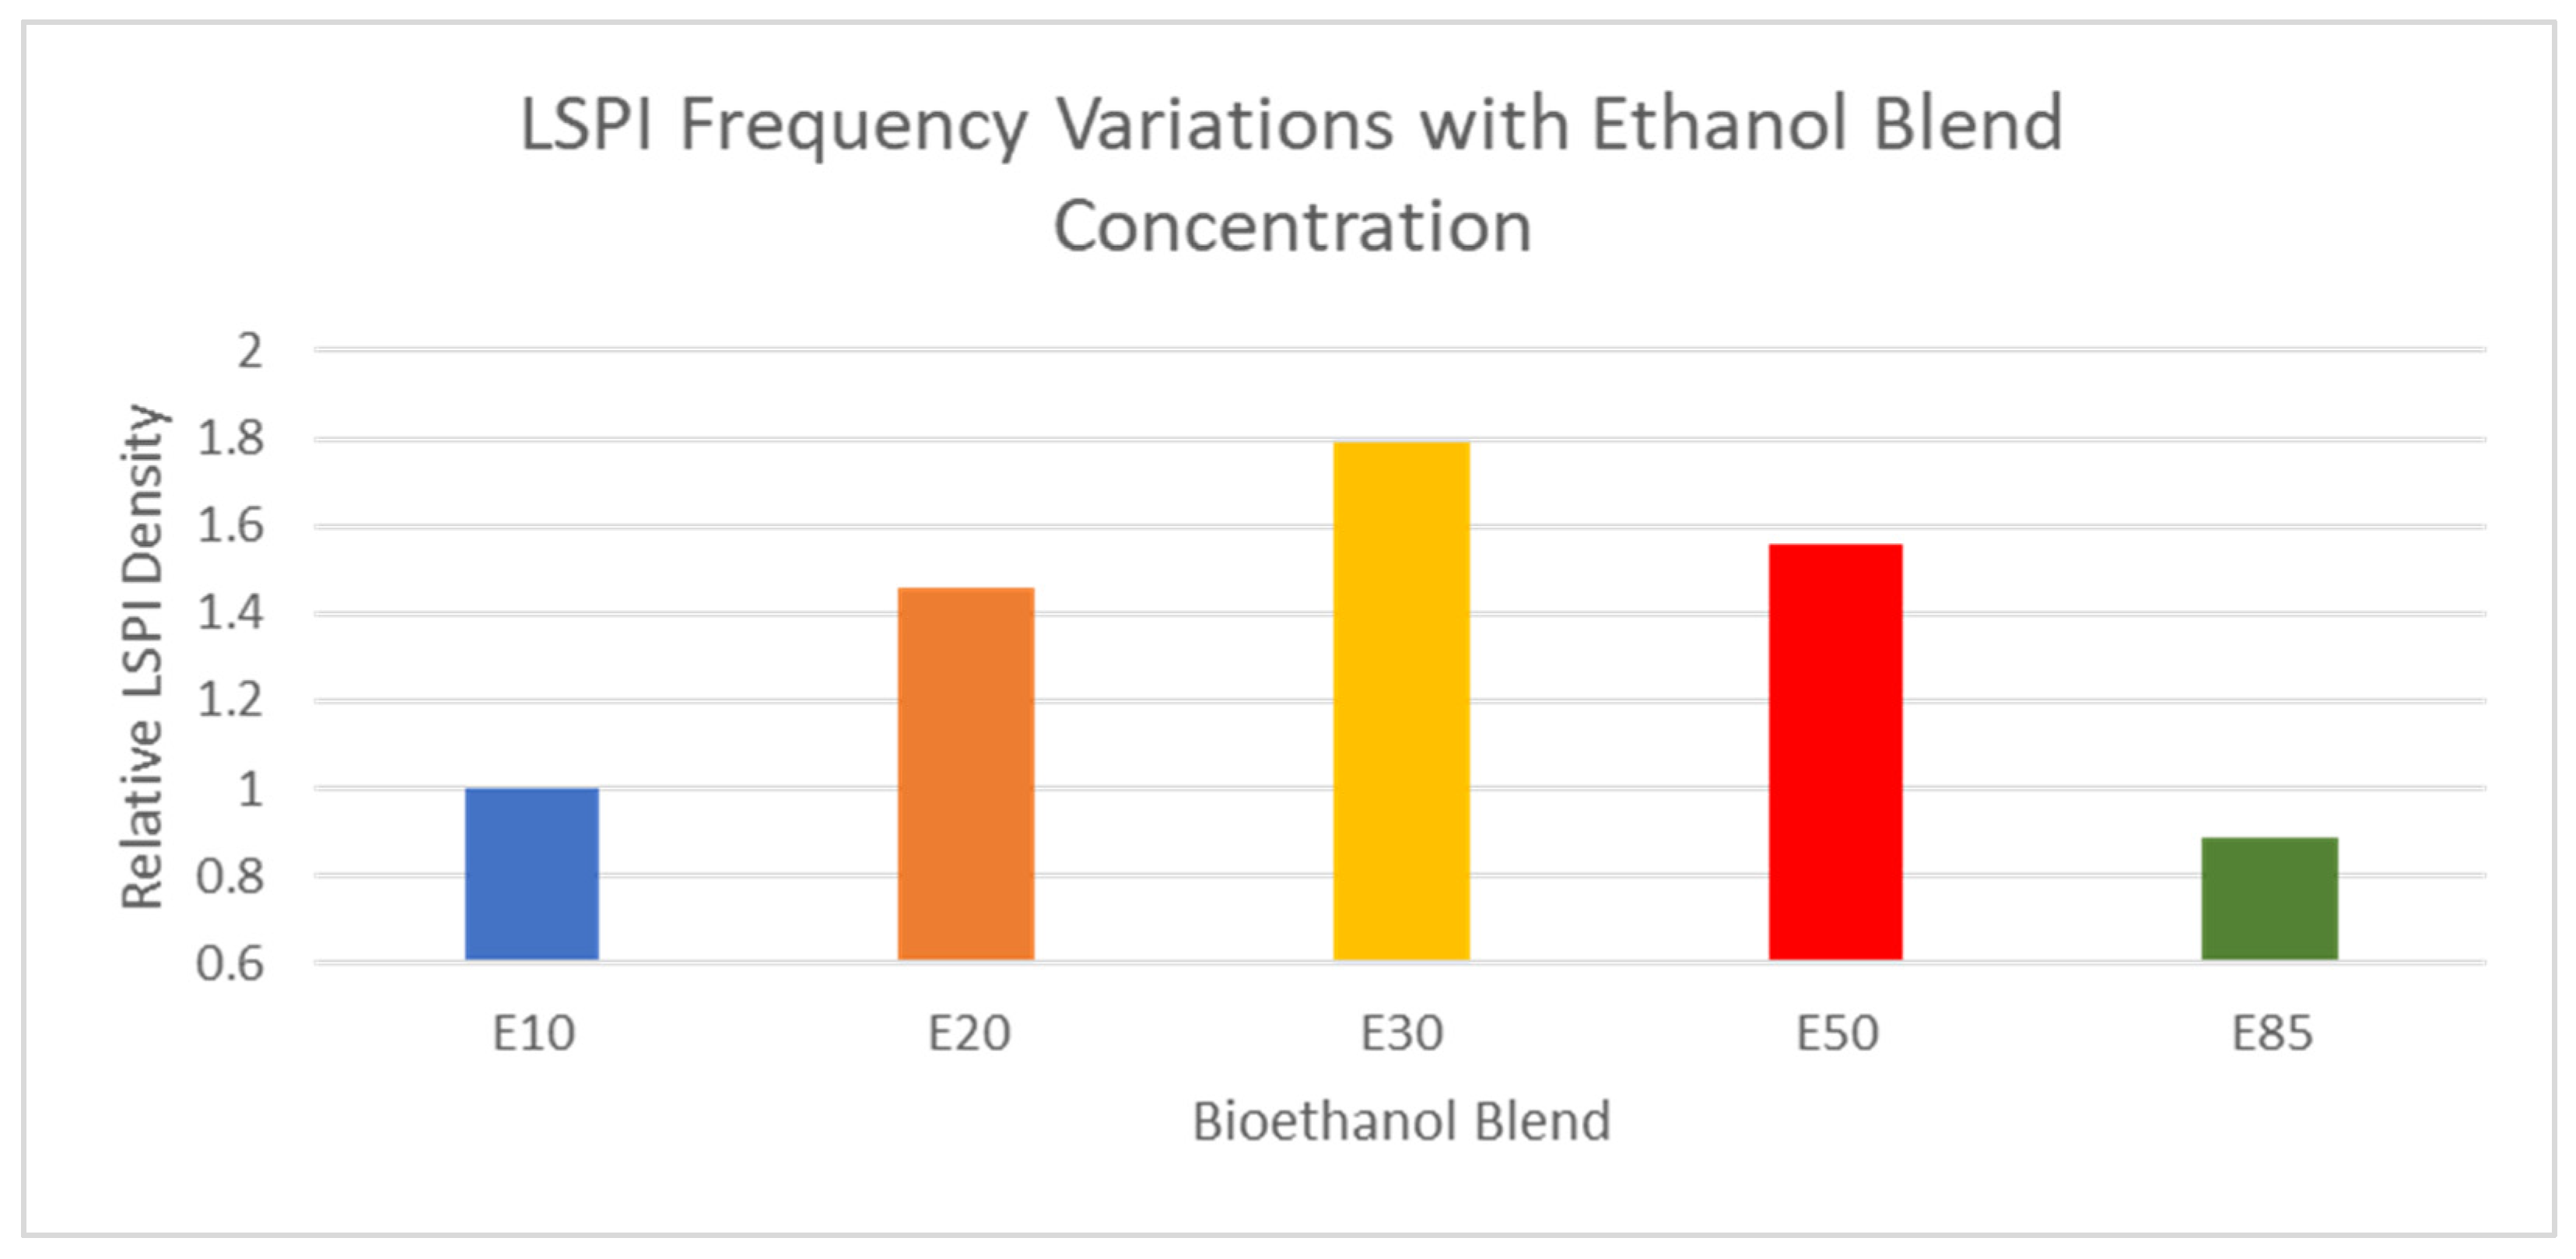
One major consideration to the effect and overall feasibility of the use of each ethanol blend is the frequency at which LSPI events occur. This measure does not consider the nature of the event, being an end-gas knock event or minor pre-ignition. An analysis of the frequency of LSPI events during the steady-state testing gives an indication to the effects of the underlying chemistry driving the LSPI event, while a chart showing the probability of the event occurring, expressed as a density, normalized against E10 results for ease of comparison, is shown in
Figure 6 [
20].
The relative frequency of LSPI occurrence with each blend highlights the criticality of the E30 blend, with a 79% increase in LSPI frequency over E10 associated with the fuel. E50 shows a decrease in frequency over the E30 blend, with more favorable characteristics such as reduced emissions outputs accompanying the favorable LSPI behavior. E85, a standard blend in the US and in high-performance motorsport applications [
21], shows the most favorable frequency behavior, with a 15% decrease in the baseline E10 findings, likely driven by the significant increase in autoignition resistance with the 85% ethanol blend.
Alongside frequency, another key consideration to the impact of biofuels on LSPI is the intensity of each event, with this analysis taking a quantitative approach to categorizing events as either a consequential end-gas knock event or a more minor pre-ignition event leading to a lower pressure rise.
Figure 7 shows the average peak pressure for each ethanol blend, shown as a change compared to the baseline E10 test, averaged across all LSPI events in steady-state testing.
The peak pressure variation, a direct indicator of LSPI event severity, shows a similar trend to frequency, with E30 again being the most severe blend and E85 being the most favorable blend regarding severity. In this instance, E20 appears to have a very similar behavior to the baseline E10 fuel, while E50 shows superior pressure behavior to both E20 and the baseline test, with a 3% reduction in peak pressure compared to E10. The additional reduction in percentage change compared to E10 for the E50 blend indicates that LSPI events ending in end-gas knock events do tend to be more severe; however, with a reduced frequency, these events may be easier to mitigate against and manage.
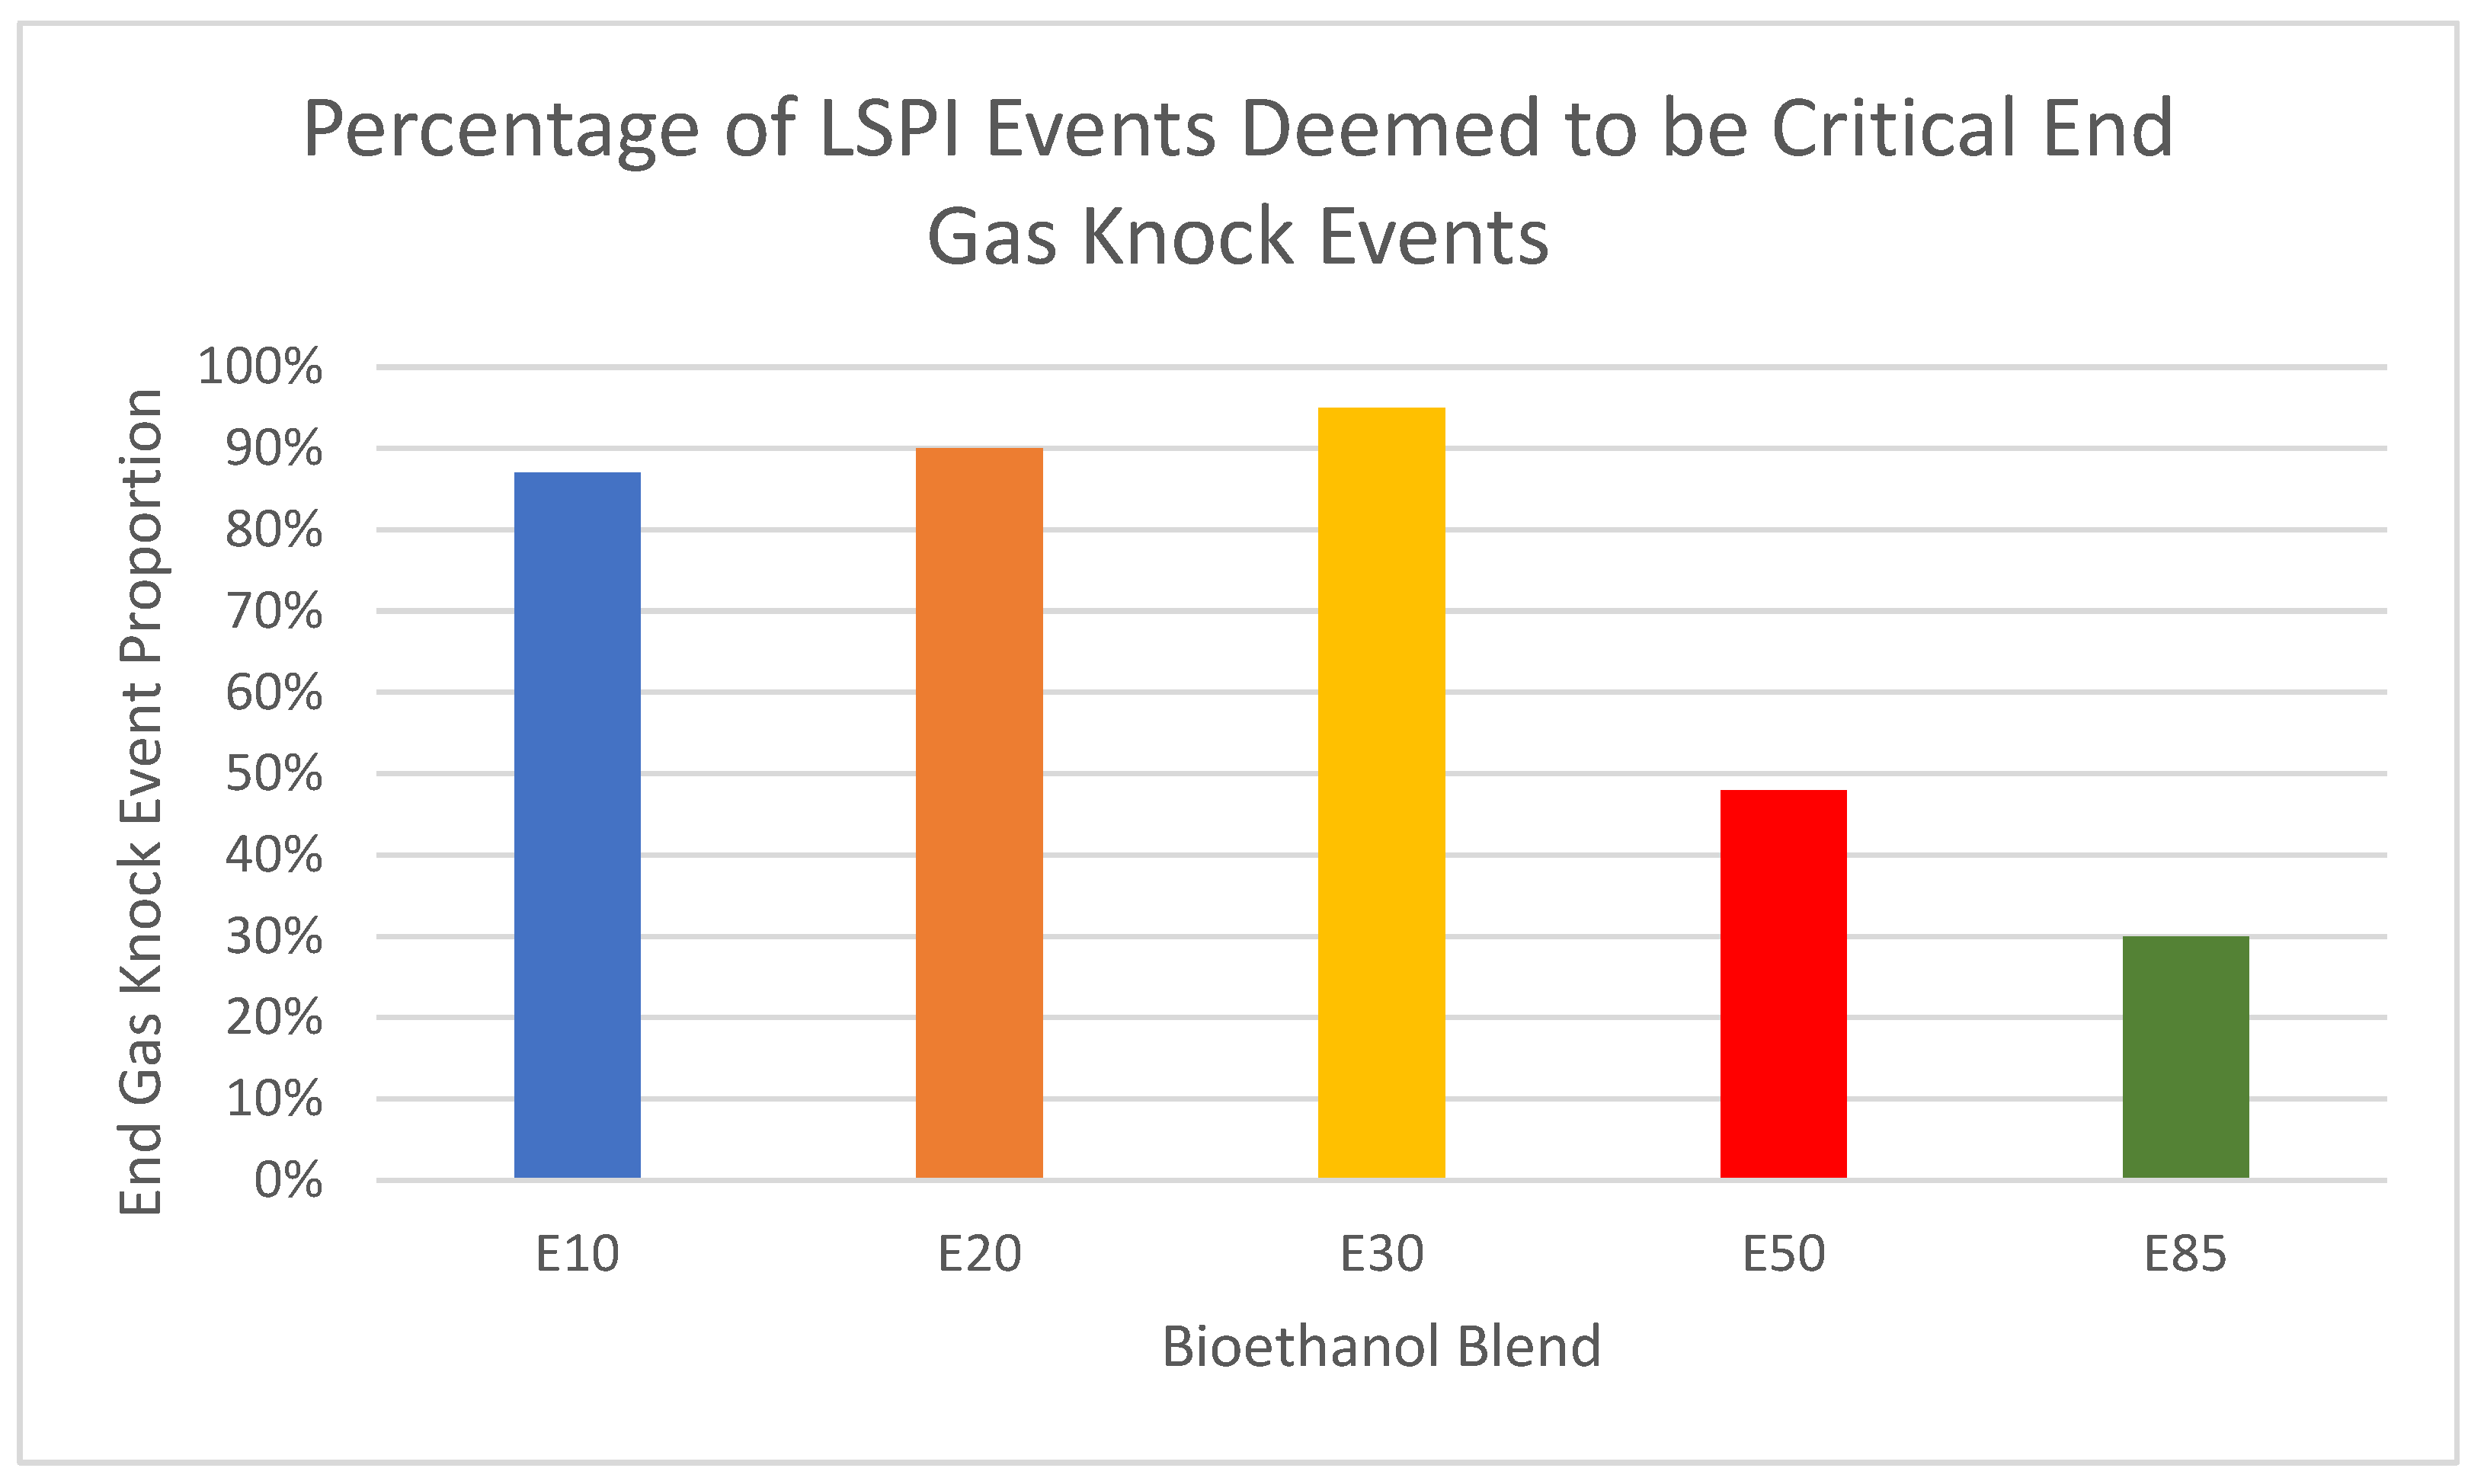
The sole analysis of peak pressure itself does not fully represent the severity of events, with single large events possessing the ability to manipulate the average peak pressure across all cycles. To increase the depth of understanding in the severity of events, the definition distinguishing end-gas knock events and non-knock LSPI events should be applied. This will highlight the proportion of events that would be deemed critical for each fuel, as well as indicate the severity of end-gas knock events when they do occur. The proportion of total LSPI events deemed to be end-gas knock events is shown in
Figure 8.
These data highlight the probability of an end-gas knock event developing from an LSPI initiation. E10 is shown to have an 87% chance of conversion, with E20 (90%) and E30 (95%) exhibiting less favorable behavior in this parameter. Both E50 and E85 show a significant reduction in conversion rate, indicating a reduced possibility of severe events occurring in operation, likely driven by the increased octane number with high-concentration blends, a traditional method of reducing end-gas knock events in ICEs [
22].
To fully quantify the severity of events occurring for each blend, a combination of both the peak pressure and frequency can be considered. A weighting factor is applied to the peak pressure, as this carries the most severe consequences in the operation of the ICE, leading to damage to the integral internal components and failure of the hardware. The weighting function, with factors selected from experimentation, for this parameter is shown in Equation (1), with the relative intensity for each fuel depicted in
Figure 9.
This weighting coefficient highlights the most effective ethanol concentrations for LSPI damping, while affirming the belief that E30 is the most critical blend regarding the severity of the event [
5]. E85 is again highlighted as the least severe blend, while E50 outperforms both the E20 and E30 blends. Basic analysis of this trend would suggest that the adoption of E50 and E85 fuels should be accelerated, particularly with E85; however, considerations to the feasibility of these fuels should be given with respect to hardware capabilities. High-ethanol-concentration biofuels will require extensive hardware modifications to become the standard fuel, with colder operation spark plugs and material selection developments required to facilitate the use of these fuels [
23,
24]. The lack of consideration to fuel lubricant interactions, due to the limitations of the 1D simulation tool, may also alter the perception of higher-concentration biofuels and their relative benefits, with the frequency at high concentrations generally deemed to be driven by charge cooling and impingement effects [
10,
17,
18], which are not addressed by this study.
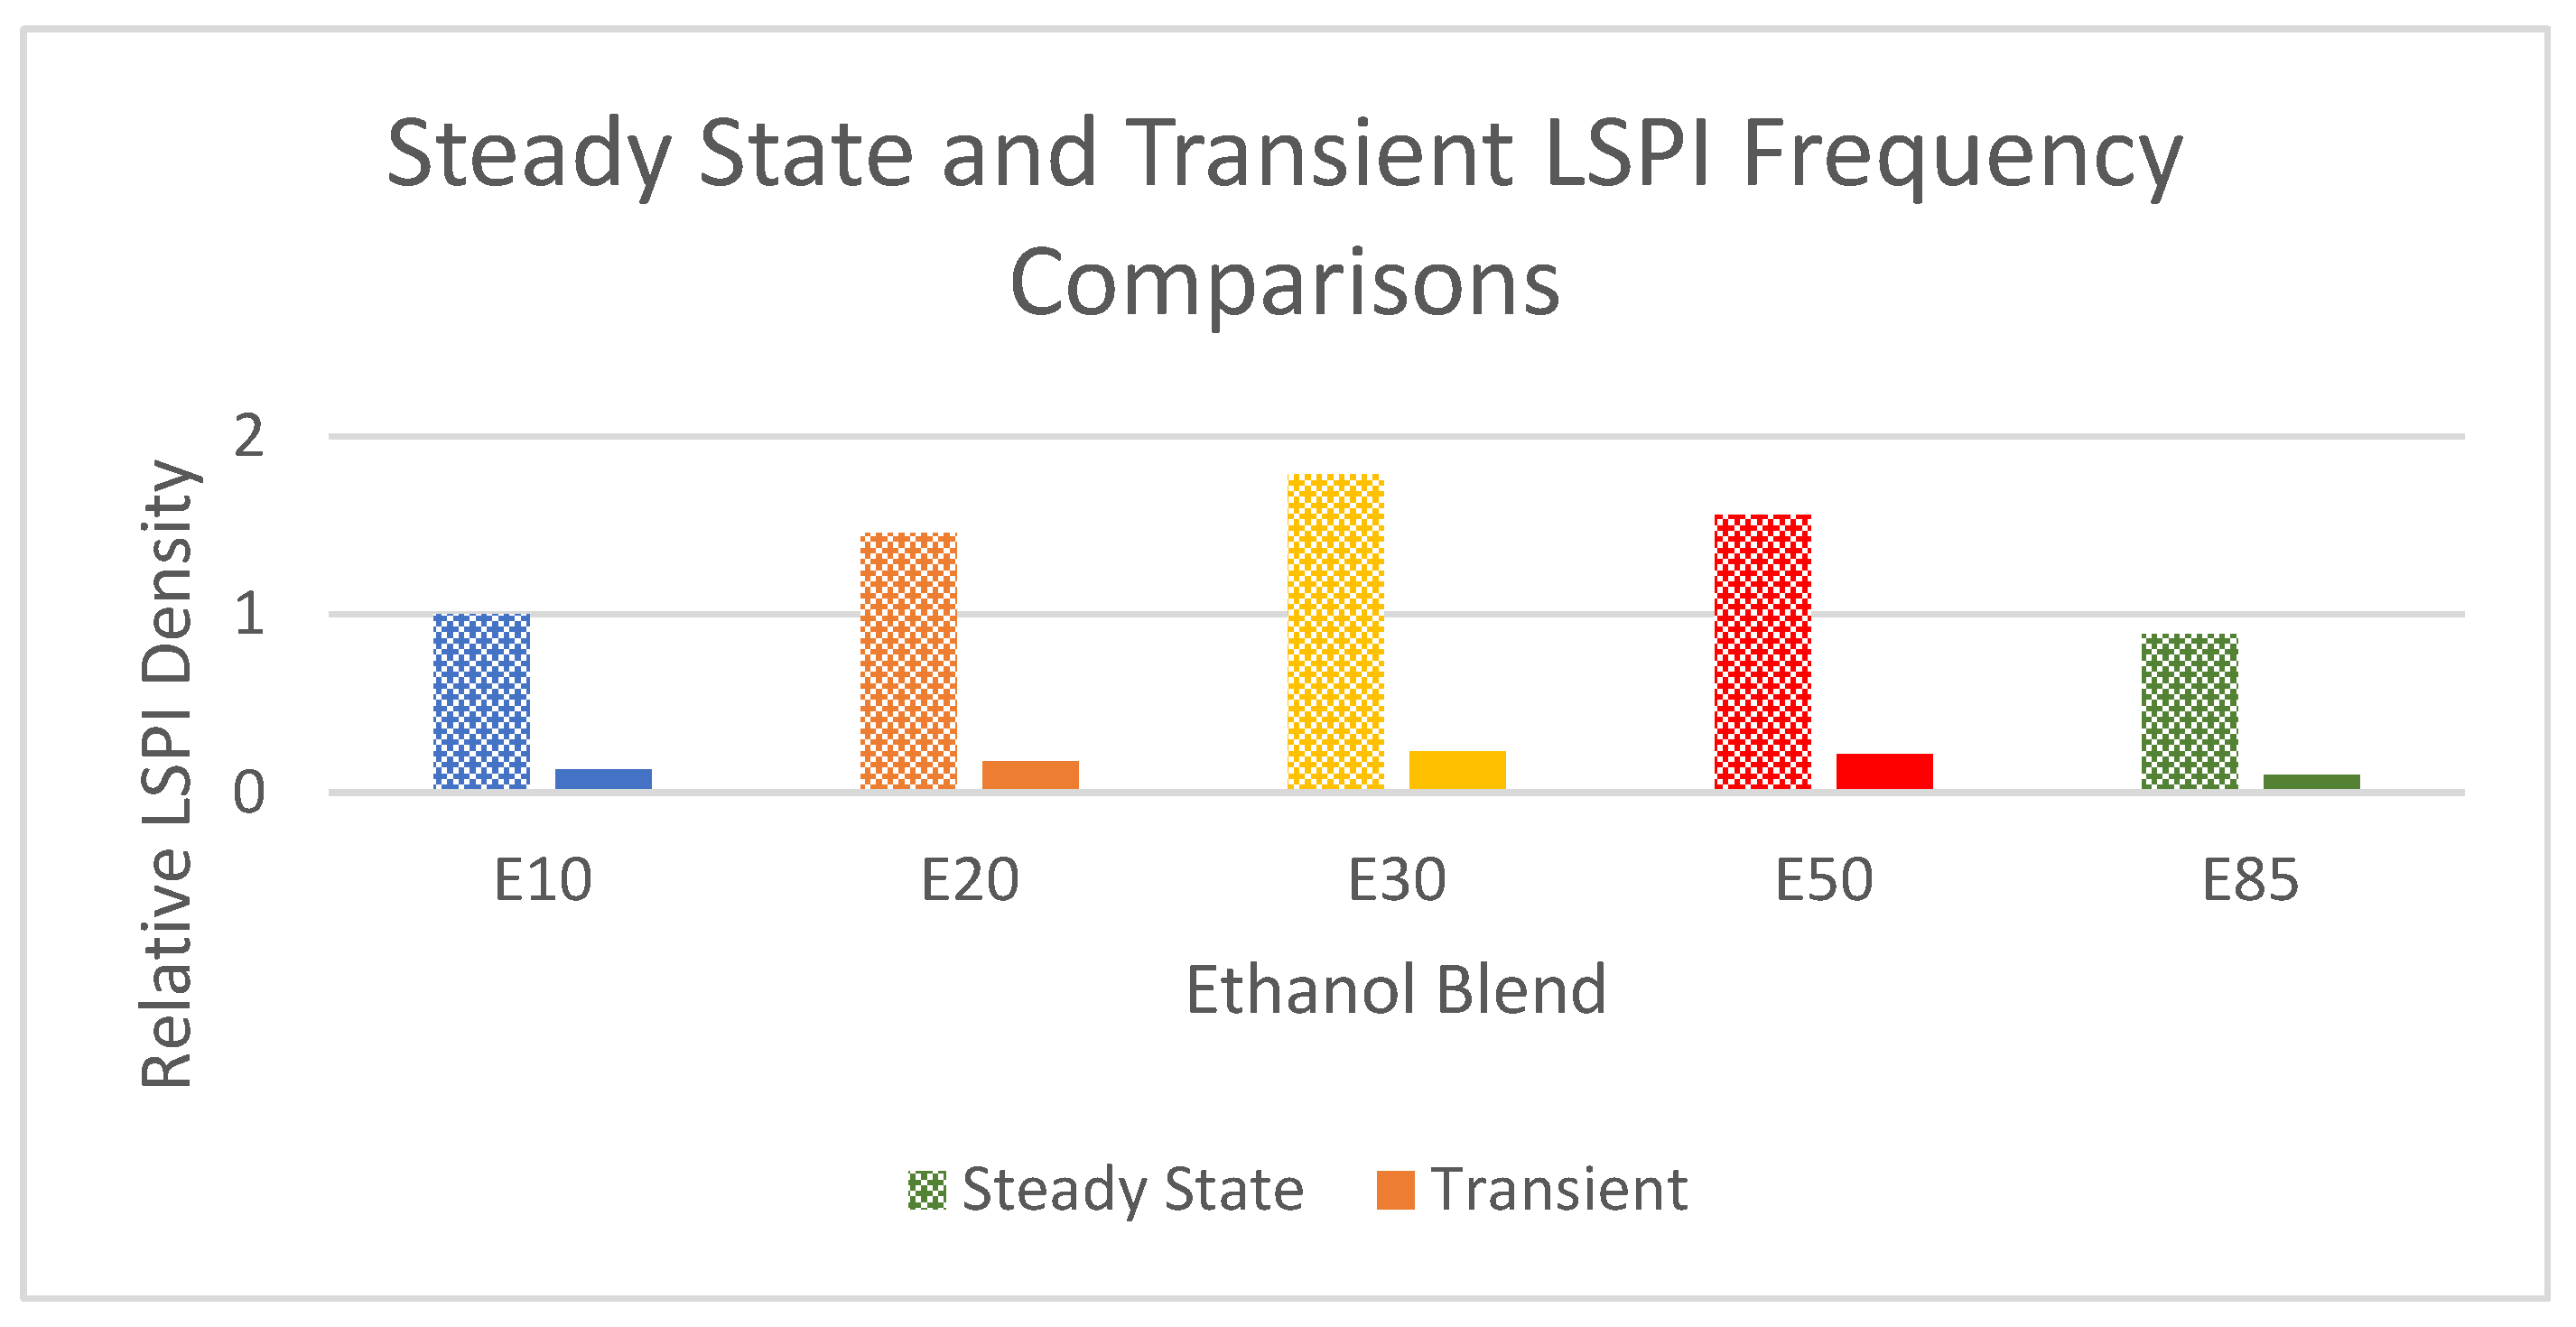
Real-world transient tests based on WLTC drive cycles have been performed and the comparison of the frequency for both steady-state and transient testing is shown in
Figure 10. Transient data show a great reduction in event frequency, with a range of 10–15% of the total number seen for each fuel blend, due to the prominent LSPI zone being utilized less frequently.
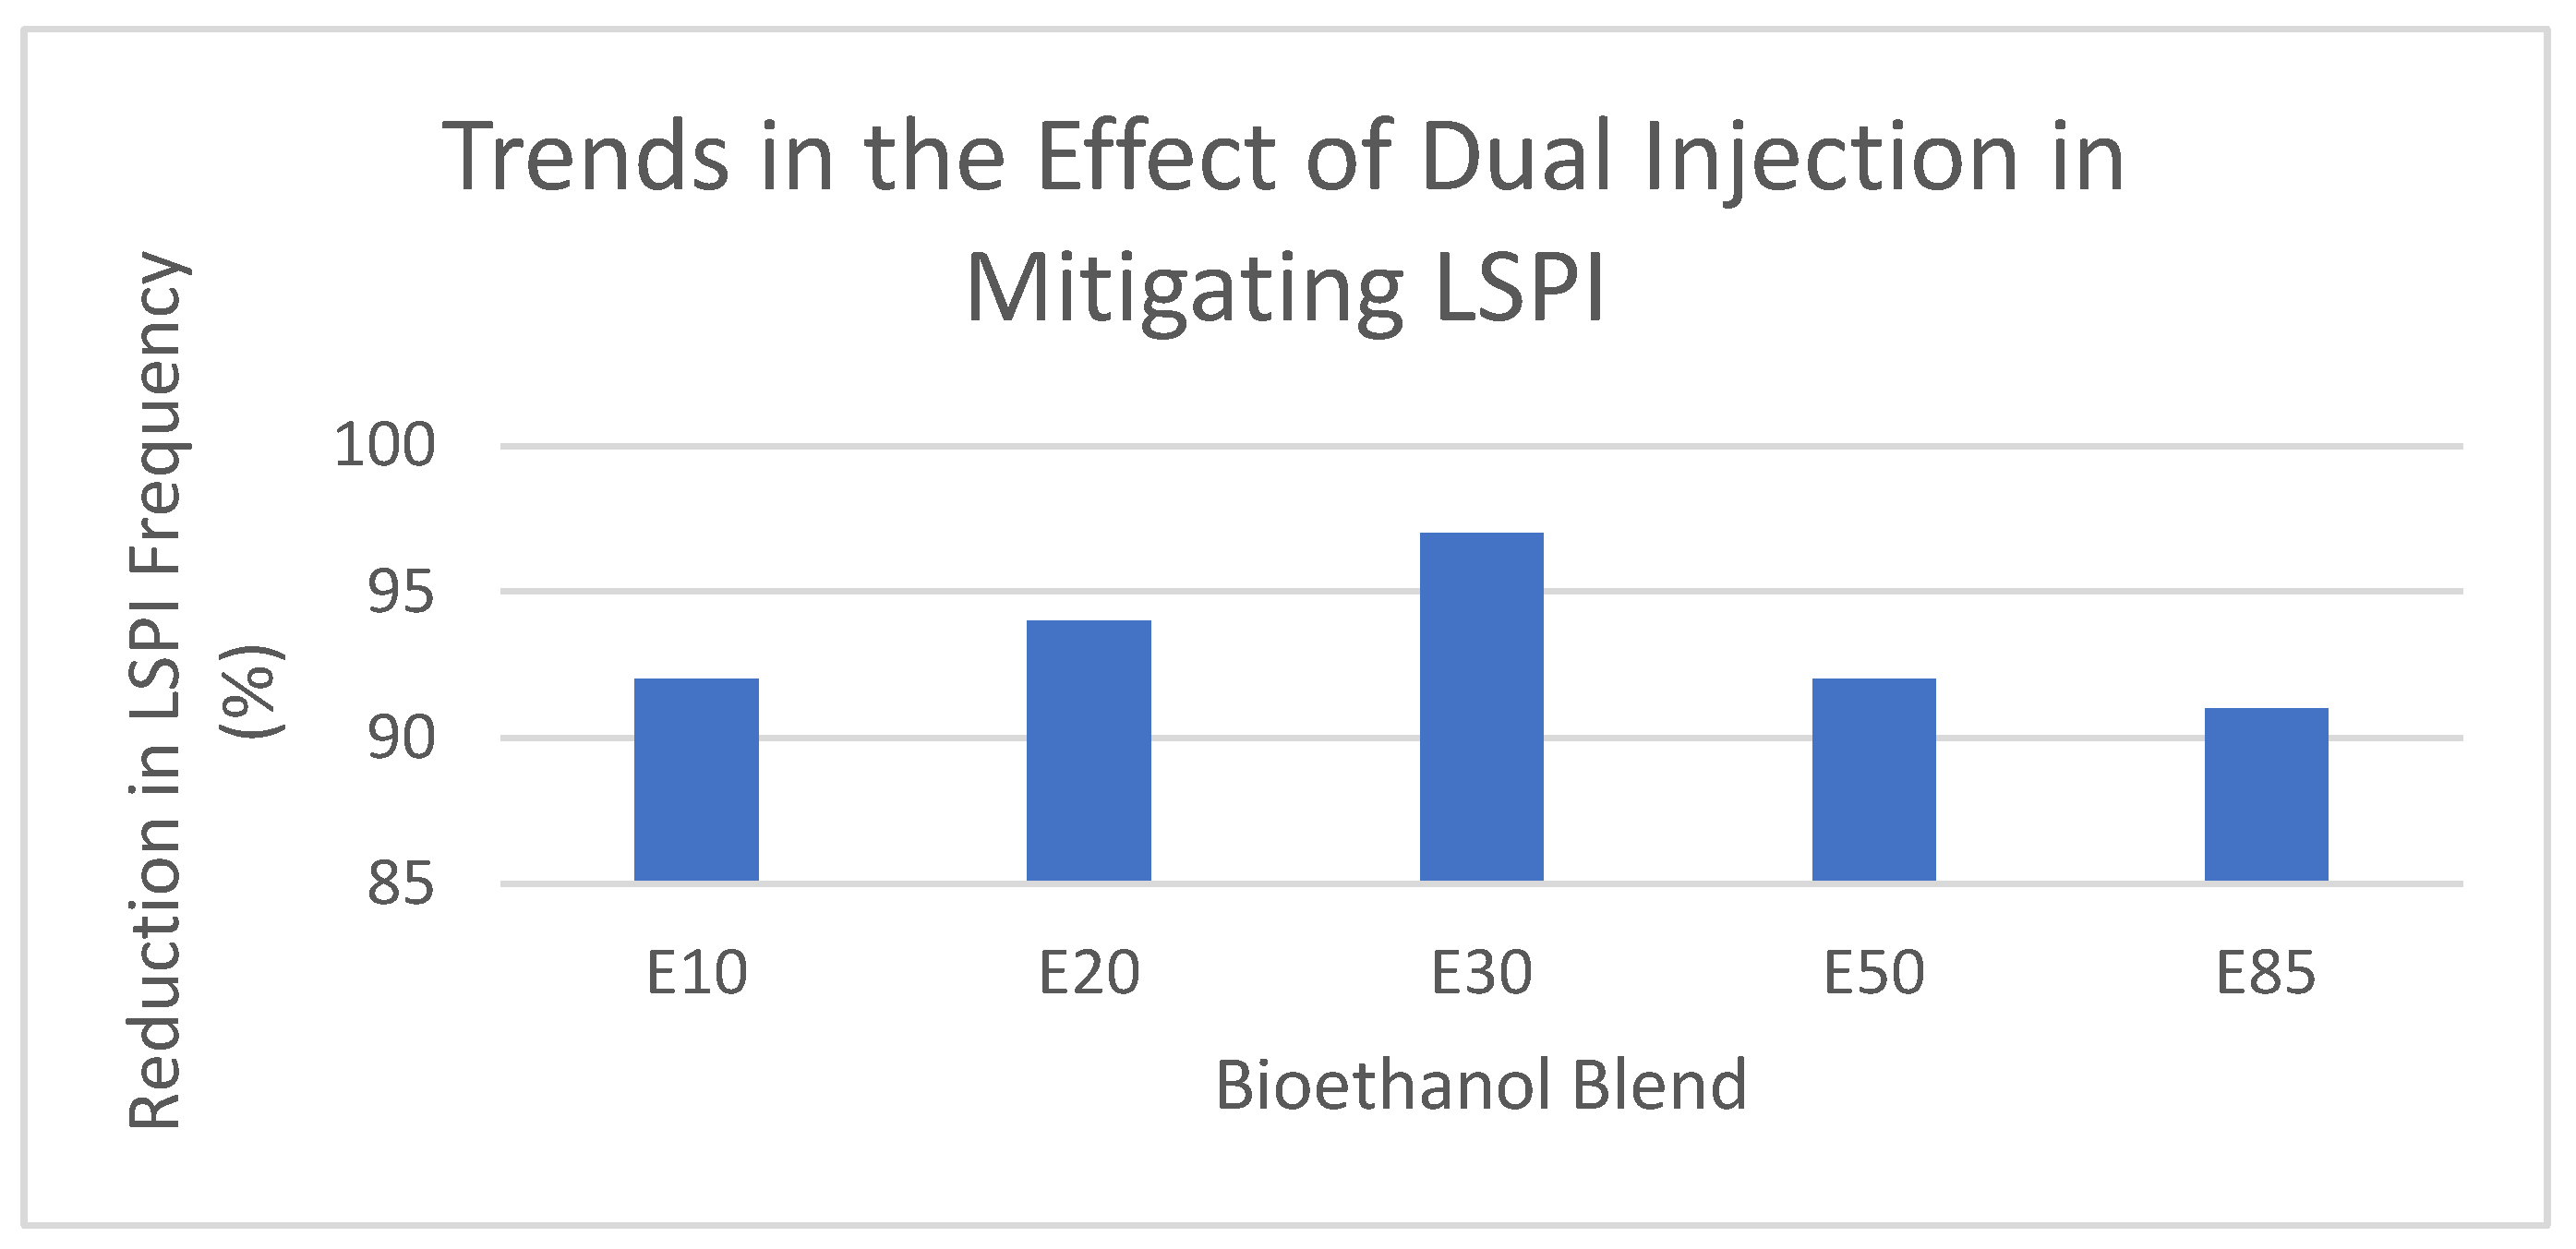
One mitigating strategy to limit the onset of LSPI, addressed in a previous section, is the use of a double injection profile, or a pilot injection scheme as seen previously in compression ignition diesel ICEs. For most cycles, no distinguishable pressure peak is noticed, with the mixture only serving the purpose of preconditioning the stratified air–fuel mixture within the cylinder. The second, main injection then achieves a similar pressure to a normal single-injection combustion event. The trend of reducing LSPI events, shown in
Figure 11, by over 90% with all blends is observed.
A table summarizing the results of each of the tests is shown below, in
Table 1, with each of the identified trends to be analyzed.
The results from each test appear relatively coherent, with trends in both frequency and intensity highlighting E30 as the critical blend for LSPI severity, as hypothesized by a review [
6]. At the same time, E85 is consistently shown as the most favorable blend when considering LSPI intensity, with E50 also showing more favorable attributes than lower-concentration ethanol blends.
5. Results, Analysis, and Discussion
This section attempts to qualify the results while developing an understanding of the fundamental factors impacting LSPI frequency, intensity, and consequently severity.
The overriding consideration when analyzing the effects of bioethanol concentration on LSPI is the role of fuel chemistry on both the overriding intensity of events and the frequency at which they occur. Key considerations when analyzing these impacts are the fundamental characteristics of ethanol fuel blends, with the increased HoV, improved octane rating (allowing greater knock protection), and increased charge cooling effect of ethanol blends.
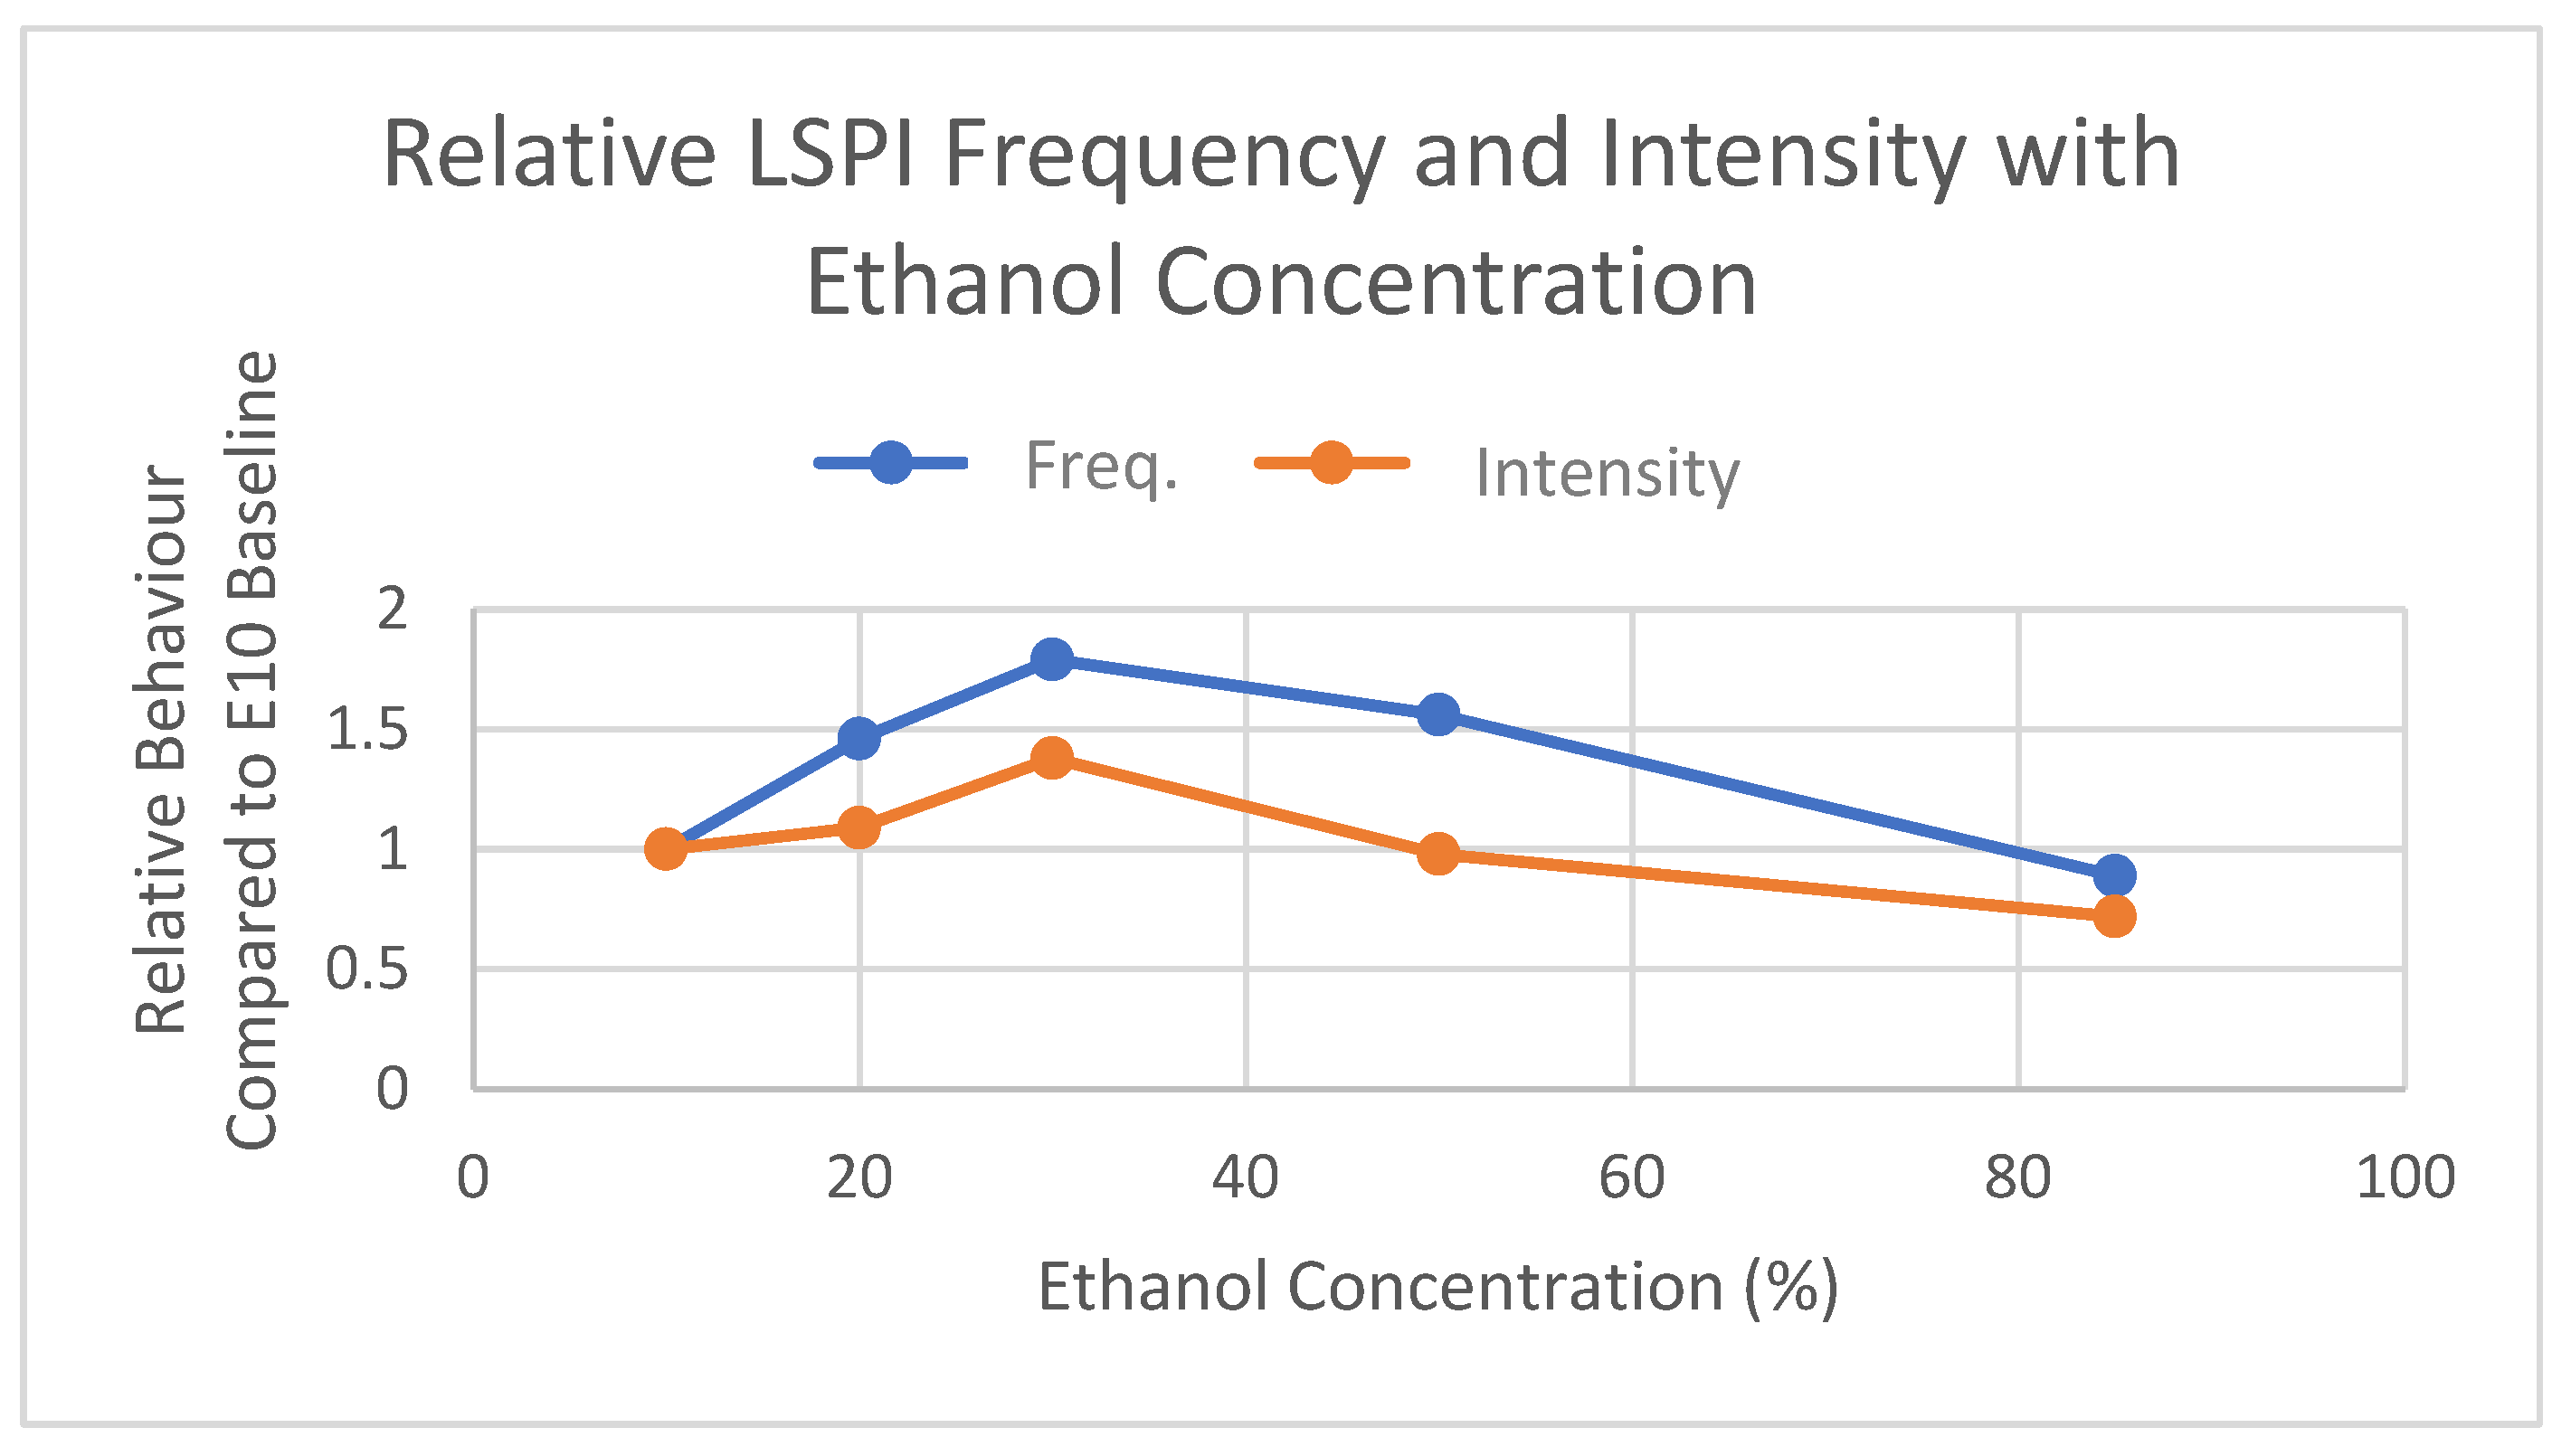
Figure 12 shows the trend between concentration and both the frequency and intensity of LSPI events in steady-state testing.
This trend clearly highlights a critical point at which the impact of ethanol concentration changes, and the associated impact on combustion characteristics also changes. To understand this nonlinear behavior, where a clear switch in mechanism occurs, between the 30 and 50% concentrations, the role of each of ethanol’s characteristics must be considered [
23].
The enthalpy of vaporization, HoV, is a measure of the energy required to transform the fuel into a gas [
25], which occurs during the combustion process. A higher HoV value suggests a lower ignitability of a mixture, and a resistance to ignition prior to the spark point in the combustion cycle. This is a favorable characteristic when considering the mitigation of LSPI, as fuels with a higher HoV will tend to resist autoignition as cylinder conditions do not reach this threshold energy requirement to initiate the gas phase transition required. As the HoV of the fuel increases with ethanol concentration, it would be expected that the frequency of LSPI events would be inversely proportional to concentration, explaining the decreasing frequency with E50 and E85 blends. However, the Increasing trend in frequency with blends from 10–30% suggests that this mechanism is not the sole reason for LSPI initiation and introduces the role of ignitability of mixtures.
In experimental studies, the role of HoV and charge cooling is also correlated with the presence of fuel droplets within the air–fuel mixture and the increased prevalence of hotspots due to fuel–lubricant interactions [
7,
9,
13,
15]. This mechanism of LSPI initiation is not simulated by this model, so it omits the potential increase in LSPI frequency due to increased impingement in high-concentration blends.
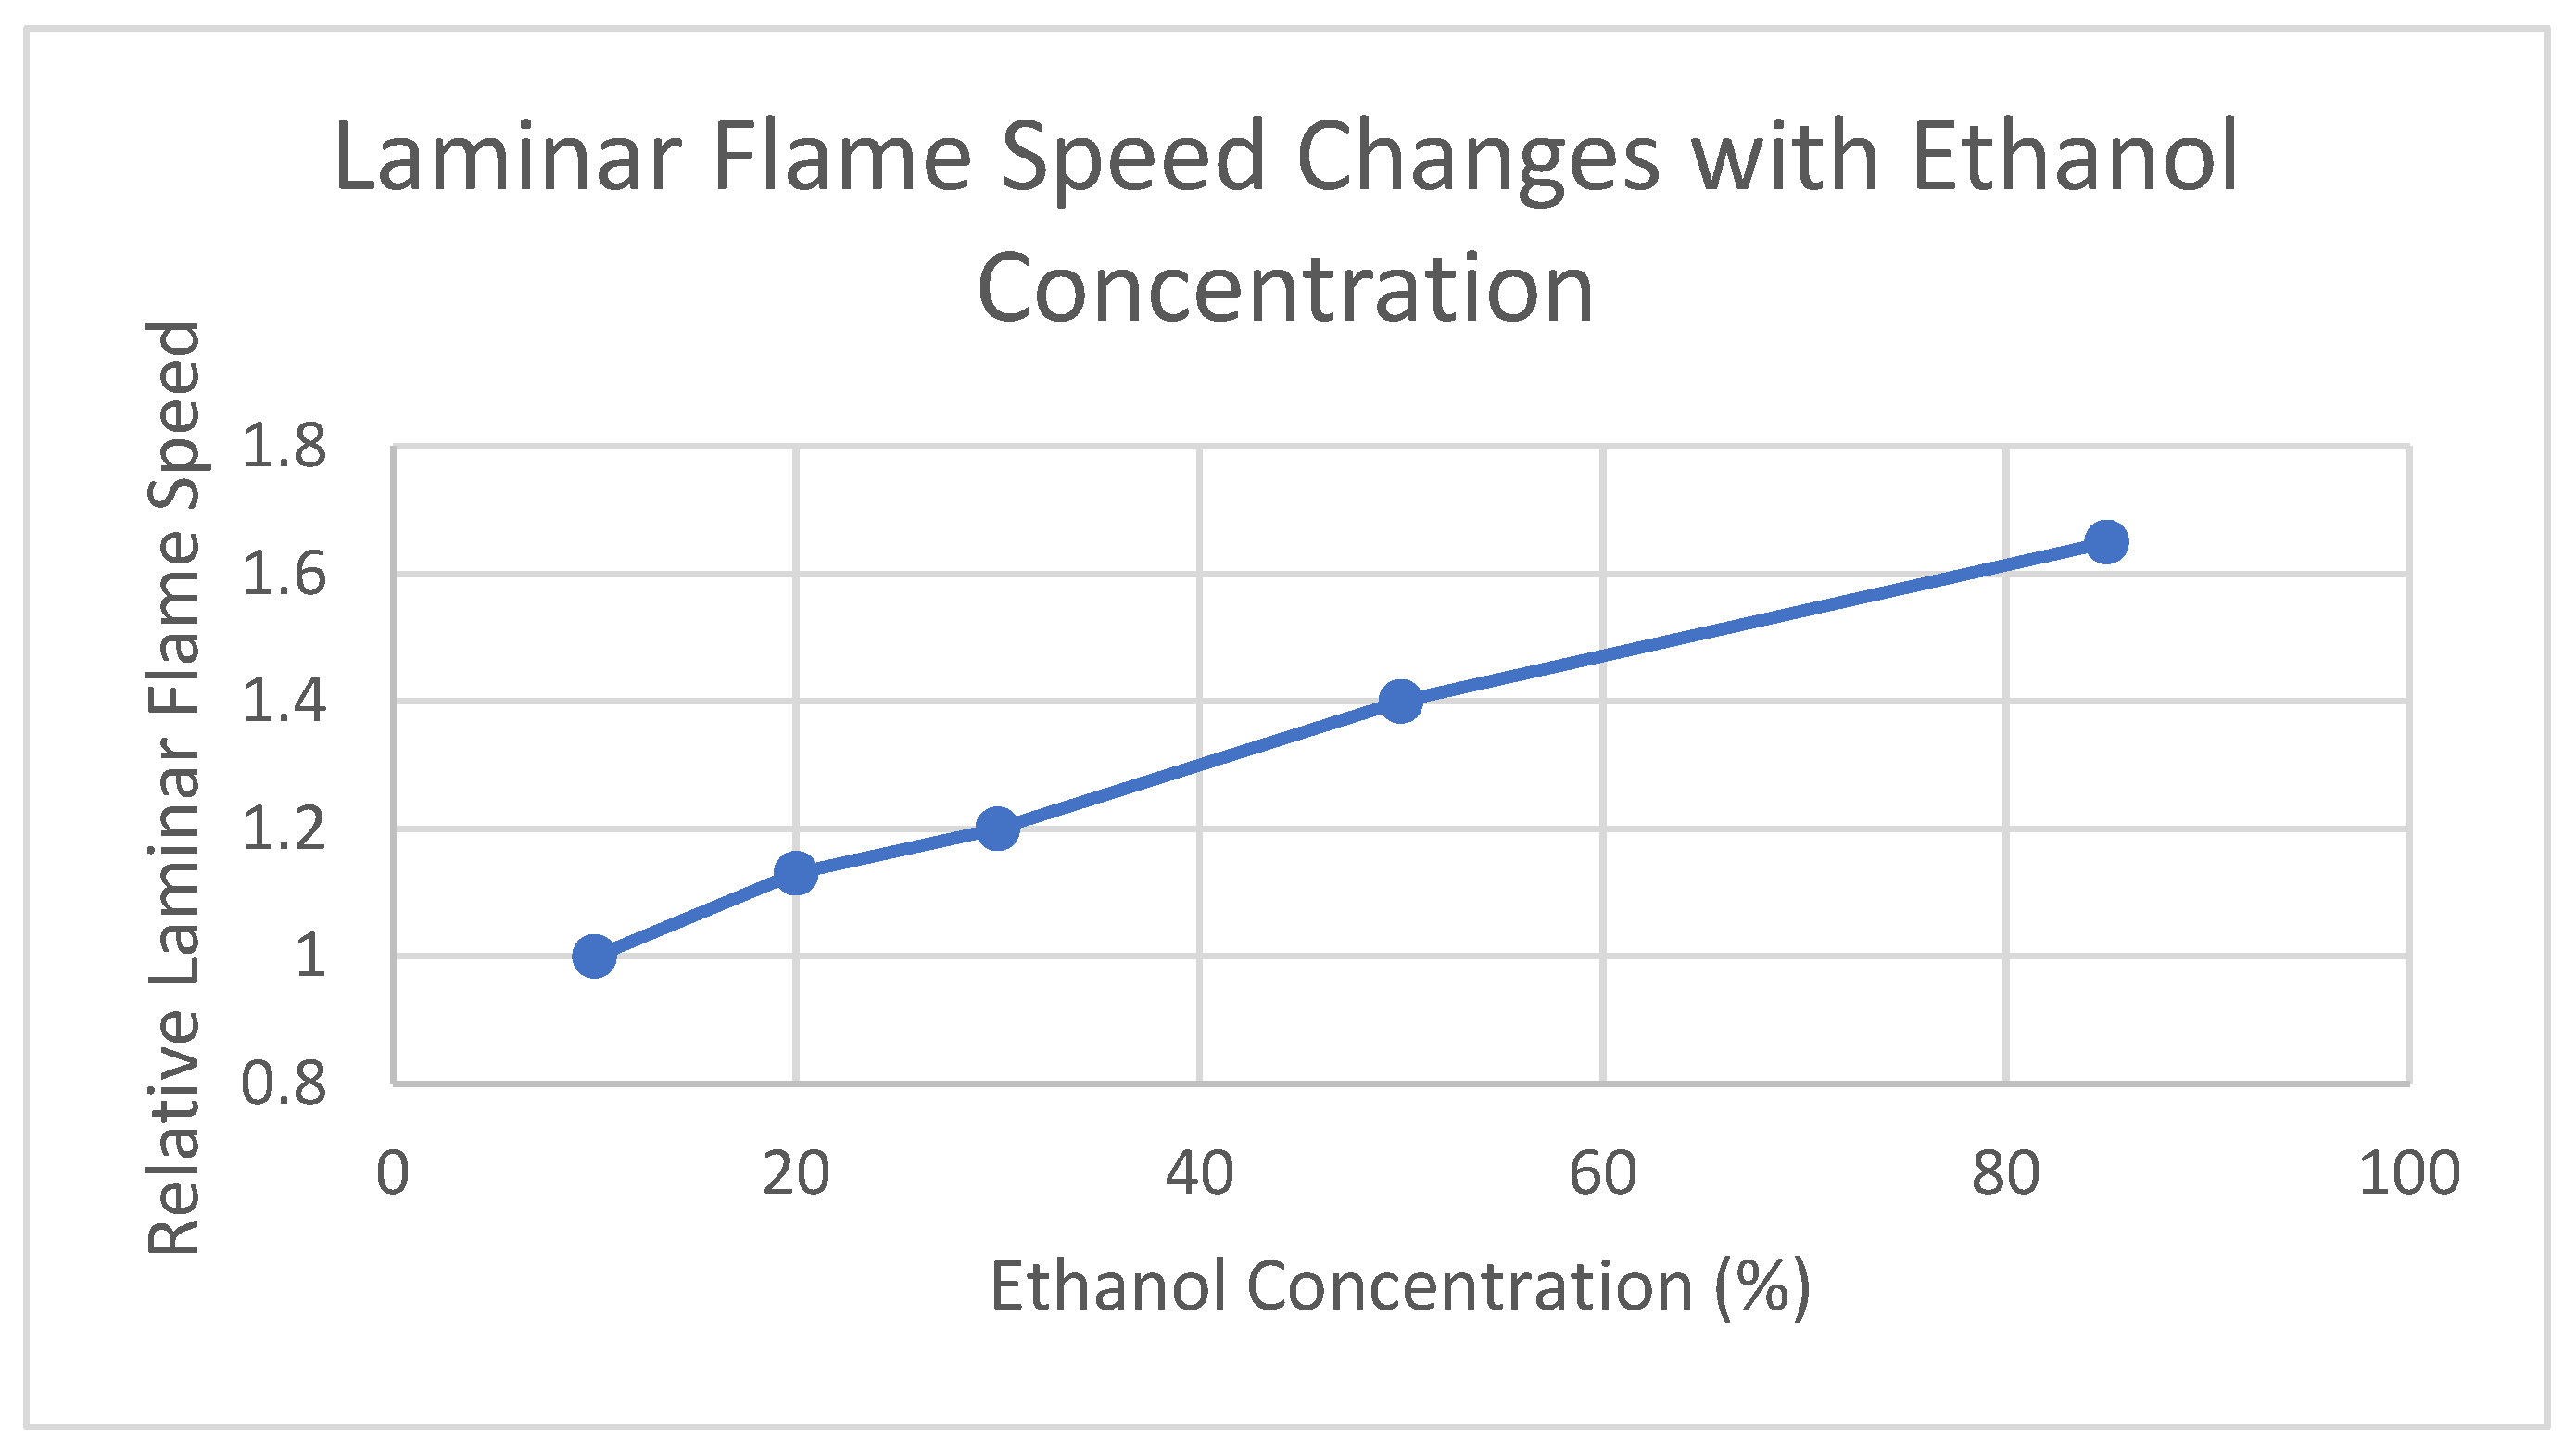
While the HoV prevents the gas phase change required in combustion, this measure is not sufficient to predict the LSPI frequency alone. Between ethanol concentrations of 10 and 30%, the increases in enthalpy of vaporization do not prevent LSPI, with an increased frequency occurring between these points. This can be explained by the laminar flame speed of the combustion after ignition, with an increasing trend of the laminar flame speed, calculated through the application of Equation (2) [
26], seen with ethanol concentration, as shown in
Figure 13.
This increased flame speed, or propagation rate, turns potentially inconsequential early combustion events into LSPI events, where a large pressure rise occurs before the spark point. This flame speed consideration explains both the frequency and intensity trends shown in steady-state testing where the initially increasing concentration increases severity, where larger pressure peaks are seen as the event propagates through the cylinder at a greater rate, allowing maximum pressure to be achieved earlier. The frequency at which preignition events meet the LSPI event requirements is also increased. The change in behavior between 30 and 50% ethanol concentration suggests the dominant mechanism changes from the laminar flame speed to HoV, indicating that the HoV increase becomes dominant at blends between 30 and 50%. At low concentrations, the enthalpy of vaporization increase is insufficient to prevent LSPI occurrence, at which point the increased laminar flame speed increases the severity of the events occurring. This theory also goes some way to explaining the relative change in peak pressure being lower for the higher-ethanol blends, as when conditions do allow LSPI initiation, the much-increased flame speeds of the E50 and E85 blends cause high pressure peaks, offsetting the overall reduction in average pressure compared to the baseline test.
The final consideration with respect to the fundamental fuel chemistry of ethanol mixtures is the effect on end-gas knock event conversion, where potentially harmless LSPI events are transitioned to critical, high-pressure-peak, knock events. The relationship shown in
Figure 13, highlighting the relative conversion rate of LSPI events to knock events, highlights an improved knock protection with higher-concentration blends. It can be hypothesized that this relationship is due to the increased octane number of ethanol blends, with a quasi-linear relationship between concentration and ethanol number. Extensive studies have highlighted the role of octane number in knock prevention and is a historic method in mitigating traditional knock events in ICEs, with performance vehicles mandating the use of high-octane fuels, such as 99-octane-rated gasoline. This correlation between the octane number and proportion of end-gas knock events remains true in this study and confirms the findings of experimental studies on the same subject [
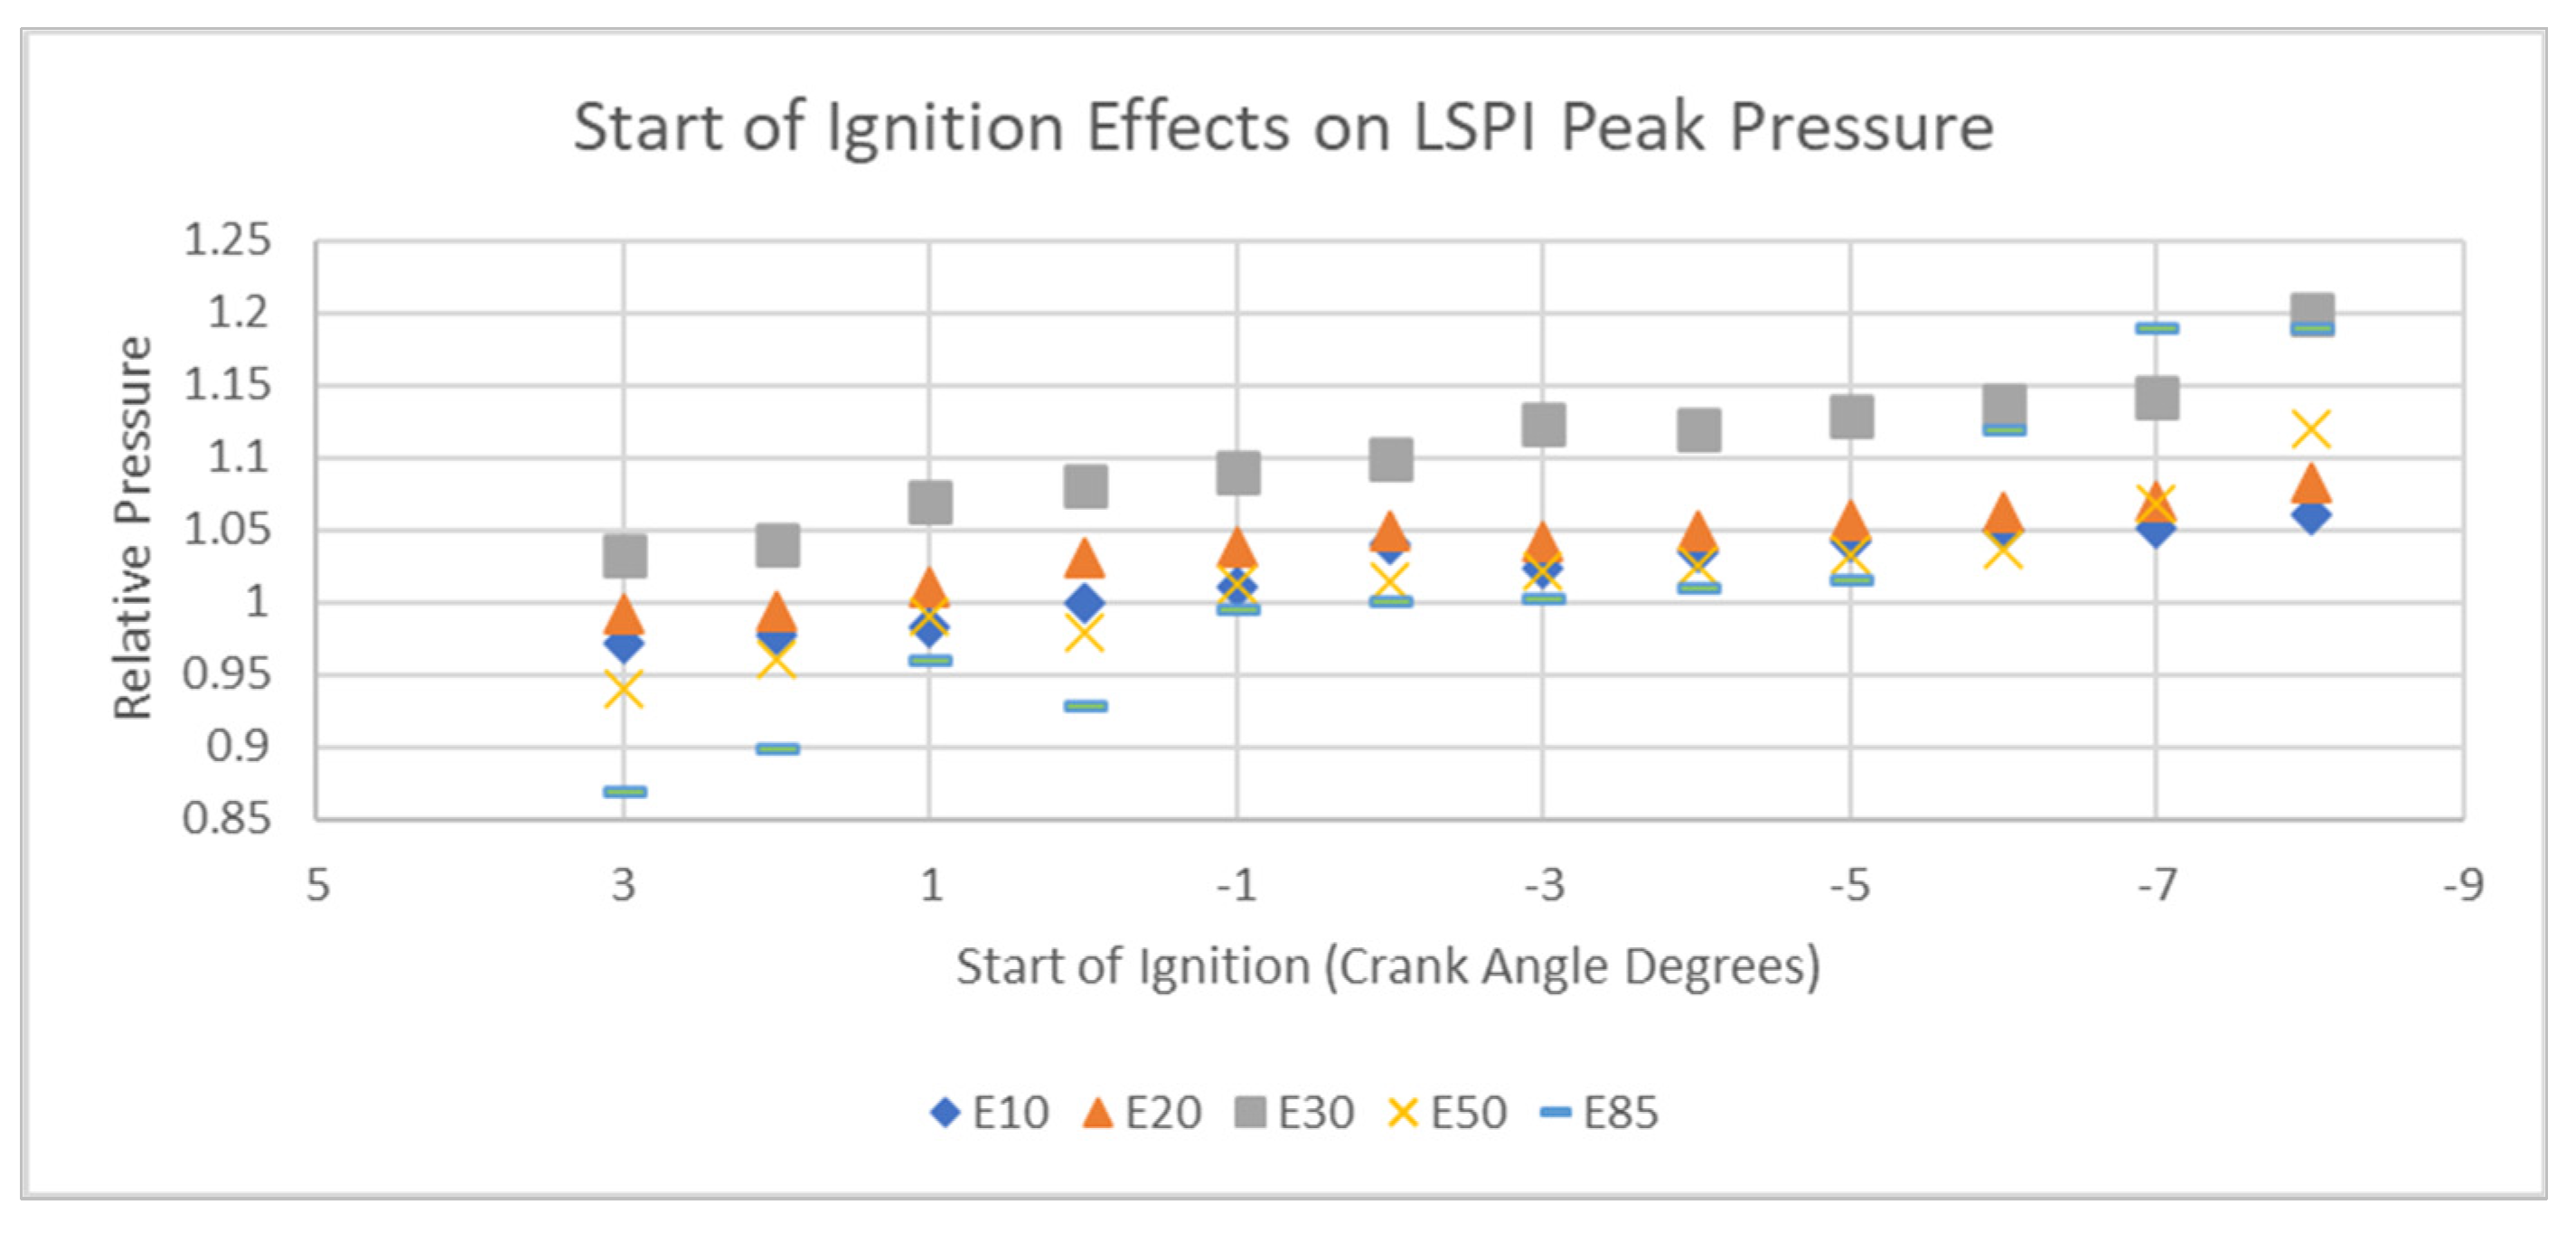
27]. While the fuel chemistry, as well as its role in autoignition, is a large determiner in the severity of LSPI events, it also plays a role in the mechanical mechanisms that affect severity, such as the start of ignition (SOI), which is a key determiner in the intensity of LSPI events. The SOI is defined as the point where the rate of change in pressure, dp/dt, exceeds the rate of change in pressure in normal combustion by 20%. This characterization follows a similar definition to the one applied to LSPI events in the detection algorithm. The trend between SOI and peak pressure is shown in
Figure 14.
The data shown in the figure above are calculated by averaging all LSPI events occurring at that SOI point for each of the ethanol blends. An earlier ignition point minimizes ignition delay effects, in turn increasing the peak pressure point and the intensity of the event. This trend is shown with the steady-state data presented above, where an earlier ignition point increases the intensity of the event. The SOI before TDC has the most profound effect, as the pressure peak is achieved far earlier in the combustion cycle, potentially aided by the small compression changes between crank angles of −10° and −5° further accelerating the combustion by providing additional energy to the process.
Alongside the governing trend in SOI and intensity, it can be seen that the start of ignition has the most profound effect on lower-concentration mixtures. This can be tied to the findings presented earlier in this section, where octane number increases with ethanol concentration. Higher-octane mixtures generally need additional timing advancements to achieve an equivalent pressure peak, due to the aforementioned dwell time effects, so early SOI for the higher-concentration fuels has a less profound effect on the overall intensity of the event.
After analysis of the effects of biofuel concentration on the actual LSPI event, consideration should be given to the methods in which these events can be predicted and mitigated against. It is clear from the results of this study that biofuels do provide a more fertile ground for LSPI initiation, and as the uptake of biofuels is only projected to increase with time, the methods in which the industry attempts to tackle the surrounding issues is an area of great prominence. Analysis of the combustion cycles immediately precursing the LSPI event will allow any trends to be highlighted before an analysis of the mitigating study into dual injection.
Identifying trends precursing an LSPI cycle is a key step in developing a mitigation strategy; without prior knowledge of any events impeding occurrence, initiating a mitigating strategy becomes far more difficult. Analysis of the combustion event immediately preceding an LSPI event highlights some sporadic trends, that, with further analysis, may provide an indication of the LSPI event taking place.
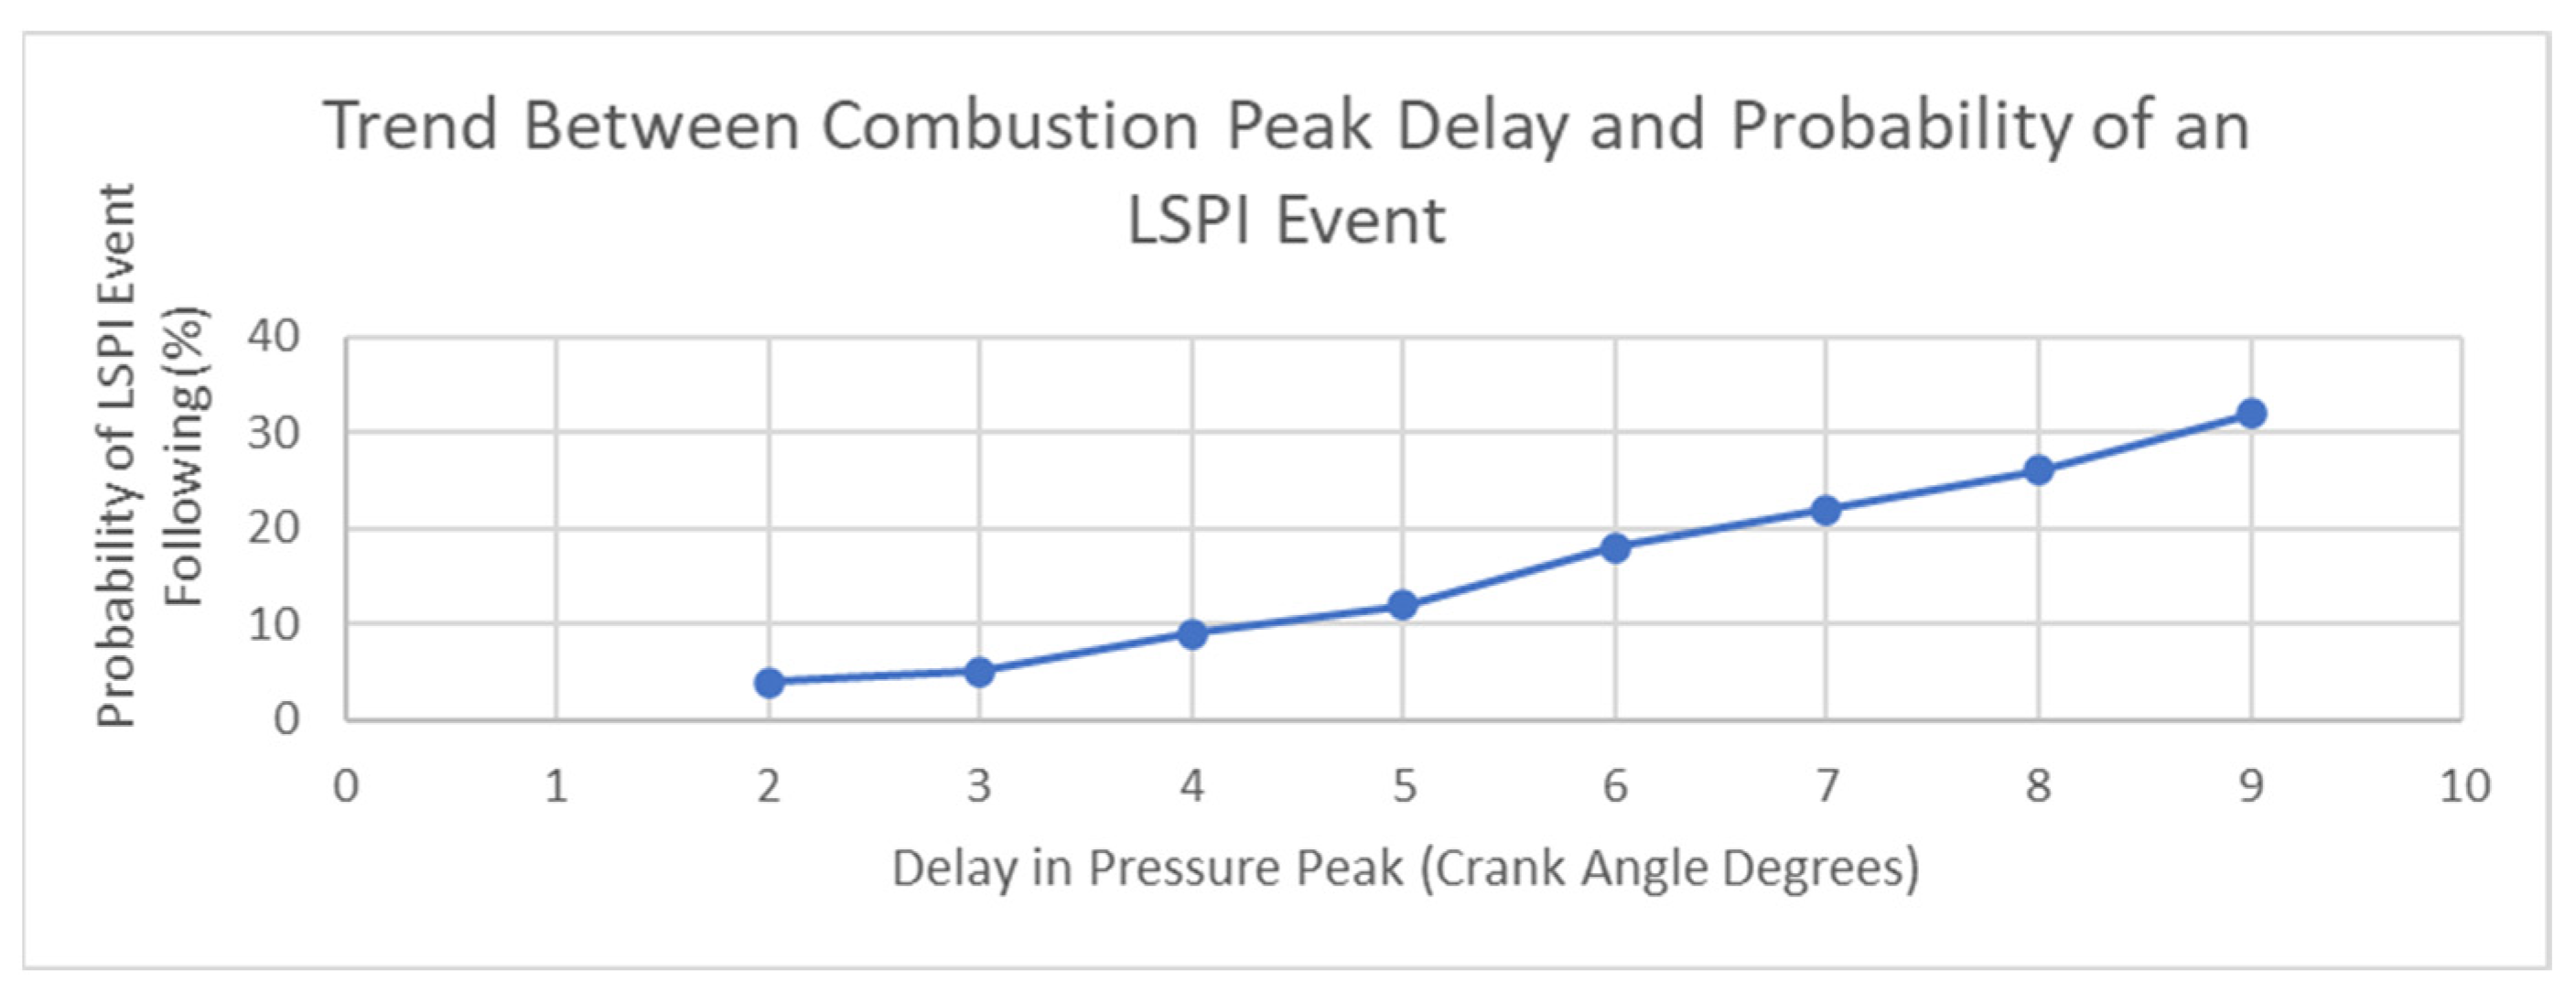
In approximately 30% of LSPI events, the preceding combustion event features a subtly different pressure profile, with a marginally later pressure peak than in the average combustion event. This may in turn be a driving factor in the initiation of the autoignition, as the previous cycle provides more optimal in-cylinder conditions for the phenomenon to occur. The more delayed the pressure peak in the preceding cycle, the higher the probability of an LSPI event subsequently occurring, as highlighted in
Figure 15.
This shows that the later the pressure peak, the more likely an LSPI event is to occur in the following cycle. It is unclear whether this trend is an indicator of LSPI itself, or a mechanism in which LSPI events may occur, with residual pressure and in-cylinder characteristics carrying through, impacting the following cycle. With a pressure peak occurring at a crank angle of 2° later than the average trace, there is only a 5% likelihood of an LSPI event following, with the worst-case scenario being a greatly delayed peak at a 9° crank ankle, leading to a 32% event probability. If further studies do highlight this trend as an indicator, utilizing this information to formulate a mitigation strategy would prove difficult, with a single cycle forewarning providing inadequate time to implement a controlled mitigation strategy effective against LSPI. Even in the worst-case scenario, a 32% conversion to LSPI events would leave roughly 2/3 of occurrences not requiring mitigation, meaning any control strategy based on this trend would be ineffective for the majority of the time, only serving to unnecessarily reduce the performance of the ICE and dilute the benefits of using biofuels. If a clear indicator of LSPI is discovered, one mitigation strategy analyzed in this study is the role of dual injection, or a pre-injection strategy. With a success rate of over 90% in reducing LSPI frequency for all ethanol concentrations, this strategy appears an effective one, utilizing a leaner initial mix to limit the associated pressure peak, while artificially mimicking the expected double peak profile of a standard combustion event for this hardware. To summarize, the analysis of the results is presented in
Table 2 provided below, justifying the main trends in each test [
27].
Despite the clear trends achieved, the use of the model in its current developmental phase omits the effects of fluid interactions within the cylinder and the process of dirtying and particle flaking, which cannot be effectively resolved through the use of one-dimensional CFD processing. This is not to discount the findings of this project but instead to use the findings as a building block upon which further research can be completed, with fluid-driven mechanisms combined with the chemical interactions discussed. Further work surrounding these fluid interactions is recommended, with an integrated 3D solver, to accompany the rFlame-driven 1D solver, a key milestone in improving the model and developing a fully fledged simulation tool capable of replacing experimental research into LSPI. With the integration of 3D solvers, a robust statistical model will require development to effectively represent the stochastic nature of LSPI, particularly when analyzing the role of impingement and particulate hotspots [
28,
29].
With the model in its current form, recommended further work will surround the role of HoV on LSPI, with a correlative study into the critical enthalpy of vaporization for LSPI reduction highlighting the optimal ethanol concentration for adoption in modern ICEs. Controlled studies into the effect of individual fuel properties, by modifying fuel database values to create custom fuels, will highlight the role of each chemical property more clearly, and build upon the conclusions. In relation to the trends identified in this study, it can be seen that ethanol concentration does play a key role in the initiation of LSPI. E30 is highlighted as a critical blend that displays the worst behavior of all biofuels tested in this study, with the blend ineffectively harnessing the positive characteristics of bioethanol, while also possessing the characteristics most likely to produce a severe, and frequent, LSPI event. Both E50 and E85 bioethanol appear to be an improvement on the current forecourt standard E10, treated as the baseline fuel in this study, with favorable frequency and severity effects. Despite this, these high-concentration blends cannot be imminently mandated, as hardware changes will be required to mitigate against the physical damage associated with ethanol use in modern fuel and injection systems.
In its current usage, E85 is primarily used in high-performance applications, with specially adapted fuel systems, and until the technological advancements developed at the cutting edge of motorsport bleeds down to the affordable passenger car, the commercial use of high-concentration biofuels will be cost-prohibitive.
Despite the issues addressed with high-concentration biofuels, the future of alternative fuels will definitely include bioethanol, as its emission-reducing qualities are not found in other alternative fuels with such a simplistic deployment. The current standard E10 fuel is as far as the industry can take biofuel concentration currently, with 20 and 30% concentrations displaying poorer LSPI performance, and high concentrations being both damaging and cost-prohibitive, but with the pace of the industry, and the drive and desire of OEMs to further reduce emissions and develop ultra-efficient propulsion systems, the expectation is that the fuels studied in this report will only become relevant as a tool in ensuring the longevity of ICEs, bridging the gap while electrified infrastructure is improved.


