1. Introduction
Lithium ion battery (LIB) fires are a considerable challenge for designers, as energy work is focused on increasing the energy density of battery systems to achieve society’s electrification goals as well as improving electronics’ battery life [
1]. These fires are linked to the flammability of the electrolyte and pose not only a significant safety hazard due to the heat [
2], but also the harmful chemicals that can be released during combustion [
3]. Therefore, it is imperative to characterize the fundamental chemistry behind the electrolyte’s flammability so strategies to prevent igniting batteries can be designed.
LIBs utilize an electrolyte mixture as a medium to exchange ions from one pole of the capacitor to another. For LIBs in particular, the electrolyte medium allows for the movement of lithium ions between the electrodes, making them continually rechargeable. This electrolyte medium consists of many different compounds, but they mainly comprise both linear and cyclic carbonates [
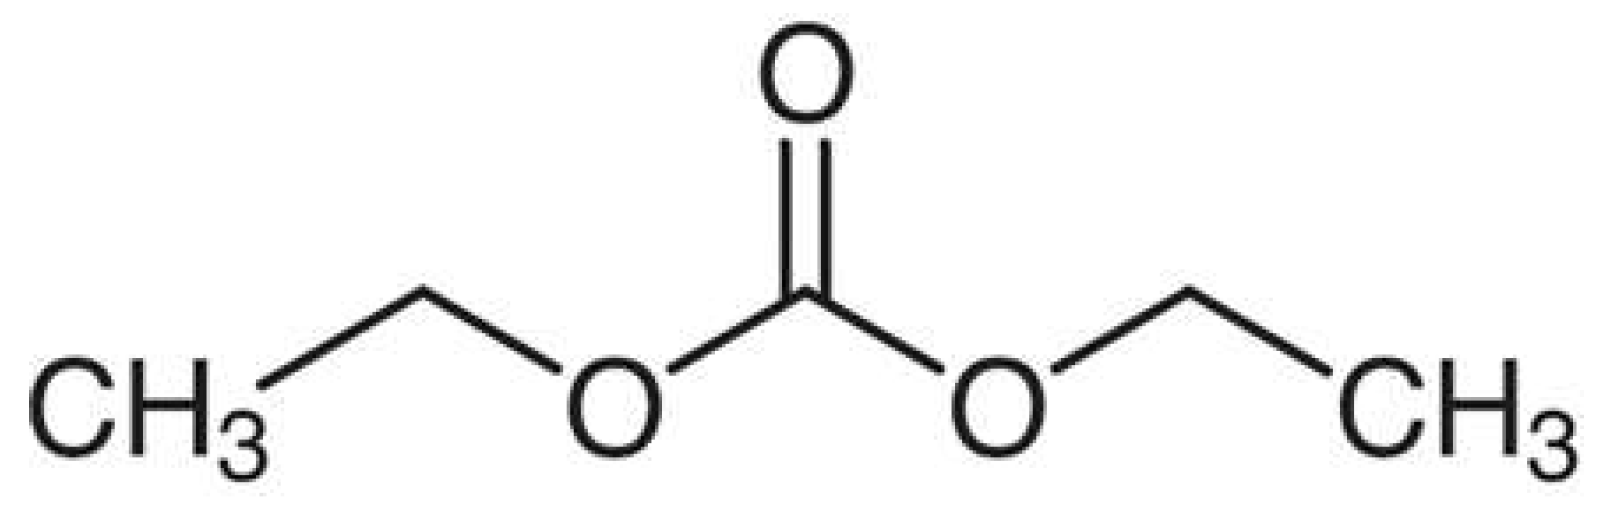
4]. One of these common solvents is diethyl carbonate (DEC), a symmetric ester of carbonic acid and ethanol taking the form shown in
Figure 1. Additionally, the chemical kinetics of DEC combustion are not only important to LIBs from a process safety perspective, but also from a transportation and propulsion perspective. Specifically, DEC is a candidate as an oxygenated additive in diesel fuel due to its availability, bio-derived nature, and reduction of CO
2 and particulate emissions [
5,
6,
7].
As such, several recent studies have investigated the chemical kinetics of DEC combustion both experimentally and numerically. Nakamura et al. [
8] conducted the first comprehensive kinetics study, producing ignition delay times (IDT) from a rapid compression machine (RCM) and a shock tube (ST), speciation from a jet-stirred reactor (JSR), as well as ab initio calculations for target ROO
• isomerization rate constants. Conditions investigated ranged in temperatures from 500 to 1300 K and at pressures of 10 and 30 bar for fuel-lean, stoichiometric, and fuel-rich mixtures. The resulting mechanism presented therein well-reproduced the IDT data and most of the speciation data. However, a significant under-prediction of at least 40% was shown for ethanol and ethylene, both formed via two of the most important reactions to DEC decomposition:
| DEC ⇌ CCOC*OOH + C2H4 | (R1) |
| CCOC*OOH ⇌ C2H5OH + CO2 | (R2) |
Later, Shahla et al. [
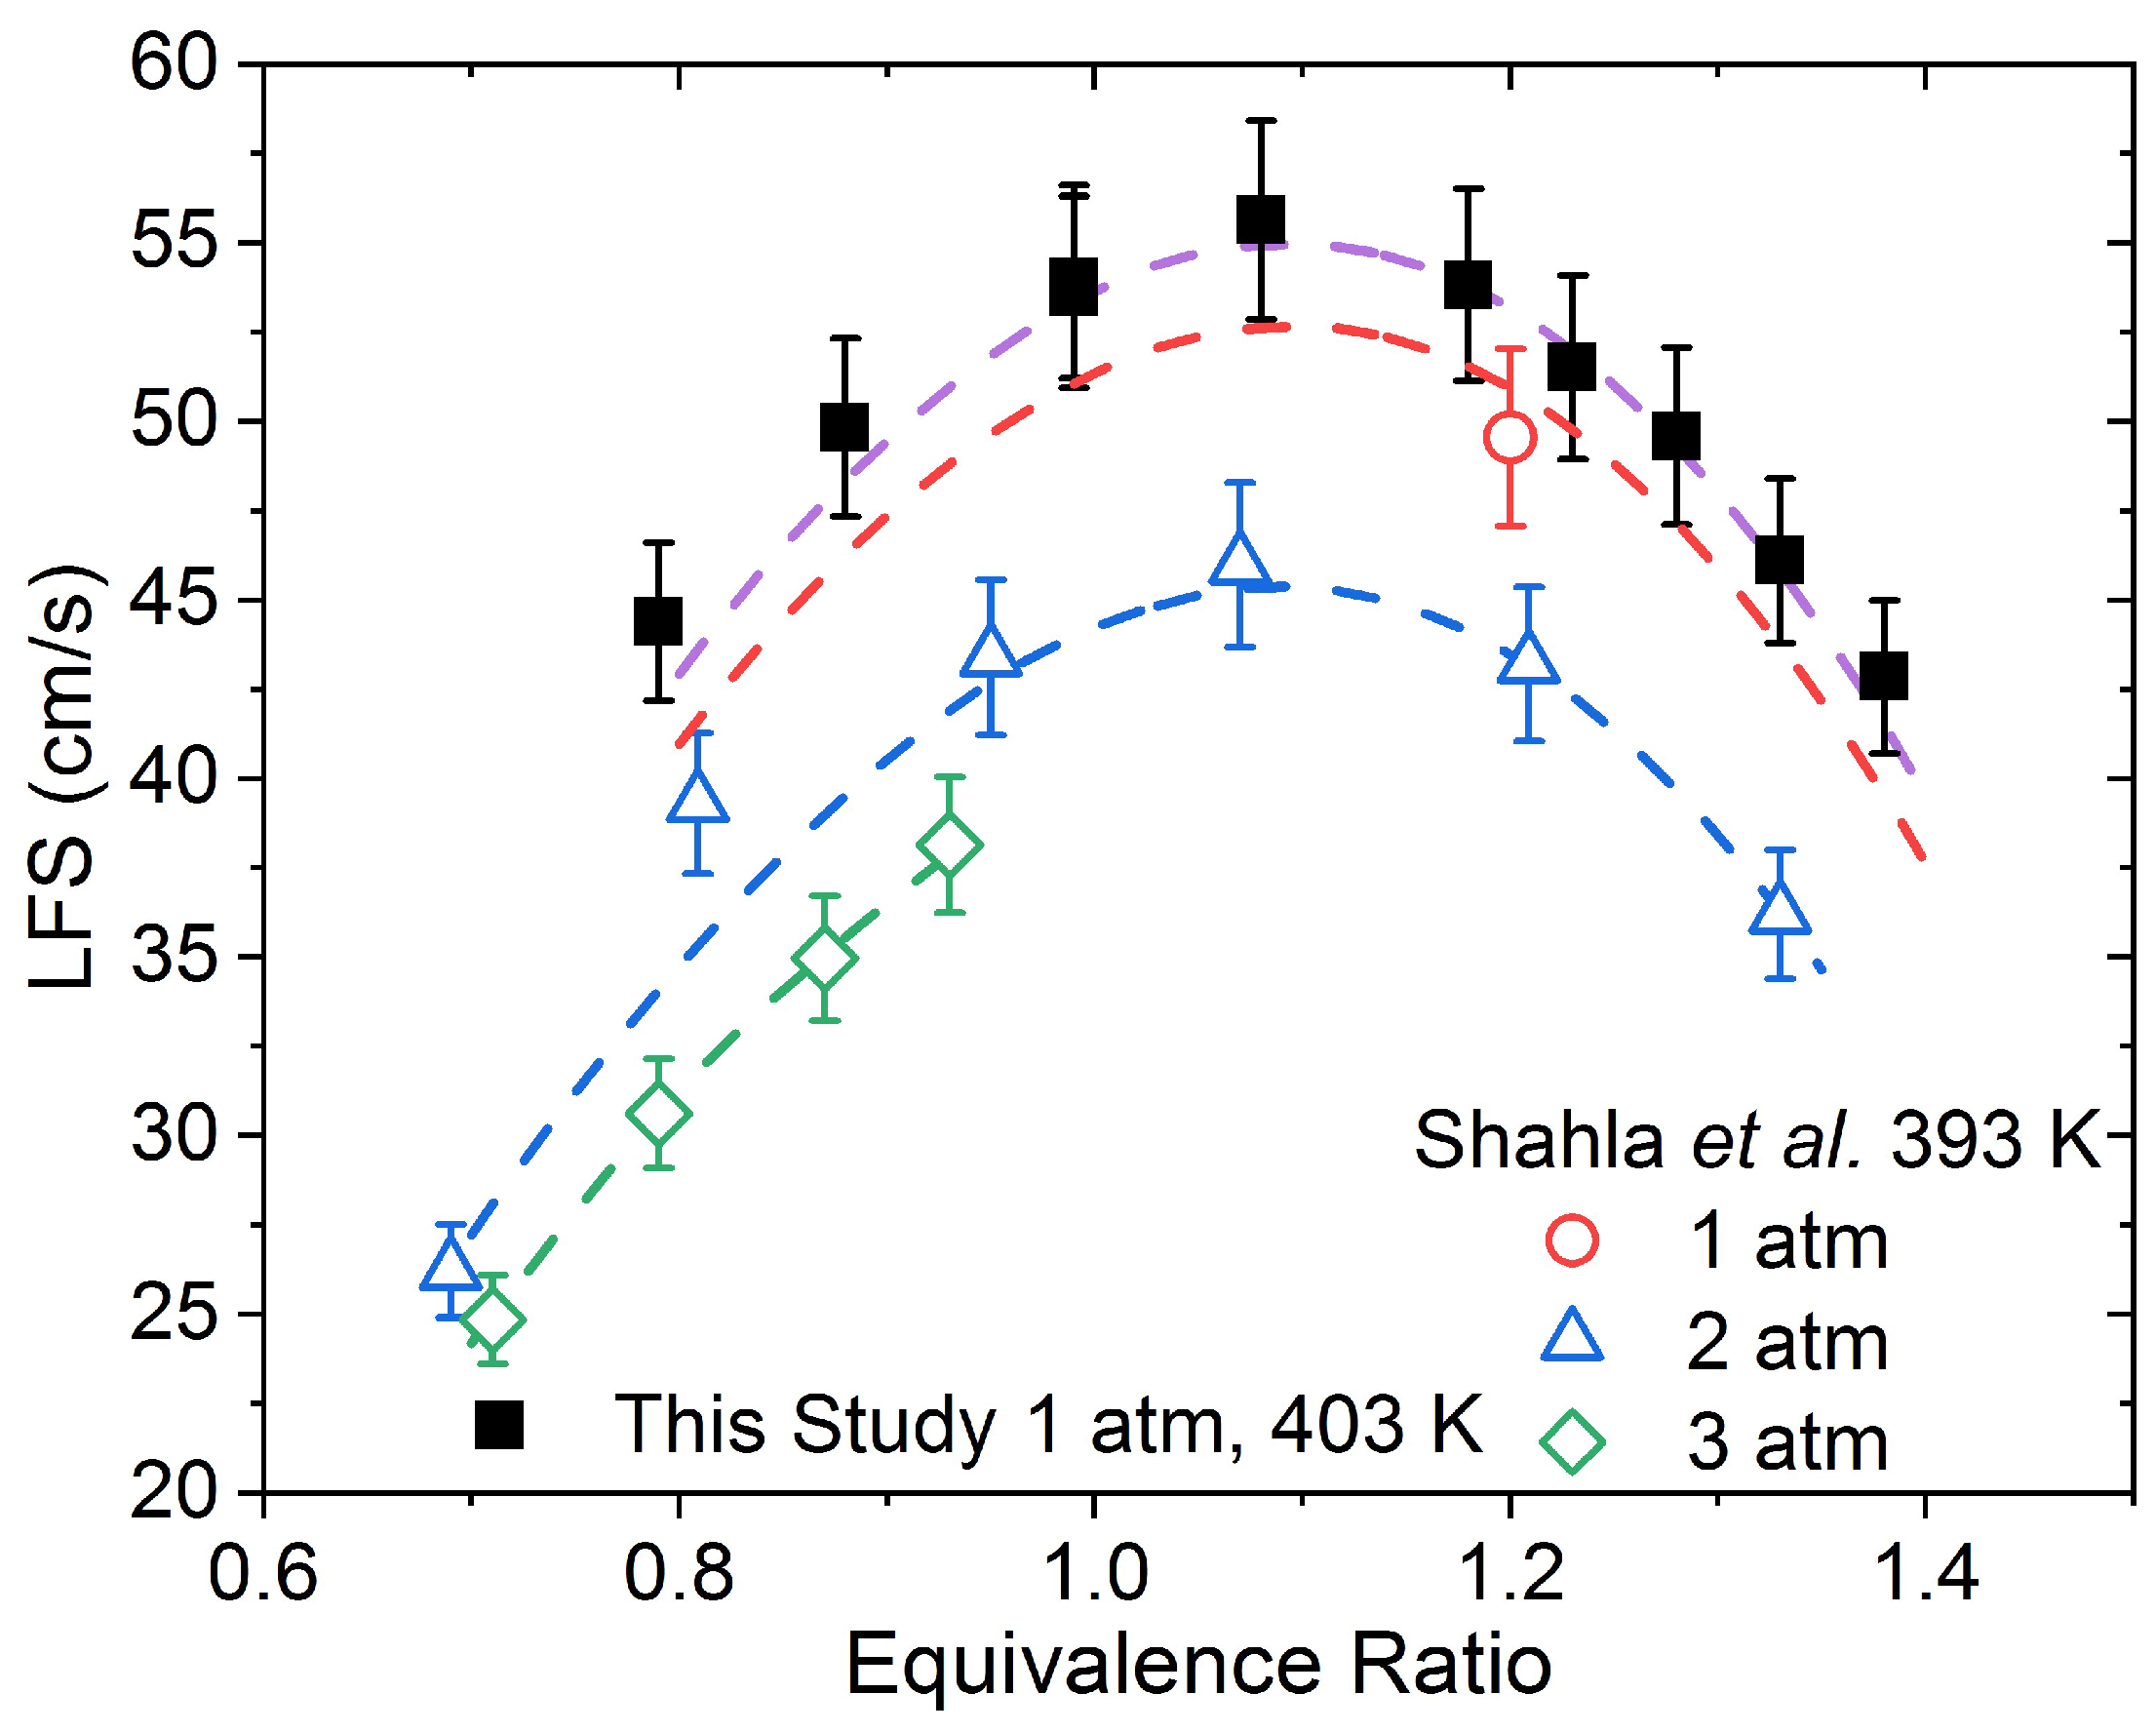
9] further investigated DEC combustion in a JSR, but at near atmospheric pressure and also presented laminar flame speed (LFS) data for DEC at an initial temperature of 393 K for pressures between 1 and 3 atm. This time, ethanol production was significantly overestimated by the model presented therein, while ethylene formation was well-predicted. The LFS data were well-reproduced by the model, but the number of data were limited, particularly at 1 and 3 atm, due to reported instability issues. Sun et al. [
10] then measured speciation during DEC pyrolysis and combustion in a flow reactor for pressures up to 1 atm and presented rate coefficients for the pressure-dependent unimolecular decomposition of DEC using RRKM/master equation calculations. Sun et al. used these rate calculations to modify the Nakamura et al. [
8] model, which significantly helped with reproducing the pyrolysis data, but issues remained for the oxidation data, particularly for ethanol, ethylene, and propane. The thermal unimolecular decomposition of DEC was investigated experimentally by AlAbbad et al. [
11] in a shock tube, complemented by ab initio calculations. Excellent agreement with the measurements was found with the earlier study of Herzler et al. [
12].
More recently, Sela et al. [
13] utilized a single-pulse shock tube and a flow reactor to measure CO
2, C
2H
4, and C
2H
5OH at temperatures between 663 and 1203 K at 1 and 2 bar. Additional ab initio calculations were performed, and the resulting rate coefficients were used to update the Sun et al. [
10] mechanism. The resulting model well-reproduced the flow-reactor data and the DEC, ethanol, and ethylene shock-tube results. However, significant over-prediction is shown for the CO
2 shock-tube results. Even more recently, Kanayama et al. [
14] and Takahashi et al. [
15] released a comprehensive, two-part study on carbonate ester oxidation and pyrolysis in a micro-flow reactor with a controlled temperature profile at atmospheric pressure and temperatures between 700 and 1300 K. Kanayama et al. focused on ethyl methyl carbonate (EMC), while Takahashi et al. concentrated on dimethyl carbonate (DMC) and DEC and provided a good review of the literature for both. That is, Kanayama et al. thoroughly described the current state of affairs for DMC and DEC, introduced some new data in this area, and utilized the chemistry from these molecules to develop the first mechanism for EMC oxidation and pyrolysis. The resulting mechanism utilizes an updated Nakamura et al. model, taking advantage of reaction rate updates from Sun et al. [
10] and Sela et al. [
13]. While some progress has been made to improve modeling efforts for the combustion of carbonates, work remains for DEC combustion in particular. Specifically, additional IDT, LFS, and laser absorption data are needed to develop and validate chemical kinetics mechanisms.
To this end, the goal of this project is to develop a mechanism that can accurately predict thermal runaway in battery systems. To achieve this goal, a comprehensive study of the combustion properties of an average thermal-runaway gas (TRG), consisting of propane, ethane, ethylene, methane, hydrogen, carbon monoxide, and carbon dioxide, was conducted by Mathieu et al. [
16], collecting IDT and H
2O time histories in a shock tube and LFS in a constant-volume vessel. This review showed that the NUIGMech 1.1 mechanism [
17] performs the best at reproducing TRG combustion, leading to it being the choice for base chemistry for the mechanism. Next, the fundamental chemistry of the pyrolysis of three common electrolytes, DMC, DEC, and EMC, was investigated by Grégoire et al. [
18] using a shock tube to measure CO time histories near atmospheric pressure over a temperature range of 1230–2375 K. The Takahashi et al. [
15] model was used for the DMC, DEC, and EMC submechanisms, with updates to the DMC submechanism using the work from Atherley et al. [
19] and significant updates to the DEC submechanism using theoretically derived rates from Sela et al. [
13] as well as updates to several initial decomposition reactions. Additionally, updates were made to the ethanol submechanism due to its rapid formation during DEC pyrolysis. The resulting mechanism (referred to here as the TAMU mechanism) well-reproduces the CO time histories presented therein, and does particularly well for the DEC results.
However, it is noted that significant issues remain with the base alcohol chemistry from the NUIGMech 1.1, contributing to poor EMC prediction. Mathieu et al. [
20] also investigated bis(2,2,2trifluoroethyl)carbonate (DtFEC), a fluorinated carbonate with similar molecular structure to DEC. This study again collected IDT, LFS, and CO time histories, but for the combustion of H
2 and CH
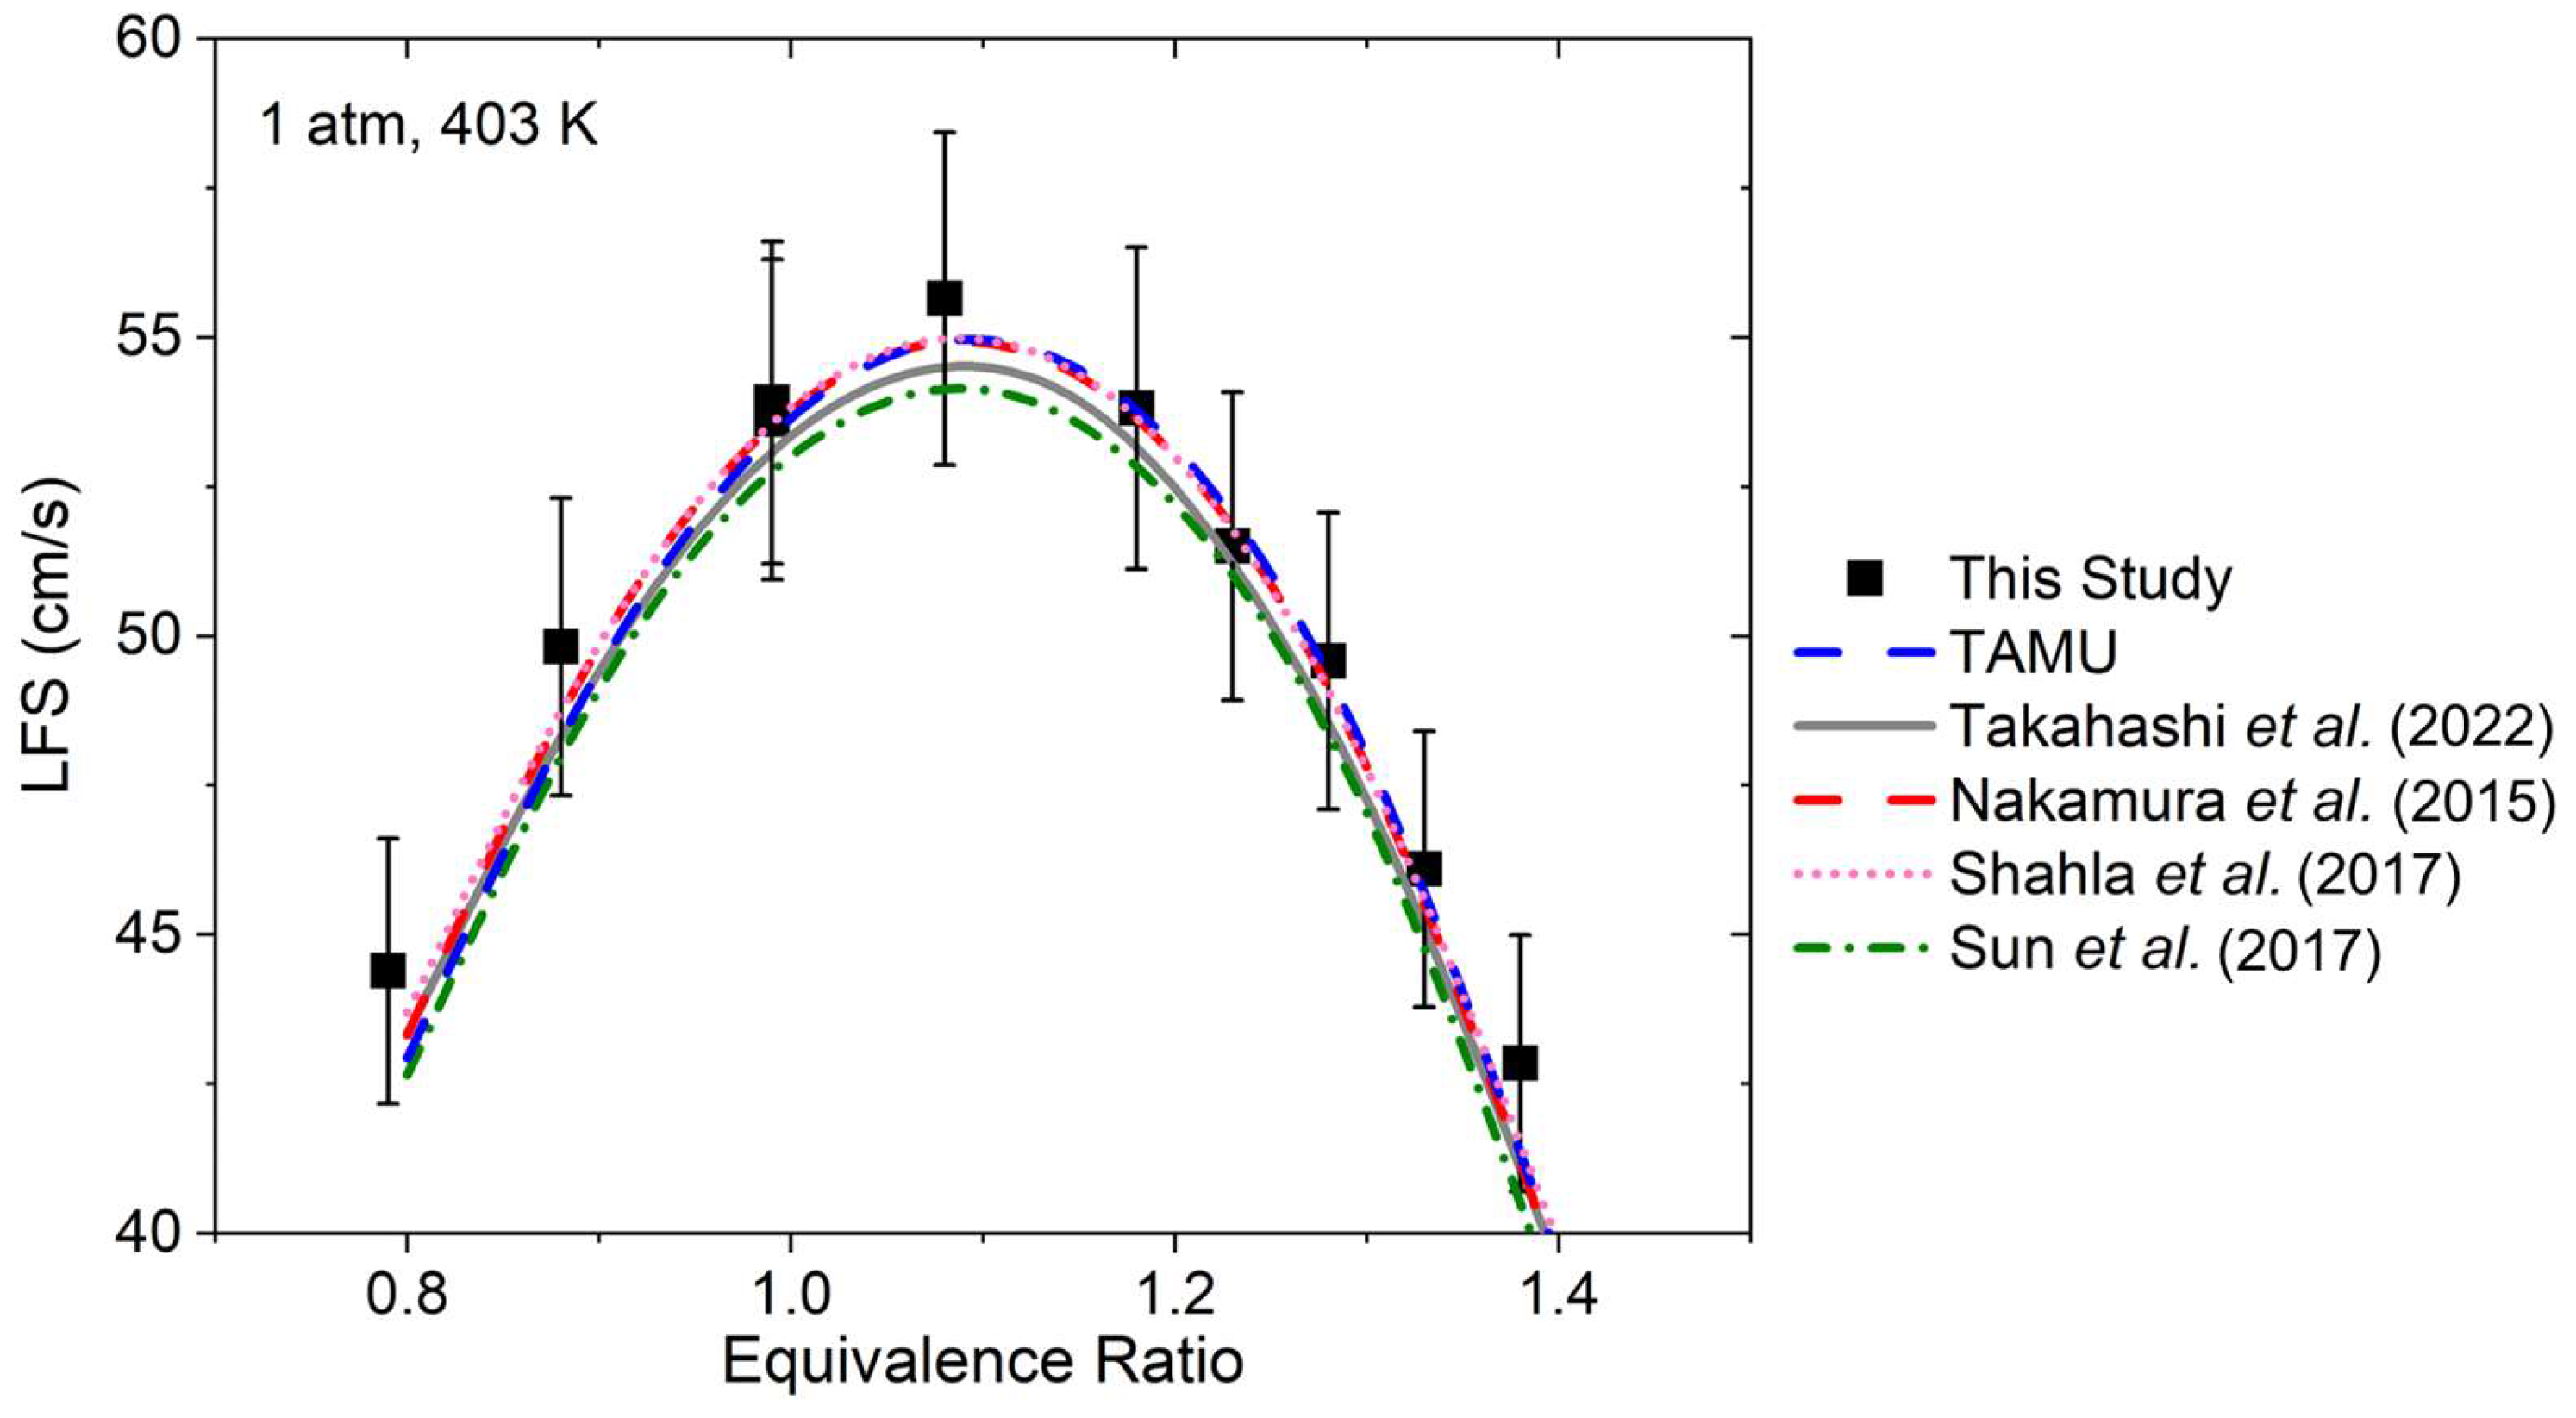
4 with DtFEC as additive. A DtFEC submechanism was added to the TAMU mechanism, allowing for the comparison of DtFEC with DEC as a potential partial replacement for DEC in the electrolyte to minimize the LIB’s reactivity. Therefore, a similar set of experiments is required and was performed in this study to accurately model DEC combustion at similar conditions. To this end, IDT and CO time histories were collected in a shock tube for combustion of DEC at fuel-lean, stoichiometric, and fuel-rich conditions near atmospheric pressure for temperatures between 1182 and 1669 K. Additionally, LFS data were measured using spherically expanding flames in a constant-volume vessel at initial conditions of 403 K and 1 atm. The data are compared with the TAMU mechanism as well as others from the literature, and a detailed discussion of the resulting chemistry is presented.
4. Discussion
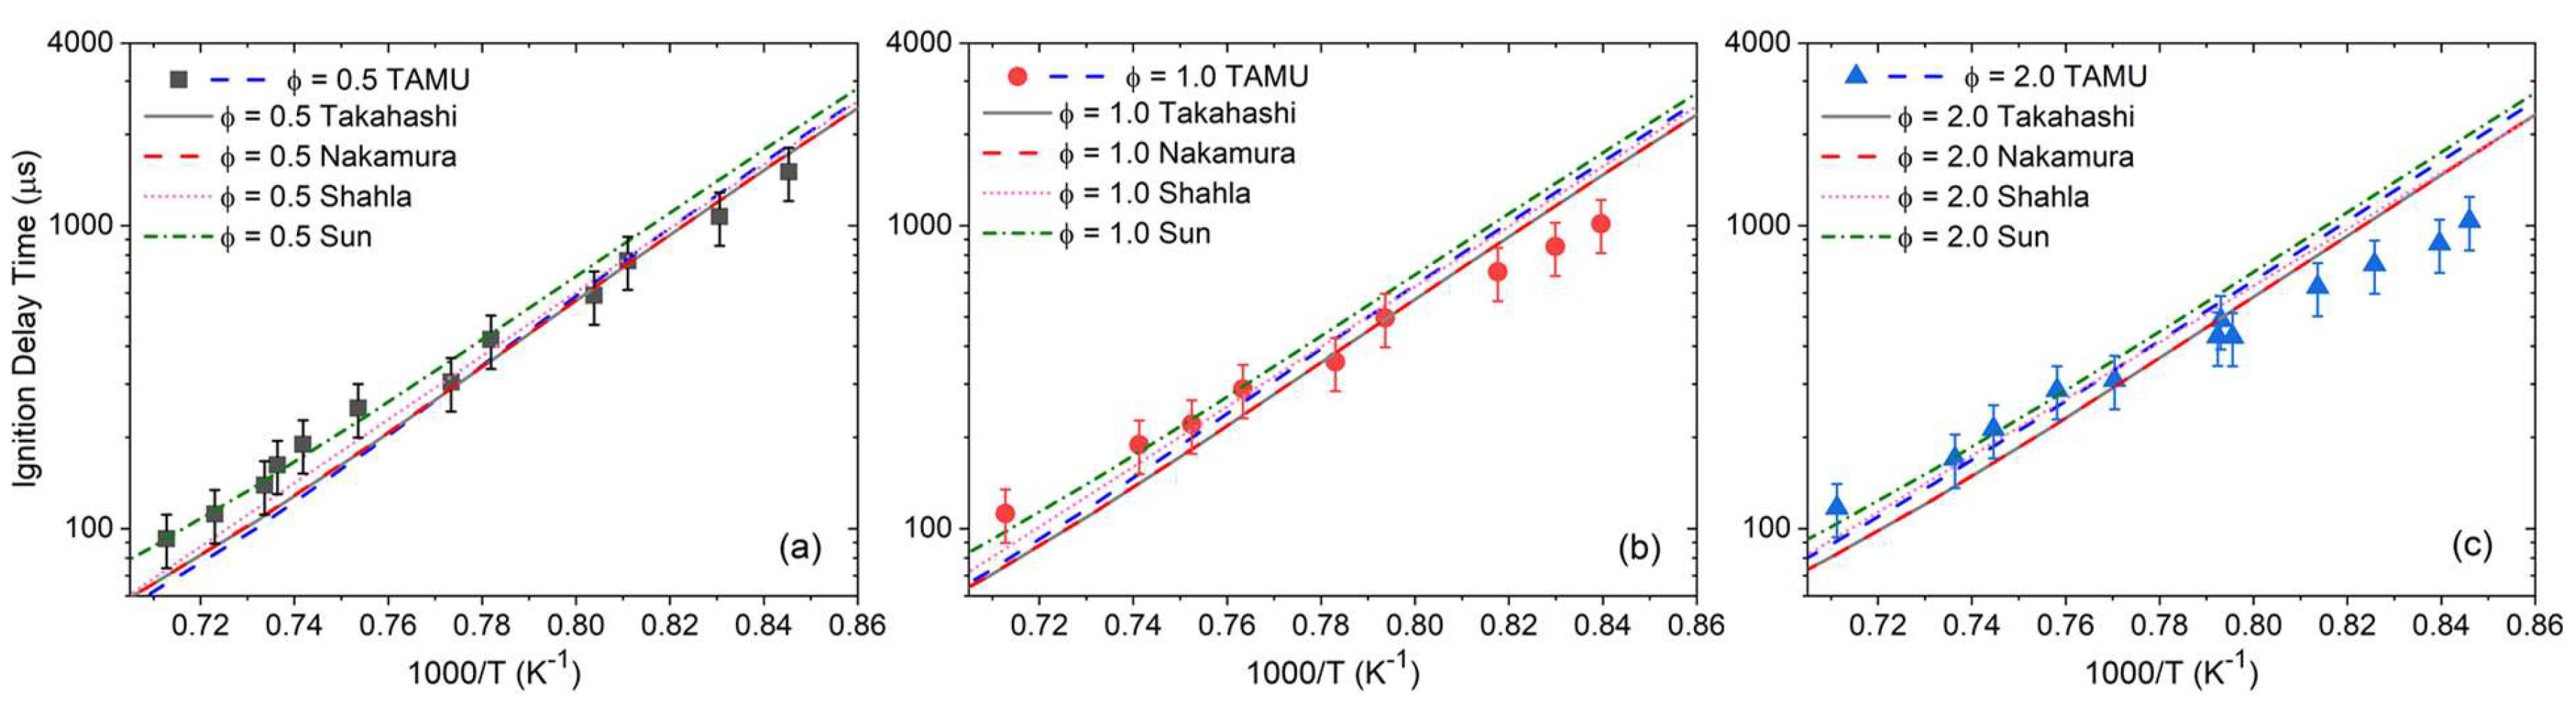
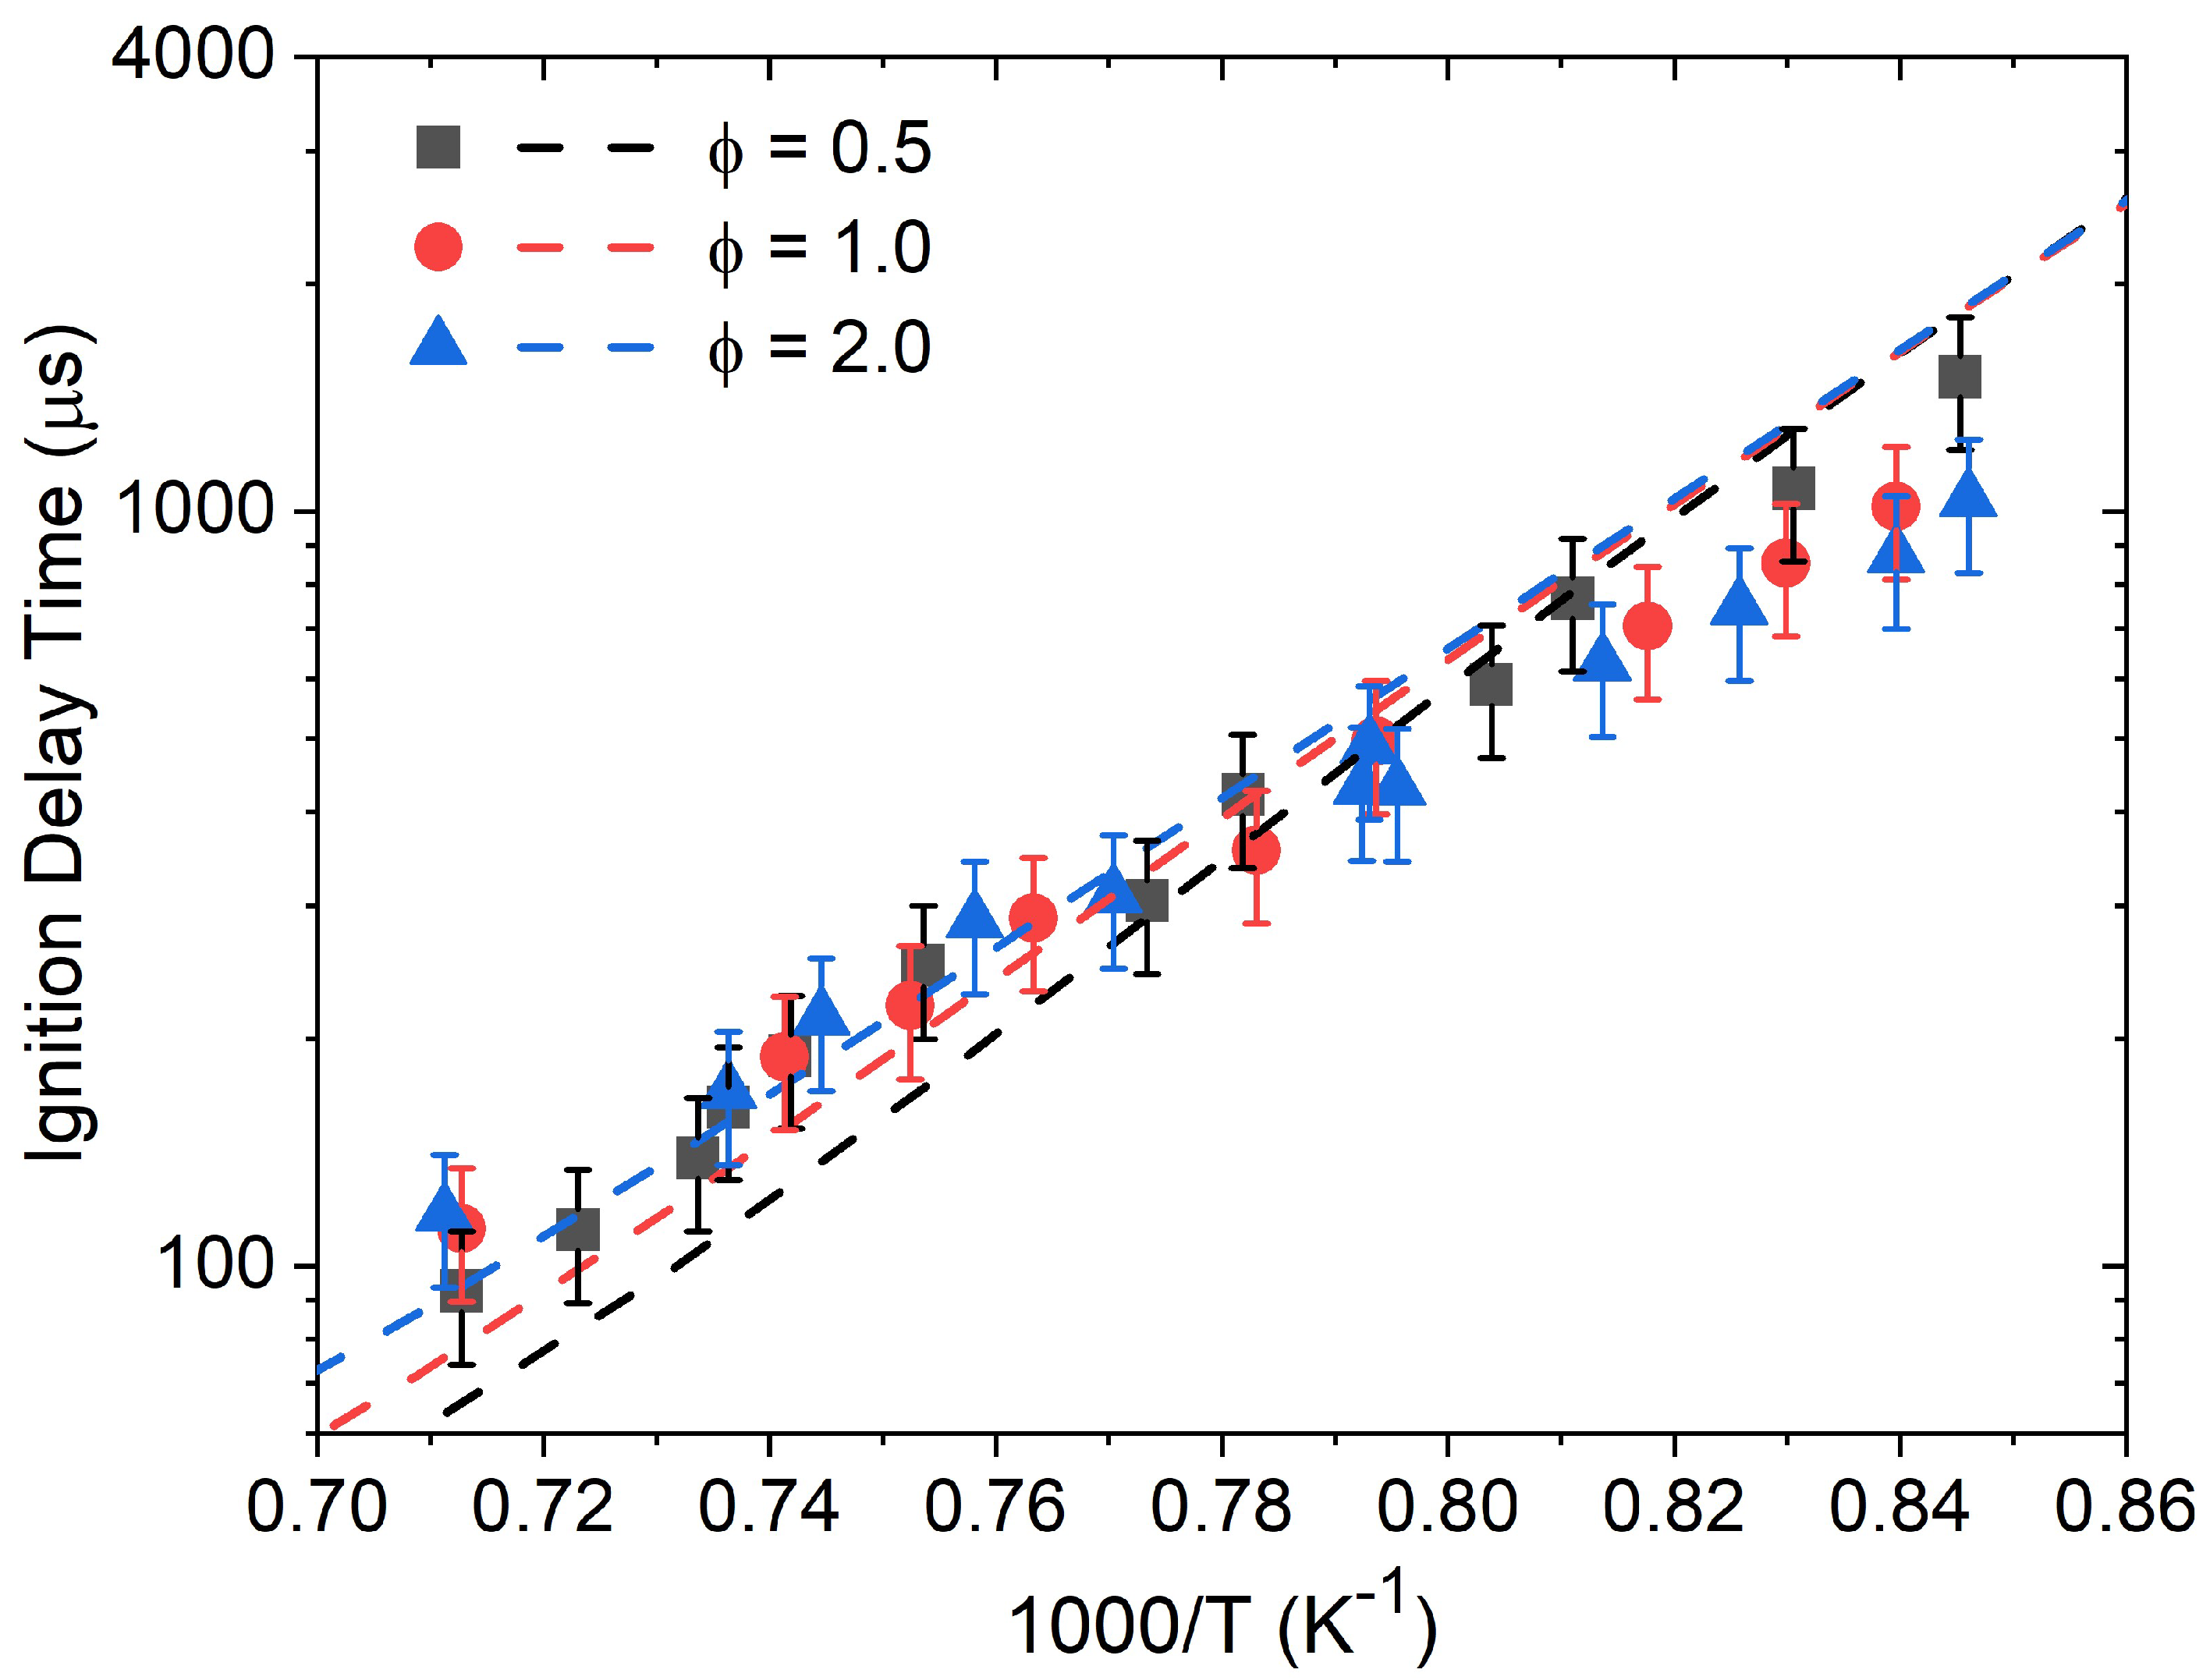
As can be seen in
Figure 4,
Figure 5,
Figure 6 and
Figure 7, global kinetics data such as ignition delay time and laminar flame speed were reproduced with high accuracy overall by the models considered herein. On the other hand, large discrepancies were observed for the CO profiles’ predictions. This result illustrates the importance of this level of kinetics data, where the high dilution level translates to minor changes in pressure and temperature during the course of the experiment, and where the profile of the species followed experimentally typically depends on a limited set of reactions and the accuracy of their reaction coefficients. This discrepancy in the models’ performance between global kinetics data and kinetics measurements has been observed recently in the authors’ work on various alcohols [
25,
36,
46]. In the authors’ opinion, since the global kinetics data are accurately reproduced, the CO profiles presented herein should be the main focus of this discussion section to provide ways to improve the model.
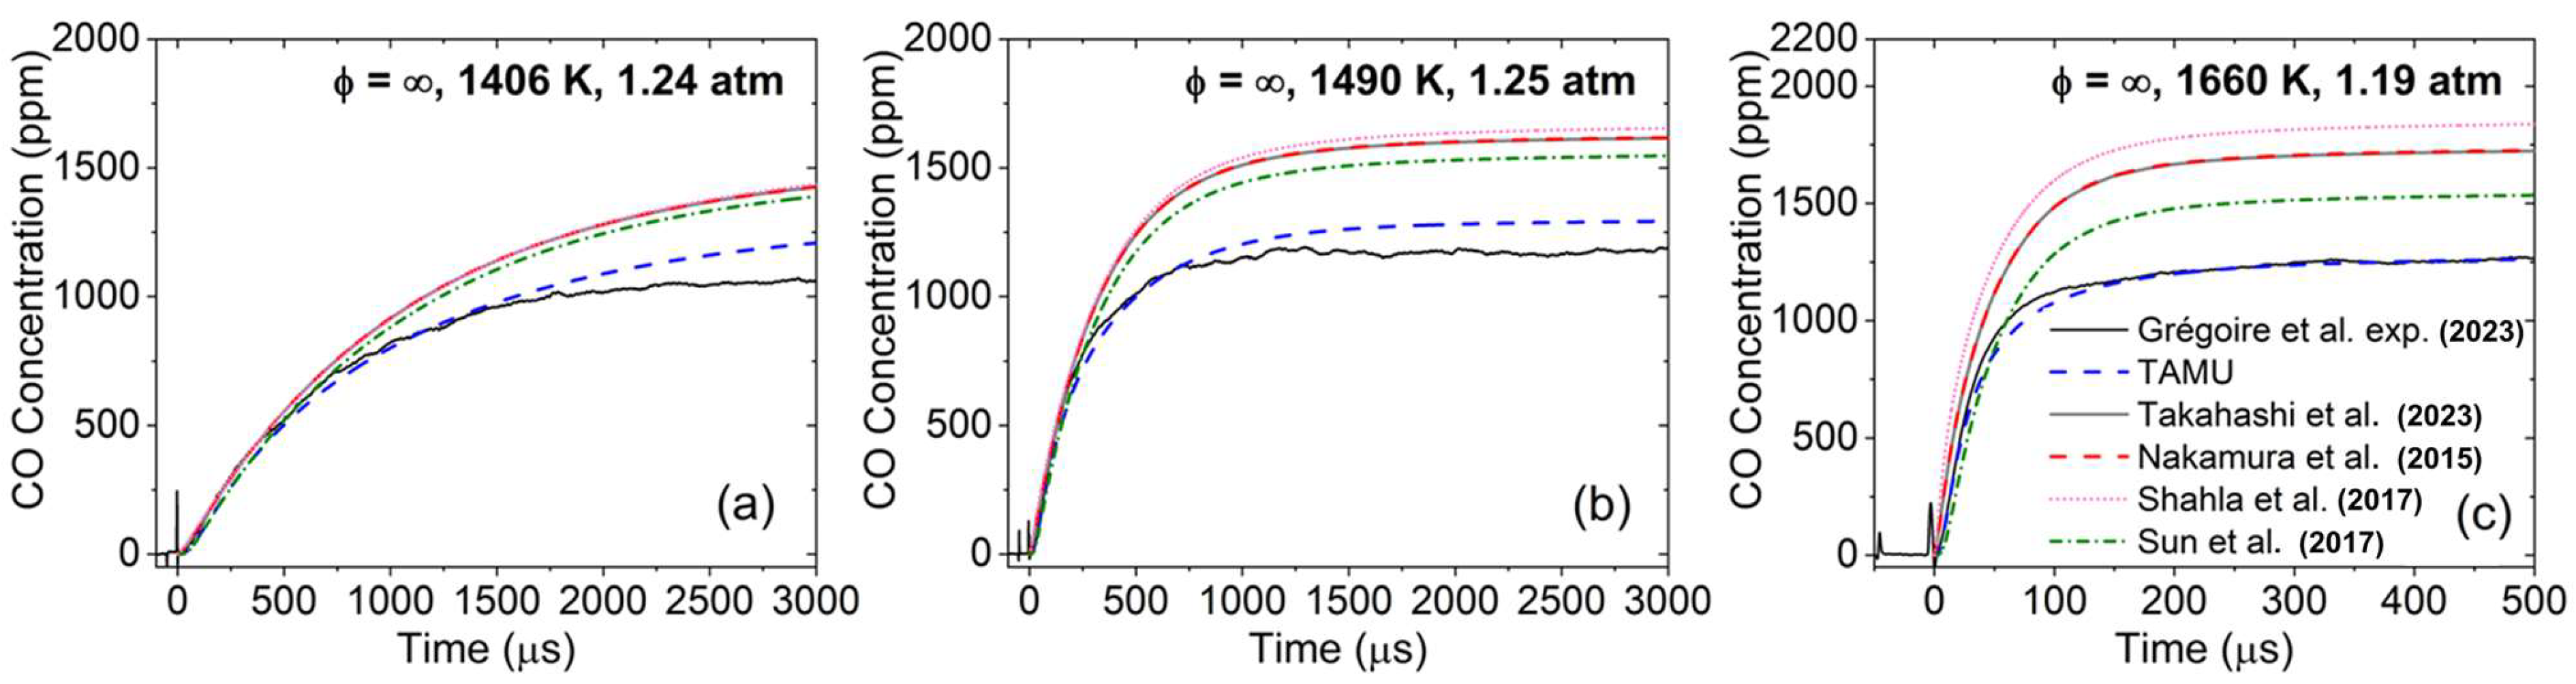
To this end, it is interesting to first compare the performance of the models considered herein on CO profiles obtained during the pyrolysis of DEC [
18], shown in
Figure 8. As can be seen, (i) all models but the TAMU one largely over-estimated the amount of CO produced, and (ii) the TAMU model was very slightly less reactive than the other models concerning the rate at which the CO level reached a plateau. With these observations in mind, it is interesting to see in
Figure 3 that the TAMU model is now notably more reactive than the other models and reached the same amount of CO at ϕ = 2.0 than the other models, which is the condition the closest to the pyrolysis condition investigated in [
18] and visible in
Figure 8.
Under pyrolysis conditions, as seen in the authors’ previous study, the CO formation from DEC pyrolysis occurs primarily via (the reaction numbers and the names of the molecules and radicals correspond to those in the TAMU model):
| DEC ⇆ CCOC*OOH + C2H4 | (R1186) |
| CCOC*OOH ⇆ C2H5OH + CO2 | (R1222) |
| C2H5OH ⇆ CH3 + CH2OH | (R514) |
| CH2OH (+M) ⇆ CH2O + H (+M) | (R197) |
| CH2O + H ⇆ HCO + H2 | (R177) |
| HCO + M ⇆ H+ CO + M | (R187) |
This pathway is denominated Pathway A. However, note that there is a secondary pathway after the two first decomposition reactions:
| C2H5OH + H ⇆ SC2H4OH + H2 | (R524) |
| SC2H4OH (+M) ⇆ CH3CHO + H (+M) | (R539) |
| CH3CHO + H ⇆ CH3CO + H2 | (R421) |
| CH3CO (+M) ⇆ CH3 + CO (+M) | (R439) |
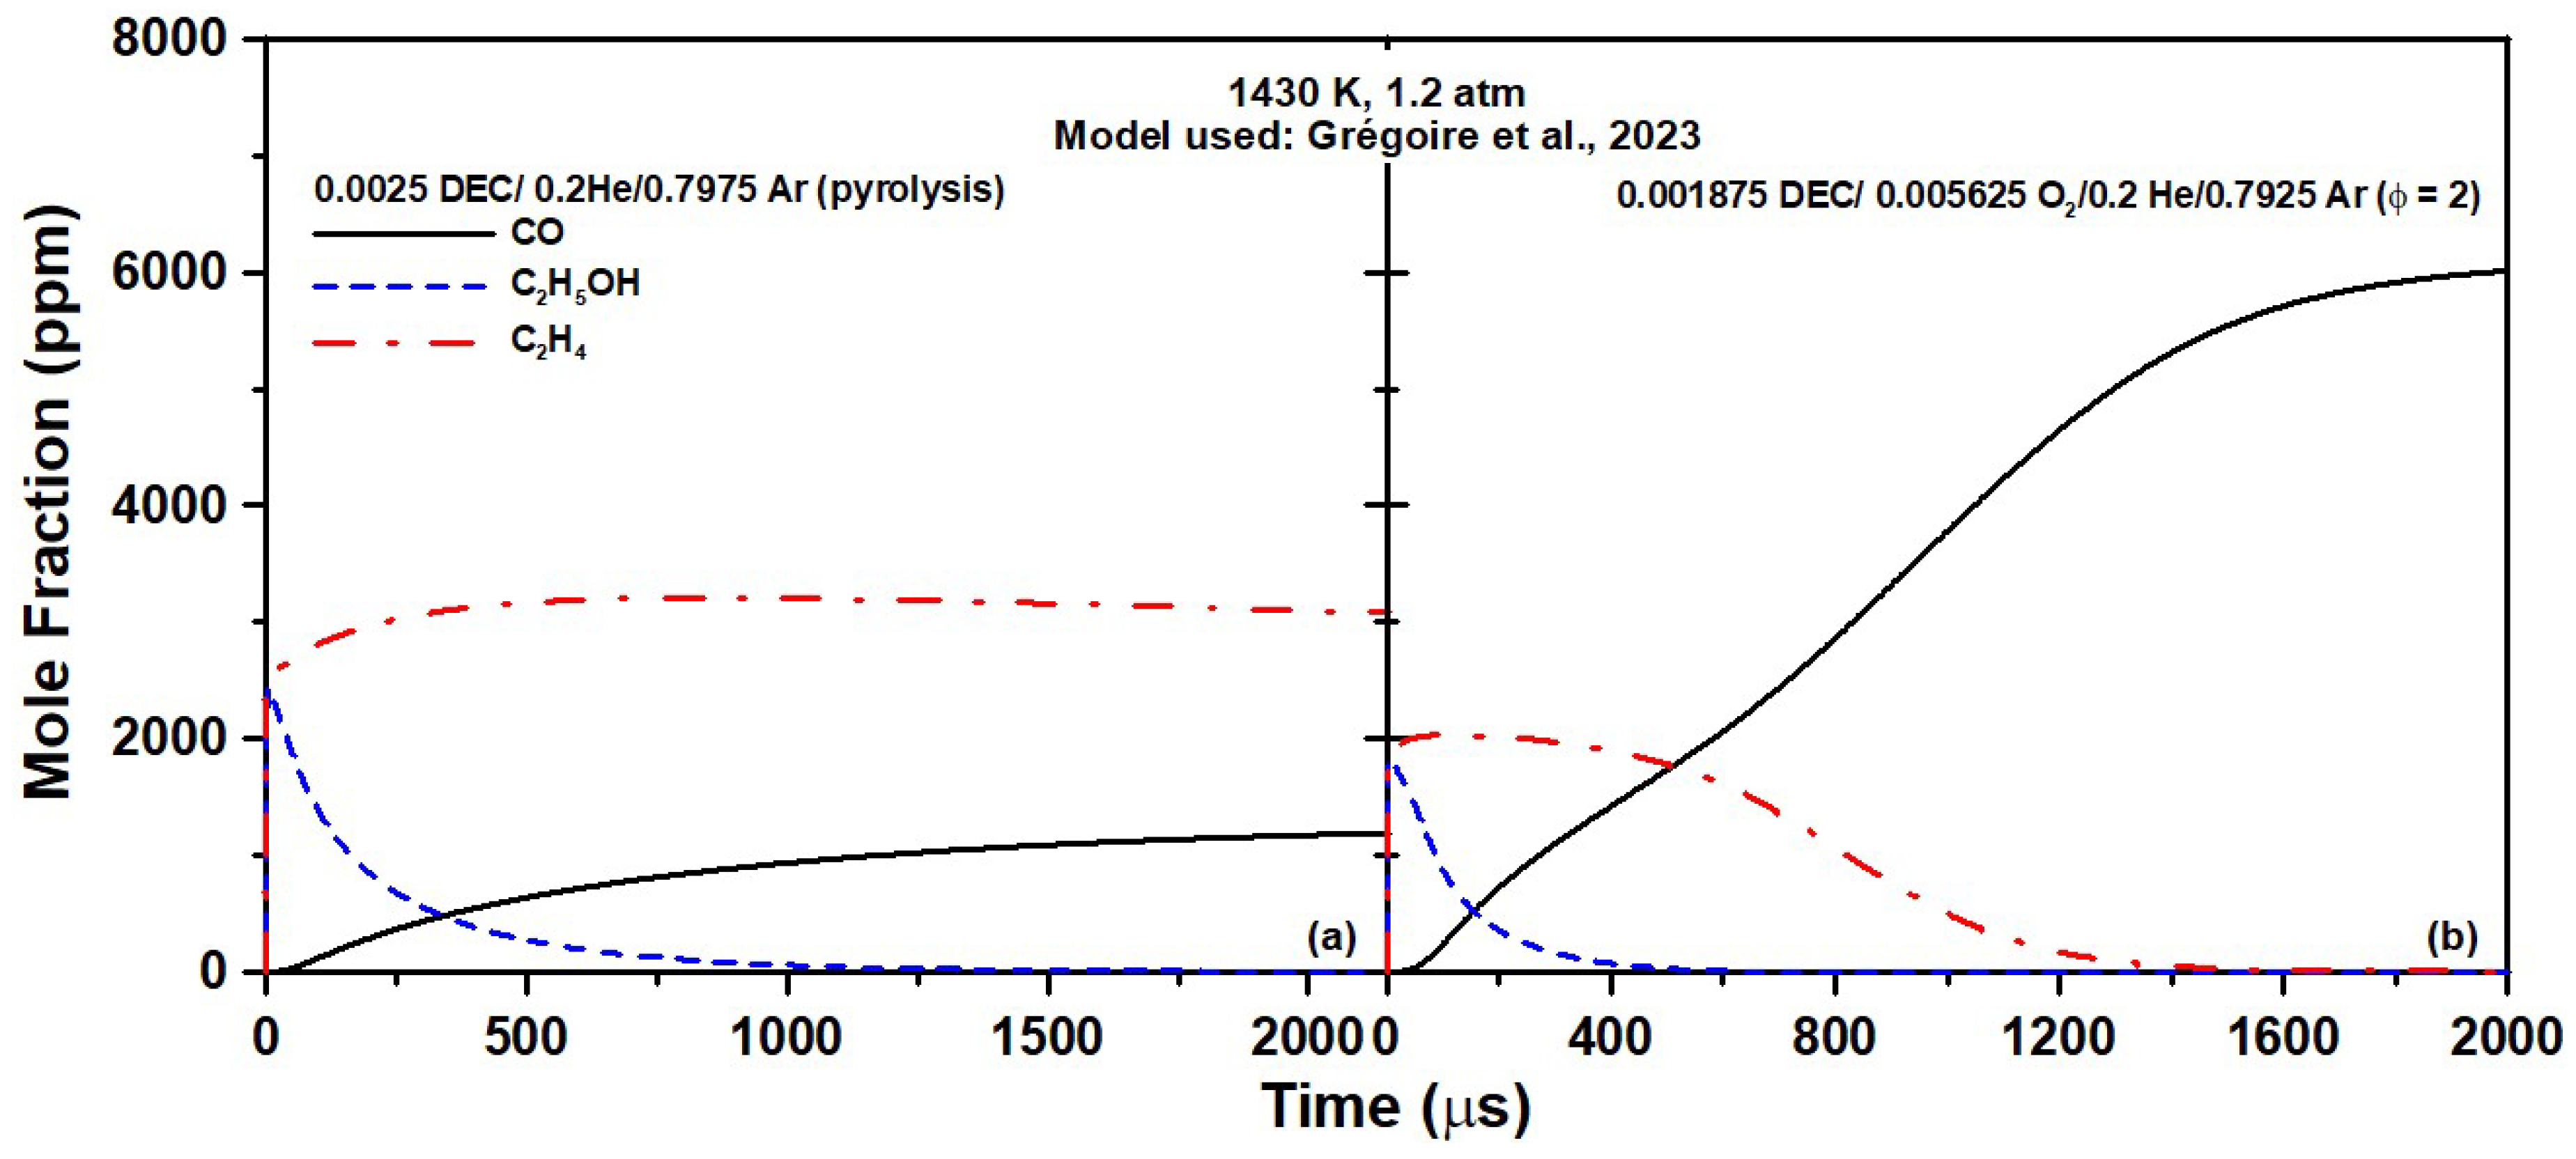
As can be concluded from this reaction pathway analysis, under pyrolysis conditions, ethanol pyrolysis is chiefly responsible for the formation of CO during DEC pyrolysis. One can also see that the main reaction pathway produces two C
2H
4 molecules (in addition to ethanol and CO
2) from one DEC molecule. This finding is also visible in
Figure 9a, where the CO concentration increased as ethanol was depleted, whereas the concentration of C
2H
4 remained nearly constant after rapidly reaching a plateau.
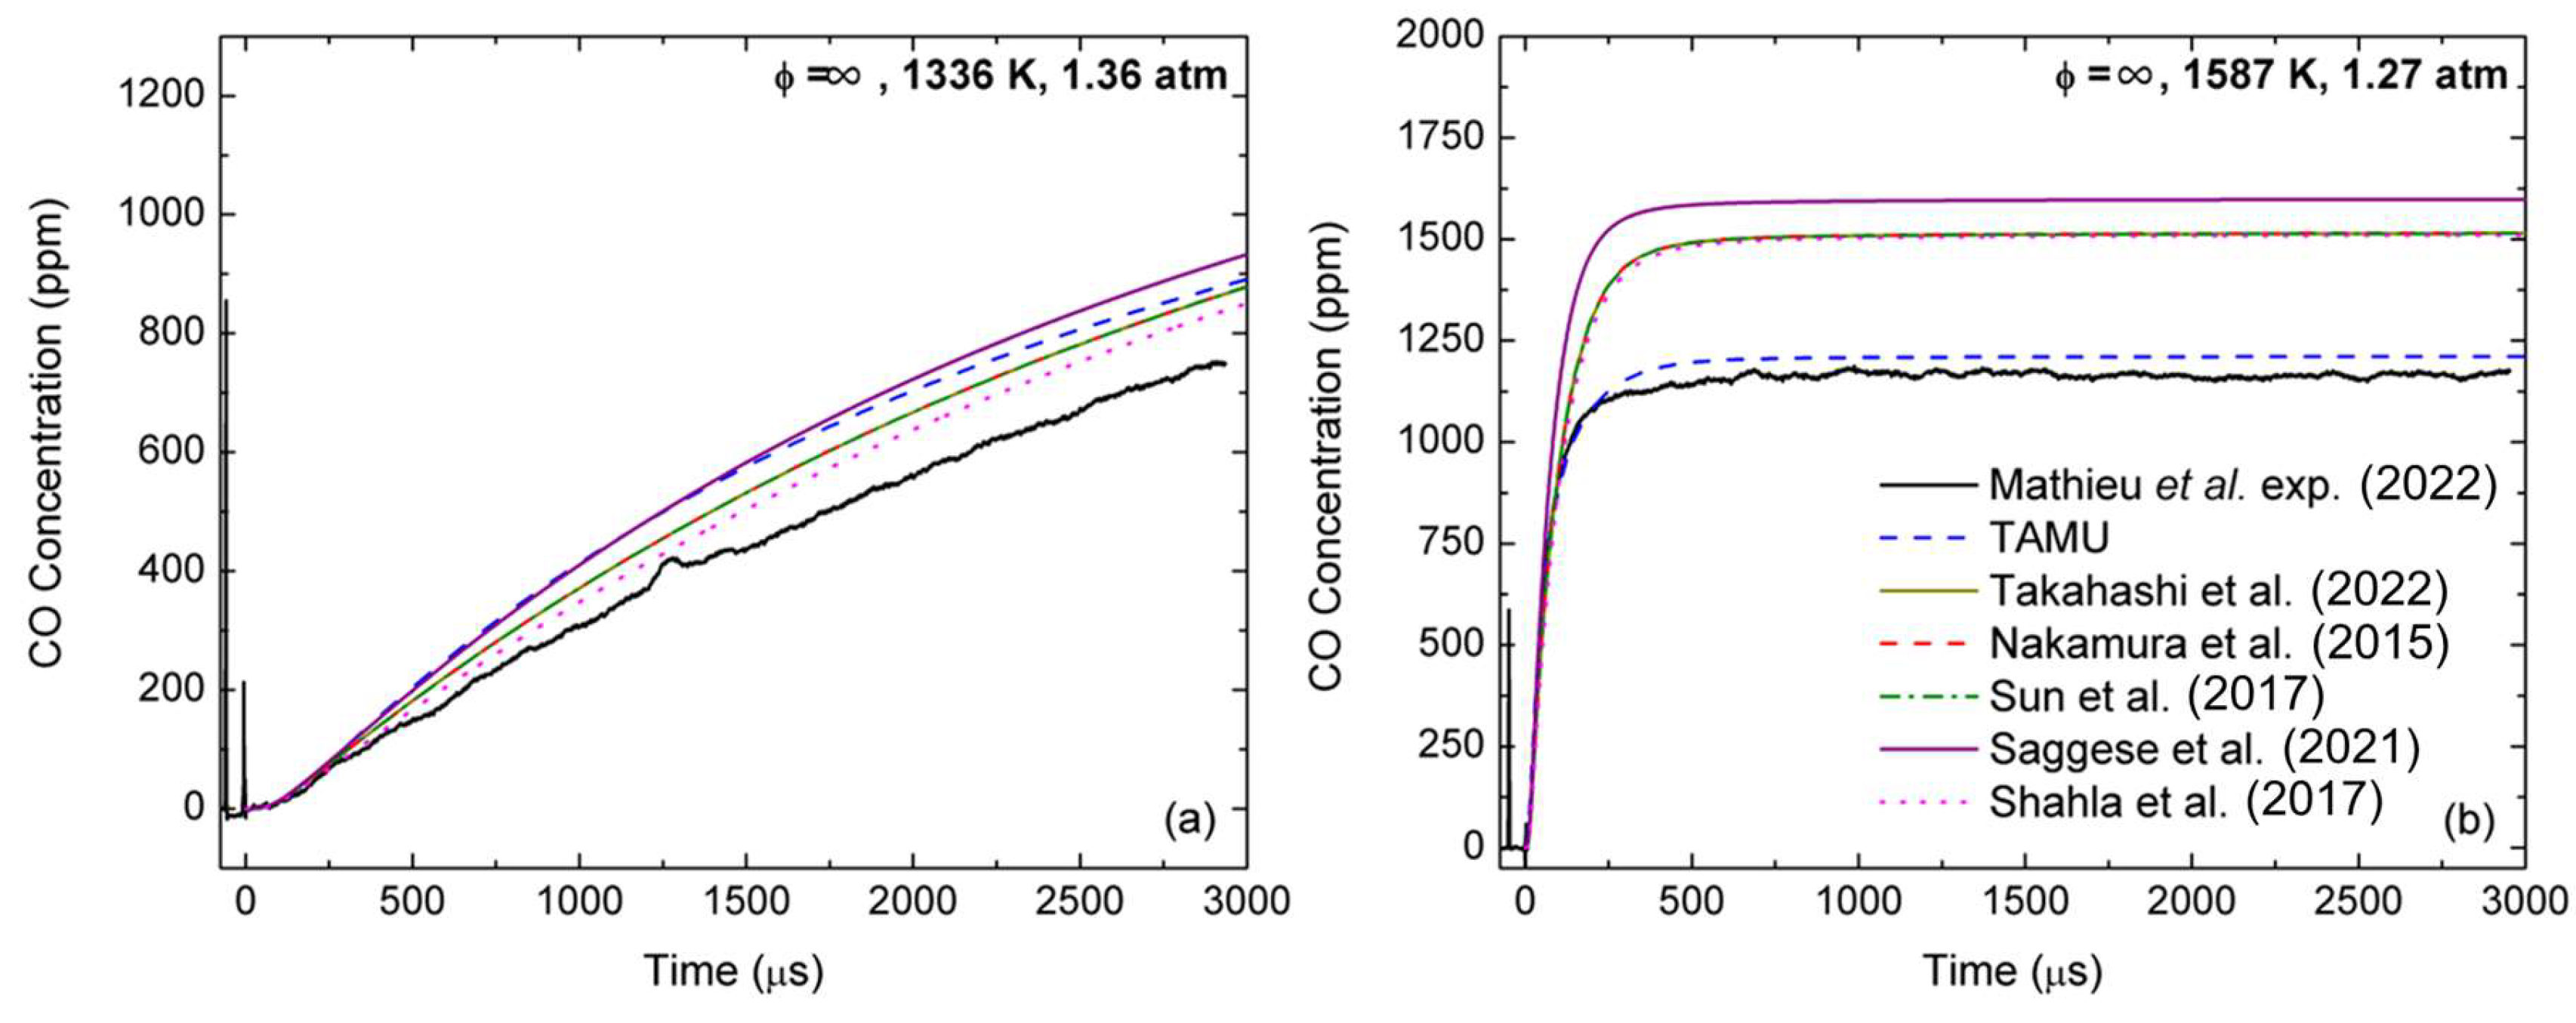
Focusing on ethanol pyrolysis, recent work from the authors [
29] showed that CO formation from ethanol pyrolysis is also largely over-estimated by base models, which directly translates to over-predictions of CO levels during DEC pyrolysis [
18]. The over-prediction of the CO concentration during ethanol pyrolysis is also observed for the DEC models from the literature considered herein, as can be seen in
Figure 10. As one can see, at low temperatures (
Figure 10a), the TAMU model was more reactive and produced slightly more CO than the other DEC models. However, at high temperatures (
Figure 10b), the TAMU model was the only one in close agreement (within the experimental uncertainty) with the data, while all other models had nearly identical predictions and largely over-predicted the CO concentration. The model from Saggese et al. [
47] was also tested over these conditions to assess the performance of a recent model dedicated to alcohols on the CO profile predictions. As one can see, this model was the most over-reactive and over-predicting of the ones tested. This result further reinforces the assessment made by the authors that ethanol [
18,
29] and methanol [
18] chemistries need to revisited, preferentially using this type of spectroscopic measurements over global kinetics data. Interestingly, starting with 2500 ppm of DEC (
Figure 8) or 2500 ppm of ethanol (
Figure 10) produced about the same amount of CO when the plateau was reached (i.e., about 1150 ppm), demonstrating the predominance of the ethanol pathway during the pyrolysis of DEC. Note that removing the updates in the ethanol chemistry adopted in the authors’ former study [
18] allowed us to only partly reduce the over-reactivity observed during DEC oxidation (but did bring the CO level up to what was observed for the other models for ethanol and DEC pyrolysis).
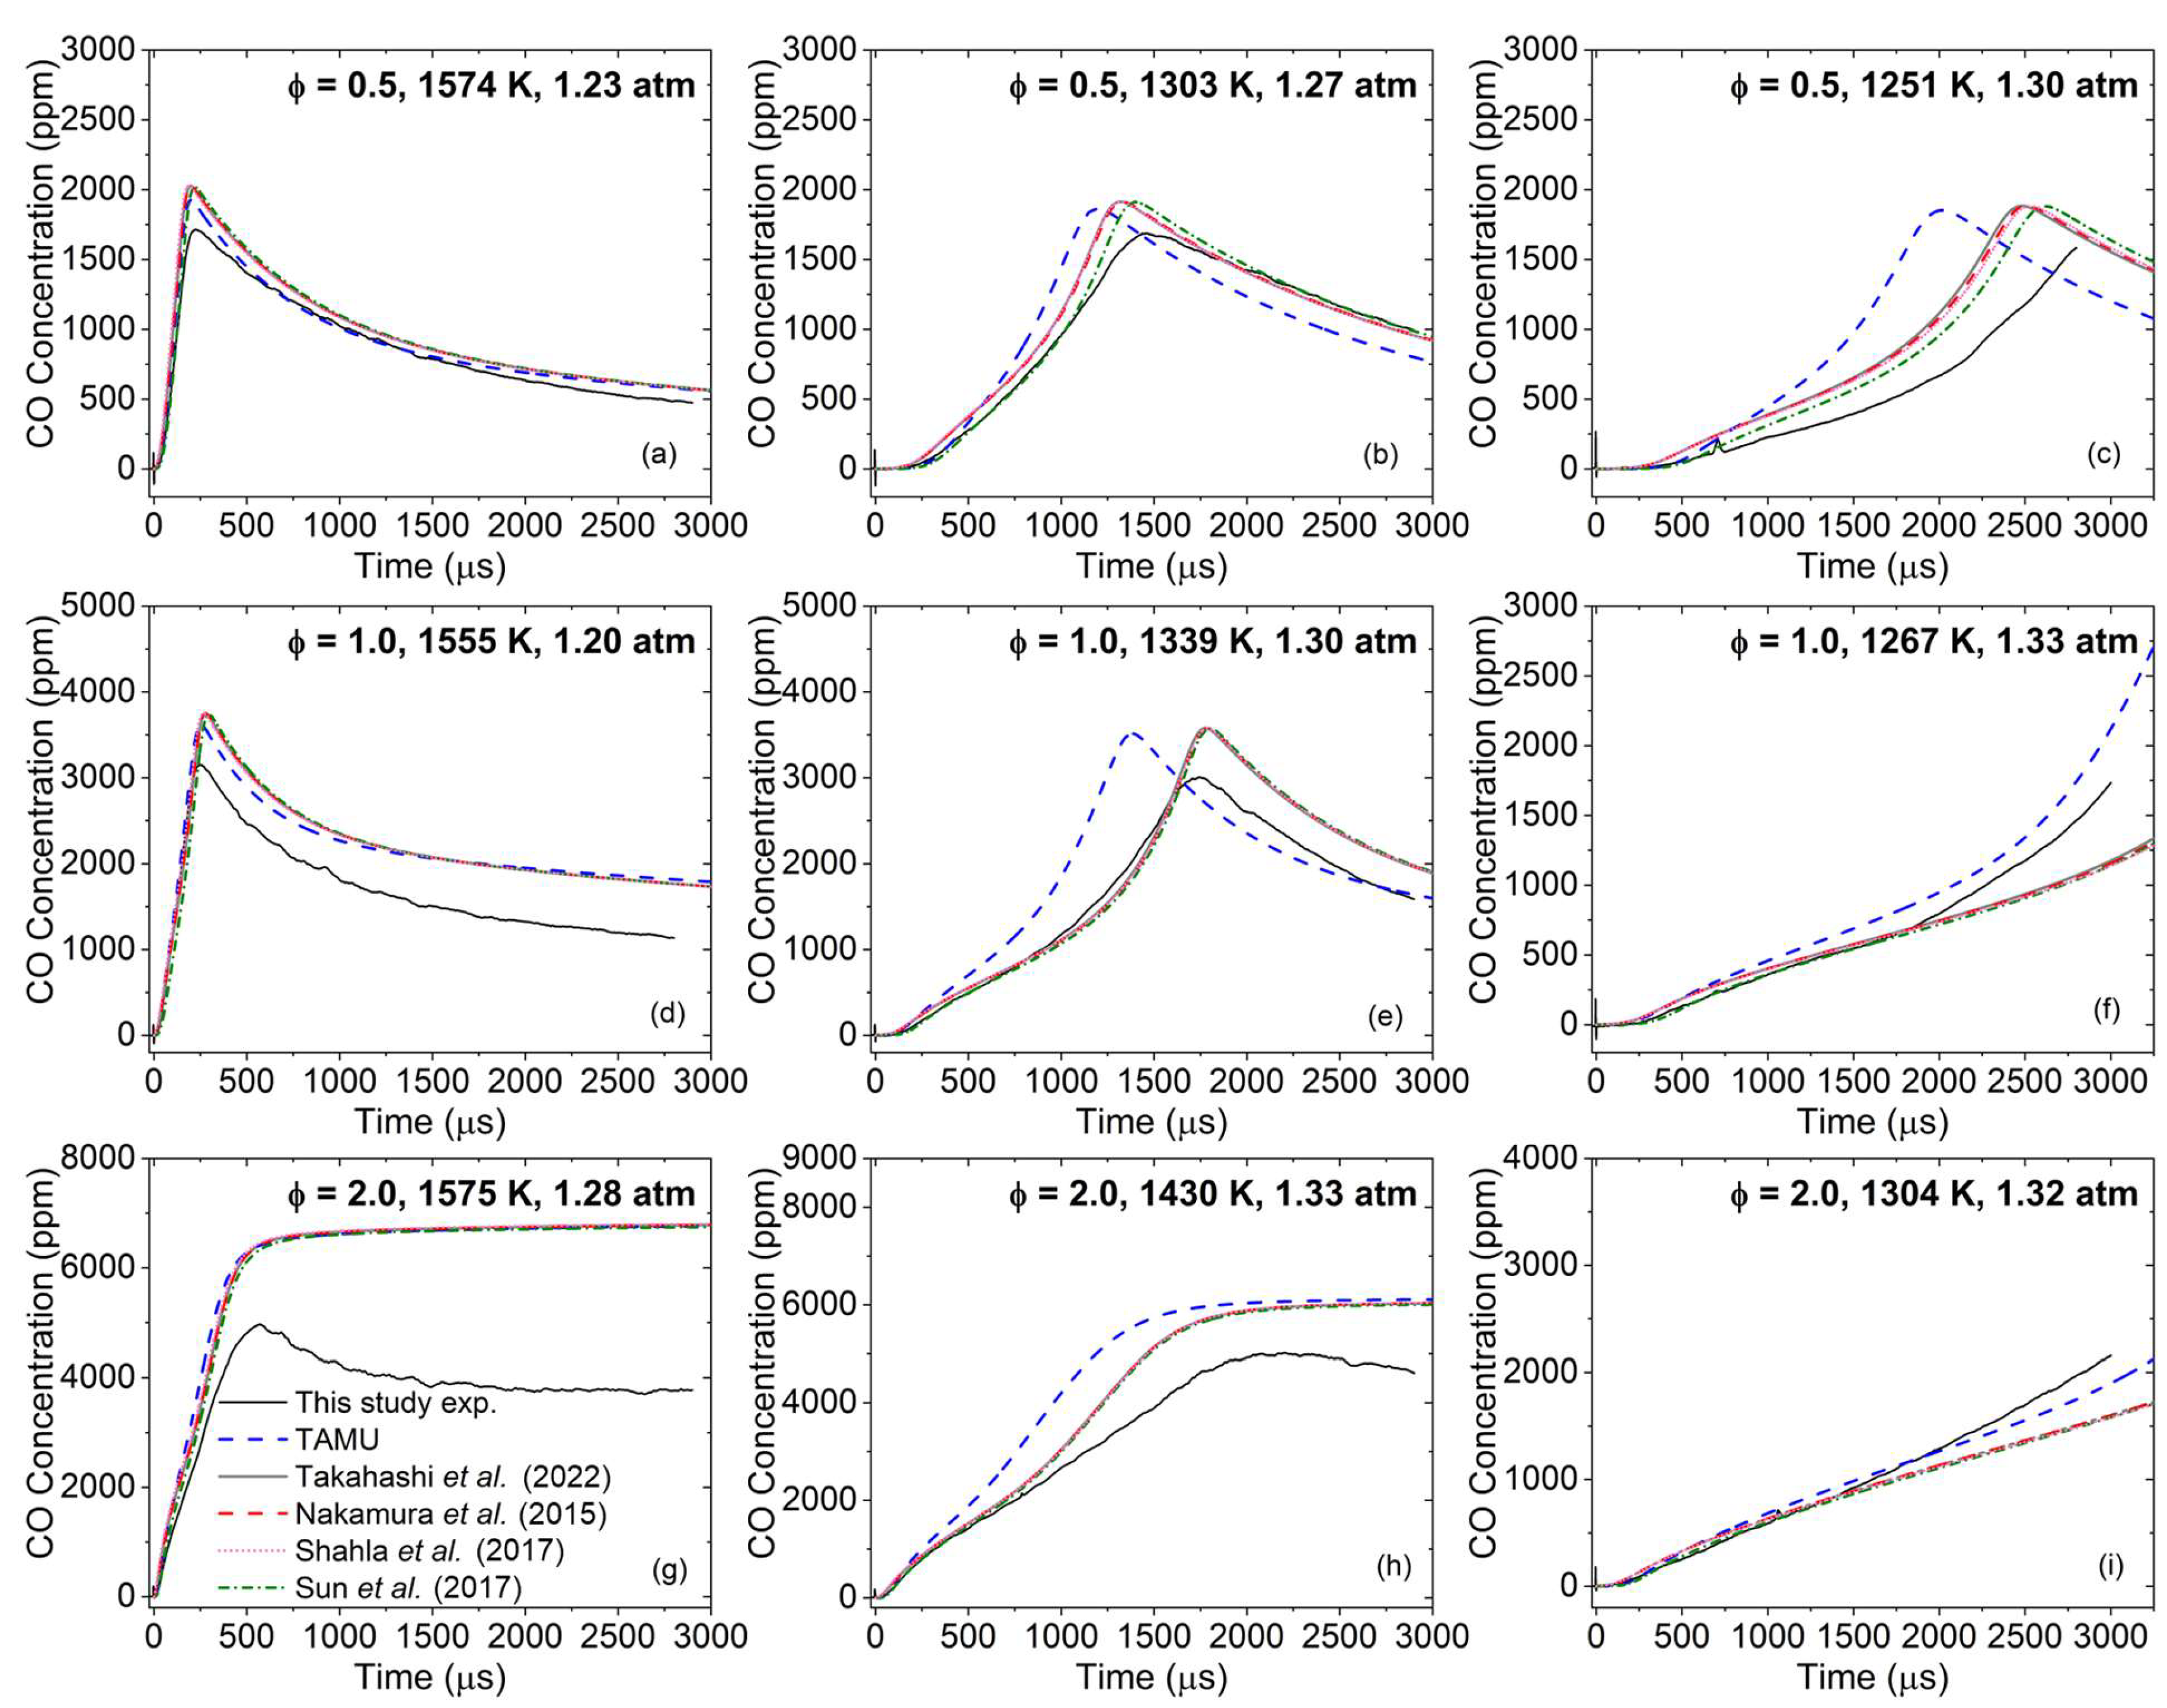
The fact that the CO formation during DEC oxidation was the same for all models for fuel-rich conditions (
Figure 3g–i), despite the results from
Figure 8 and
Figure 10 obtained in pyrolysis exhibiting large differences, shows that the ethanol pyrolysis pathway is not necessarily predominant in the presence of oxygen with regard to CO production and, most likely, additional reaction pathways are involved. This behavior is visible in
Figure 9b, where the ethanol was depleted far before the CO level reached its plateau. According to this figure and the visible inflexion in the CO profile coinciding with the start of the C
2H
4 oxidation, it would appear as if the CO formation from ethanol occurs and almost finishes before the CO formation from C
2H
4 starts. To investigate this issue, a numerical analysis was conducted with the TAMU model. This model was selected because, despite providing the least accurate predictions at ϕ = 2.0, for example, it has a stronger foundation when it comes to ethanol and DEC pyrolysis. To understand the CO formation process better during DEC oxidation, the case at ϕ = 2.0, 1430 K (
Figure 3h) was selected. For this specific case, most of the timeframe of the experiment was dedicated to CO formation, which allowed investigating and decoupling of the reaction pathways involved at various times. At this temperature, DEC was practically consumed within less than 4 µs, and within the first 5 µs DEC went on to form ethanol and CO via the ethanol pyrolysis pathway, as described earlier (R1186-R187). Note that a maximum of 1830 ppm of ethanol was predicted by the model for an initial DEC concentration of 1875 ppm, demonstrating the large initial importance of this pathway (despite ethanol preferably producing C
2H
4 via dehydration, C
2H
5OH ⇆ C
2H
4 + H
2O (R593)). However, in the presence of oxygen, another pathway also produces CO:
| C2H4 + O ⇆ CH2CHO + H | (R294) |
| C2H3 + O2 ⇆ CH2CHO + O | (R304) |
| CH2CHO ⇆ CH3 + CO | (R463) |
Note that CH2CO can also isomerize into acetyl radical (CH3CO) via oxiranyl (C2H3O1-2): CH2CHO ⇆ C2H3O1-2 ⇆ CH3CO and then form CO via CH3CO (+M) ⇆ CH3 + CO (+M) (R439). This pathway is denominated Pathway B.
At only 20 µs, CO is still largely produced via the ethanol pyrolysis sequence R1186-R187 (Pathway A), although ethanol still mostly undergoes dehydration to produce C
2H
4 via R593. However, reactions with H radicals and other thermal decomposition pathways become important and lead to another CO formation pathway (Pathway C) via:
| C2H5OH + H ⇆ SC2H4OH + H2 | (R524) |
| C2H5OH ⇆ CH3 + CH2OH | (R514) |
with CH
2OH forming CO via the sequence R197 → R177 → R187 described above and SC
2H
4OH forming CO via:
| SC2H4OH (+M) ⇆ C2H3OH + H (+M) | (R539) |
| SC2H4OH ⇆ CH3CHO + H | (R538) |
| SC2H4OH (+M) ⇆ CH3 + CH2O (+M) | (R540) |
with CH
2O going to CO via R177 → R187 and CH
2O + H ⇆ H + CO + H
2 (R186)). This is followed by:
| C2H3OH (+M) ⇆ CH3CHO (+M) | (R452) |
| CH3CHO + H ⇆ CH3CO + H2 | (R421) |
| CH3CO (+M) ⇆ CH3 + CO (+M) | (R439) |
In parallel to this CO formation from ethanol (Pathways A and C), C
2H
4 also produces CO via Pathway B. This chemistry continues until ethanol is fully consumed at around 500 µs. However, as the concentration of ethanol decreases rapidly, other pathways start producing CH
2O (and, thus, CO via HCO) via the remaining C
2H
4 produced from R1186 and R593 and CH
3 produced via R439, R514, and R540:
| CH3 + O ⇆ CH2O + H | (R115) |
| CH2 + O2 ⇆ CH2O + O | (R83) with CH2 primarily formed via |
| C2H4 + O ⇆ CH2 + CH2O | (R293) |
At around 500 µs, another pathway (Pathway D) starts appearing:
| HCCO + O2 → CO2 + CO + H | (R505) |
| HCCO + H ⇆ CH2(s) + CO | (R511) |
with HCCO coming from
| 2CH3 (+M) ⇆ C2H6 (+M) | (R220) |
| C2H6 + H ⇆ C2H5 + H2 | (R225 and R226) |
| C2H4 + H (+M) ⇆ C2H5 (+M) | (R237) (in reverse) |
| C2H4 + H ⇆ C2H3 + H2 | R278 |
| C2H2 + H (+M) ⇆ C2H3 (+M) | (R301) (in reverse) |
| C2H2 + O ⇆ HCCO + H | (R371) |
Past the 500 µs mark, at the specific condition of
Figure 3h, CO mostly forms from these CH
3-based pathways directly from CH
3 or from C
2H
6 → HCCO after the recombination of methyl radicals. As one can see from this analysis, the CO formation from DEC oxidation has a much richer chemistry than that of DEC pyrolysis. Since the formation of CO during DEC/ethanol pyrolysis is well-captured under the present conditions, it can be concluded that the large over-estimation of the CO level by the models is due to the oxidation chemistry of C
2H
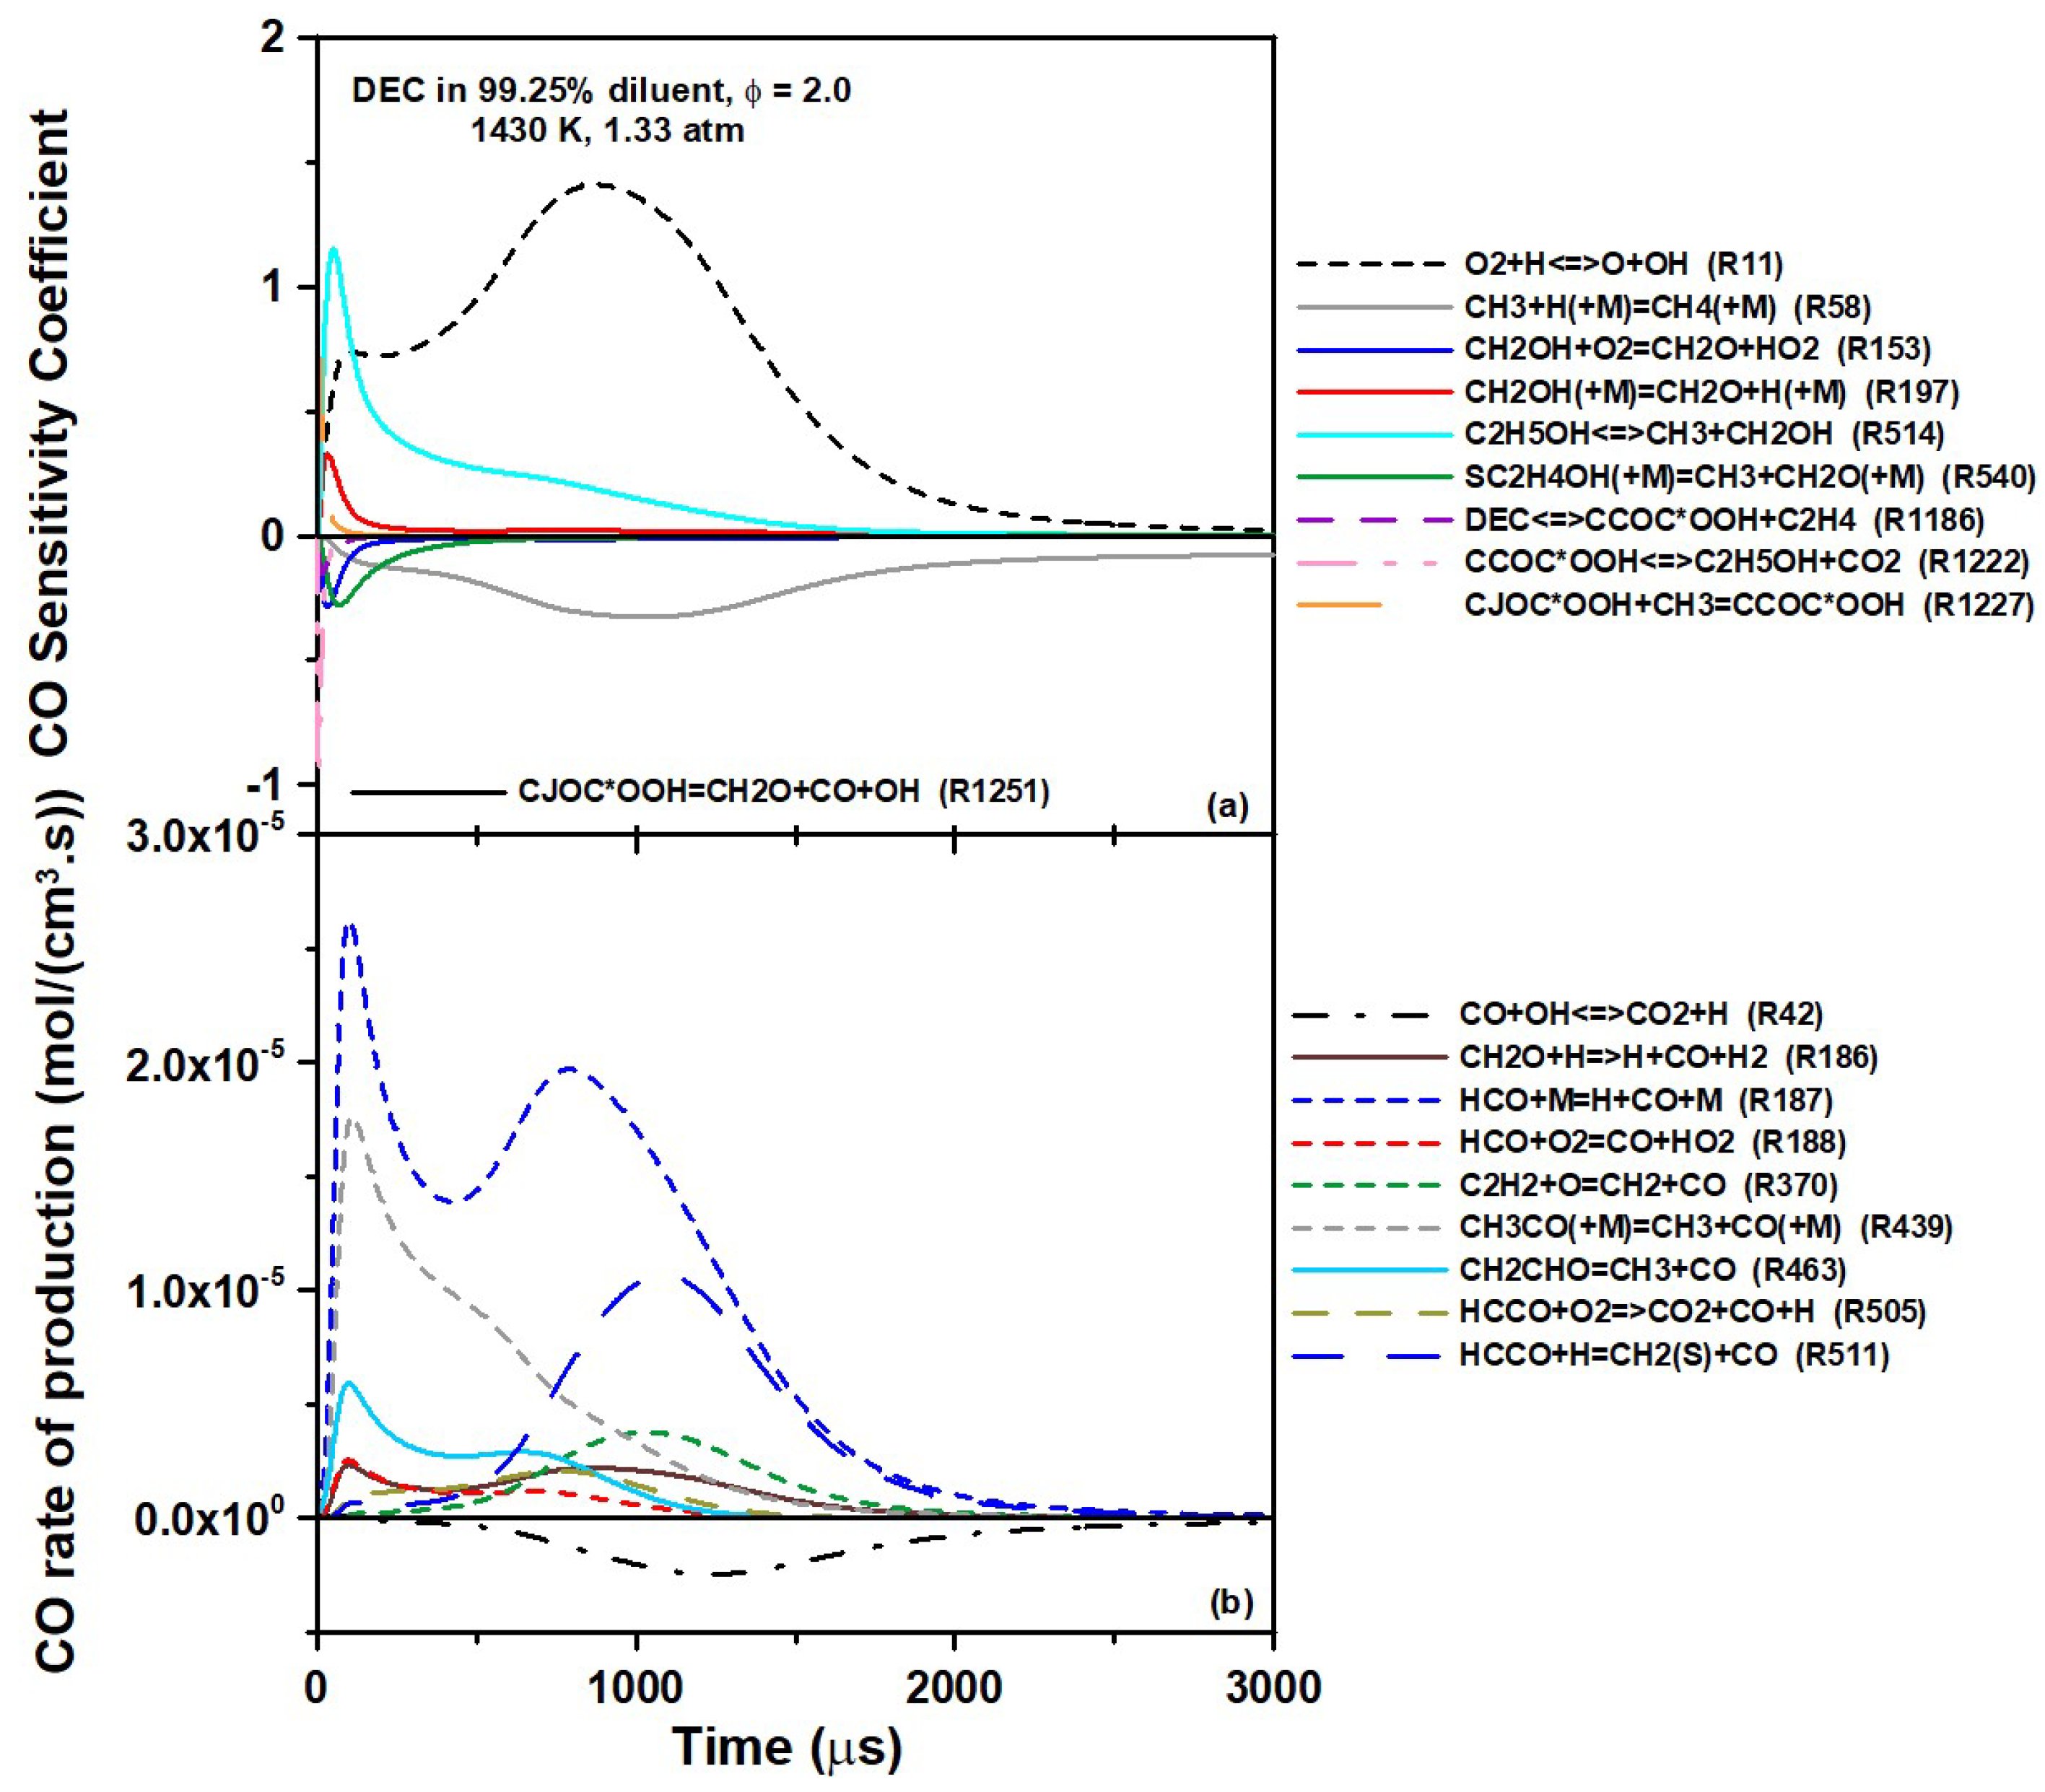
4 (while some reactions involving ethanol cannot be excluded given that oxidative conditions have not been tested experimentally). This is confirmed by the sensitivity and rate of production (ROP) analyses conducted for the case selected and visible in
Figure 11. As can be seen for the sensitivity analysis (
Figure 11a), the DEC decomposition stages leading to C
2H
5OH (R1186 followed by R1222) were important at the very beginning of the experiment (this is difficult to see, as they are along the
y axis, and so is R1251, the only reaction common to the sensitivity and ROP analysis). Beside the classical branching reaction R11, the reaction R514 involved in Pathway A had a very large promoting importance during the first millisecond. As the sensitivity of R514 decreased, one can note the growing inhibiting influence of R58 (CH
3 + H (+M) ⇆ CH
4 (+M)) peaking at around 1000 µs. This reaction was inhibiting, since it consumed the methyl radicals that were at the base of the CH
3 pathways for CO described above.
Concerning the ROP analysis, the dominant role of R187 is visible. Note the two production peaks of CO for this reaction, with the ethanol and CH3 as the original source of HCO for the first and second peak, respectively. One can also see the importance of R439 coming from ethanol (Pathway C) during the first 500 µs and the importance of reactions with C2H2 (R370) and HCCO (R505 and R511), peaking around 1000 µs and representing the CO formation Pathway D. Given that the CO production from ethanol pyrolysis can be reproduced with good accuracy overall, the authors believe that the CO formation from Pathway D, involving species in C2 (C2H6, C2H4, C2H2, and HCCO), is the main factor responsible for the over-prediction of CO by the models. Since C2H4 is present in large concentrations in this system, as it is also produced by the DEC decomposition steps leading to ethanol, it would be a good first candidate for a subsequent study on CO formation. To the best of the authors’ knowledge, there is no study in a shock tube where the CO formation from C2H4 oxidation was measured. Additionally, these C2 species are part of the “base mechanism” common to most hydrocarbons. Thus, the authors do not believe that changing the rate coefficients of a few reactions involving C2 species to better fit the results of this study would be appropriate, as the base chemistry on the models used herein has been extensively validated and any change in this area would require extensive validation, as it might otherwise deteriorate the predictions for many other fuels in various conditions.
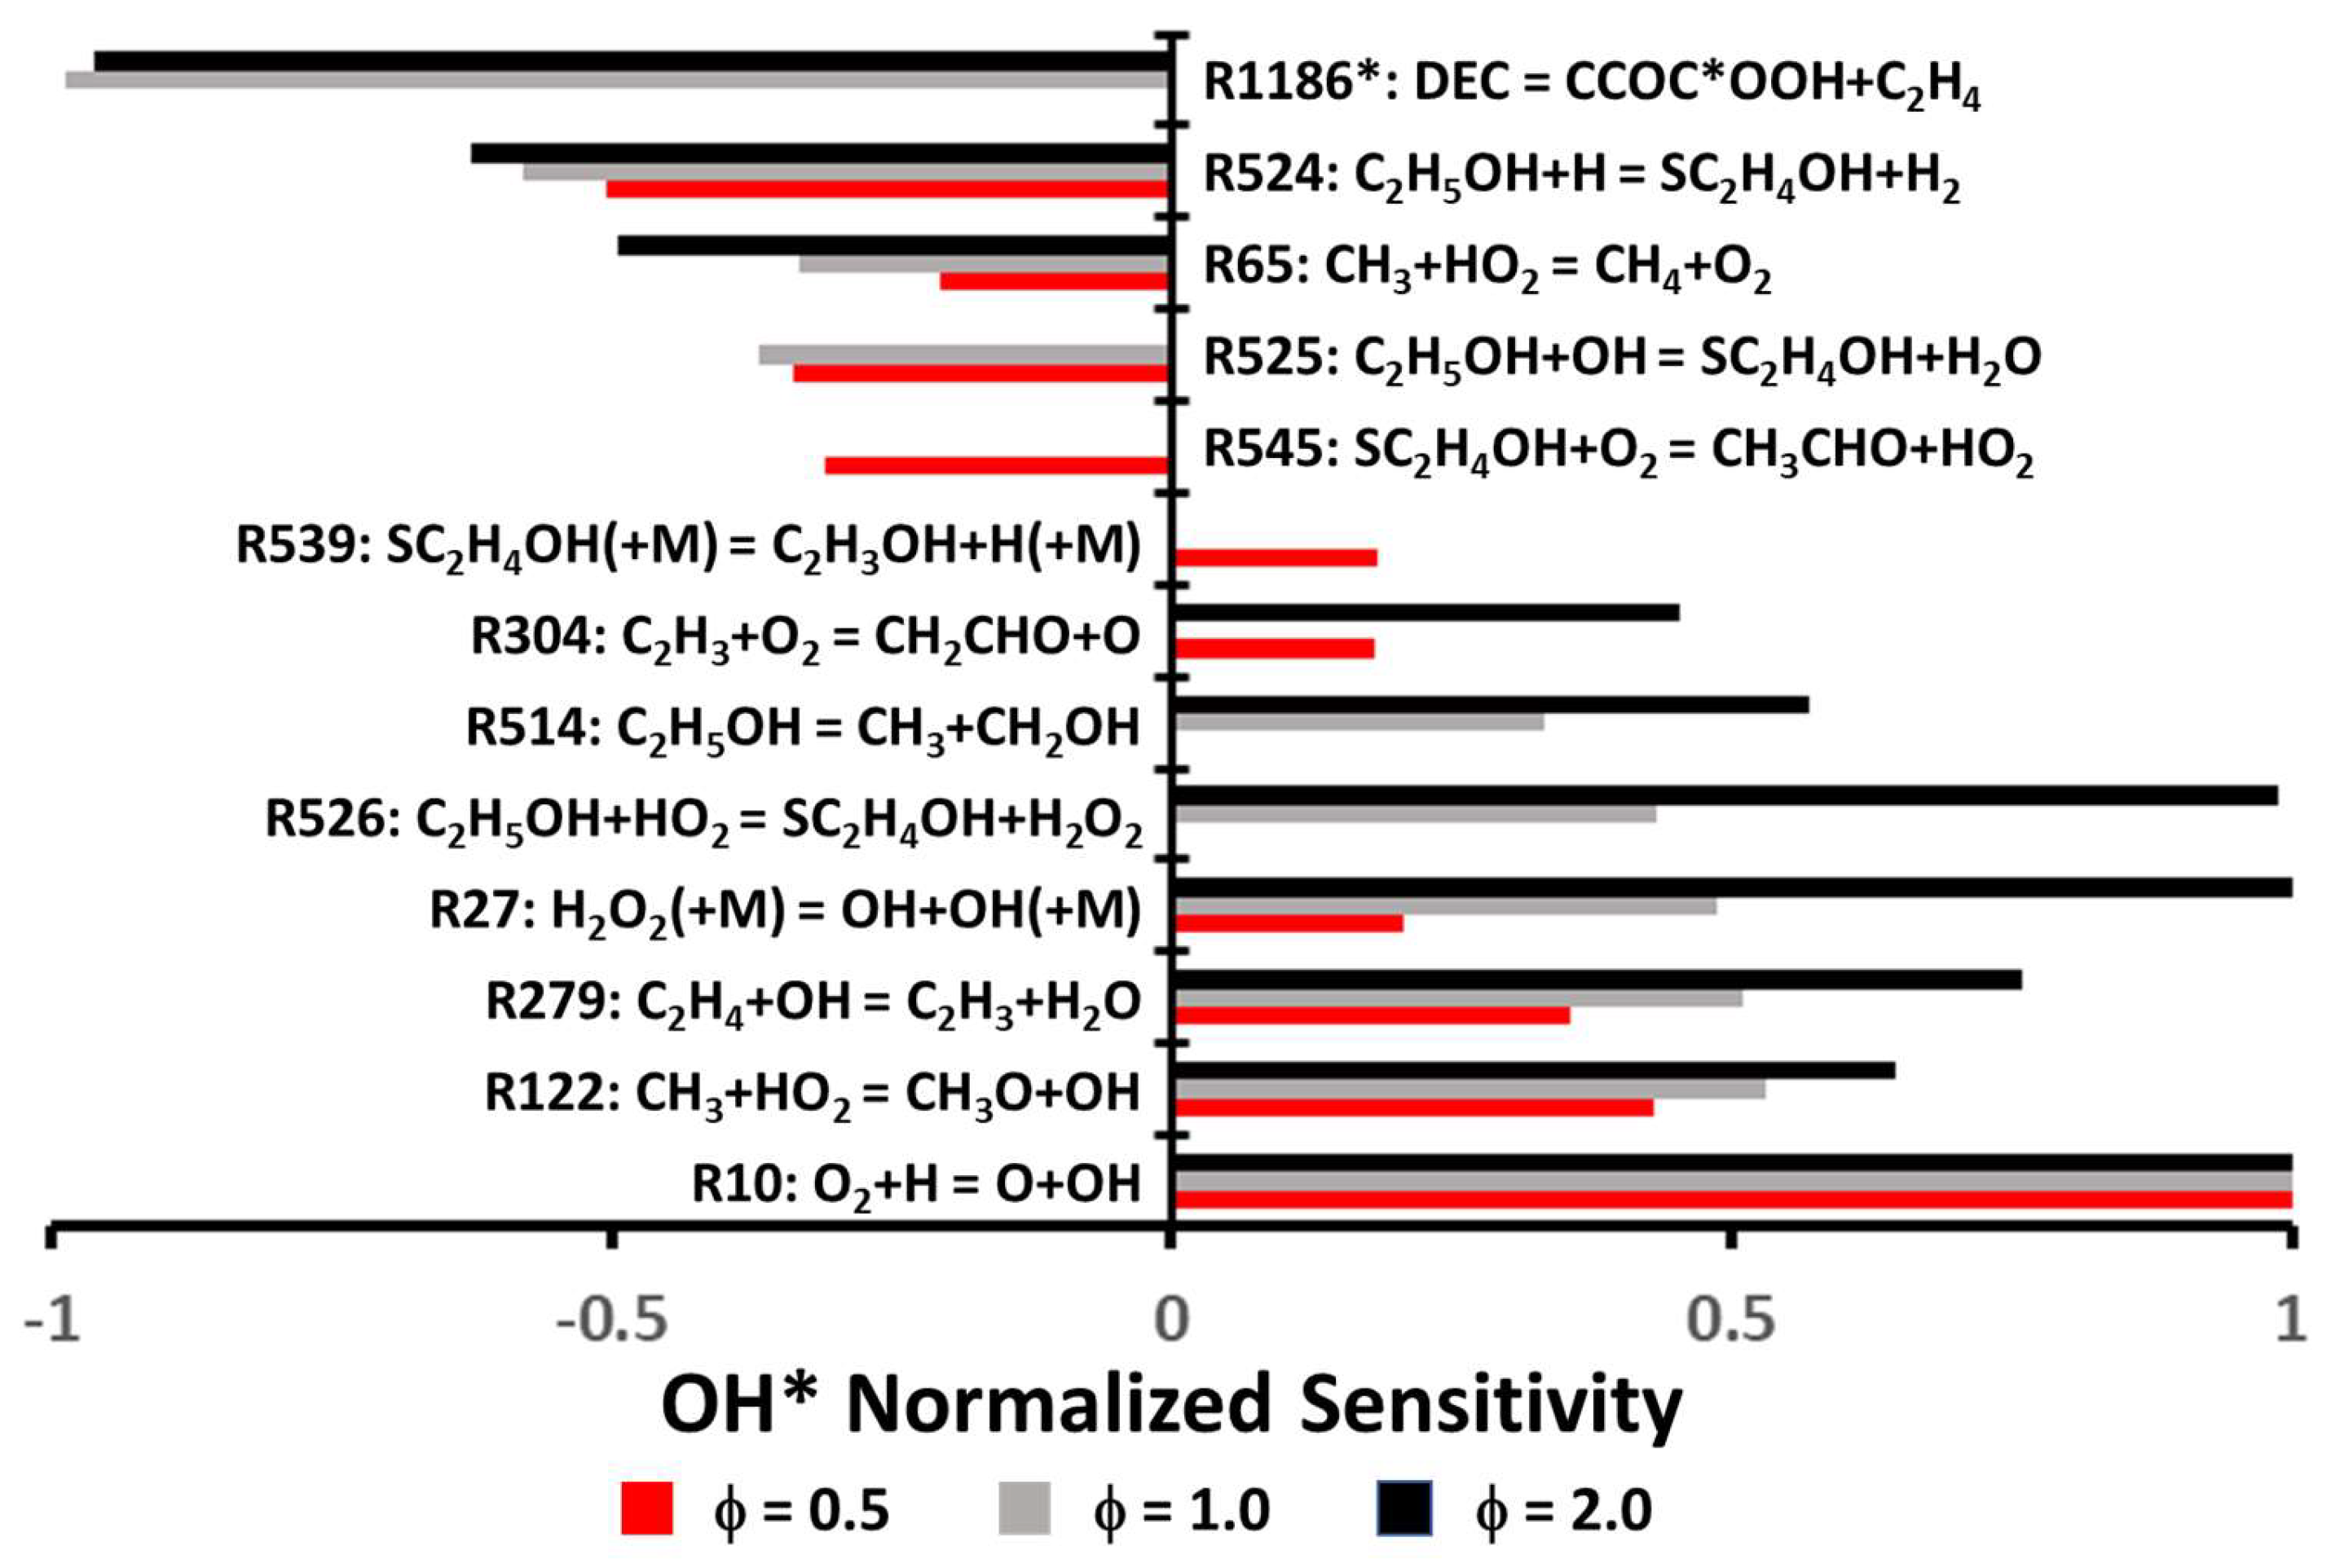
Lastly, a sensitivity analysis was conducted with the Grégoire et al. model for OH* for the conditions used to investigate the ignition delay time (conditions set at 1275 K and 1.1 atm for all equivalence ratios). Results from this analysis are visible in
Figure 12. In this figure, note that R1186 (DEC ⇆ CCOC*OOH + C
2H
4) is not in the top ten reactions for the fuel-lean mixture, whereas the sensitivity is by far the largest for the stoichiometric and fuel-rich cases. In fact, the sensitivity coefficient for R1186 was divided by a factor of seven at ϕ = 1.0 and nine at ϕ = 2.0, so the other reactions could still be visible when normalizing the data. Additionally, the sensitivity to R1186 occurred within the first few microseconds only, whereas all the other reactions displayed their sensitivity to OH* at the ignition event. For ϕ = 0.5, the classical branching reaction R10 (O
2 + H ⇆ OH + O) was the most sensitive reaction, and this reaction was also the most promoting reaction for the other conditions. R122 (CH
3 + HO
2 ⇆ CH
3O + OH), R279 (C
2H
4 + OH ⇆ C
2H
3 + H
2O), and R27 (H
2O
2 (+M) ⇆ OH + OH (+M)) were also promoting reactions in all cases, and it is worth mentioning that their sensitivities increased with the equivalence ratio. It is interesting to see that several sensitive reactions involved HO
2 chemistry, which is typically not so prominent at high-temperature/low-pressure conditions. This importance of HO
2 chemistry was due to the prominence of ethanol chemistry, as described above and visible in
Figure 12, which led to the production of HO
2 via reactions like that of R545 (SC
2H
4OH + O
2 ⇆ CH
3CHO + HO
2). HO
2 also played an important role in the terminating reaction R65 (CH
3 + HO
2 ⇆ CH
4 + O
2), which largely inhibited the reactivity. In addition to R1186, the most inhibiting reaction for all cases was R524 (C
2H
5OH + H ⇆ SC
2H
4OH + H
2), which competed with R10. The sensitivities of R65 and R525 also increased with equivalence ratio.


