Article

Spray Characteristics of Bioethanol-Blended Fuel under Various Temperature Conditions Using Laser Mie Scattering and Optical Illumination

School of Engineering, University of Lincoln, Lincoln LN6 7TS, UK
Fuels 2022, 3(2), 207-216; https://doi.org/10.3390/fuels3020013
Submission received: 22 November 2021 / Revised: 17 March 2022 / Accepted: 19 March 2022 / Published: 2 April 2022
(This article belongs to the Special Issue Advanced Laser Diagnostics in Combustion)

Abstract

:
Bioethanol has great potential to reduce emissions from transportation while improving energy security and developing the economy. Bioethanol has a higher octane-number and a higher enthalpy of vaporisation than gasoline (resulting in charge cooling)—properties that have been used to extend knocking limits. Therefore, bioethanol can be used to substitute gasoline in automotive engine applications. The characteristics of bioethanol spray, such as hydrous bioethanol fuel which consists of 93% bioethanol and 7% water, were investigated under various temperature conditions from sub-zero (−15 °C) to room temperature (17 °C) by means of high-speed direct photography and laser Mie scattering techniques without any seeding materials. The experimental results show that the spray patterns are not significantly changed. In the case of the sub-zero temperature condition, the spray tip penetration decreases while the spray angle keeps almost constant once the spray becomes fully developed. The results show that scaling of the spray tip penetration rate achieves a reasonable collapse of the experimental results. The normalised droplet diameter was also obtained and shows that larger droplets are formed at the sub-zero temperature condition.

1. Introduction

The increasing demand for energy, limited energy supply, and stringent pollution regulations promotes research on alternative fuels [1,2]. Bioethanol is a clear, colourless liquid that can be made from a variety of sources, including sugar cane and maize. Bioethanol has been identified as having the potential to improve environmental outcomes when used to replace conventional gasoline in automotive engines. Bioethanol also has anti-knock characteristics and plays a role in the reduction of CO and unburned hydrocarbon (HC) emissions in certain cases [3,4,5,6].
Since bioethanol is produced from renewable plant resources, there is no problem of depletion of energy resources. In terms of the life cycle analysis from cultivation of bio crops to the production of bioethanol and vehicle use, the carbon dioxide emitted from vehicles is recovered through photosynthesis in the process of growing bio crops; therefore, its net emission is very small. Bioethanol also presents benefits in terms of local energy security and economic benefit for the agricultural sector [7,8,9,10,11].
Although ethanol is synthesized from ethylene, bioethanol is produced from starch-based materials, such as corn or cassava; sugar-based materials, such as sugar cane or sugar beets; and lignocellulosic materials, such as wood or agricultural waste. Starch-based and carbohydrate-based bioethanol can be easily produced; however, the amount of resources is limited, and the price is high. Therefore, a process for producing bioethanol from the lignocellulosic system, which is abundant and inexpensive, is being researched and developed [12,13,14,15,16,17,18,19,20,21,22].
The main properties of bioethanol are compared with gasoline in Table 1 [6,23,24]. This table shows that bioethanol has some interesting properties as a fuel for automotive engines. A summary of the properties of bioethanol follows [25,26,27,28,29,30,31,32]:
  • A high-octane number, which induces a strong resistance to knock and, consequently, the ability to optimize the engine (compression ratio and spark-advance, in particular);
  • A density similar to gasoline’s;
  • The presence of oxygen in the formula, which can decrease unburned or partially burned molecule emissions (HC and CO);
  • A high latent heat of vaporization, which enables a “cooling effect” of air and, consequently, can enhance the engine’s volumetric efficiency.
  • Conversely, some disadvantages must be considered:
  • The oxygen included in the molecule (30%wt) causes an increase in the fuel volumetric consumption;
  • The high latent heat of vaporization may have difficulties in cold conditions, especially cold start;
  • Ethanol combustion in engines produces aldehyde emissions, which can have a negative impact on health;
  • Vapour lock can occur;
  • It degrades some metal materials in the fuel system and swells rubber or synthetic resins;
  • The phase separation of the fuel becomes easy as a small amount is mixed.
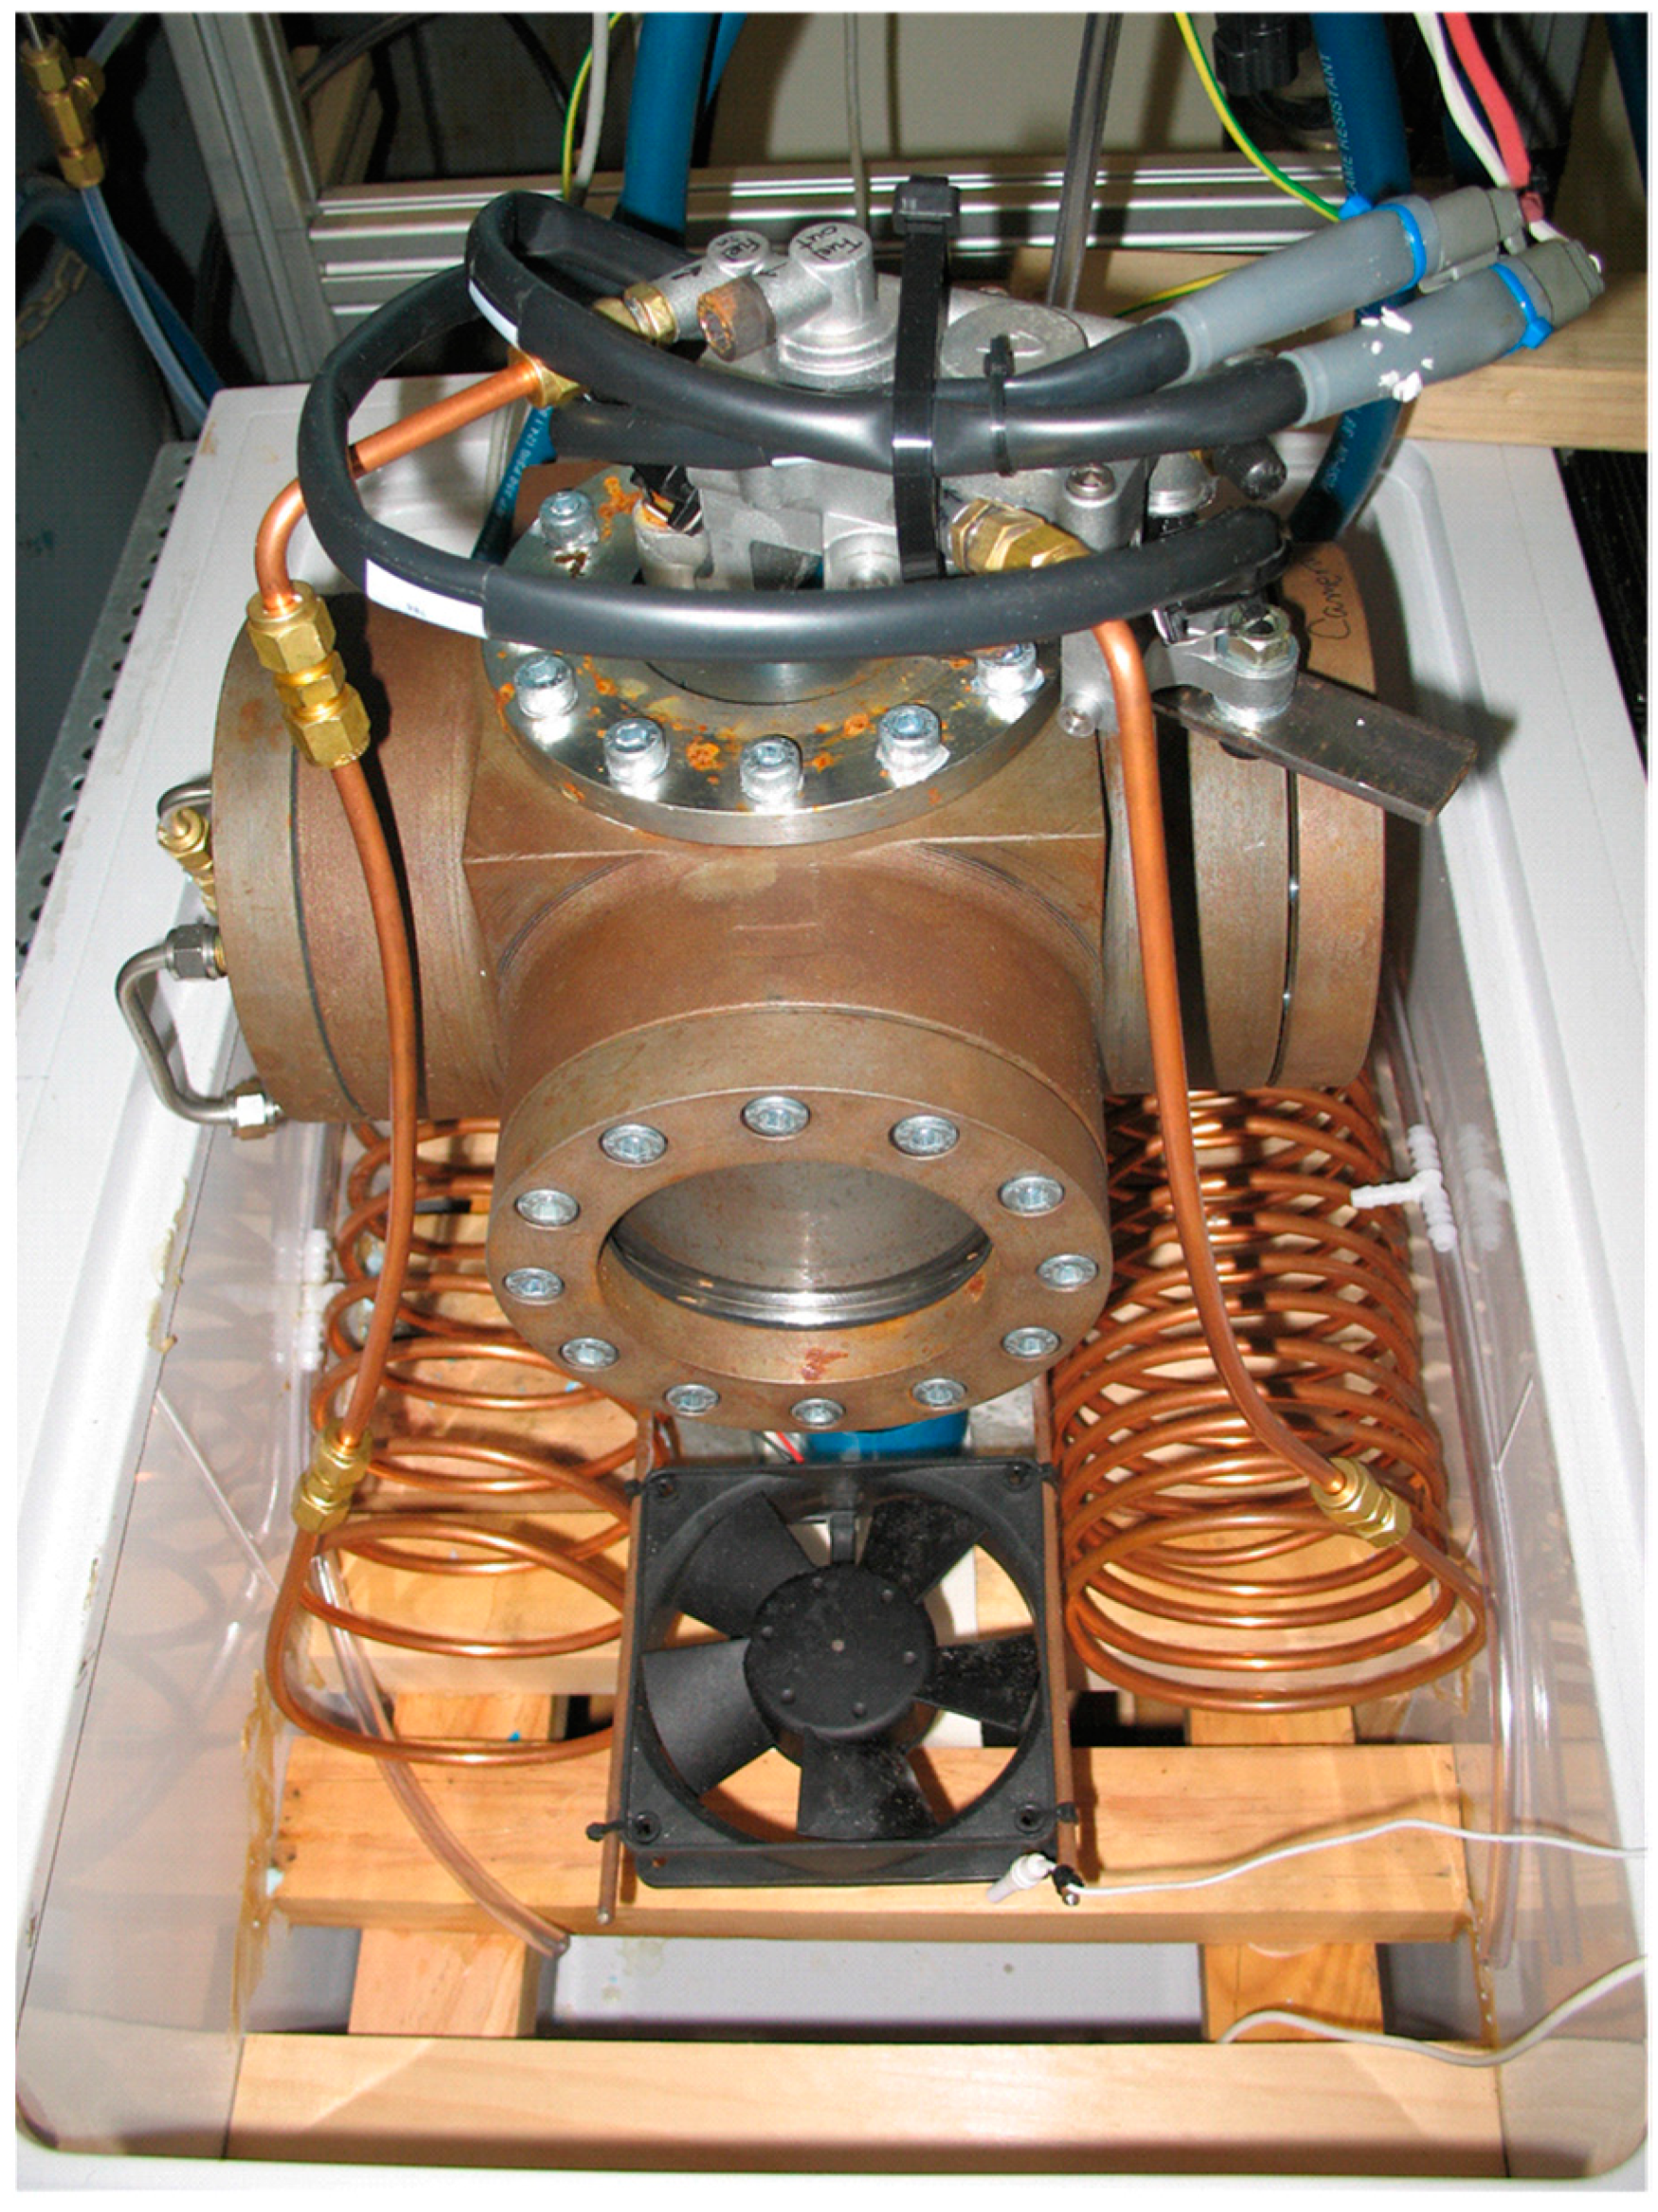
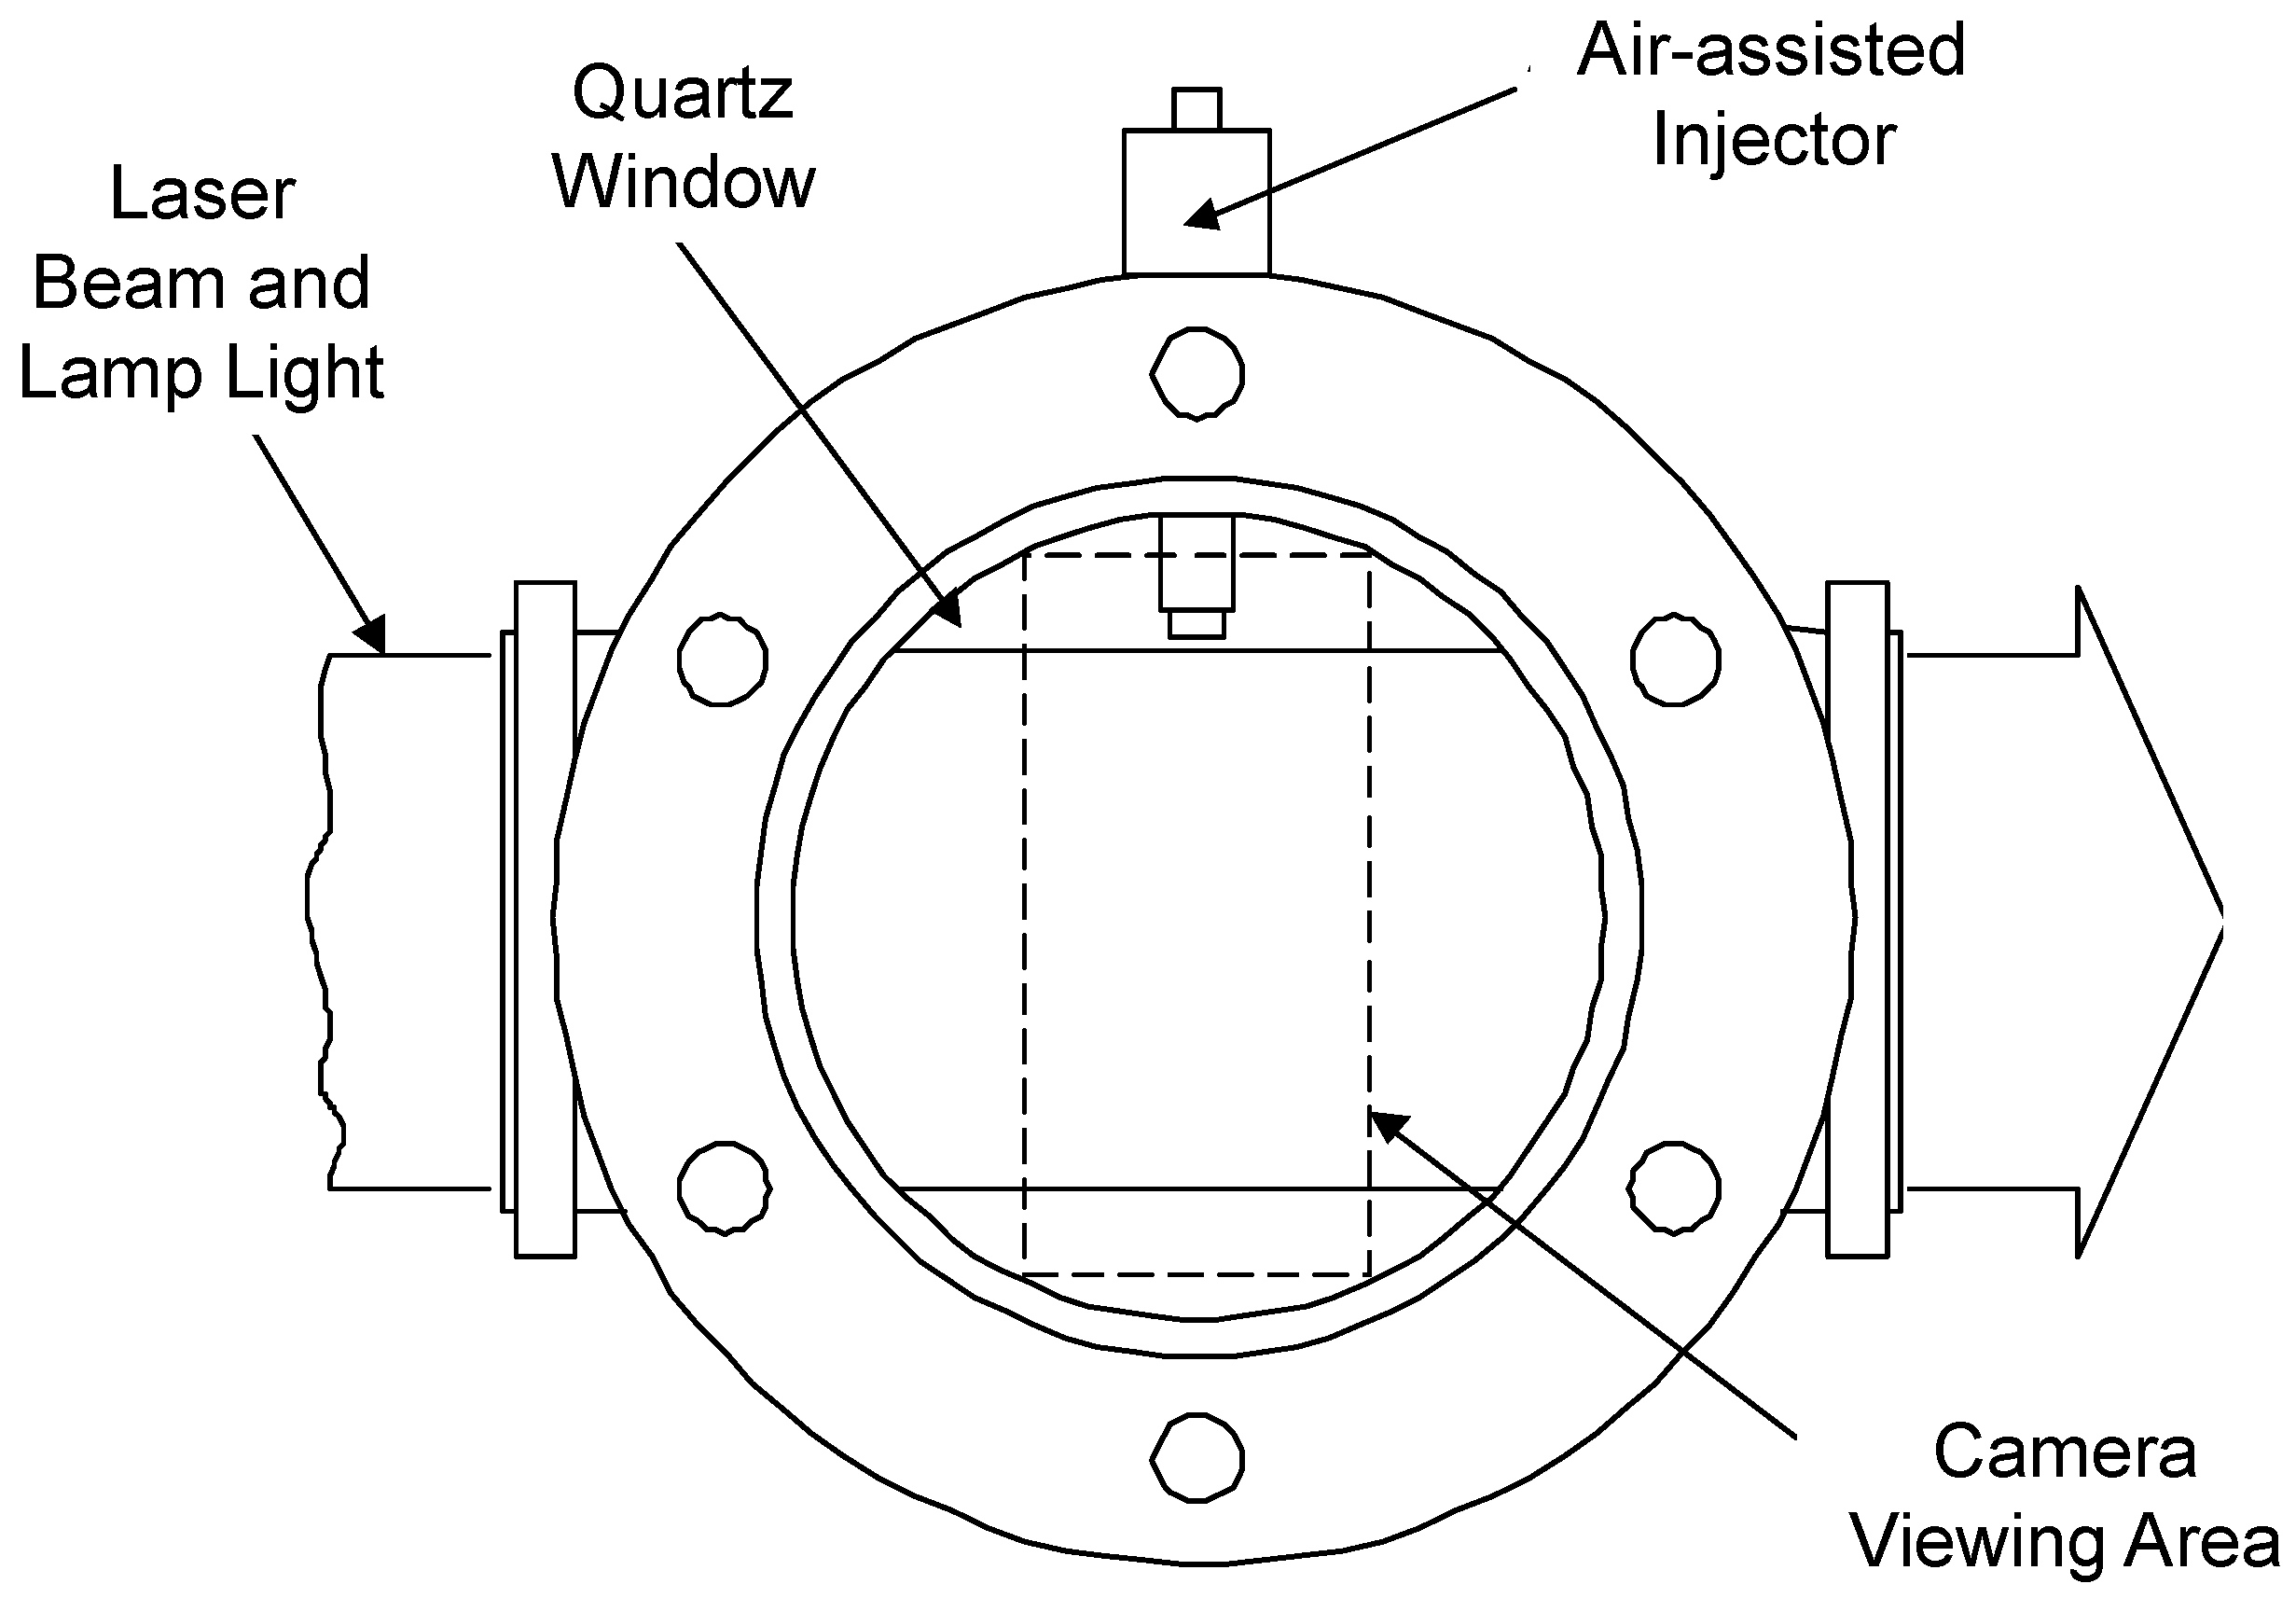
Pure ethanol has a moderate volatility. Its high boiling point (78 °C) brings in the difficulties of vaporization in ambient or cold conditions. Moreover, ethanol has a very high latent heat of vaporization (~3 times higher than typical gasoline). This property causes drivability difficulties; the vaporization of ethanol in cold conditions needs a lot of energy and, consequently, induces a cooling effect.
This paper presents an experimental study of bioethanol spray with various ambient temperatures, including sub-zero conditions, using an air-assisted direct fuel injector as a spray-guided injection system in a constant volume chamber (CVC). Ensemble-averaged planar images of the laser light sheet illumination (Mie scattering) from the spray are obtained to measure the penetration length and qualitative droplet diameter with varying ambient temperature. Lamp-illuminated images are also obtained under the same conditions in order to observe the entire spray structure. Finally, a scaling for the penetration is proposed that achieves reasonable clustering in the experimental results.

2. Experiment

Figure 1 shows a photograph of the experimental setup. The CVC itself was formed by boring three perpendicular holes of 90 mm diameter into a single piece of mild steel slab (Figure 1 and Figure 2). Each face of the chamber was then fitted with either windows or blanking flanges. The fuel injector was located in the top flange and was a spray-guided, air-assisted direct injection system. Three windows provide optical access. The back flange has ports to allow for intake and exhaust of chamber gas controlled by a solenoid valve. The time gap between injection events varied depending on experimental conditions, with sensitivity studies of this time gap showing that results did not change significantly when longer time gaps were used. Further information on the CVC and the air-assisted direct injector can be found in the previous research [33].
For these cold spray measurements, the CVC was placed inside a sealed refrigerator unit whose temperature was controllable and maintained at a constant. This allowed the experiments to be performed from room temperature to sub-zero temperatures. In order to avoid water condensation or icing on the outside of the CVC windows, the entire internal volume of the refrigerator was filled with nitrogen gas, and a second set of windows on the outside of the refrigerator was covered with a nitrogen gas blanket. The fuel and air lines to the CVC were coiled within the internal space of the refrigerator such that the residence time of a given fuel or air particle was long enough to establish thermal equilibrium. For the experiments presented in this paper, this was estimated to be approximately 2400 fuel injection events and 90 air injection events.
All CVC experiments used an E93 mixture made by mixing 93% analytical grade ethanol with 7% distilled water, representing Brazilian alcohol without seeding materials. Recent research shows that the addition of a certain amount of seeding material causes a change in the spray shape to some degree [34]. This was also selected in the first instance as the anticipated performance of azeotropic ethanol/water mixtures at sub-zero temperatures is not obvious. The mass of injected fuel is 20 mg/injection, which was measured in a separate experiment. The injection pressures of fuel and air are 800 kPag and 650 kPag, respectively, with the chamber always at atmospheric pressure. The injection pressures of fuel and air were maintained at constant values. The mechanical air injection duration is 3.3 ms, and the mechanical time gap between fuel and air injections is 1 ms. Table 2 shows the experimental conditions in detail.
The laser images presented used Mie scattering from the second harmonic (532 nm) from a Nd:YAG laser (Quantel, TwinsB). The absorption coefficients of ethanol and water at 532 nm are 4.7 × 10⁻⁴ and 6.8 × 10⁻⁴ cm−1, respectively [35,36]. The attenuation effect, therefore, can be negligible. However, some degree of attenuation observed in this experiment shows a higher intensity on the left-hand side of the spray. These signals were imaged at a right angle to the laser beam using a CCD camera (LaVision, FlowMaster3) with a UV Nikon lens (f/# 4.5). The camera gating is 10 μs and 200 μs for the laser light illumination (Mie scattering) and lamp-illumination experiments, respectively. A narrow 532 nm bandpass filter was used to avoid any interference light in the laser light sheet illumination experiment. The spatial resolution of the imaging is approximately 100 μm in this experiment. All averaged images used 30 instantaneous images and were post-processed.

3. Results

Figure 3 shows ensemble-averaged, lamp-illuminated images of the fuel spray at differing times after injection and at three different temperatures. Qualitatively, the three sets of images are very similar, showing good atomisation of the fuel in all cases. Closer inspection of all images shows no evidence of separation of the ethanol and water due to icing.
The ensemble-averaged, laser light-sheet-illuminated images (Mie scattering) in Figure 4 show results that are consistent with the lamp-illuminated images. The spray tip penetration length was measured directly from these laser light-sheet-illuminated images and obtained by measuring the distance from the injector exit to a specified range of the lower intensity Mie scattering contour in the axial direction. The maximum measured penetration was limited to 60 mm, since the CVC had an internal diameter of 90 mm, and, beyond about 80 mm, penetration wall effects come into play.

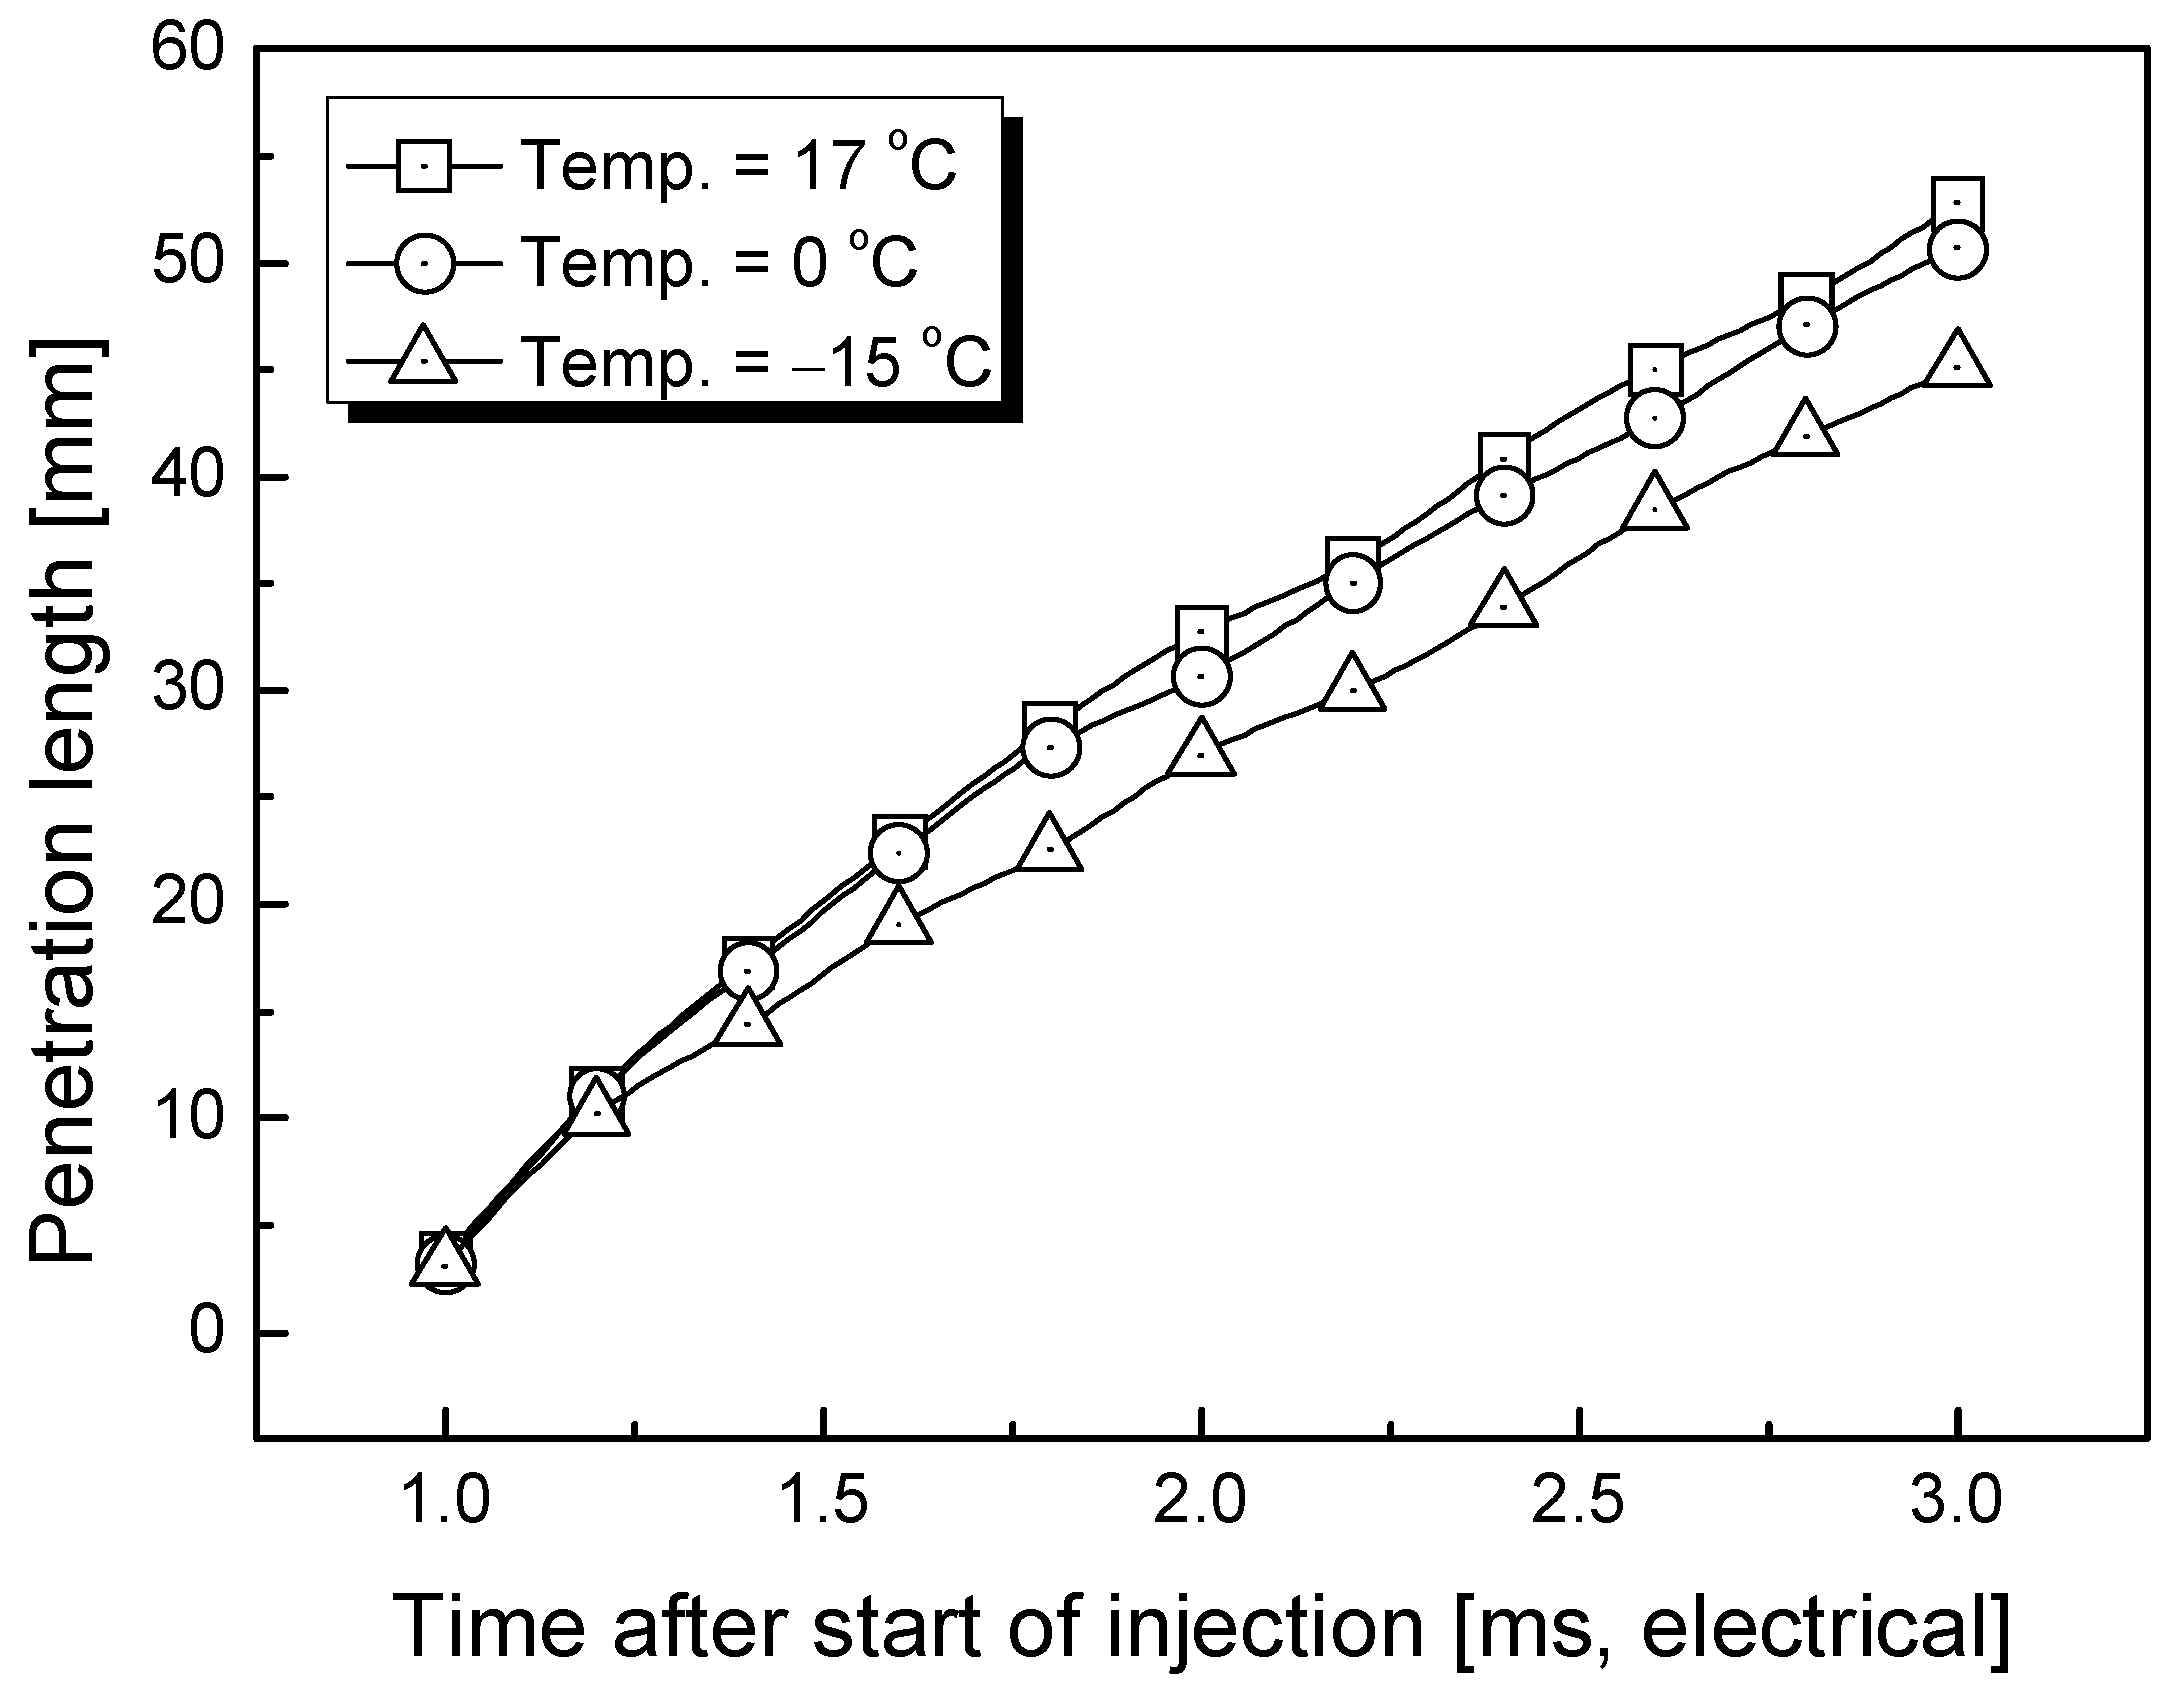
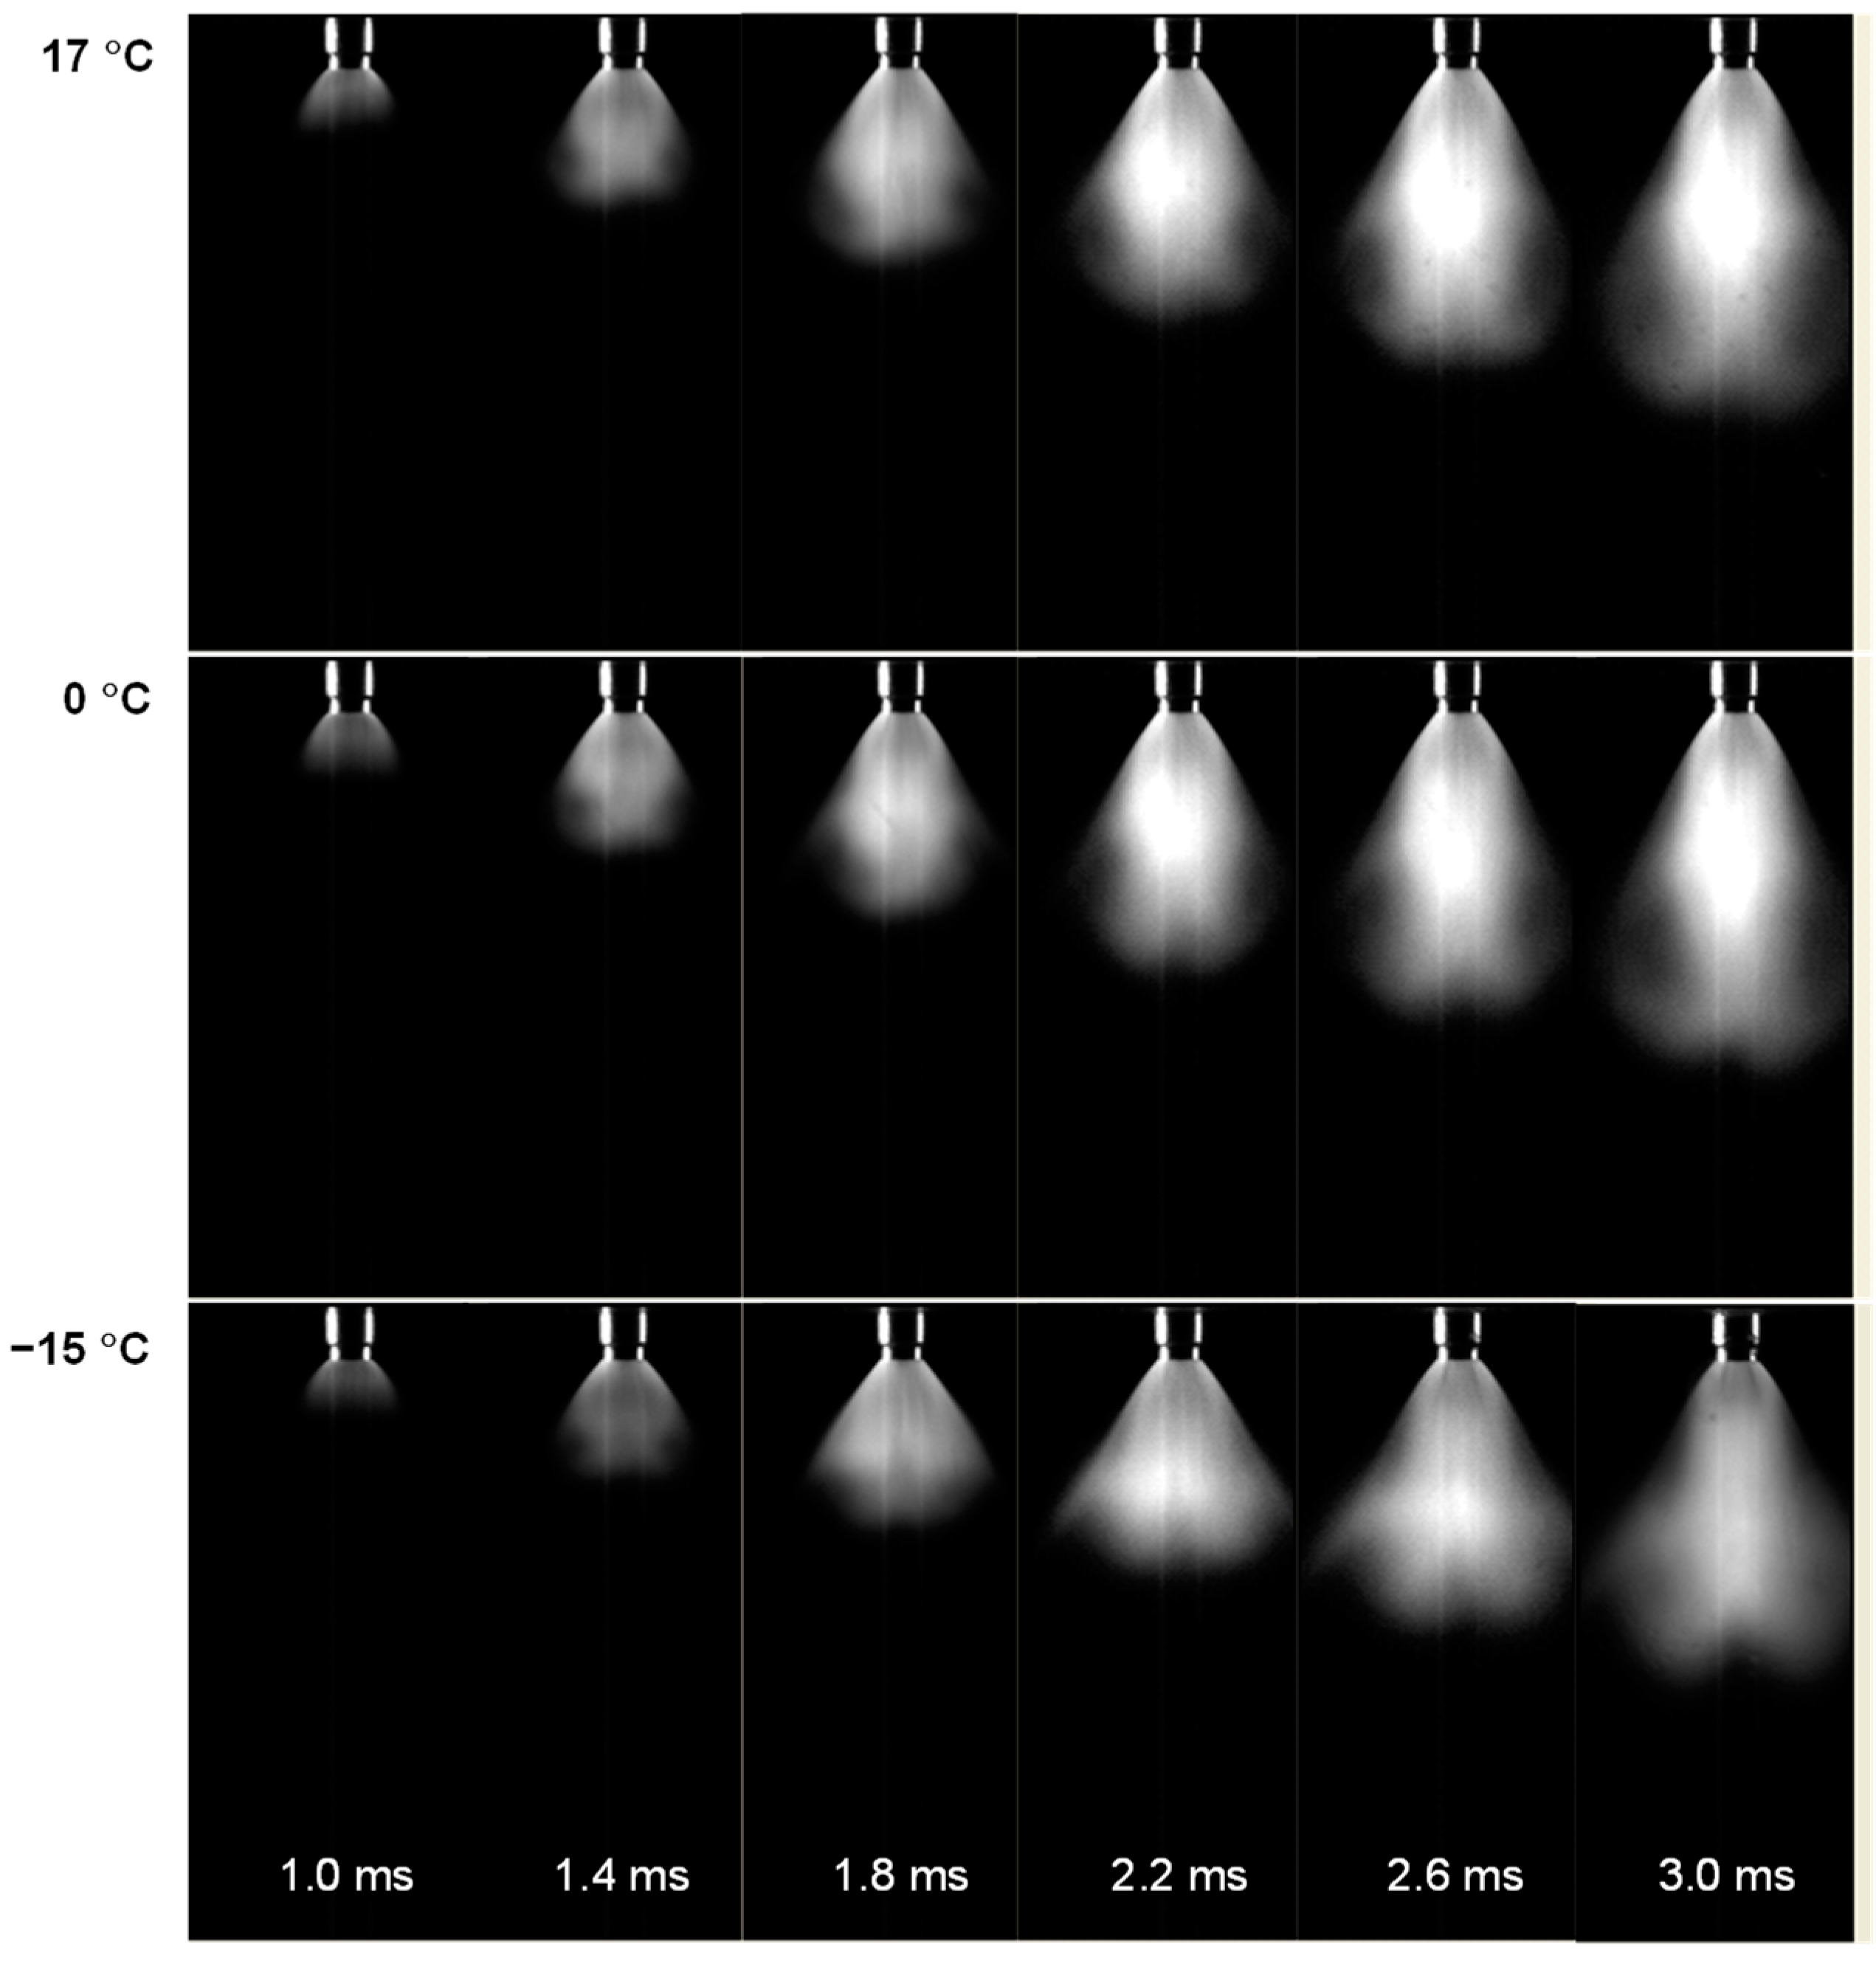
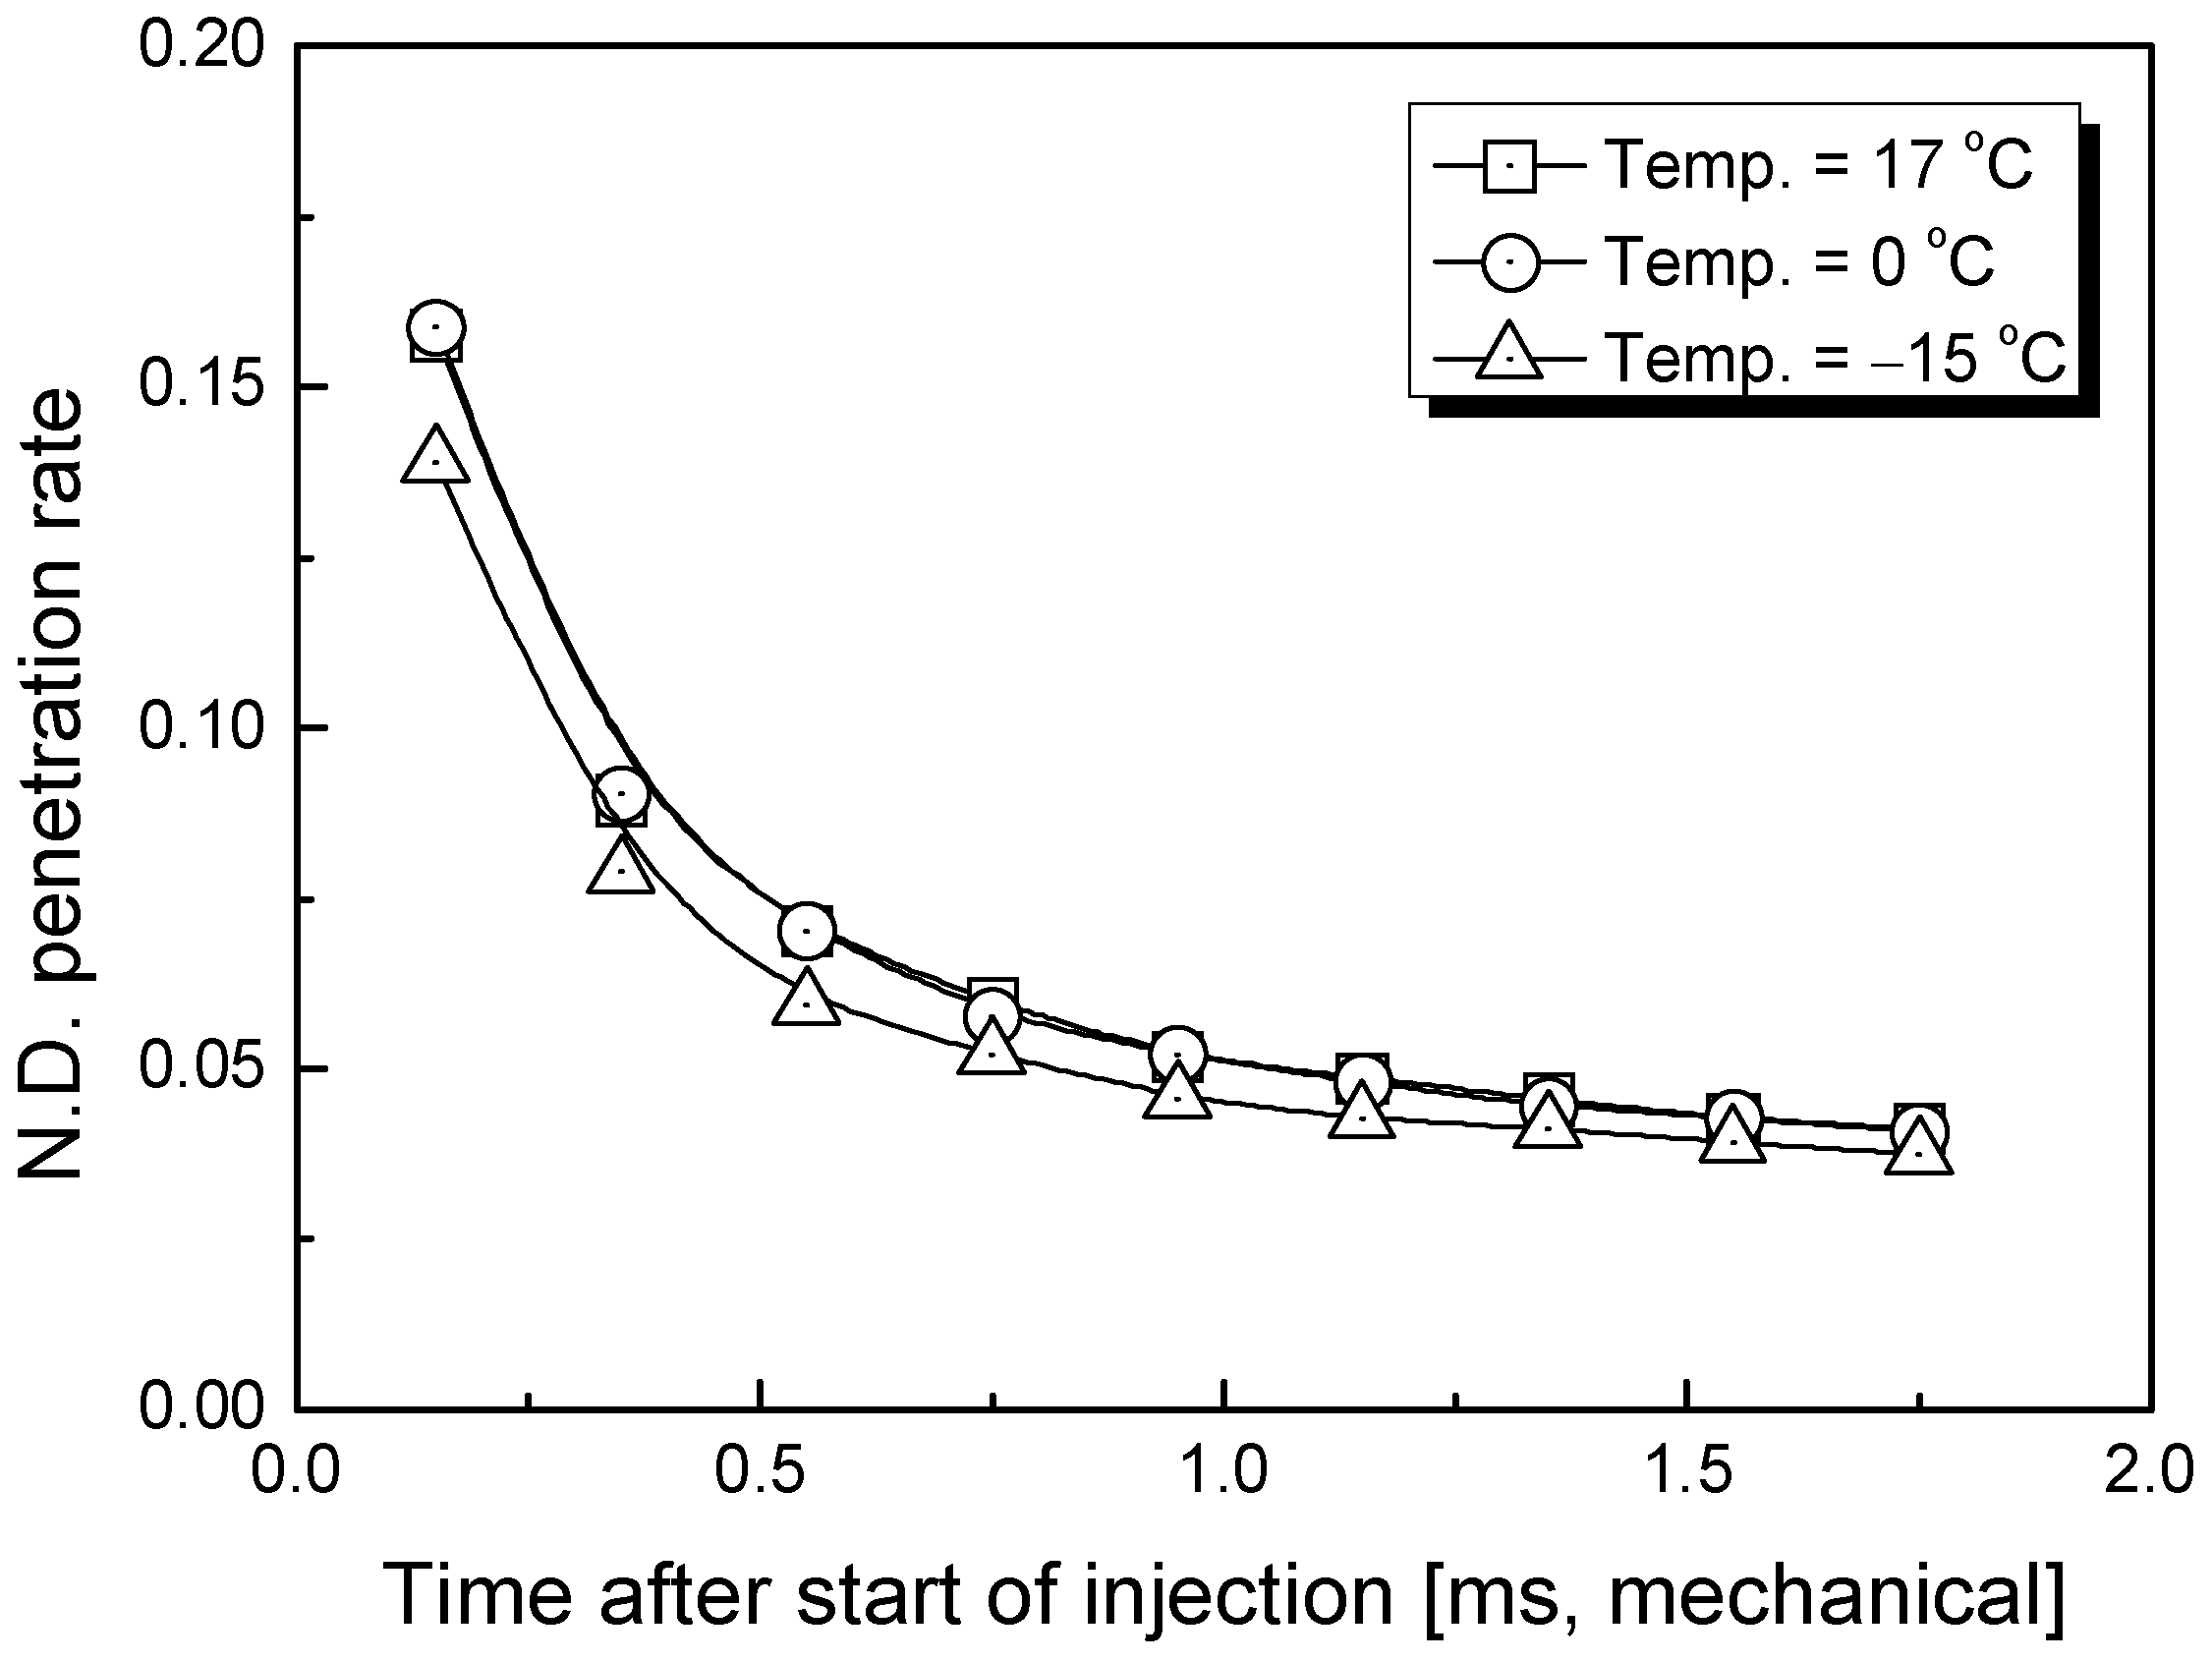
3.1. Penetration Depth Estimation

Figure 5 shows the penetration length measured in this way, as a function of time for the different chamber temperatures. There is a general trend of reduced spray penetration with reduced temperature, although this effect is not particularly strong over the range of temperatures studied. It can therefore be said with some confidence that spray atomisation and penetration of this E93 mixture is reasonable over the range of temperatures studied in this paper.
There are several possible causes for the observed temperature dependence of the spray penetration. Previous research [33] demonstrated a scaling that could accommodate changes in isothermal spray penetration due to changes in the chamber and injection pressures.
A non-dimensional penetration rate can be formulated as follows:
n . d .     p e n e t r a t i o n   r a t e = p e n e t r a t i o n t i m e ρ a Δ P
using the difference between the air injection and chamber pressures (ΔP), the chamber density (ρa), the measured spray penetration, and the mechanical time after the start of injection. Figure 6 shows this non-dimensional penetration rate versus time after injection for all the results obtained, with a collapse to within roughly 5% of a mean value. Further research is ongoing to better understand the effect of temperature on the penetration in conjunction with other parameters (pressure, viscosity, density, etc.).

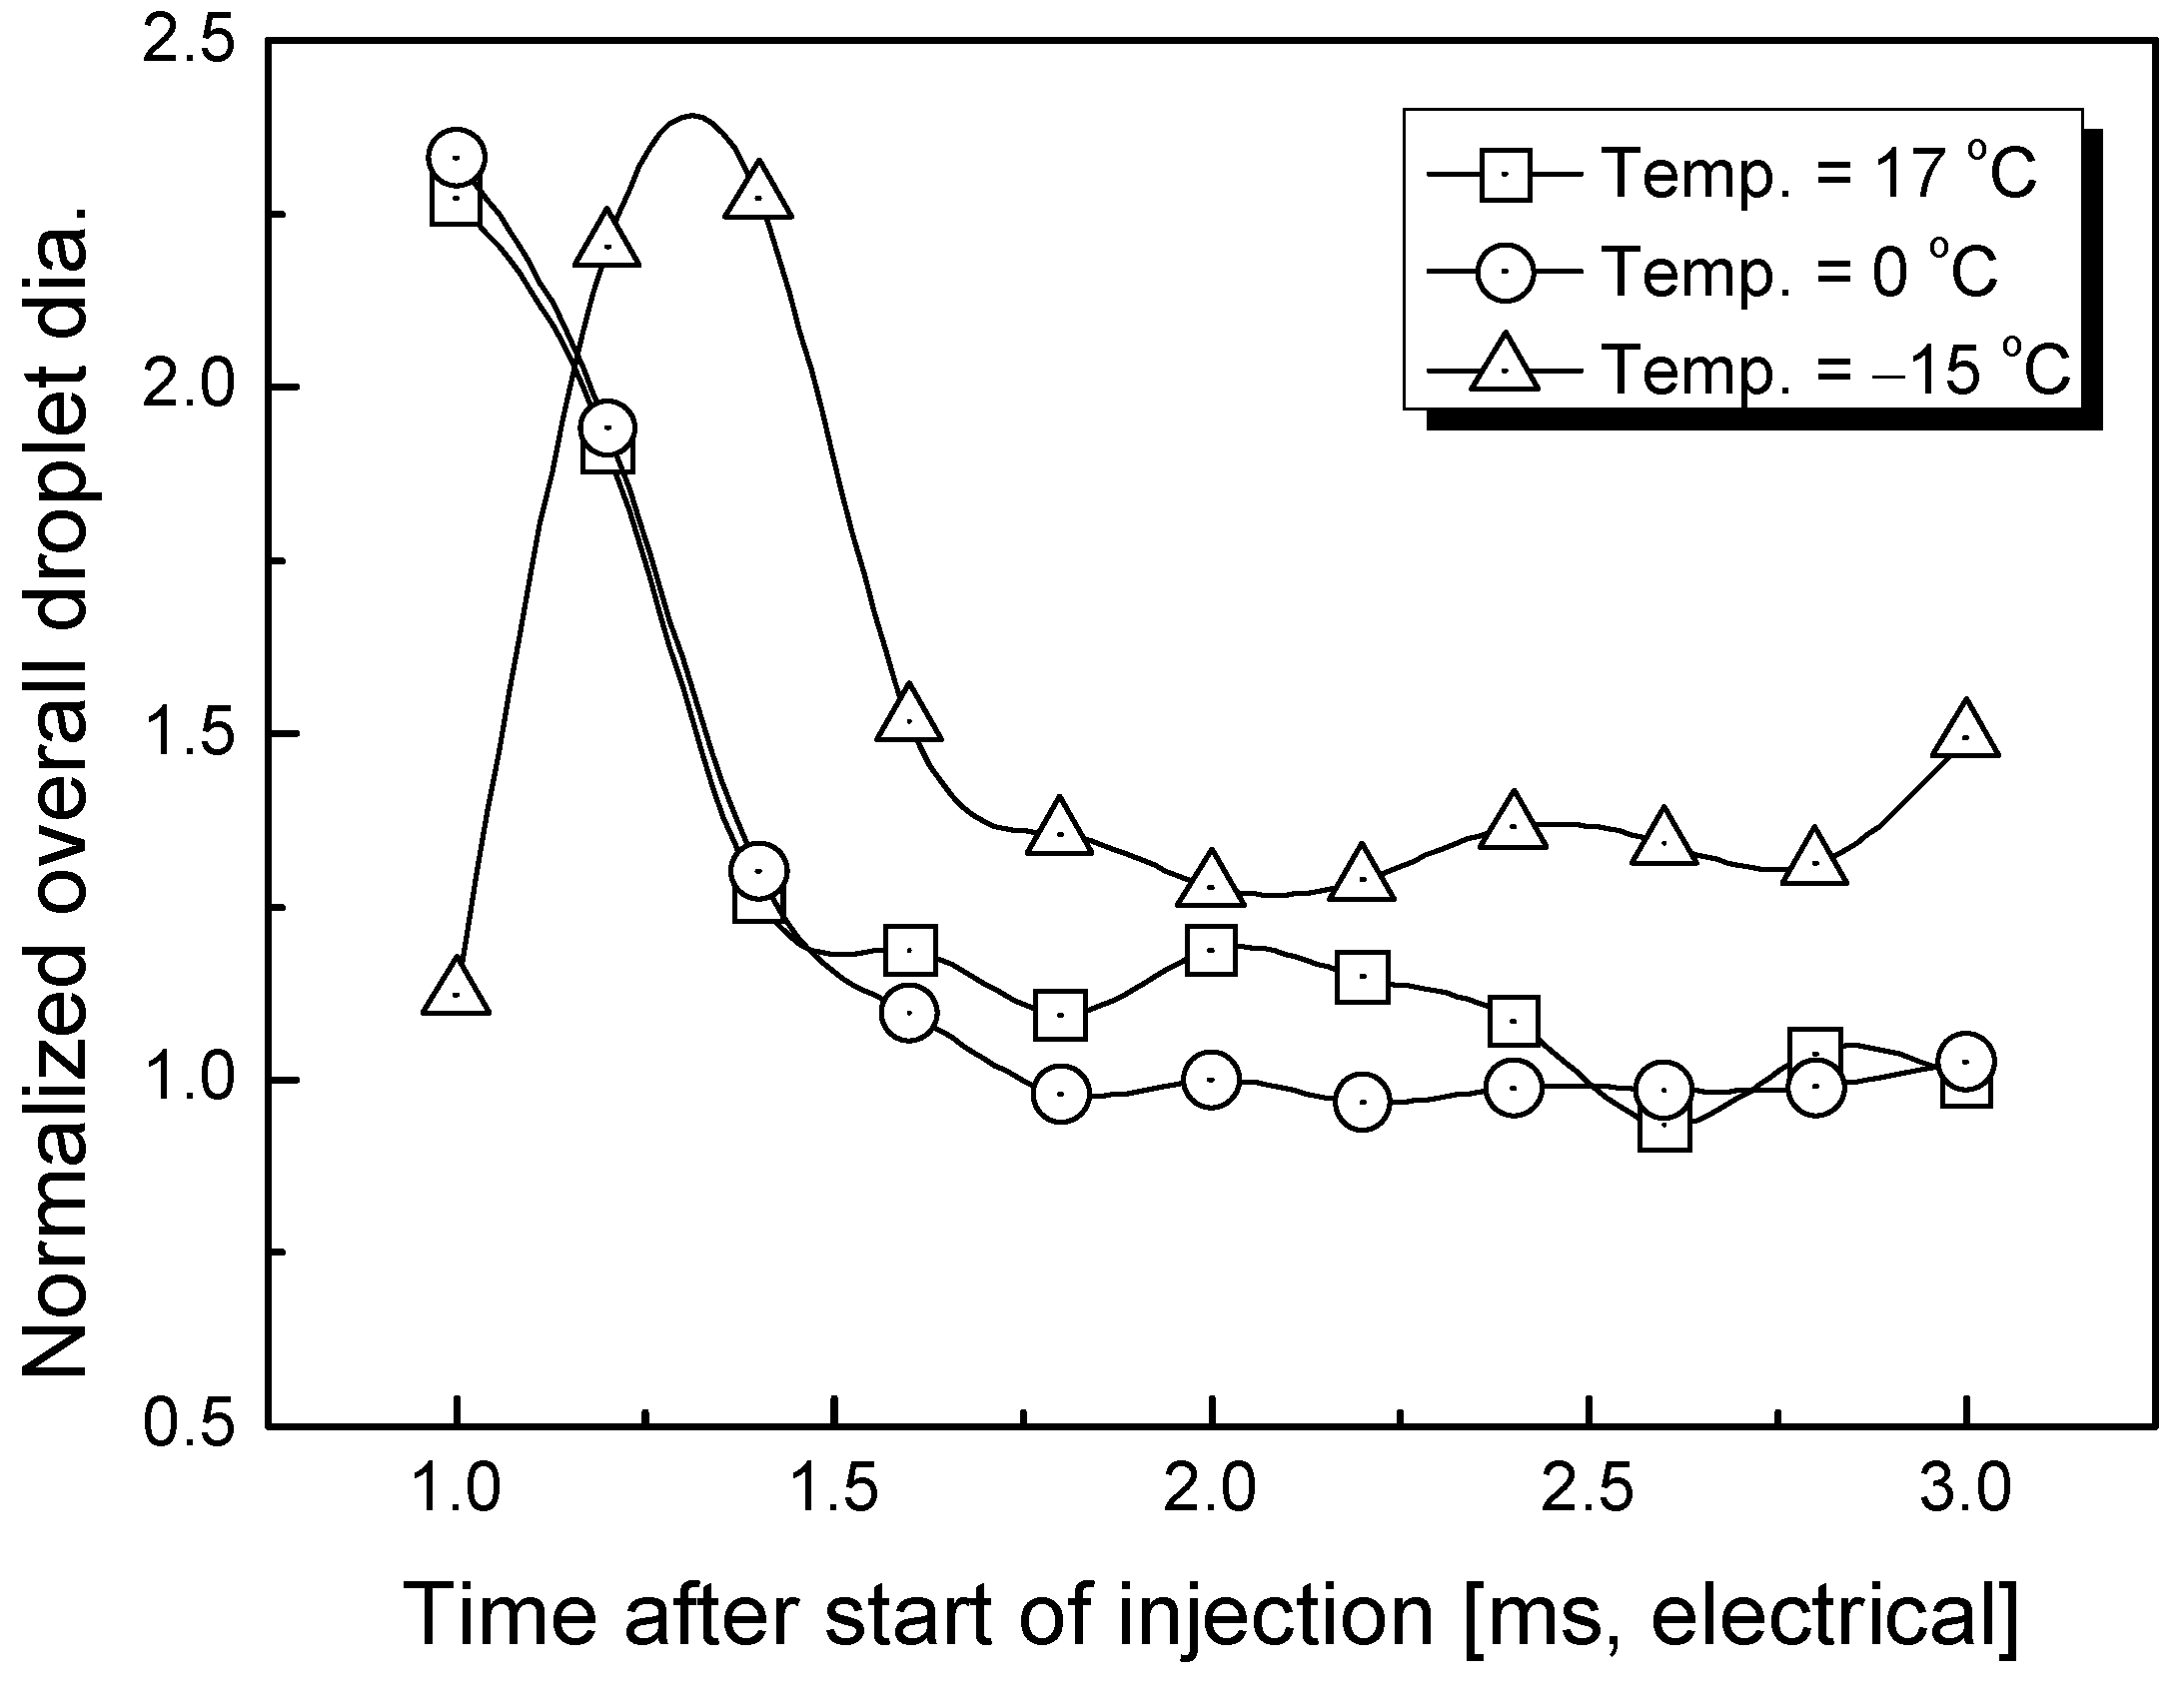
3.2. Estimation of Average Droplet Size

One of the important parameters in spray research is droplet size. Different kinds of techniques have been developed to measure droplet size such as PDPA (phase Doppler particle analysis), LDPA (laser diffraction particle analysis), and LSD (laser sheet drop-sizing). However, each technique has its own shortcomings. For example, LDPA is not suitable for dense spray measurement because of multiple-diffraction phenomena, and PDPA is used for point measurement. PDPA also suffers errors in the measured mean drop size in dense sprays due to multiple scattering [37,38]. Regarding the LSD technique, it uses the Mie scattering and LIF (laser-induced fluorescence). The signal intensity of LIF, however, depends heavily on pressure and temperature. The planar Mie scattering image was only used in this paper to evaluate quantitative droplet size with some assumptions.
Under the assumptions that (i) the amount of fuel injected is independent of the temperature, which has been evaluated in a separated experiment; (ii) the droplets are all spherical and possess the same volume in a given imaging area; and (iii) the spray was injected without evaporation during injection time, the signal intensity of the Mie scattering is directly proportional to an inverse of the droplet diameter according to:
n     d 3 S A   n Δ d 2   d 1 I M i e   S A   d 1
where n is the number of droplets, d is the droplet diameter, SA is the surface area of number of droplets, and IMie is the signal intensity of Mie scattering.
Since the droplet diameter varies substantially over the entire spray, a measure of the qualitative overall droplet diameter of the spray at a given instant can be obtained by area averaging according to:
O v e r a l l   d r o p l e t   d i a . = 1 A A d r o p l e t   d i a .   d A
where A is defined as the area with a non-zero droplet diameter and increases with time after the start of injection. The overall droplet diameter with various experimental conditions is then normalised based on the overall droplet diameter at the atmospheric temperature condition and 3.0 ms of time after the start of injection. The effect of the ambient temperature at different times after the start of injection on the overall droplet size is shown in Figure 7. As expected, the droplet size is larger at the sub-zero temperature condition, most likely due to increasing liquid viscosity [39]. At all temperatures, the spray-averaged droplet size varies with time significantly until about 2.0 ms after the start of injection, after which it remains a roughly constant value.

4. Conclusions

Looking at the history of energy transitions, carbon-containing coal was used in the 19th century, and petroleum-based fuel, which is a hydrocarbon fuel containing carbon and hydrogen, became the mainstream in the 20th century.
Air pollutants, such as carbon monoxide, hydrocarbons, nitrogen oxides, etc., emitted from current internal combustion engine vehicles are expected to improve significantly within the next year, according to the continuous reinforcement of vehicle emission standards and fuel quality standards. However, energy and greenhouse gas problems will remain difficult to solve, and, accordingly, biofuels, synthetic fuels, and hydrogen fuels, which are new energy sources that can significantly reduce greenhouse gases, are expected to be actively introduced and used in the near future.
Bioethanol can replace petroleum fuels that occupy the mainstream of automobile fuels by effectively utilizing renewable biomass resources, and it is possible to reduce greenhouse gases because the total life cycle emission of carbon dioxide, a global warming gas, is low. In addition, since the fuel contains oxygen to reduce air pollutants, such as HC and CO, the supply is being expanded in each country to diversify energy sources and to improve the atmospheric environment in response to climate change.
This paper studied the effect of temperature on the behaviour of a bioethanol/water spray from an automotive fuel injector. The spray penetration exhibited some temperature dependence, with the penetration falling as the chamber temperature fell below 0 °C. Nonetheless, a scaling published previously by the group demonstrated good collapse of the spray penetration rate when applied to these results. A normalised and spray-averaged droplet diameter was also examined. This showed that droplet size increased with reduced chamber temperature. Determination of the mechanisms for both of these temperature effects is the topic of ongoing research for another alternative fuels.

Funding

This research received no external funding.

Institutional Review Board Statement

Republished with permission of [SAE International], from [Unassisted low temperature starting of a pure ethanol fuelled direct injection engine, Utley, T.D., Brewster, S., Tilmouth, A., Jin, S.H., and Brear, M.J., SAE Paper 2008-36-0270, 2008]; permission conveyed through Copyright Clearance Center, Inc.

Informed Consent Statement

Not applicable

Data Availability Statement

The data presented in this study are available on request from the corresponding author.

Conflicts of Interest

The author declares no conflict of interest.

References

  1. European Union. Directive 2015/1513 of the European Parliament and of the Council of 9 September 2015 Amending Directive 98/70/EC Relating to the Quality of Petrol and Diesel Fuels and Amending Directive 2009/28/EC on the Promotion of the Use of Energy from Renewable Sources, L 239/1 EN. Off. J. Eur. Union 2015, 58, 1–29. Available online: https://eur-lex.europa.eu/legal-content/EN/TXT/?uri=celex%3A32015L1513 (accessed on 15 February 2022).
  2. European Union. Directive 2009/28/EC of the European Parliament and of The Council of 23 April 2009 on the Promotion of the Use of Energy from Renewable Sources and Amending and Subsequently Repealing Directives 2001/77/EC and 2003/30/EC, L 140/16 EN. Off. J. Eur. Union 2009, 5, 16–62. Available online: https://eur-lex.europa.eu/legal-content/EN/ALL/?uri=celex%3A32009L0028 (accessed on 18 February 2022).
  3. Topgul, T.; Yucesu, H.S.; Cinar, C.; Koca, A. The effects of ethanol-unleaded gasoline blends and ignition timing on engine performance and exhaust emissions: Technical Note. Renew. Energy 2006, 31, 2534–2542. [Google Scholar] [CrossRef]
  4. Yuksel, F.; Yuksel, B. The use of ethanol-gasoline blend as a fuel in an SI engine: Technical Note. Renew. Energy 2004, 29, 1181–1191. [Google Scholar] [CrossRef]
  5. Bata, R.M.; Elond, A.C.; Rice, R.W. Emissions from IC engines fueled with alcohol-gasoline blends: A literature review. Trans. ASME 1989, 111, 421–431. [Google Scholar] [CrossRef]
  6. Brewster, S.; Railton, D.; Maisey, M.; Frew, M. The effect of E100 water content on high load performance of a spray guide direct injection boosted engine. In SAE Paper 2007-01-2648, Proceedings of the SAE Brasil 2007 Congress and Exhibit, São Paulo, Brazil, 28–30 November 2007; SAE: Warrendale, PA, USA, 2007. [Google Scholar] [CrossRef]
  7. Balat, M.; Balat, H. Recent trends in global production and utilization of bio-ethanol fuel. Appl. Energy 2009, 86, 2273–2282. [Google Scholar] [CrossRef]
  8. Demirbas, A. Competitive liquid biofuels from biomass. Appl. Energy 2011, 88, 17–28. [Google Scholar] [CrossRef]
  9. Mussatto, S.I.; Dragone, G.; Guimarães, P.M.; Silva, J.P.; Carneiro, L.M.; Roberto, I.C. Technological trends, global market, and challenges of bio-ethanol production. Biotechnol. Adv. 2010, 28, 817–830. [Google Scholar] [CrossRef] [PubMed] [Green Version]
  10. Kumar, S.; Singh, N.; Prasad, R. Anhydrous ethanol: A renewable source of energy. Renew. Sustain. Energy Rev. 2010, 14, 1830–1844. [Google Scholar] [CrossRef]
  11. Niven, R.K. Ethanol in gasoline: Environmental impacts and sustainability review article. Renew. Sustain. Energy Rev. 2005, 9, 535–555. [Google Scholar] [CrossRef]
  12. Oscar, J.S.; Carlos, A.C. Review: Trends in biotechnological production of fuel ethanol from different feedstocks. Bioresour. Technol. 2008, 99, 5270–5295. [Google Scholar] [CrossRef]
  13. Limayem, A.; Ricke, S.C. Lignocellulosic biomass for bioethanol production: Current perspectives, potential issues and future prospects. Prog. Energy Combust. Sci. 2012, 38, 449–467. [Google Scholar] [CrossRef]
  14. Sarkar, N.; Ghosh, S.K.; Bannerjee, S.; Aikat, K. Bioethanol production from agricultural wastes: An overview. Renew Energy 2012, 37, 19–27. [Google Scholar] [CrossRef]
  15. Cardona, C.A.; Quintero, J.A.; Paz, I.C. Production of bioethanol from sugarcane bagasse: Status and perspectives. Bioresour. Technol. 2010, 101, 4754–4766. [Google Scholar] [CrossRef] [PubMed]
  16. Kosugi, A.; Kondo, A.; Ueda, M.; Murata, Y.; Vaithanomsat, P.; Thanapase, W. Production of ethanol from cassava pulp via fermentation with a surface engineered yeast strain displaying glucoamylase. Renew. Energy 2009, 34, 1354–1358. [Google Scholar] [CrossRef]
  17. Rao, K.; Chaudhari, V.; Varanasi, S.; Kim, D.S. Enhanced ethanol fermentation of brewery waste water using the genetically modified strain E. coli KO11. Appl. Microbiol. Biotechnol. 2007, 74, 50–60. [Google Scholar] [CrossRef]
  18. Linggang, S.; Phang, L.Y.; Wasoh, M.H.; Abd-Aziz, S. Sago pith residue as an alternative cheap substrate for fermentable sugars production. Appl. Biochem. Biotechnol. 2012, 167, 122–131. [Google Scholar] [CrossRef]
  19. Mood, S.H.; Golfeshan, A.H.; Tabatabaei, M.; Jouzani, G.S.; Najafi, G.H.; Gholami, M. Lignocellulosic biomass to bioethanol, a comprehensive review with a focus on pretreatment. Renew. Sustain. Energy Rev. 2013, 27, 77–93. [Google Scholar] [CrossRef]
  20. Hendriks, A.T.W.M.; Zeeman, G. Pretreatments to enhance the digestibility of lignocellulosic biomass. Bioresour. Technol. 2009, 100, 10–18. [Google Scholar] [CrossRef]
  21. Alvira, P.; Tomas, E.; Ballesteros, M.; Negro, M.J. Pretreatment technologies for an efficient bioethanol production process based on enzymatic hydrolysis: A review. Bioresour. Technol. 2010, 101, 4851–4861. [Google Scholar] [CrossRef]
  22. Carolina, C.M.; Arturo, J.G.; Mahmoud, E.-H. A comparison of pretreatment methods for bioethanol production from lignocellulosic materials. Process Saf. Environ. 2012, 90, 189–202. [Google Scholar] [CrossRef]
  23. Utley, T.D.; Brewster, S.; Tilmouth, A.; Jin, S.H.; Brear, M.J. Unassisted Low Temperature Starting of a Pure Ethanol Fuelled Direct Injection Engine. In SAE Paper 2008-36-0270, Proceedings of the Congresso SAE Brasil, São Paulo, Brazil, 7–9 October 2008; SAE: Warrendale, PA, USA, 2008. [Google Scholar] [CrossRef]
  24. The Engineering Toolbox. Available online: https://www.engineeringtoolbox.com/ethanol-dynamic-kinematic-viscosity-temperature-pressure-d_2071.html (accessed on 21 February 2022).
  25. Jeuland, N.; Montagne, X.; Gautrot, X. Potentiality of ethanol as a fuel for dedicated engine. Oil Gas Sci. Technol.–Rev. IFP 2004, 59, 559–570. [Google Scholar] [CrossRef] [Green Version]
  26. Michalopoulou, D.-P.; Komiotou, M.; Zannikou, Y.; Karonis, D. Impact of bio-ethanol, bio-ETBE addition on the volatility of gasoline with oxygen content at the level of E10. Fuels 2021, 2, 29. [Google Scholar] [CrossRef]
  27. Rodríguez-Antón, L.M.; Hernández-Campos, M.; Sanz-Pérez, F. Experimental determination of some physical properties of gasoline, ethanol and ETBE blends. Fuel 2013, 112, 178–184. [Google Scholar] [CrossRef]
  28. Weber de Menezes, E.; Cataluña, R.; Samios, D.; Da Silva, R. Addition of an azeotropic ETBE/ethanol mixture in eurosupertype gasolines. Fuel 2006, 85, 2567–2577. [Google Scholar] [CrossRef]
  29. Karonis, D.; Anastopoulos, G.; Lois, E.; Stournas, S. Impact of simultaneous ETBE and ethanol addition on motor gasoline properties. SAE Int. J. Fuels Lubr. 2009, 1, 1584–1594. [Google Scholar] [CrossRef]
  30. AlRamadan, A.S.; Sarathy, S.M.; Badra, J. Unraveling the octane response of gasoline/ethanol blends: Paving the way to formulating gasoline surrogates. Fuel 2021, 299, 120882. [Google Scholar] [CrossRef]
  31. Magnusson, R.; Nilsson, C. The influence of oxygenated fuels on emissions of aldehydes and ketones from a two-stroke spark ignition engine. Fuel 2011, 90, 1145–1154. [Google Scholar] [CrossRef]
  32. Yücesu, S.H.; Topgül, T.; Çinar, C.; Okur, M. Effect of ethanol–gasoline blends on engine performance and exhaust emissions in different compression ratios. Appl. Therm. Eng. 2006, 26, 2272–2278. [Google Scholar] [CrossRef]
  33. Jin, S.H.; Brear, M.J.; Watson, H.C.; Brewster, S. An experimental study of the spray from an air-assisted direct fuel injector. Proc. Inst. Mech. Eng. Part D J. Autom. Eng. 2008, 222, 1883–1894. [Google Scholar] [CrossRef]
  34. Sick, V.; Westbrook, C.K. Diagnostic implications of the reactivity of fluorescence tracers. In Proceedings of the 32nd International Symposium on Combustion, Montreal, QC, Canada, 3–8 August 2008. [Google Scholar] [CrossRef]
  35. Cabrera, H.; Marcano, A.; Castellanos, Y. Absorption coefficient of nearly transient liquids measured using thermal lens spectrometry. Condens. Matter Phys. 2006, 9, 385–389. [Google Scholar] [CrossRef] [Green Version]
  36. Pope, R.M.; Fry, E.S. Absorption spectrum (380~700nm) of pure water II: Integrating cavity measurements. Appl. Opt. 1997, 36, 8710–8723. [Google Scholar] [CrossRef] [PubMed]
  37. LeGal, P.; Farrugia, N.; Greenhalgh, D.A. Laser sheet dropsizing of dense sprays. Opt. Laser Technol. 1999, 31, 75–83. [Google Scholar] [CrossRef]
  38. Jermy, M.C.; Greenhalgh, D.A. Planar dropsizing by elastic and fluorescence scattering in sprays too dense for phase Doppler measurement. Appl. Phys. B 2000, 71, 703–710. [Google Scholar] [CrossRef]
  39. Lefebvre, A.H. Atomization and Sprays, 2nd ed.; Taylor & Francis: Boca Raton, FL, USA, 1989; ISBN 9781498736251. [Google Scholar] [CrossRef]
Figure 1. Photograph of the constant volume chamber (CVC) within the refrigeration unit.
Fuels 03 00013 g001
Figure 2. Schematic showing imaging plane for side illumination and laser images.
Fuels 03 00013 g002
Figure 3. Ensemble-averaged side-illuminated spray images with different temperatures.
Fuels 03 00013 g003
Figure 4. Ensemble-averaged images of Mie scattering with different temperatures.
Fuels 03 00013 g004
Figure 5. Spray penetration length versus time after start of injection for different CVC temperatures.
Fuels 03 00013 g005
Figure 6. Non-dimensional penetration rate versus time after start of injection for different CVC temperatures.
Fuels 03 00013 g006
Figure 7. Normalised overall droplet diameter versus time after start of injection for different CVC temperatures.
Fuels 03 00013 g007
Table 1. Physical properties of ethanol versus gasoline [6,23,24].
PropertyGasolineEthanol
molecular formula~CH1.85C2H5OH
C (% mass)~86.652.1
O (% mass)034.7
density at 20 °C (kg/L)~0.740.79
stoichiometric AFR (:1)~14.69.0
lower heating value (MJ/kg)~43.526.8
flash point (°C)≤−4014
CO2 (g/MJ)~72.971.3
boiling point (°C)25~20078.4
freezing point (°C) −114
latent heat of vaporisation (kJ/kg)~300855
research octane number91~98~110
ignition temperature (°C)~300420
viscosity (mPa s) 1.214 @ 17 °C
1.720 @ 0 °C
2.419 @ −15 °C
surface tension (N/m) 0.02239 @ 20 °C
Table 2. Experimental conditions.
InjectorAir-Assisted Injector
fuel injection pressure800 kPag
air injection pressure650 kPag
fuel injection quantity20 mg/injection
fuel/air injection delay2.5 ms
air injection duration3.3 ms
ambient temperature17, 0 and −15 °C
chamber pressureatmospheric
Publisher’s Note: MDPI stays neutral with regard to jurisdictional claims in published maps and institutional affiliations.

