Article

A Model for Bias Potential Effects on the Effective Langmuir Adsorption–Desorption Processes

by
Luiz Roberto Evangelista
1,2,*,†,
Giovanni Barbero
1,3,† and
Anca Luiza Alexe-Ionescu
1,4,†
1
Dipartimento di Scienza Applicata del Politecnico di Torino, Corso Duca degli Abruzzi 24, 10129 Torino, Italy
2
Departamento de Física, Universidade Estadual de Maringá, Avenida Colombo 5790, Maringá, PR 87020-900, Brazil
3
Moscow Engineering Physics Institute, National Research Nuclear University MEPhI, Kashirskoye Shosse 31, 115409 Moscow, Russia
4
Faculty of Applied Sciences, University Politehnica of Bucharest, Splaiul Independentei 313, 060042 Bucharest, Romania
*
Author to whom correspondence should be addressed.
These authors contributed equally to this work.
Electron. Mater. 2021, 2(2), 125-141; https://doi.org/10.3390/electronicmat2020011
Submission received: 1 March 2021 / Revised: 16 April 2021 / Accepted: 12 May 2021 / Published: 17 May 2021
(This article belongs to the Special Issue Feature Papers of Electronic Materials)

Abstract

:
We discuss the foundations of a model based on an extension of the Langmuir approximation for the adsorption–desorption phenomena, in which the phenomenological coefficients depend on the bias potential, in addition to their dependence on the adsorption energy. The theoretical analysis focuses on the effect of these effective coefficients on the electrical response of an electrolytic cell to an external electric field, as predicted by the Poisson–Nernst–Planck model. Kinetic balance equations govern the current densities on the electrodes when the adsorption phenomenon occurs in the presence of an electric bias. The influence of the phenomenological parameters entering the model, as well as of the symmetry of the cell on the cyclic voltammetry, is investigated.

1. Introduction

The adsorption of particles is a widespread phenomenon. It may be found in several physical and chemical systems [1], and is also of practical importance in pharmaceutical industries, food and chemistry [2], meta-organic systems [3], biomaterials [4], and in the study of adsorption of ions in electrolytic cells designed for energy storage [5,6,7,8,9,10,11,12,13,14,15,16]. In regard to these recent applications, capacitive deionization cells have been used as an efficient process because they operate using the cycles of adsorption and desorption, without electrolysis reactions at the electrodes and with the help of an applied potential [11].
Due to the adsorption–desorption process at the interface, the cells may be polarized without an applied external field. The origin of the polarization is related to the ionic adsorption at the asymmetric electrodes, responsible for a nonuniform electric potential between the surfaces [9]. Thus, a difference of potential, generated by the adsorption process at the limiting surfaces, will work as a kind of internal bias [10].
In both cases, with an external bias or in the presence of cell polarization, the effective adsorption process has to be reconsidered in order to take into account its possible effects on the measured response of the cell to an applied electric field.
In what follows, we review and apply a simple conceptual framework in which these effects may be quantitatively accounted for in a formalism based on the Langmuir approximation for the adsorption phenomenon [17]. Our purpose here is to discuss the fundamentals of the model proposed in [17] and used once to analyze some data arising from cyclic voltammetry [18]. The main motivation is to clarify how the presence of an effective surface potential, resulting from the presence of a bias, may be incorporated into the kinetic equations governing the balance of particles at the interface of a fluid system (in which mobile charges are present) and a solid adsorbing–desorbing surface representing idealized effective (and even porous) electrodes. To accomplish this task, we present the detailed solutions for the fundamental equations governing the behavior of the mobile charges in the bulk of a cell and connect them with the surface properties (which is carried out employing appropriate boundary conditions) to build an overall response of the cell to the external field (Section 2). The analytical solutions are necessary to obtain a closed expression of the electrical impedance depending on the frequency of the external voltage (Section 3). By means of this methodology, the approach is able to provide information on the surface effects detected, for instance, in experiments for which I ( V ) curves are available (Section 4). This implies that a general voltammetry analysis may be performed directly from a drift–diffusion model for the mobile charges (Section 5). In this way as well, a detailed analysis of the available experimental data may be carried out in strict connection with the predictions of the conceptual framework. The main conclusions are presented in Section 6.

2. Bulk Response and Adsorption Dynamics

For the theoretical analysis, we consider the kinetic balance equation governing adsorption–desorption at the interfaces in the spirit of the Langmuir isotherm approach. We assume that the number of adsorbing sites is very large when compared with the effective density of adsorbed particles [19]. This point can be made more clear as follows. What we refer to here as the Langmuir adsorption isotherm is connected with the following kinetic equation:
d σ ( t ) d t = k 1 σ ( t ) σ 0 n ( t ) 1 τ σ ( t ) ,
where n ( t ) indicates the bulk density of particles which, at time t, are located in a layer adjacent to the adsorbing surface; σ ( t ) is the instantaneous surface density of already adsorbed particles, whereas σ 0 denotes the maximum surface density allowed on the particular considered surface. This is a phenomenological equation in which two parameters intervene, whose values are supposed to be inferred from the experimental data: k, the adsorbing coefficient, and τ , a characteristic time, which is a measure of the desorption time [20,21].
In the approximation of a very large number of adsorption sites, the kinetic equation, Equation (1), becomes
d σ d t = k n 1 τ σ .
It was proposed some time ago by Maximus et al. [22], in the context of liquid crystalline materials research, as a way to investigate the role of the ions present in the sample in the optical response of anisotropic materials to an external electric field. The same assumption of σ 0 σ , employed to obtain Equation (2) from Equation (1), is also reasonable here because the porosity of the electrodes is responsible for a very large (effective) adsorbing surface.
Before proceeding, let us consider for a moment the role played by the parameters k and τ . In a previous discussion [23], it was shown that k may depend on the adsorption energy, whereas τ could be connected with the time involved in the diffusion of the particles across an interfacial layer having a thickness comparable to the average range of the forces promoting the desorption. We assume that both k and τ do not depend on the effective density of adsorbed particles, σ ( t ) . A more rigorous analysis of the adsorption when charged particles are involved requires investigating the behavior of the adsorption energy as a function of the density of adsorbed particles, following, for instance, the approaches discussed in other contexts [24,25,26]. In what follows, we will not include the already mentioned internal bias nor the dependence of the surface density of charges on the adsorption energy, because these important effects may be superimposed to the effect of the external bias, focused upon hereafter.
As indicated above, our problem concerns the adsorption of ions dissolved in an insulating, isotropic liquid, for which a kinetic equation, such as Equation (2), holds for positive and negative ions. The liquid medium is considered as locally and globally neutral, but when an external bias is present, the local equilibrium, mainly in the vicinity of the electrodes, is perturbed. This implies a change in the density of potentially adsorbable particles, n ( t ) .
The isotropic liquid is characterized by a constant dielectric coefficient ε and contains two group of ions: p, the positive ones, and m, the negative ones, both having an elementary electric charge, q. Before applying the electric field, in thermodynamic equilibrium, a spatially uniform distribution of the ions across the cell is found, such that n p and n m denote a bulk density of positive and negative ions, respectively. The normalization is such that, in equilibrium, n p = n m = n 0 . In this way, when the electric field is applied to the sample, a non-homogeneous distribution of ions is found, that is, n p n 0 and n m n 0 . In addition, the sample is assumed as a slab of thickness d, filled with the insulating liquid containing ions and limited by two flat electrodes (which is a simplification to model a generic bulk system in which the electrodes are introduced), which allows one to treat the mathematical problem as one-dimensional. The sample is submitted to an external time-dependent periodic difference of potential, V ( t ) = V 0 e i ω t , in which V 0 is the amplitude and f = ω / 2 π is the frequency.
We establish the notation by choosing the Cartesian reference frame such that the x-axis is the one normal to the electrodes, placed at x = d / 2 (hereafter referred as electrode A) and at x = d / 2 (hereafter referred as electrode B). The internal structures eventually found in the electrodes because they are porous are accounted for only in the effective adsorption parameters entering the kinetic equations. These equations work as the boundary conditions to be satisfied by the solutions of the bulk equations when the adsorption is considered. In practice, all physical quantities entering the model to describe the system are actually a kind of average, in a plane parallel to the electrodes, of the real quantities. Since the frequency of the applied external voltage is small, the dielectric constant of the liquid can be considered nondispersive. Practically, this means that the frequency of the applied difference of potential has to be smaller than a few MHz.

Bulk Electric Response

In the cell filled with the liquid containing mobile charges, the current densities are given by
j p = D p n p q n p k B T E ,
j m = D m n m + q n m k B T E ,
because the bulk density of ionic currents are due to drift and diffusion. In Equations (3) and (4), D p is the diffusion coefficient of the positive and D m of negative ions in the particular medium we are considering; the thermal energy is k B T and E is the electric field. When no generation and recombination of ions are taken into account, the equations of continuity,
n p t = · j p ,
n m t = · j m
state the conservation of the number of charged particles in the medium. This presence is, in turn, responsible for a position-dependent electric potential distribution across the sample, which is connected with the density of ions by means of the Poisson equation:
· E = q ε ( n p n m ) .
We indicate by δ n p and δ n m the bulk density variations of the positive and negative ions with respect to n 0 due to the applied difference of potential, respectively. In this framework, n p = n 0 + δ n p and n m = n 0 + δ n m , and we assume, furthermore, that in the frequency range of interest, the amplitude of the applied difference of potential is such that | δ n p | = | n p n 0 | n 0 as well as | δ n m | = | n m n 0 | n 0 , known as linear limit. Thus, Equations (5) and (6), for our one-dimensional problem, can be rewritten as:
δ n p t = D p 2 δ n p x 2 + n 0 q k B T 2 V x 2 ,
δ n m t = D m 2 δ n m x 2 n 0 q k B T 2 V x 2 ,
and the Poisson equation as
2 V x 2 = q ε ( δ n p δ n m ) .
It is convenient to work hereafter with the reduced quantities
u p = δ n p n 0 , u m = δ n m n 0 , and u v = V v t ,
where v t = k B T / q is a reduced voltage, called the thermal voltage, which, at room temperature, is in the order of 0.025 V for univalent ions. This way, Equations (8) and (9) become, respectively,
u p t = D p 2 u p x 2 + 2 u v x 2 ,
u m t = D m 2 u m x 2 2 u v x 2 ,
and
2 u v x 2 = 1 Λ 2 ( u p u m ) ,
where Λ = ε v t / ( n 0 q ) is proportional to the Debye length [19]. Equations (12)–(14) are the fundamental equations of the linear Poisson–Nernst–Planck model, written in terms of reduced quantities, considered by several authors in different contexts [27,28,29,30,31,32,33,34].

3. The Electric Current Density

Once solved, the equations of the Poisson–Nernst–Planck model, built in the preceding section, yield u p ( x , t ) , u m , ( x , t ) , and u v ( x , t ) in terms of six integration constants. Thus, the current densities, as given by Equations (3) and (4), may be rewritten, respectively, as
j p ( x , t ) = n 0 D p u p ( x , t ) x + u v ( x , t ) x
and
j m ( x , t ) = n 0 D m u m ( x , t ) x u v ( x , t ) x ,
together with the displacement current,
j D = ε E t ,
yielding the total electric current density across the sample in the simple form
j ( x , t ) = q [ j p ( x , t ) j m ( x , t ) ] + j D ( x , t ) .
The total current is now written in terms of the unknown integration constants and so is the electrical impedance of the system, as we shall demonstrate now.
To go on further, the method of separation of variables will be employed to search for solutions to the previous equations [35]:
u p , m , v ( x , t ) = { p ( x ) , m ( x ) , v ( x ) } e i ω t ,
which reduces Equations (12)–(14), respectively, to the following ones:
i ω p ( x ) = p ( x ) + v ( x ) , i ω m ( x ) = m ( x ) v ( x ) , v ( x ) = 1 Λ 2 m ( x ) p ( x ) .
The methodology pursued is the one used for ordinary differential equations, in which the solutions have the form of linear combinations of e ± μ + x and e ± μ x , where μ ± will be defined below. After some calculations, the solutions may be written as:
p ( x ) = c 1 sinh ( μ + x ) + c 2 sinh ( μ x ) + + c 3 cosh ( μ + x ) + c 4 cosh ( μ x ) ,
m ( x ) = k 1 c 1 sinh ( μ + x ) k 2 c 2 sinh ( μ x ) + k 1 c 3 cosh ( μ + x ) k 2 c 4 cosh ( μ x ) ,
and
v ( x ) = 1 + k 1 Λ 2 μ + 2 [ c 1 sinh ( μ + x ) + c 3 cosh ( μ + x ) ] 1 + k 2 Λ 2 μ 2 [ c 2 sinh ( μ x ) + c 4 cosh ( μ x ) ] + c v z + c 5 ,
where
k 1 = Λ 2 ( μ + 2 β p 2 ) and k 2 = Λ 2 ( μ 2 β p 2 ) ,
μ ± = 1 Λ ( β p 2 + β m 2 ) Λ 2 ± 4 + ( β p 2 + β m 2 ) 2 Λ 4 2 ,
and
β p 2 = 1 Λ 2 + i ω D p and β m 2 = 1 Λ 2 + i ω D m .
In the case of a symmetric cell, when V ( t ) = V 0 exp ( i ω t ) is the external difference of potential, such that V ( ± d / 2 , t ) = ± ( V 0 / 2 ) exp ( i ω t ) , the property p ( x ) = p ( x ) , and m ( x ) = m ( x ) holds. Here, however, we are considering an asymmetric cell in which the electrodes are different and, hence, impose different boundary conditions on the surfaces. The symmetry of the problem is broken and, in the final solution, the even terms in p ( x ) and m ( x ) are necessary.
The problem will be formally solved when the integration constants c 1 , c 2 , c 3 , c 4 , c 5 , and c v are determined using the boundary conditions satisfied by the current densities of positive and negative ions and by the electric potential at x = ± d / 2 . Using the solutions, the current densities defined in (3) become
j p ( x , t ) = n 0 D p [ p ( x ) + v ( x ) ] exp ( i ω t ) , j m ( x , t ) = n 0 D m [ m ( x ) v ( x ) ] exp ( i ω t ) .
Likewise, the displacement current, Equation (17), may be simply written as
j D ( x , t ) = i ω v t v ( x ) exp ( i ω t ) .
By using Equation (18), the total electric current density across the sample is
j ( x , t ) = n 0 q c v ( D p + D m + i Λ 2 ω ) exp ( i ω t ) .
We notice that it is position independent [36]. This is a necessary requirement to achieve a sound definition for the electrical impedance. In the linear approximation we are using here, that is, when the external electric excitation is a periodic function of time of the type U ( t ) = V ( d / 2 , t ) V ( d / 2 , t ) = V 0 e i ω t with a small amplitude, the impedance of the cell, which is defined as Z = U ( t ) / I ( t ) , with I ( t ) = j S , assumes the simple form:
Z ( ω ) = u 0 n 0 q c v ( D p + D m + i Λ 2 ω ) S ,
where S is the surface area of the electrodes and u 0 = V 0 / v t . A remarkable result is that the final expression for the electric impedance actually depends only on c v , which is the integration constant connected with the linear dependence of v on the x-coordinate, as shown by Equation (23).
To complete the solution of the problem, the integration constants in the solutions (21)–(23) have to be determined using the boundary conditions, as we will discuss now.

4. Boundary Conditions

The boundary conditions will be stated in terms of the values assumed on the interfaces by these currents.

4.1. Blocking Electrodes

The first one refers to the case of completely blocking electrodes, which are
j p x = ± d 2 , t = 0 and j m x = ± d 2 , t = 0 ,
together with the boundary conditions on the electric potential, related to the presence of the external power supply, that we assume to be of the type
V x = ± d 2 , t = ± V 0 2 e i ω t .
Using Equation (27), the boundary conditions may be rewritten as
p ( x = ± d 2 ) + v ( x = ± d 2 ) = 0 , m ( x = ± d 2 ) v ( x = ± d 2 ) = 0 , v ( x = ± d 2 ) = ± u 0 ,
where, in the present case, u 0 = V 0 / 2 v t . In this case, both electrodes behave identically.

4.2. Adsorbing Surfaces

The boundary conditions in the presence of adsorbing surfaces will be expressed in terms of the kinetic equations as follows. At the electrode A (placed at x = d / 2 ) and B (placed at x = d / 2 ), they are:
j α ( A ) x = d 2 , t = d d t δ σ α ( A ) ( t ) j α ( B ) x = d 2 , t = d d t δ σ α ( B ) ( t ) ,
in which
d d t δ σ α ( A ) ( t ) = k α ( A ) δ n α x = d 2 , t 1 τ α ( A ) δ σ α ( A ) ( t ) d d t δ σ α ( B ) ( t ) = k α ( B ) δ n α x = d 2 , t 1 τ α ( B ) δ σ α ( B ) ( t ) ,
where, for compactness, we have introduced the subscript α = p (for the positive ions) and α = m (for the negative ones). We thus have four boundary conditions to which we have to add a supplementary condition on the electric potential, that is
u v ( A ) x = d 2 , t = V x = d 2 , t v t = u 0 ( A ) ( t ) u v ( B ) x = d 2 , t = V x = d 2 , t v t = u 0 ( B ) ( t ) ,
At this point, the connection between the bulk behavior of the currents, that is, the dynamics of the mobile charges in the liquid medium and the surface dynamics, which is indeed the dynamics at the electrodes, is formally complete. All the integration constants can be determined using the boundary conditions in Equations (34) and (36).
In this approach, the surface dynamics are represented by a kinetic equation in the Langmuir approximation, which, as discussed before, contains the phenomenological parameters k and τ . To keep our analysis in this framework, we have to take into account other effects influencing the effective values of these parameters, which are the only ones in this approach. We shall now propose a way to incorporate a bias voltage dependence into their effective values by invoking arguments based on the classical Boltzmann statistics.

4.3. Adsorption in the Presence of the Bias

For simplicity, we analyze what happens on the electrode placed at x = d / 2 (electrode B) and suppress hereafter, without loss of generality, the index B. We recall that we are working in the approximation of small amplitude for the external voltage, that is, | δ n p | n 0 as well as | δ n m | n 0 . Before proceeding, an important remark is in order here. This approximation means that the bulk dynamics are such that the medium behaves like a linear one. This does not imply that the surface dynamics are linear too. Indeed, the physical problem may be seen as formed by two media in contact: a linear, bulk, medium in contact with the surface, that is, the electrodes, having independent dynamics. The set of boundary conditions stated in Section 4 puts these two media in contact and helps in building a whole electrical response of the sample to the external field, using the impedance spectroscopy technique.
In the linear approximation mentioned above, Equation (2) for the positive ions, relative to the electrode at x = d / 2 , under the potential V ( d / 2 , t ) imposed by the external power supply, is
d δ σ p d t = k p δ n p 1 τ p δ σ p ,
in which δ σ p and δ n p are the surface variations of the density of adsorbed ions and bulk density of positive ions due to the presence of the bias, respectively. The general solution of Equation (37), such that δ σ p ( 0 ) = 0 , is
δ σ p ( t ) = k p e t / τ p 0 t e t / τ p δ n p ( t ) d t .
In the dc case, the bias is a step function. This way, δ n p = δ n p 0 does not depend on time, and from Equation (38), we obtain
δ σ p ( t ) = k p τ p δ n p 0 1 e t / τ p .
From (39), it follows that for t , δ σ p k p τ p δ n p 0 . Furthermore
d δ σ p d t = k p δ n p 0 e t / τ p .
For the negative ions, the situation is similar, that is,
d δ σ m d t = k m δ n m 0 e t / τ m .
When a dc bias is present, δ n p 0 , close to the adsorbing electrodes, is determined by
δ n p 0 = n p ( d / 2 ) n 0 = n 0 e b u 1 ,
where u is connected with the bias, namely,
u = 1 2 v t V ( d / 2 ) ,
and b is a parameter related to a screening effect [17]. For the negative ions, an analysis of the same kind gives
δ n m 0 = n m ( d / 2 ) n 0 = n 0 e b u 1 .
The approach is very similar when the the electrode at x = d / 2 , at the electric potential V ( d / 2 ) , is considered. It follows that, in the dc regime, the electric current density is
j = q d δ σ p d t d δ σ m d t = q k p δ n p 0 e t / τ p k m δ n m 0 e t / τ m ,
where δ n p 0 and δ n m 0 are given by Equations (42) and (44). Equation (45) describes the charge accumulation on the adsorbing electrode and has the following final form:
j = n 0 q k p e t / τ p e b u 1 k m e t / τ m e b u 1 .
When the electrode polarization is small, from Equation (46), we get
j = n 0 q b k p e t / τ p + k m e t / τ m u ,
that is, the electric current density is proportional to u.
When V ( d / 2 , t ) is an arbitrary function of t, and then u ( t ) = ( 1 / 2 v t ) V ( d / 2 , t ) , by invoking Equation (38) for δ σ p and the corresponding one for δ σ m , and taking into account that
δ n p ( t ) = n 0 e b u ( t ) 1 , δ n m ( t ) = n 0 e b u ( t ) 1 ,
we obtain
j = n 0 q k p e b u ( t ) 1 k m e b u ( t ) 1 0 t H ( t , t ) d t ,
which expresses the total current density by means of the kernel H , defined as
H ( t , t ) = 1 τ p e ( t t ) / τ p e b u ( t ) 1 1 τ m e ( t t ) / τ m e b u ( t ) 1 .
We underline that this kernel depends on the surface properties, because it is expressed in terms of the relaxation times τ p and τ m , and the screening parameter, b. Furthermore, Equation (48) connects the surface current with the electrode polarization; it represents an equation to determine the current for adsorbing electrodes, and is an immediate consequence of the kinetic theory we are proposing for a capacitive process occurring at the electrode–solution interfacial layer.

5. Voltammetry from a Drift–Diffusion Model

The current–voltage characteristics analyzed here deal with a cell under a periodic potential, of period T, expressed as
V ( t ) = k = V k e i k ω 0 t ,
where ω 0 = 2 π / T and
V k = 4 i V 0 ( 1 ) k ( π k ) 2 sin k π 2 ,
which represents an alternate triangular difference of potential.
In our analysis, the voltammetry is carried out by solving the fundamental equations of the PNP model presented before. This is not the usual procedure and represents a more sophisticated strategy. We adopt it here because it permits us to investigate the surface effects on the experimental results, by exploring, for instance, just the I ( V ) curves.
The whole approach is based on the linear approximation. In this framework, the current is connected with the impedance spectroscopy measurements by means of the expression:
I ( t ) = k = I k e i k ω 0 t ,
with
I k = V k Z k ,
in which, for Z k , the expression (30) holds and may be rewritten as Z ( k ω 0 ) . Thus, the I ( V ) curves for the cases relevant to the boundary conditions discussed before may be built by using Equations (50) and (52), and are experimentally accessible quantities. The area limited by this kind of curve is typically related to the power dissipated per cycle in the cell [37,38,39,40,41,42,43]. It is possible to show that it may be obtained as [44]
A = 1 2 t 0 t 0 + T I ( t ) d V ( t ) d t V ( t ) d I ( t ) d t d t .
If Equations (50) and (52) are used, remembering that the functions in the set { e i ω k t } are orthogonal in t 0 t t 0 + T , the area becomes:
A = 2 π i k = 1 k V k I k = 2 π i k = 1 k V k V k / Z k .
Thus, once the electrical impedance is evaluated, the power dissipated per cycle in the cell can be also obtained directly from the experimental data.

5.1. Polarized Cell

The analysis presented above refers to the current–voltage characteristics in which the cell is submitted to an alternate electric excitation V ( t ) , where the time average of the applied difference of potential vanishes. However, for experimental purposes, it is helpful to consider V ( t ) as a periodic function of time, whose average, on one period, is not zero. In the case where
V ( t ) = 2 ( V 0 / T ) t for   0 t T / 2 2 V 0 ( 1 t / T ) for   T / 2 t T ,
the average value on one period is indeed not zero, i.e., the cell is polarized. Since V ( t ) is a periodic function, it can be expressed in terms of a Fourier series, namely:
V ( t ) = V 0 2 + k = V k e i k ω 0 t ,
where
V k = 1 ( 1 ) k ( k π ) 2 V 0 ,
and, as before, ω 0 = 2 π / T . In this case, as discussed above, it is possible to evaluate the impedance of the cell, and to analyze the current–voltage characteristics in the framework of our model for the adsorption. In the following section, we analyze the I = I ( V ) curve for an excitation of the kind (57), to investigate the different role of the phenomenological parameters entering the model. We consider first the case of a symmetric cell, in which the limiting electrodes are identical, although their properties with respect to the positive and negative ions can be different. This way, the importance of the adsorbing coefficients and of the desorption time can be discussed in a simple situation. The case in which the electrodes have different physical properties, very important for technological applications, allows us to investigate the effect of the asymmetry on the performance of the cell and, in particular, of the screening parameter.

5.2. The Current–Voltage Characteristics

To build the I ( V ) curves, we start from the values of the effective adsorption parameters obtained from the analysis of the experimental data reported in Ref. [17]. When an external positive triangular potential of amplitude V 0 is applied on the electrodes, for any given values of period T and the total current I ( t ) , Equation (52), written for the polarized cell, depends on the set of parameters k p ( A ) , k p ( B ) , k m ( A ) , k m ( B ) , and τ p ( A ) , τ p ( B ) , τ m ( A ) , τ m ( B ) , where the A and B stand for the electrodes placed at d / 2 (grounded) and at + d / 2 , as well as the values of the screening parameters b ( A ) and b ( B ) . In the following section, we limit our numerical analysis to the case in which the two limiting surfaces have the same adsorbing properties with respect to the positive and negative ions, and hence k p A = k m A , k p B = k m B , as well as τ p A = τ m A , τ p B = τ m B . Special attention is devoted to the influence of the screening parameter b on the I = I ( V ) curve.
The electric response of an electrolytic cell having the same adsorption parameters k for the positive and negative ions changes substantially when the desorption time τ increases. Analyzing the adsorption equation in the Langmuir approximation (Equation (35)) for very small values of τ , the desorption term increases, and the conduction contribution to the electric current decreases. Hence, the electrodes show blocking behavior and the voltammetry plot presents a capacitive form. For large values of τ , the desorption term decreases, the conduction current increases, and the electrode shows Ohmic behavior. From the electrical point of view, the cell is well described by a circuit made by a resistance R s , taking into account the presence of the metallic layer deposited on the limiting surfaces, and by a series of two parallels formed by a resistance, R, and a capacitance, C, and R b and C b charged to describe the interface electrolyte–electrode and the bulk of the cell, respectively. The bulk capacitance C b = ε S / d , in the frequency range explored by us, is equivalent to an open circuit, and does not contribute to the current in the external circuit. The bulk resistance R b , for the ionic concentration considered in our simulation, is rather small. Consequently, the parallel R b C b is reduced to a small resistance. This electric circuit formed by lumped elements and, in the following section, will be indicated as R s R C . According to this equivalent circuit, the resistance of the bulk is included in R s . The capacitance of the interface is usually very large, since the surface layer is of a few nanometers, and smaller than Λ [44].
To extend the analysis published in Ref. [17], a set of simulations of the parametric curves I = I ( V ) for an electrolyte submitted to a triangular positive potential of the type represented by Equation (37), with anode in B, is reported. It is relevant to different values of the phenomenological parameters k and τ , and for the screening parameter b. For all the simulations, the values T = 80 s, V 0 = 0.2 V, ε = 80 × ε 0 , S = 1.21 × 10 4 m 2 , d = 5.5 × 10 3 m, D p = 1.61 × 10 9 m 2 /s, D m = 1.28 × 10 9 m 2 /s, n 0 = 6.06 × 10 26 m 3 are fixed. These values correspond to an aqueous solution of NaCl at a concentration of 1 M.
We did simulations over a large range of parameters. In the following section, we present the results obtained in a narrower range for clarity. The observed trend, shown in the figures reported below, is, however, valid in general.
Let us consider first the situation in which, in the kinetic equation at the interface, Equation (2), the desorption contribution is negligible when compared with the adsorption contribution. This limit is recovered when τ . In this case, the adsorbed particles remain on the electrode. We limit the analysis to a symmetric cell with electrodes having the same adsorption properties for positive and negative ions. In Figure 1 are shown the I = I / ( V ) curves for τ , with k = 10 6 m/s, k = 2 × 10 6 m/s, and k = 3 × 10 6 m/s. In these cases, the parametric curves I = I ( V ) are of the Ohmic type. From this curve, it follows that the electric resistance of the interface is proportional to 1 / k , and the interface capacitance is negligible. This result is valid in general, and hence R 1 / k .
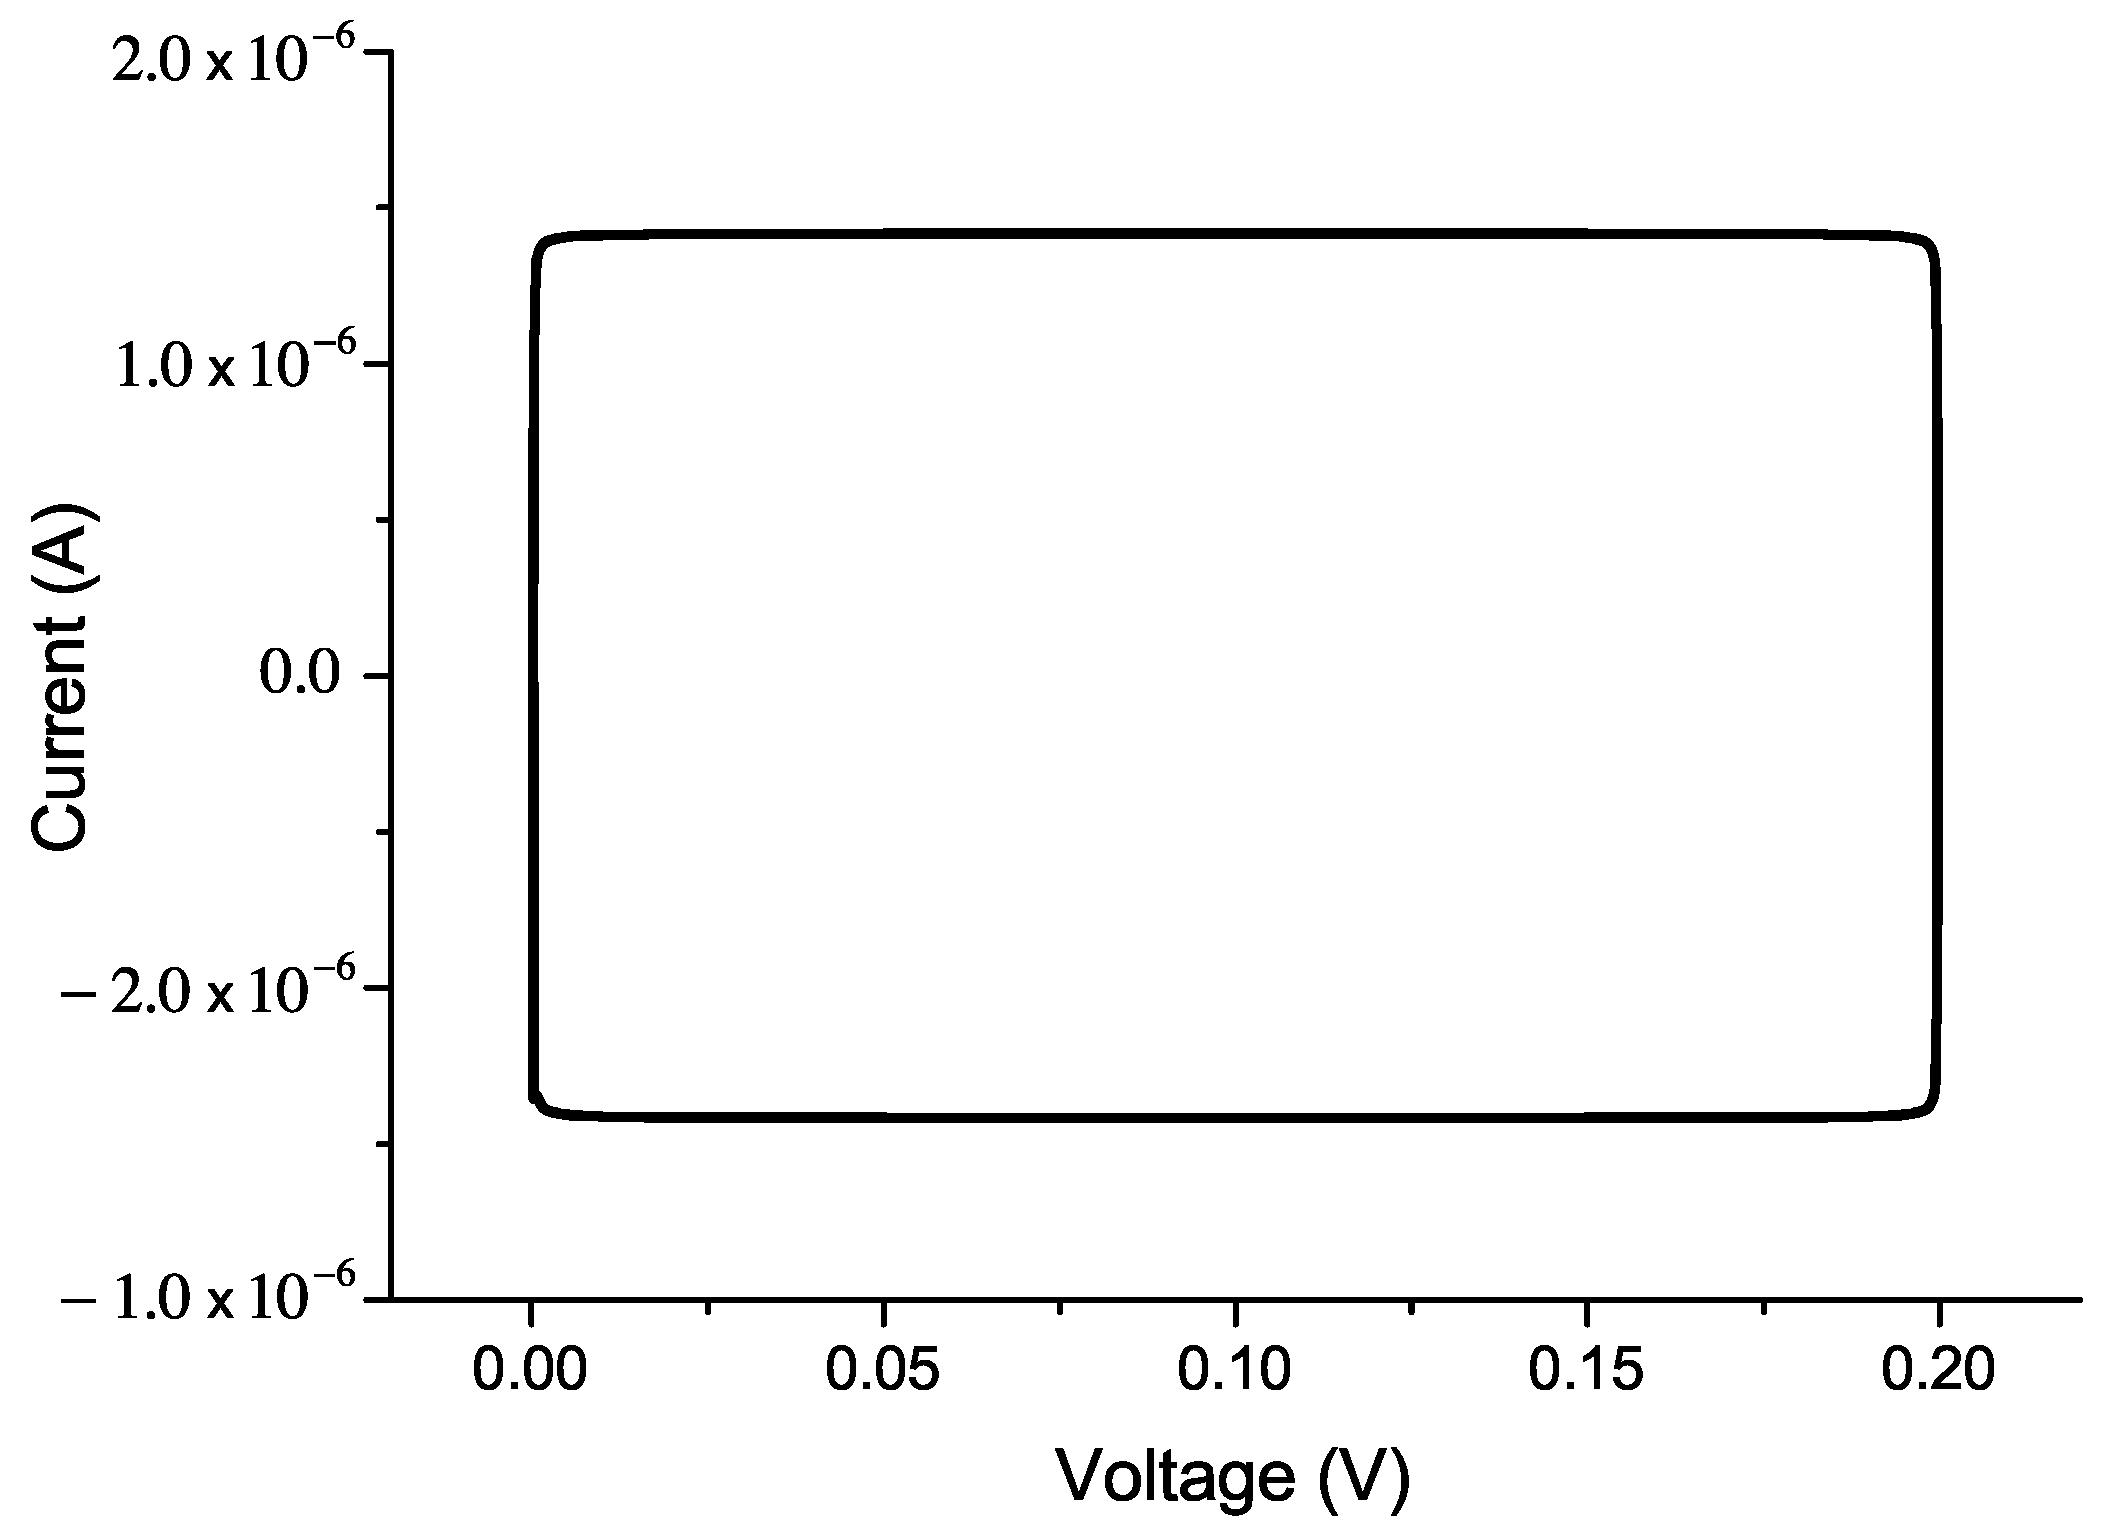
The symmetric case is also of interest, in which the adsorption contribution is negligible when compared with the desorption contribution. In this case, for finite τ , k 0 . In Figure 2, the I = I ( V ) curve is shown for a symmetric sample of the type considered in Figure 1, assuming k = 0 and τ = 1 s. In this framework, the characteristic I = I ( V ) corresponds to that of an ideal condenser, in agreement with the conclusion that R 1 / k , reported above. A simple analysis allows us to show that the capacitance of the interface is C = 2 2 ε S / Λ . In fact, as discussed elsewhere [45], in the dc limit, the electrolytic cell behaves as a real condenser of total capacitance C t = 2 ε S / Λ . Since there are two interfaces in series, the capacitance of the interface is C = 2 C t . Hence, the displacement current is I = C ( 2 V 0 / T ) , in agreement with the numerical result of Figure 2. As expected, in this limit, the I = I ( V ) characteristic is independent of the desorption time.
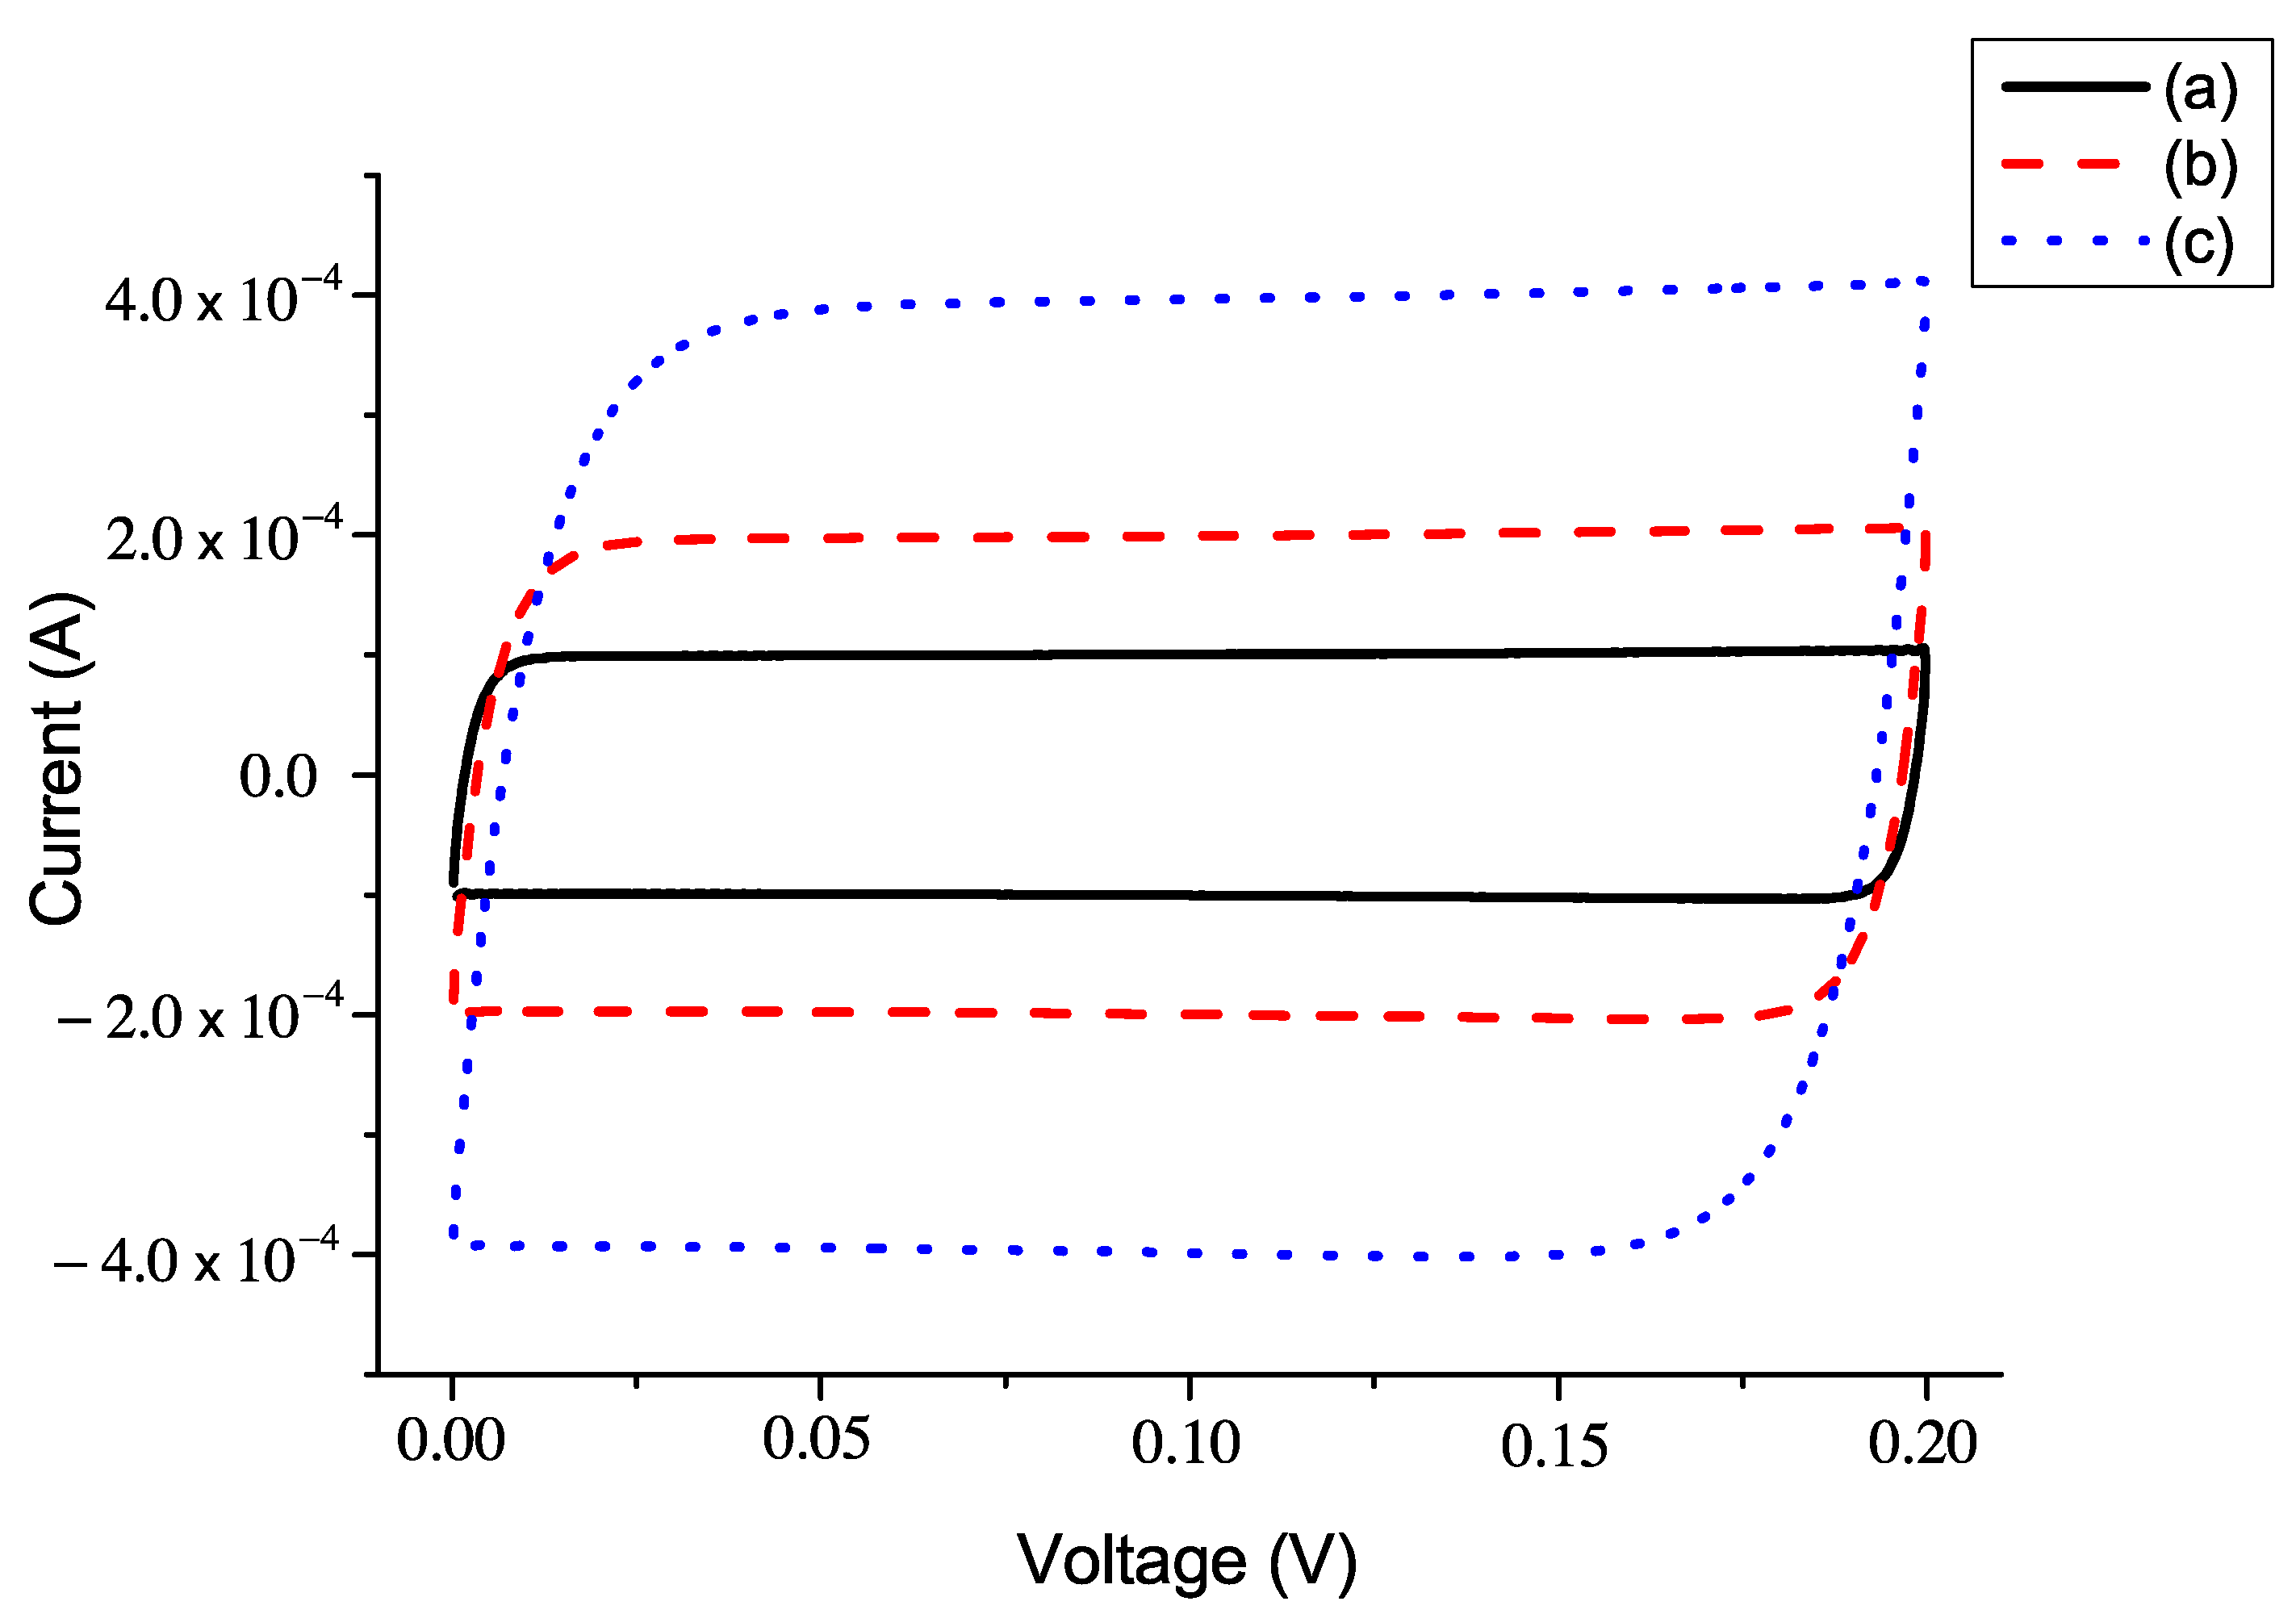
Figure 3 shows the parametric curves I ( V ) for an electrolytic cell with identical electrodes, with the same adsorption properties characterizing positive and negative ions, submitted to a triangular positive potential with anode in point B, with screening parameter b = 0.04 . The adsorption coefficients are 10 6 m/s. From this figure, it follows that, for τ = 0.5 s and τ = 1 s, the shape of the plot is capacitive, whereas for τ = 2 s, the behavior of the cell changes in a significant manner. In this case, increasing the desorption time τ , the maximum value of the current increases. This result, using the equivalent circuit R s R C , can be easily understood. In fact, increasing the desorption time decreases the desorption contribution in the interfacial kinetic equation. More ions are accumulated just in front of the electrode. Hence, it increases the surface capacitance, responsible for a current contribution given by C d V / d t = ( V 0 / T ) C .
In Figure 4, for a fixed value of the desorption time, τ = 1 s, and the screening parameter b = 0.04 , the dependence of the voltammetric curves on the adsorption parameter is shown, for an adsorption coefficient ranging from 5 × 10 7 m/s to 2 × 10 6 m/s. The curves present a pronounced capacitive shape only for very small values of k, the adsorption within the electrodes being small, and the capacitive effect is due to the dielectric constant of the electrolyte. For large values of k, a larger amount of ions is stuck into the electrodes, increasing the effective dielectric constant so that the displacement current becomes larger. As in the previous case, shown in Figure 3, when increasing the adsorption coefficient, the adsorption phenomenon increases in the kinetic equation, and again the capacitance increases, and with it, so does the maximum current.
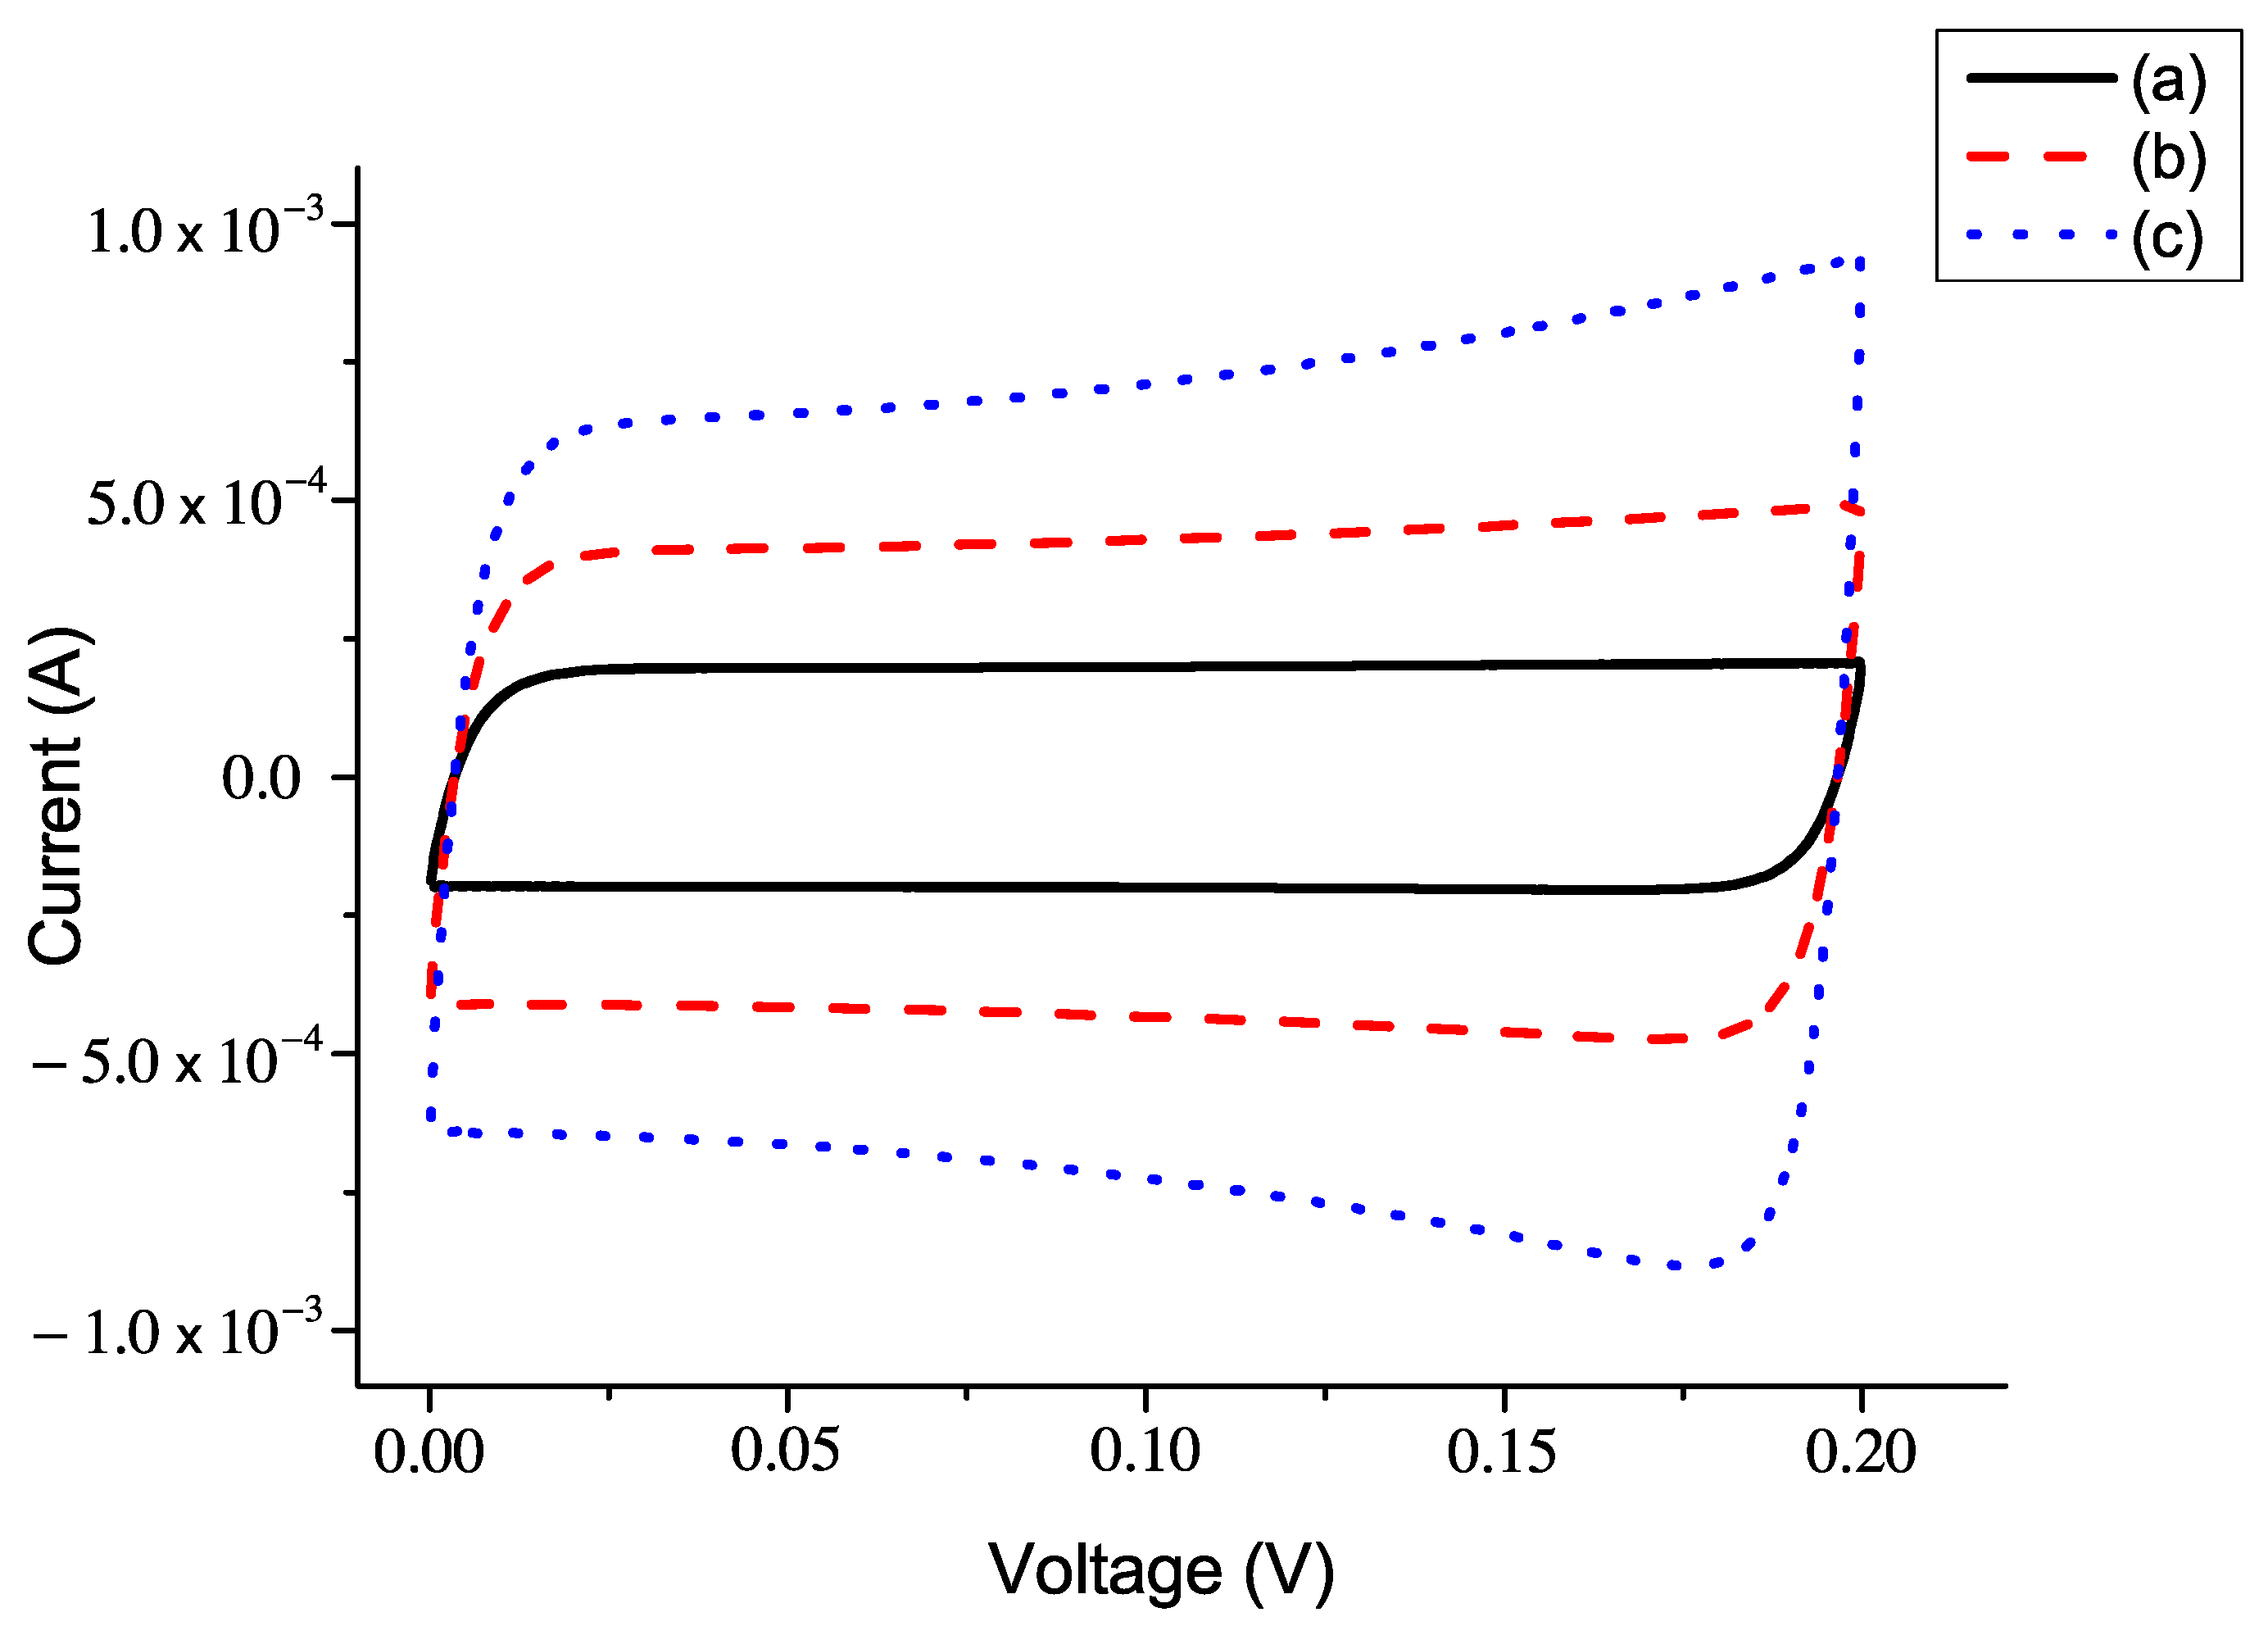
In Figure 5, the influence of the screening coefficient b on the I = I ( V ) parametric curve, in the case of a symmetric cell, is shown. Increasing b the I = I ( V ) curve shows an increase in the current close to the maximum voltage, related to the Boltzmann factor exp ( b u 0 ) responsible for the accumulation of ions in front of the electrodes. The presence of this term increases the effective adsorption coefficient. Only for small b can the parametric curve be described by the circuit R s R C formed by constant elements. This is because the elements R and C, taking into account the electrode–bulk interface, depend on the difference of potential between them. As expected, in a polarized cell, the maximum effect of the parameter b is localized close to maximum value of the applied difference of potential.
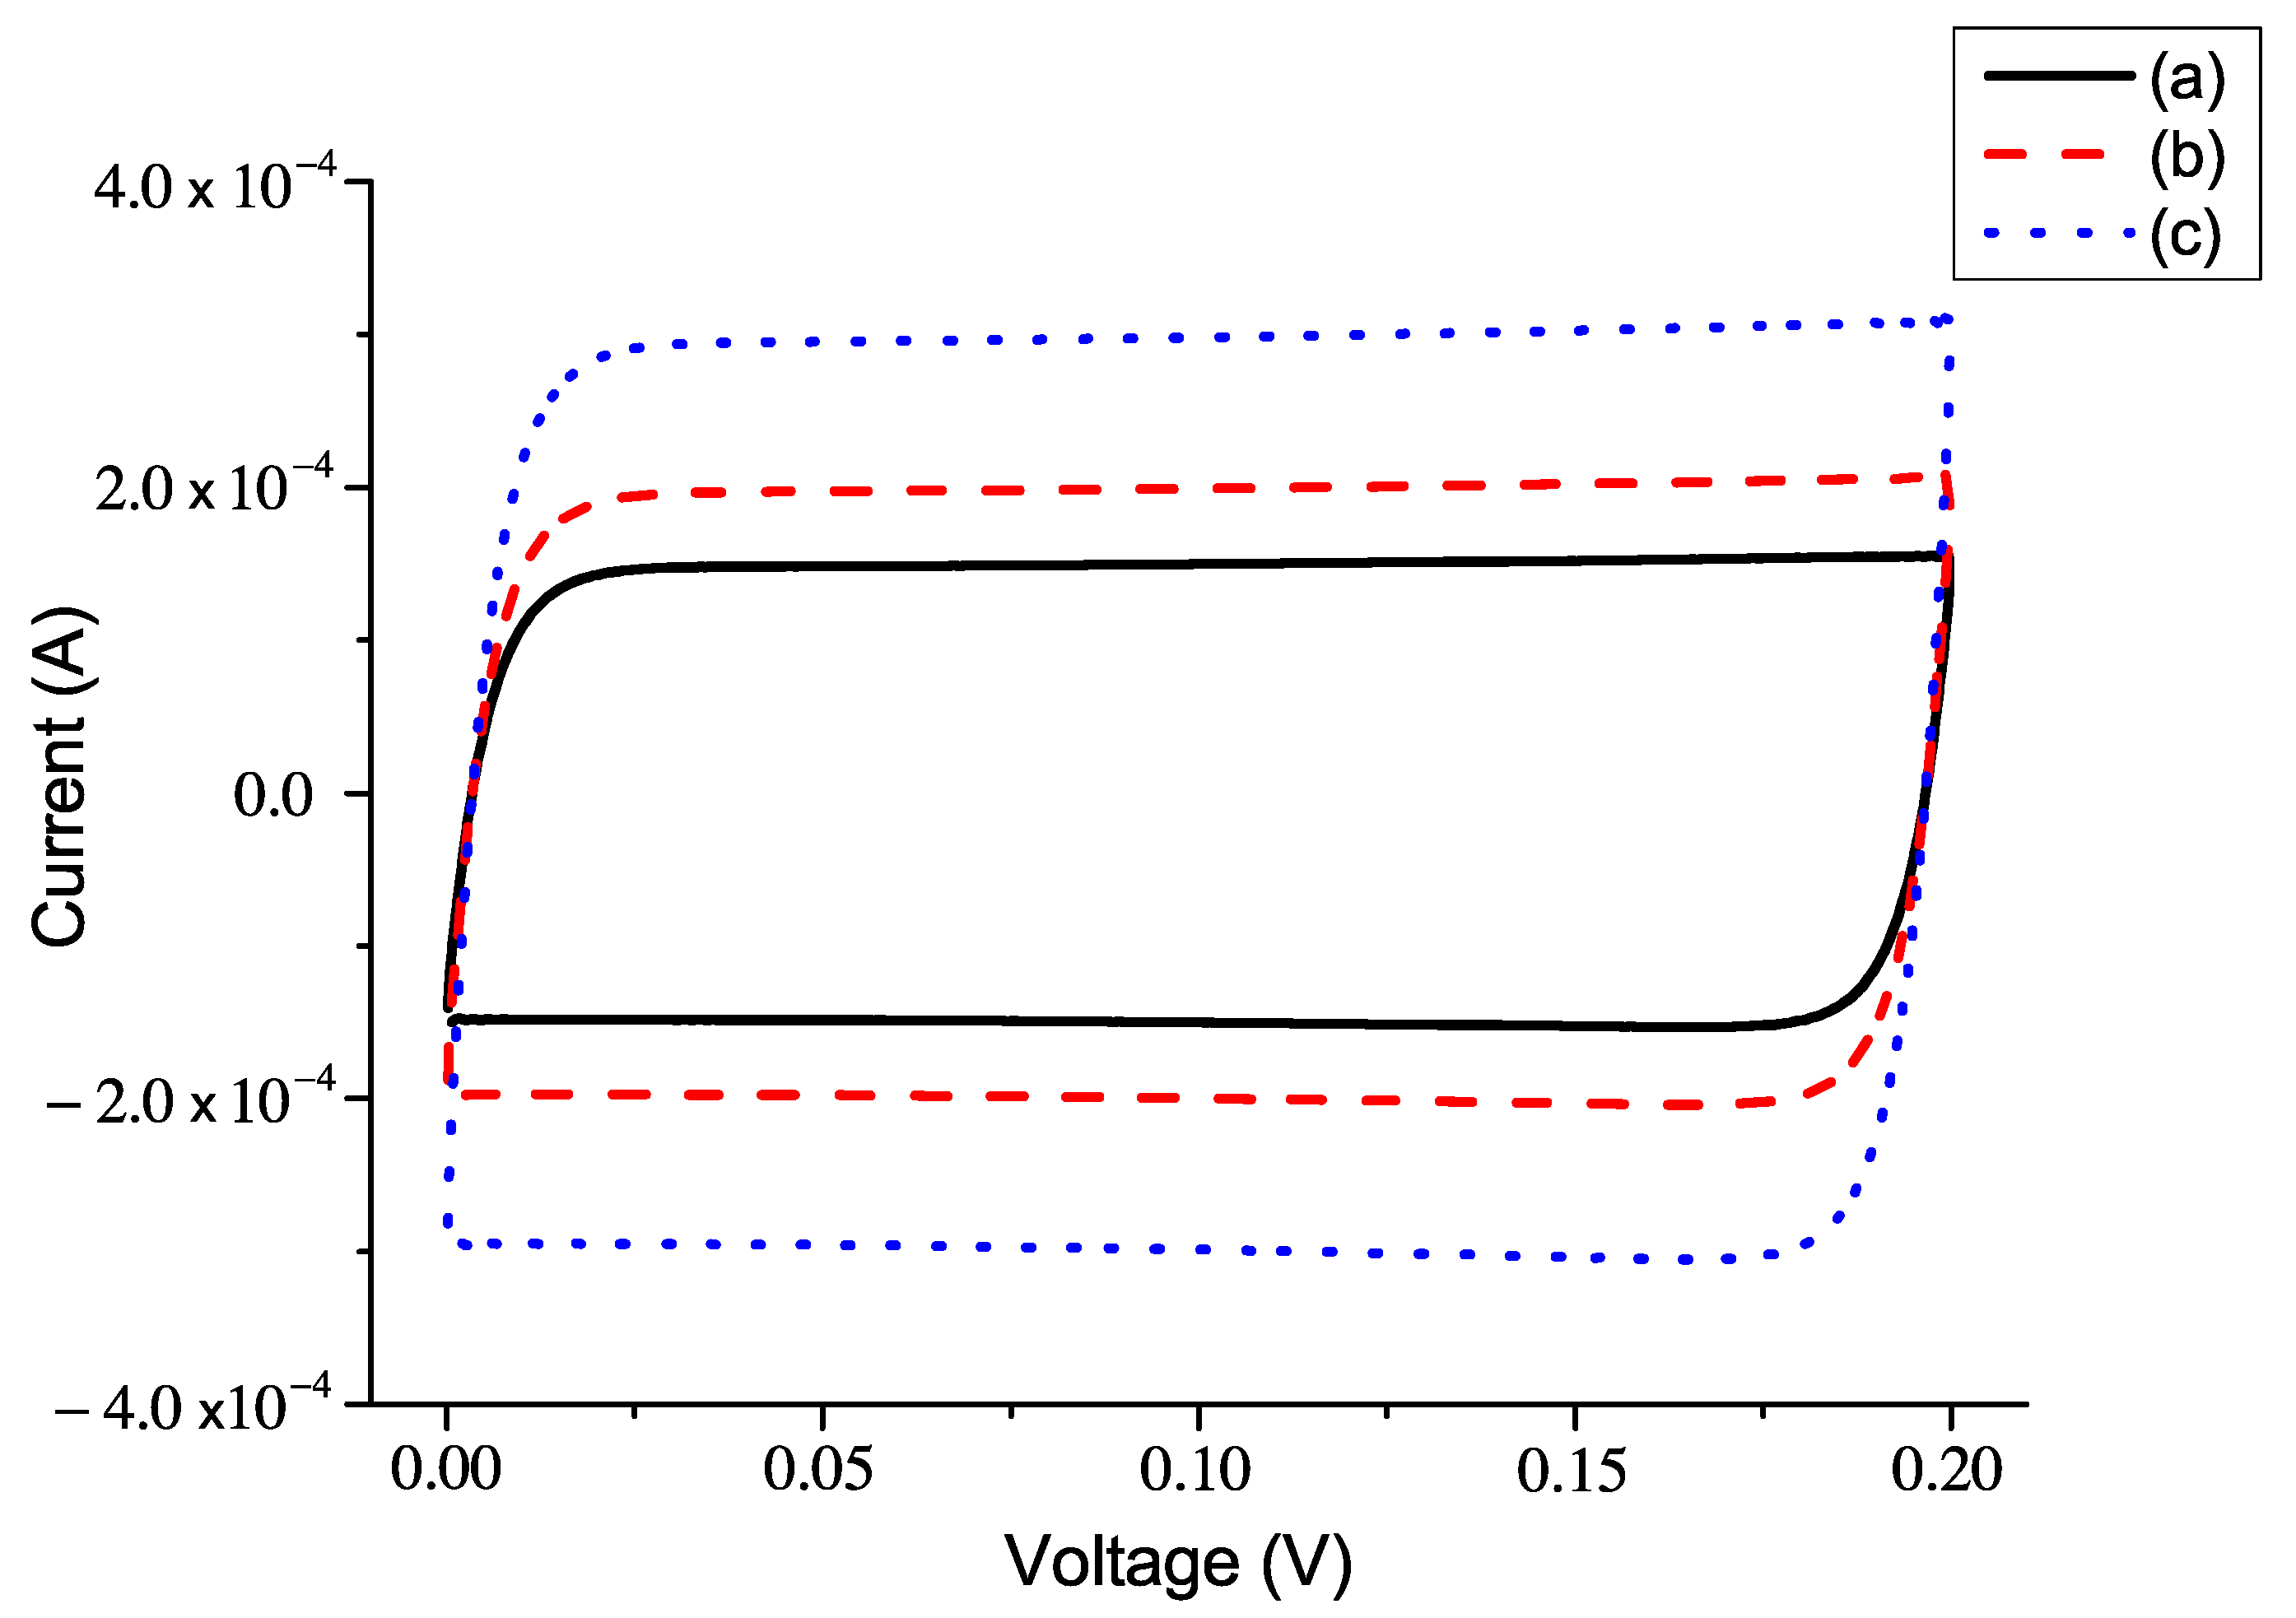
In Figure 6, the effect of different adsorption coefficients at the two surfaces on the I = I ( V ) is considered. The case in which the two electrodes have the same adsorption properties for positive and negative ions is analyzed. The desorption times and screening parameters are assumed to be identical for the two adsorbing surfaces, and equal to 1 s and to 0.04 s, respectively. The adsorption coefficients on the B electrode are equal to 10 6 m/s. On the electrode A, they are equal to 5 × 10 7 m/s, (a), 10 6 m/s, (b), and 2 × 10 6 m/s, (c). As in Figure 4, when increasing the adsorption coefficient on one electrode, the current increases. These results can be easily understood when taking into account that the surface capacitance is increasing with the adsorption coefficient, as follows from Figure 4. Since the total capacitance of the system is the series of the two surface capacitances, it increases when the capacitance of one of the interfaces increases and, with it, the maximum current in the cell. A similar influence is observed when the two electrodes have the same adsorption coefficient and different desorption times. We underline that, for a small screening coefficient, such as that considered in Figure 6, the parametric curves remain symmetric with respect to the point ( 0 , 0 ) . This result is related to the circumstance that when changing the adsorbing parameters of a surface, the interface capacitance and resistance change, but the current is sensitive only to the total resistance and capacitance of the cell. Increasing the screening parameter, as shown in Figure 5, the I = I ( V ) curves become asymmetric, but the effect is not related to the difference in the adsorption coefficients, nor in the desorption times, but to the screening parameter.

6. Concluding Remarks

A generalization of the Langmuir model for ionic adsorption in the presence of an electric bias is proposed. Assuming that the effective adsorption energy depends on the surface potential according to the Boltzmann statistics, it is possible to deduce the dependence of the effective adsorption coefficients on the bias. In the proposed model, the surface drop of potential is related to a screening parameter, b, defined in terms of the dielectric properties of the electrode and of the bulk, in addition to the thickness of the porous electrode over which the adsorption phenomena take place. In the model, the adsorption characteristics of the electrodes are the adsorption coefficient and the desorption time. They are related to the electric current across the electrode and to the diffusion time of the ions through the porous electrode. In order to analyze the importance of the different phenomenological parameters entering the model on the the whole electric response of the cell to an external excitation, we have evaluated the cyclic voltammetry of a standard cell for different values of the adsorption coefficients, k, desorption time, τ , and screening parameter b, in the presence of an external positive triangular potential of amplitude V 0 and period T. The analysis revealed that for symmetric cells, the I ( V ) curves present a pronounced capacitive behavior only for very small values of k. In the limit of small desorption, the behavior of the cell is resistive, with electric resistance of the interface proportional to the inverse of the adsorption coefficient. In the opposite limit of small adsorption, the behavior of the cell is of the capacitive type, with an interface capacitance of the order of the double layer of thickness of the order of Debye. The effect of the screening parameter results in an asymmetry of the I = I ( V ) curve near to the maximum value of the applied difference of potential. For small screening parameters, the I = I ( V ) curve remains symmetric with respect to the center of the I = I ( V ) loop even in the case of a large difference between the adsorption parameters, since it depends only on the total resistance and capacitance.

Author Contributions

L.R.E.: Writing—Original draft preparation, Conceptualization, Methodology. G.B.: Conceptualization, Methodology, Writing—Original draft preparation. A.L.A.-I.: Conceptualization, Methodology, Software, Writing—Review and Editing. All authors have read and agreed to the published version of the manuscript.

Funding

This work was partially supported by the MEPhI Academic Excellence Project (G.B.) and by the Program of Visiting Professors of Politecnico di Torino (A.L.A.-I. and L.R.E.).

Conflicts of Interest

The authors declare no conflict of interest.

References

  1. Lyklema, J. Fundamentals of Interface and Colloid Science; Academic Press: London, UK, 1993. [Google Scholar]
  2. Crini, G.; Lichtfouse, E.; Wilson, L.D.; Crini, N.N. Adsorption-oriented process using conventional and non-conventional adsorbents for wastewater treatment. In Green Adsorbents for Pollutant Removal, Envinronmental Chemistry for a Sustainable Word 18; Crini, G., Lichtfouse, E., Eds.; Springer: New York, NY, USA, 2018; pp. 23–71. [Google Scholar]
  3. Li, J.R.; Kuppler, R.J.; Zhou, H.C. Selective gas adsorption and separation in metal-organic frameworks. Chem. Soc. Rev. 2009, 38, 1477–1504. [Google Scholar] [CrossRef]
  4. Undin, T.; Lind, S.B.; Dahlin, A.P. MS for investigation of time-dependent protein adsorption on surfaces in complex biological samples. Future Sci. OA 2015, 1, FS032. [Google Scholar] [CrossRef] [Green Version]
  5. Brogioli, D. Extracting Renewable Energy from a Salinity Difference Using a Capacitor. Phys. Rev. Lett. 2009, 103, 058501. [Google Scholar] [CrossRef]
  6. Rica, R.A.; Brogioli, D.; Ziano, R.; Salerno, D.; Mantegazza, F. Ions Transport and Adsorption Mechanisms in Porous Electrodes During Capacitive–Mixing Double Layer Expansion (CDLE). J. Phys. Chem. C 2012, 116, 16934–16938. [Google Scholar] [CrossRef] [PubMed]
  7. Brogioli, D.; Ziano, R.; Rica, R.A.; Salerno, D.; Mantegazza, F. Capacitive mixing for the extraction of energy from salinity differences: Survey of experimental results and electrochemical models. J. Colloid Interface Sci. 2013, 407, 457–466. [Google Scholar] [CrossRef] [PubMed]
  8. Alexe-Ionescu, A.L.; Barbero, G.; Evangelista, L.R.; Lenzi, E.K. Current-Voltage Characteristics and Impedance Spectroscopy: Surface Conduction and Adsorption-Desorption Effects in Electrolytic Cells. J. Phys. Chem. C 2020, 124, 3150–3158. [Google Scholar] [CrossRef]
  9. Barbero, G.; Evangelista, L.R.; Olivero, D. Asymmetric ionic adsorption and cell polarization in liquid crystals. J. Appl. Phys. 2000, 87, 2646–2648. [Google Scholar] [CrossRef]
  10. Trefalt, G.; Beherns, S.H.; Borkovec, M. Charge Regulation in Electrical Double layer: Ion Adsorption and Surface Interactions. Langmuir 2016, 32, 380–400. [Google Scholar] [CrossRef]
  11. Biesheuvel, P.M.; Van Limpt, B.; van der Wal, A. Dynamic Adsorption/Desorption Process Model for Capacitive Deionization. J. Phys. Chem. C 2009, 113, 5636–5640. [Google Scholar] [CrossRef]
  12. Carrique, F.; Arroyo, F.J.; Delgado, A.V. Electrokinetics of Concentrated Suspensions of Spherical Colloidal Particles with Surface Conductance, Arbitrary Zeta Potential, and Double-Layer Thickness in Static Electric Fields. J. Colloid Interface Sci. 2002, 252, 126–137. [Google Scholar] [CrossRef] [PubMed] [Green Version]
  13. Carrique, F.; Arroyo, F.J.; Jiménez, M.L.; Delgado, A.V. Dielectric response of concentrated colloidal suspensions. J. Chem. Phys. 2003, 118, 1945–1955. [Google Scholar] [CrossRef] [Green Version]
  14. Boon, N.; van Roij, R. ‘Blue energy’ from ion adsorption and electrode charging in sea and river water. Mol. Phys. 2011, 109, 1229–1241. [Google Scholar] [CrossRef] [Green Version]
  15. Biesheuvel, P.M.; Bazant, M.Z. Nonlinear dynamics of capacitive charging and desalination by porous electrodes. Phys. Rev. E 2010, 81, 031502. [Google Scholar] [CrossRef] [PubMed] [Green Version]
  16. Biesheuvel, P.M.; Yeqing, F.; Bazant, M.Z. Diffuse charge and Faradaic reactions in porous electrodes. Phys. Rev. E 2011, 83, 061507. [Google Scholar] [CrossRef] [Green Version]
  17. Alexe-Ionescu, A.L.; Barbero, G.; Evangelista, L.R.; Lamberti, A.; Pedico, A.; Pirri, C.F. Langmuir adsorption processes and ion transport under bias potential in capacitive deionisation cells. Electrochim. Acta 2020, 348, 136288. [Google Scholar] [CrossRef]
  18. Suss, M.E.; Porada, S.; Sun, X.; Biesheuvel, P.M.; Yoon, J.; Presser, V.V. Water desalination via capacitive deionization: What is it and what can we expect from it? Energy Environ. Sci. 2015, 8, 2296–2319. [Google Scholar] [CrossRef] [Green Version]
  19. Atkins, P.W. Physical Chemistry, 5th ed.; Oxford University Press: Oxford, UK, 1994. [Google Scholar]
  20. Barbero, G.; Evangelista, L.R. Adsorption Phenomena and Anchoring Energy in Nematic Liquid Crystals; Taylor & Francis: London, UK, 2006. [Google Scholar]
  21. Mossad, M.; Zou, I. Evaluation of the salt removal efficiency of capacitive deionisation: Kinetics, isothems and thermodynamics. Chem. Eng. 2013, 223, 704–713. [Google Scholar] [CrossRef]
  22. Maximus, B.; De Ley, E.; De Meyere, A.; Pauwels, H. Ion Transport in SSFLCD’s. Ferroelectrics 1991, 121, 103–112. [Google Scholar] [CrossRef]
  23. Evangelista, L.R.; Barbero, G. Statistical interpretation of the kinetic equation in the adsorption problem. Eur. Phys. J. E 2004, 15, 3–8. [Google Scholar] [CrossRef]
  24. Wolkenstein, T. Electronic Processes on Semiconductor Surfaces During Chemisorption; Consultants Bureau: New York, NY, USA, 1991. [Google Scholar]
  25. Rothschild, A.; Komen, Y.J.; Ashkenasy, N. Quantitative evaluation of chemisorption processes on semiconductors. J. Appl. Phys. 2002, 92, 7090–7097. [Google Scholar] [CrossRef]
  26. Barbero, G.; Evangelista, L.R.; Lelidis, I. Effective adsorption energy and generalization of the Frumkin-Fowler-Guggenheim isotherm. J. Mol. Liq. 2021, 327, 114795. [Google Scholar] [CrossRef]
  27. Macdonald, J.R. Theory of ac Space-Charge Polarization Effects in Photoconductors, Semiconductors, and Electrolytes. Phys. Rev. 1953, 92, 4–17. [Google Scholar] [CrossRef]
  28. Bazant, M.Z.; Chu, K.T.; Bayly, B.J. Current-Voltage relations for electrochemical thin films. SIAM J. Appl. Math. 2005, 65, 1463–1484. [Google Scholar] [CrossRef] [Green Version]
  29. Bisquert, J.; Bertoluzzi, L.; Mora-sero, I.; Garcia-Belmonte, G. Theory of Impedance and Capacitance Spectroscopy of Solar Cells with Dielectric Relaxation, Drift-Diffusion Transport, and Recombination. J. Phys. Chem. C 2014, 118, 18983–18991. [Google Scholar] [CrossRef]
  30. Sangoro, J.R.; Serghei, A.; Naumov, S.; Galvosas, P.; Kaerger, J.; Wespe, C.; Bordusa, F.; Kremer, F. Charge transport and mass transport in imidazolium-based ionic liquid. Phys. Rev. E 2008, 77, 051202. [Google Scholar] [CrossRef]
  31. Serghei, A.; Tress, M.; Sangoro, J.R.; Kremer, F. Electrode polarization and charge transport at solid interface. Phys. Rev. B 2009, 80, 184301. [Google Scholar] [CrossRef]
  32. Wang, Y.Y.; Agapov, A.I.; Fan, F.; Hong, K.; Yu, X.; Mays, J.; Sokolov, A.P. Decoupling of ionic transport from segmental relaxation in polymer electrolytes. Phys. Rev. Lett. 2012, 108, 088303. [Google Scholar] [CrossRef]
  33. Wang, Y.Y.; Sun, C.N.; Fan, F.; Sangoro, J.R.; Berman, M.B.; Greenbaum, S.G.; Zawodzinski, T.A.; Sokolov, A.P. Examination of methods to determine free-ion diffusivity and number density from analysis of electrode polarization. Phys. Rev. E 2013, 87, 042308. [Google Scholar] [CrossRef]
  34. Khazimullin, M.K.; Lebedev, Y.A. Influence of dielectric layer on estimates of diffusion coefficients and concentrations of ions from impedance spectroscopy. Phys. Rev. E 2019, 100, 062601. [Google Scholar] [CrossRef] [Green Version]
  35. Alexe-Ionescu, A.L.; Barbero, G.; Evangelista, L.R. Electric response of asymmetric electrolytic cells to small AC signals. J. Electroanal. Chem. 2020, 873, 114378. [Google Scholar] [CrossRef]
  36. Macdonald, J.R. One-dimensional current transport equations. J. Appl. Phys. 1975, 46, 4602. [Google Scholar] [CrossRef]
  37. Dubai, D.P.; Gomez-Romero, P.; Sankapal, B.R.; Holze, P. Nickel cobaltite as an emerging material for suercapacitors: An overview. Nano Energy 2015, 11, 377–399. [Google Scholar]
  38. Zhang, S.; Pan, N. Supercapacitors Performance Evaluations. Adv. Energy Mater. 2015, 5, 1401401. [Google Scholar] [CrossRef] [Green Version]
  39. Xiong, G.; Meng, C.; Reifenberger, R.G.; Irazoqui, P.P.; Fisher, T.S. A Review of Graphene-Based Electrochemical Micosupercapacitors. Electroanalysis 2014, 26, 30–51. [Google Scholar] [CrossRef]
  40. Li, H.; Wang, J.; Chu, Q.; Wang, Z.; Wang, S. Theoretical and experimental specific capacitance of polyaniline in sulfuric acid. J. Power Sources 2009, 190, 578–586. [Google Scholar] [CrossRef]
  41. Song, R.Y.; Park, J.H.; Sivakkumar, S.R.; Kim, S.H.; Ko, J.M.; Park, D.Y.; Jo, S.M.; Kim, D.Y. Supercapacitive properties of polyaniline/Nafion/hydrous RuO2 composite electrodes. J. Power Sources 2007, 166, 297–301. [Google Scholar] [CrossRef]
  42. Huang, Y.; Liang, J.; Chen, Y. An Overview of the Application of graphene-Based Materials in Supercapacitors. Small 2012, 8, 1805–1834. [Google Scholar] [CrossRef] [PubMed]
  43. Chen, S.-M.; Ramachandran, R.; Mani, V.; Saraswathi, R. Recent Advancements in elecrode Materials for High-performance Electrochemical Supercapacitors. Int. J. Electrochem. Sci. 2014, 9, 4072–4085. [Google Scholar]
  44. Zaccagnini, P.; Serrapede, M.; Lamberti, A.; Bianco, S.; Rivolo, P.; Tresso, E.; Pirri, C.F.; Barbero, G.; Alexe-Ionescu, A.L. Modeling of Electrochemical Capacitors Under Dynamical Cycling. Electrochim. Acta 2018, 296, 709–718. [Google Scholar] [CrossRef]
  45. Barbero, G.; Alexe-Ionescu, A.L. Role of the diffuse layer of the ionic charge on the impedance spectroscopy of a cell of liquid. Liq. Cryst. 2005, 32, 943. [Google Scholar] [CrossRef]
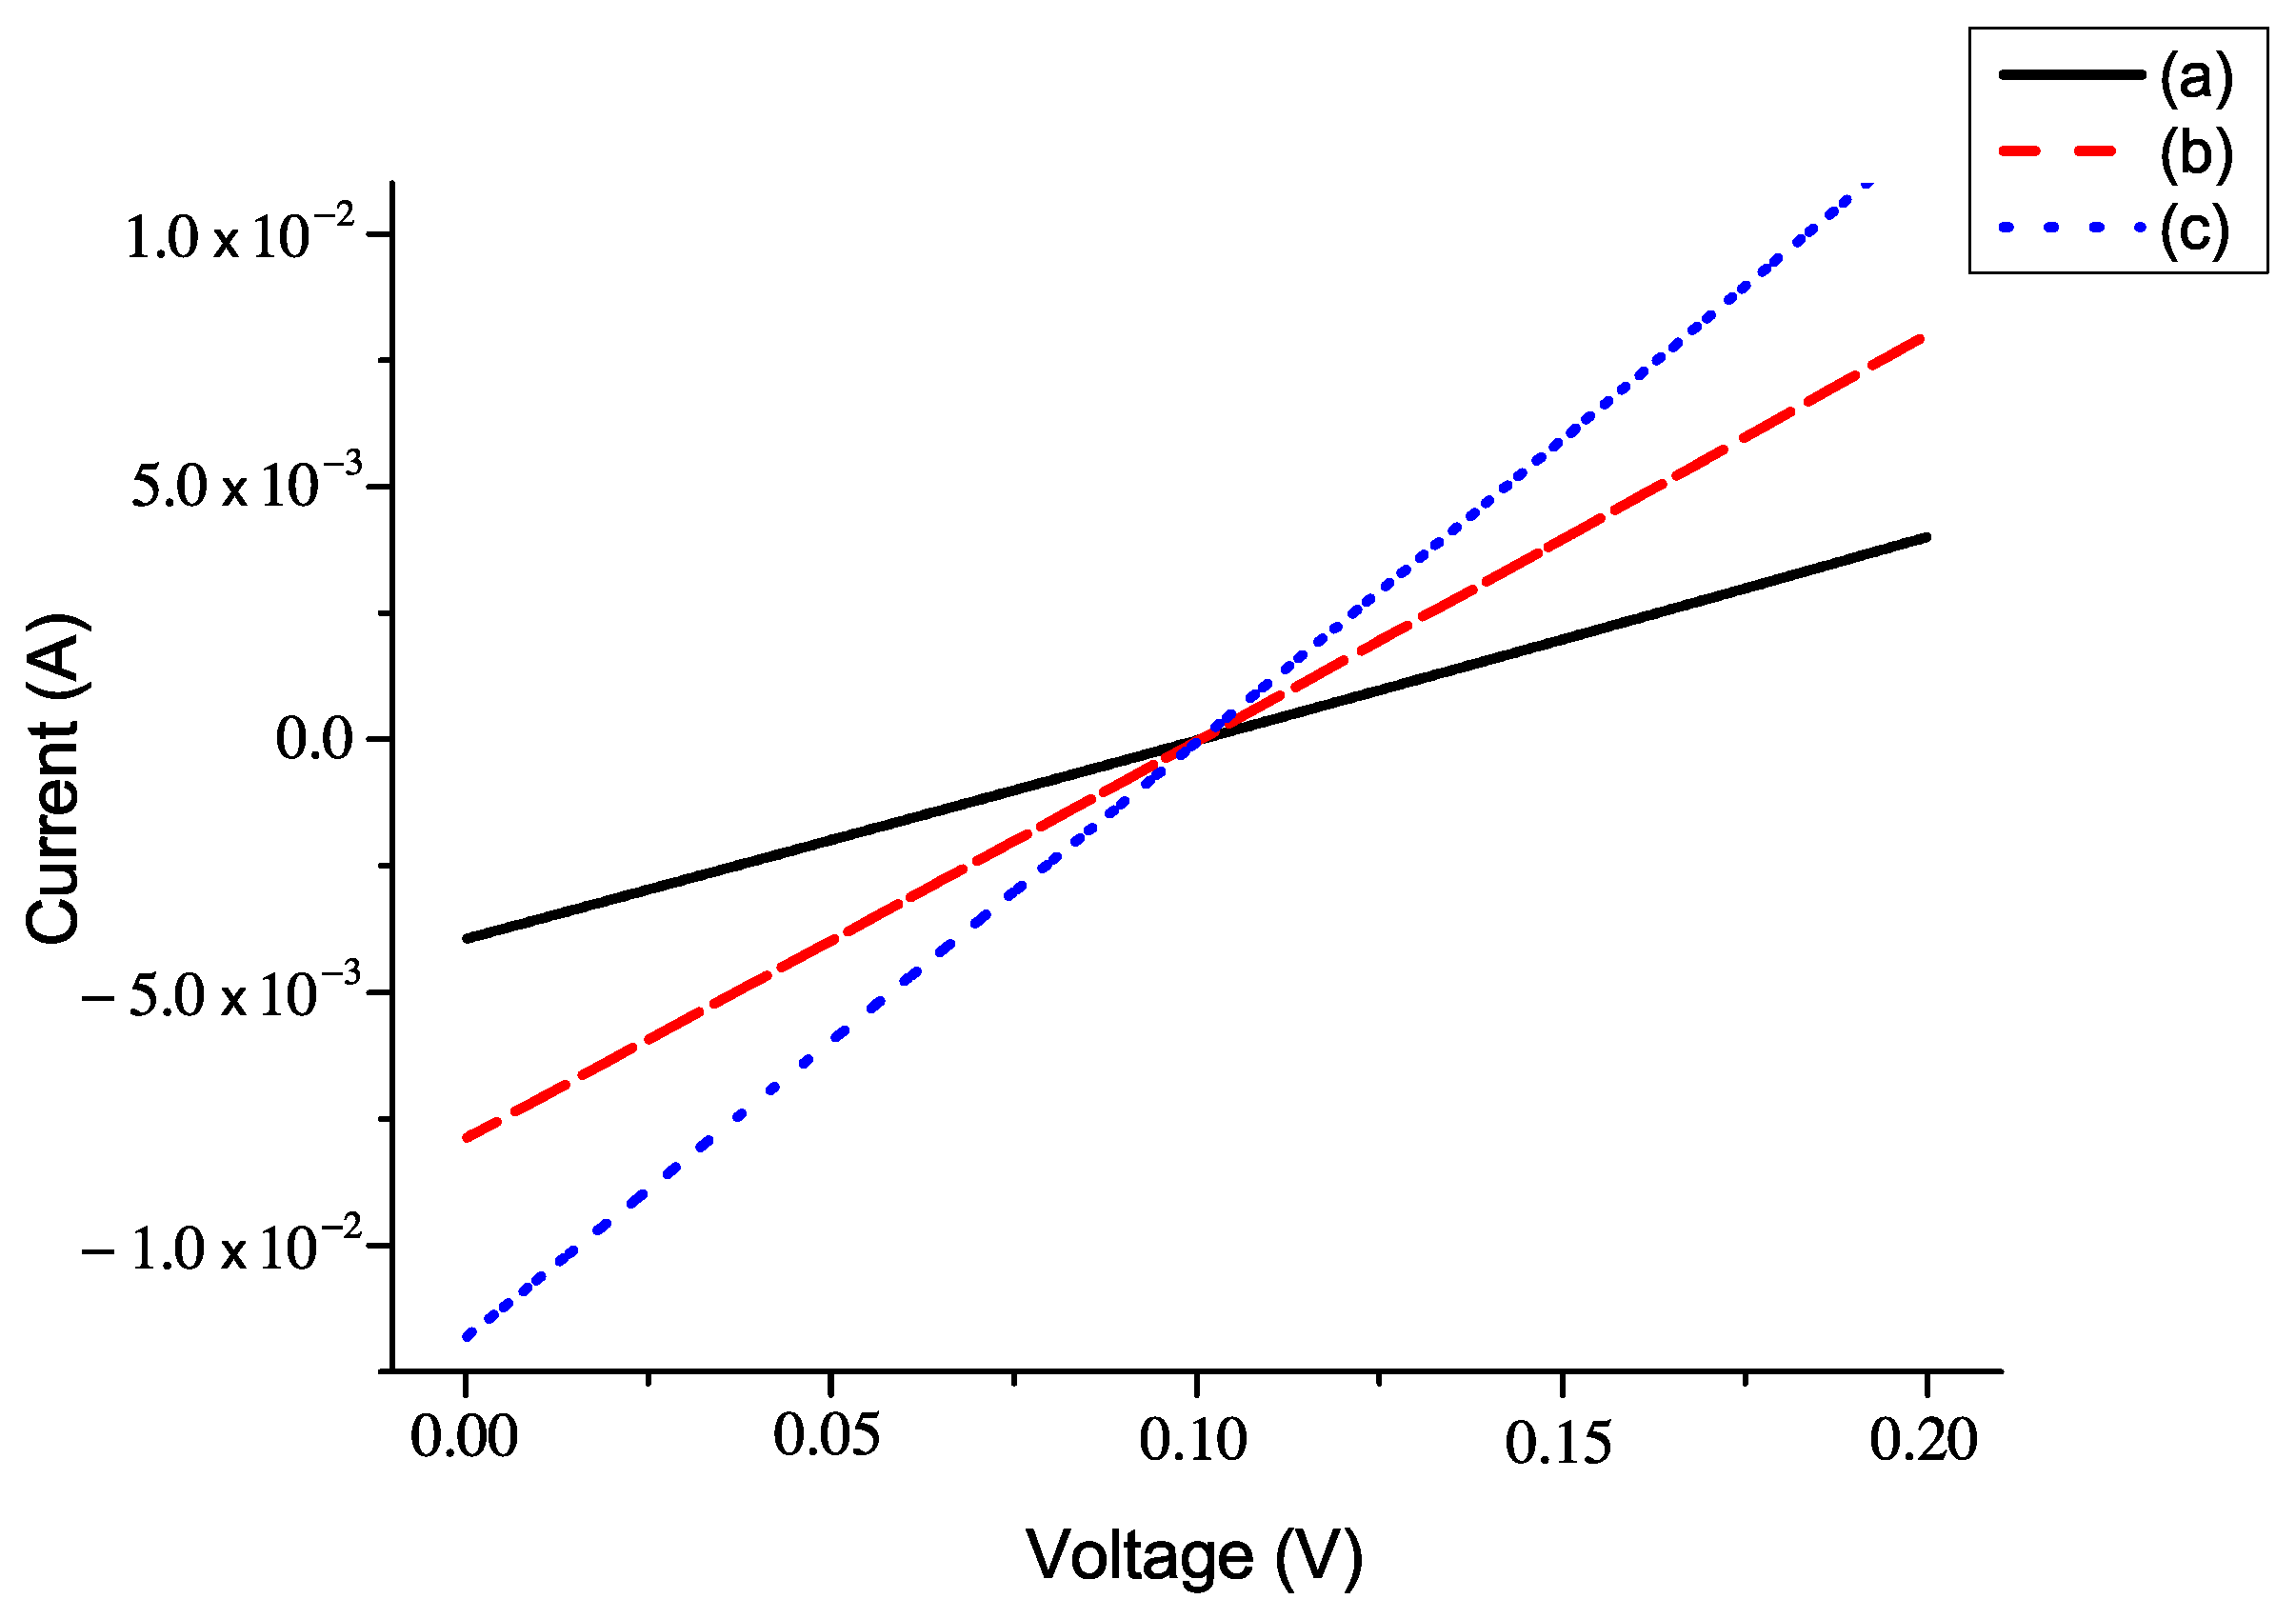
Figure 1. Parametric curves I ( V ) for an electrolytic cell with identical electrodes having the same adsorption properties for positive and negative ions, when the screening parameter is b = 0.04 , in the absence of the desorption phenomenon (desorption time tending to ). The adsorption coefficients are 10 6 m/s (a), 2 × 10 6 m/s (b), and 3 × 10 6 m/s (c).
Electronicmat 02 00011 g001
Figure 2. Parametric curves I ( V ) for an electrolytic cell with identical electrodes having the same adsorption properties for positive and negative ions, when the screening parameter is b = 0.04 , in the absence of adsorption ( k = 0 ), with τ = 1 s. In this case, the parametric curve is independent of the desorption time, and it is typical for an ideal condenser.
Electronicmat 02 00011 g002
Figure 3. Parametric curves I ( V ) for an electrolytic cell with identical electrodes having the same adsorption properties for positive and negative ions, when the screening parameter is b = 0.04 . The adsorption coefficient is 10 6 m/s. Desorption times are 0.5 s (a), 1 s (b), and 2 s (c).
Electronicmat 02 00011 g003
Figure 4. Parametric curves I ( V ) for an electrolytic cell with identical electrodes having the same adsorption properties for positive and negative ions, when the screening parameter is b = 0.04 . The curves are drawn for desorption time 1 s, and adsorption coefficient 5 × 10 7 m/s (a), 10 6 m/s (b), and 2 × 10 6 m/s (c).
Electronicmat 02 00011 g004
Figure 5. Parametric curves I ( V ) for an electrolytic cell with identical electrodes, with the same adsorption properties with respect to positive and negative ions. The adsorption coefficients are 10 6 m/s and the desorption times are 1 s. The screening parameters are 0.04 (a), 0.08 (b), and 0.12 (c).
Electronicmat 02 00011 g005
Figure 6. Effect of different adsorption coefficients on the two surfaces on the I = I ( V ) curve. The two electrodes have the same adsorption properties for positive and negative ions. Desorption times τ = 1 s, screening coefficient b = 0.04 . The adsorption coefficients on the B electrode are equal to 10 6 m/s. On the electrode A, they are equal to 5 × 10 7 m/s (a), 10 6 m/s (b), and 2 × 10 6 m/s (c).
Electronicmat 02 00011 g006
Publisher’s Note: MDPI stays neutral with regard to jurisdictional claims in published maps and institutional affiliations.