1. Introduction
Human-driven greenhouse gas (GHG) emissions are transforming the climate of the Earth more rapidly than at any other time since systematic measurements began [
1]. The Sixth Assessment Report of the Intergovernmental Panel on Climate Change [
2] attributes roughly 1.1 °C of the observed rise in global mean surface temperature to the cumulative burden of this type of gases. Their warming influence already reverberates throughout the climate system: glaciers retreat and ice sheets thin [
3], mean sea level rises [
4], and extremes in temperature and precipitation are becoming more intense and more frequent [
5]. Within the GHG mix, carbon dioxide (CO
2) stands out due to its sheer atmospheric abundance and its persistence, that is, once emitted, a fraction remains for centuries [
6]. Although methane (CH
4) and nitrous oxide (N
2O) have a stronger warming potential per molecule, their shorter atmospheric lifetimes mean that the climate legacy of the present day CO
2 emissions will continue with us long after the others have faded [
7]. In other words, the CO
2 we release today will define the climate that awaits future generations.
Against this global backdrop, the agricultural sector certainly occupies a pivotal position [
8]. Agriculture, forestry and other land use form a critical node in the climate-carbon nexus, since they are a notable source of CO
2 while simultaneously being highly vulnerable to shifts in temperature and water availability. Recent inventories estimate that agriculture alone contributes roughly 11–15% of total anthropogenic GHG output, surpassed only by electricity generation and transport on the global ledger [
9]. Most agricultural CO
2 comes from activities such as land conversion (e.g., deforestation for cropland, which releases stored carbon), diesel-powered field operations, energy-intensive irrigation pumping, and open burning of crop residues [
10,
11]. The continued warming and increasing hydroclimatic volatility threaten agricultural yields and rural livelihoods, creating a self-sustaining loop in which increasing exposure erodes the sector’s adaptive capacity while simultaneously amplifying its emissions footprint. These interconnected vulnerabilities underscore the urgent need for comprehensive analyses capable of modeling the complexity of agri-environmental systems, thus forming robust climate policies and improving the resilience of the agricultural sector under future climate scenarios [
12].
Meeting these analytical needs in agri-environmental modeling depends critically on our ability to translate heterogeneous data sources, ranging from agri-environmental indicators to geospatial features, into accurate climate-relevant predictions. However, traditional modeling approaches often fall short in this regard. Inventory-based models provide retrospective estimates, but lack the capacity for forward-looking prediction [
13]. Mechanistic simulators, such as crop or climate process models, represent biophysical complexity more faithfully, yet they demand extensive input data, are computationally intensive, and remain difficult to scale globally [
14]. Simpler statistical methods, including linear regression models, offer interpretability but struggle to capture the nonlinear dynamics that characterize the climate-agriculture tandem. An illustrative example is provided by Murad et al. [
15], who identified a significant bidirectional association between agricultural output and per capita CO
2 emissions. However, the simplicity of the model and the limited availability of explanatory variables constrained its ability to reflect complex interactions. Taken together, these classical tools either oversimplify the problem or focus narrowly on mechanistic pathways, ultimately limiting their capacity to predict the spatial and temporal variability of CO
2 emissions across diverse agricultural systems.
During the past decade, machine learning (ML) methods have transformed the way researchers study GHG emissions in agricultural contexts [
16,
17]. Early work in the mid-2010s relied on relatively simple shallow algorithms, such as decision trees, support vector machines (SVM), or single-layer neural networks, to demonstrate that data-driven predictive models could outperform linear regressions when there were nonlinear interactions between management, soil, and climate variables. For instance, Safa et al. provided one of the first proofs of concept with a feedforward artificial neural network (ANN) that predicted wheat crop emissions more accurately than a conventional linear benchmark [
18]. In parallel, kernel-based support vector machines (SVM) were used to forecast sectoral CO
2 emissions in China, while a Least Squares SVM approach incorporating economic structure and targeted feature selection further improved predictive accuracy [
19]. Additionally, Pérez-Miñana et al. [
20] explored Bayesian Networks for GHG management in British agriculture, showing that probabilistic modeling can improve transparency and stakeholder understanding by linking emissions directly to their economic cost. These first-generation studies validated the ML approach, but their performance was sometimes limited by small sample sizes and the inability to capture intricate dynamics.
As larger multi-site datasets became available, tree-based ensembles emerged as the workhorse for agricultural emission modeling. Random Forests (RF), which aggregate hundreds of bootstrapped decision trees, proved adept at modeling the cyclical and seasonal behavior of soil CO
2 fluxes. Shiri et al. [
21] applied a Random Forest model to estimate CO
2 flux components across 11 forest sites, showing that temperature and radiation variables could drive accurate predictions even under data-scarce conditions. In larger multi-year compilations, gradient-boosted decision trees (GBDT) have consistently outperformed other methods. Adjuik and Davis [
22], using the USDA GRACEnet database, found that a GBDT model delivered strong predictive performance on training data and matched RF as the top performer on unseen test data, ahead of SVM and
k-nearest neighbors regressors. Wu et al. [
23] extended this paradigm by using Extreme Gradient Boosting (XGBoost) to predict CH
4 and N
2O emissions from paddy fields in various management scenarios in China, obtaining robust precision and identifying key emission drivers through a feature importance analysis. Thanks to their ability to model complex interactions with modest data volumes and their built-in variable importance scores, RF and GBDT became some of the most popular baselines in agricultural emission modeling and related environmental applications.
The latest phase in this methodological evolution is marked by deep feed-forward neural networks, which can rival, and occasionally surpass, ensemble trees when the feature space is rich enough. Harsanyi et al. [
24] benchmarked gradient boosting, SVM and two deep architectures, a fully connected neural network (FNN) and a convolutional neural net (CNN), on maize-field fluxes across two distinct climatic regions. The FNN achieved the highest test accuracy, with gradient boosting performing similarly well. Xue [
25] leveraged a neural network based on radial basis functions to predict soil CO
2 fluxes from key soil and climate variables during crop growth, demonstrating superior performance over linear models and standard feedforward networks in capturing nonlinear emission patterns. In [
26], Wang et al. introduced a multi-scale deep learning framework combining attention-based encoders for daily and monthly CO
2 data. Their model was able to reach state-of-the-art performance in long-term atmospheric CO
2 forecasting, outperforming several baselines at a reasonable computational cost. Although these and other recent deep learning approaches show competitive results, particularly in settings with dense temporal data [
27], many global emission inventories collected over extended periods lack a strong spatial or sequential structure. This limits the suitability of convolutional or sequence-based models. Instead, models tailored to tabular data, such as the Network on Network (NON) architecture [
28], offer a compelling alternative by learning dedicated feature embeddings.
As modern ML models increasingly outperform traditional approaches in predicting agricultural CO
2 emissions, their lack of interpretability often becomes a critical barrier to real-world adoption, especially in policy contexts that demand transparency and justification of model outputs. Tree-based methods partially address this challenge through their built-in variable importance metrics, offering a degree of interpretability by design. However, deep learning architectures operate as black boxes, making it difficult to trace individual predictions back to meaningful drivers. In this context, explainable artificial intelligence (XAI) techniques have emerged as a powerful tool to bridge the gap between performance and transparency. These techniques are applied after model training and aim to interpret how input variables influence the resulting predictions, thereby identifying the most relevant factors behind the model’s behavior. Rather than modifying the model itself, they provide an additional analytical layer that enhances transparency and facilitates trust in data-driven conclusions. Among them, the SHAP (SHapley Additive exPlanations) framework [
29] builds on the Shapley value concept from cooperative game theory, in which each feature is regarded as a ’player’ contributing to the overall model output. This theoretical basis allows SHAP to fairly quantify how much each variable contributes to a given prediction. This framework provides consistent, model-agnostic, and locally accurate attributions for both ensemble and neural models. Recent applications have demonstrated its effectiveness in climate-related modeling tasks. For instance, this approach has been used to validate the Environmental Kuznets Curve hypothesis [
30] by revealing nonlinear relationships between income per capita and CO
2 emissions [
31]. In the transportation sector, it has also been applied to identify the main factors influencing vehicle CO
2 emissions in Canada, such as urban and highway fuel consumption and fuel type, offering valuable insights for decarbonization strategies [
32]. By translating complex model outputs into actionable information, this explainability method fosters stakeholder trust and facilitates the integration of ML into evidence-based climate policy.
Despite the clear benefits of capturing global patterns with XAI, climate mitigation decisions are ultimately formulated and implemented at the national level. Country-specific agro-ecological conditions, policy environments, and data-reporting practices can lead to substantial deviations from global emission patterns. For example, spatial optimization models show that low-emission strategies optimized globally may differ from those based on local sourcing, highlighting how efficiency and emissions vary regionally [
33]. As a result, predictive frameworks must be flexible enough to accommodate local particularities without losing their generalization. Comparing global and country-level feature attributions then becomes essential not just to identify general and local drivers, but also to understand how global patterns translate into specific national contexts. This contrast can reveal the adaptability of predictive models to diverse conditions, reinforcing their utility for designing evidence-based mitigation policies that are both globally informed and locally actionable [
34].
In response to these demands, this study develops a methodological framework to estimate surface temperature increases driven by agriculture-related CO
2 emissions. The framework integrates systematic model benchmarking with explainable techniques and a multi-scale perspective, enabling robust global analysis while preserving relevance for country-level policy design. Three key challenges motivate the research conducted in this work. First, it remains unclear which type of ML model offers the best combination of robustness and accuracy when applied to medium-sized tabular datasets that integrate agri-environmental information. Existing research, for example [
16,
17,
24], still provides limited findings on the specific task of predicting surface temperatures from agricultural CO
2 emissions. Second, although many high-capacity models achieve excellent predictive performance, their inner workings are often opaque. This lack of interpretability complicates their use in policy-oriented settings, where decision-makers require not only accurate forecasts but also a clear understanding of the underlying drivers. Third, most global modeling approaches generalize across regions, frequently at the cost of overlooking country-specific dynamics. As a result, they struggle to support locally relevant mitigation strategies, particularly in countries with atypical emission profiles or distinct agro-environmental constraints.
To address these challenges in a specific data-driven setting, this work relies on a harmonized global dataset covering 236 countries over the period 1990–2020. This panel combines agriculture-related CO
2 emissions with environmental, demographic, and geographic variables, offering a suitable basis for benchmarking ML models on structured, medium-scale data. To assess the capacity of the framework to generate actionable country-level insights, we complement the global analysis with a case study of Iran. This country exemplifies the complex interplay of agro-climatic stress, technological inertia, and institutional constraints. Its semi-arid climate, heavy reliance on groundwater irrigation, and high agricultural carbon intensity create a highly nonlinear emission profile that global patterns alone fail to resolve. Previous work on Iran’s agricultural emissions, such as Shabani et al. [
35], focused on improving CO
2 forecasts, but did not examine the role of temperature or provide interpretable insights between global and local patterns. Our framework addresses both gaps by explicitly modeling temperature effects and emphasizing explainability. As such, Iran serves as a critical case for testing the interpretability of the framework and its relevance in policy under national conditions. Overall, this study addresses the scientific problem of how to accurately model and interpret agriculture-related CO
2 emissions and their temperature impacts in a way that combines predictive performance, interpretability, and multi-scale relevance. Building on this context, the paper makes four main contributions:
A systematic benchmarking protocol that compares seven machine learning regression models on the specific task of linking agricultural CO2 emissions to surface temperature changes, under a unified preprocessing, tuning, and validation setup.
An interpretability scheme that combines impurity-based importance metrics with model-agnostic SHAP analyses to provide transparent, multi-scale explanations of emission drivers.
Empirical evidence, in our dataset, that gradient-boosted tree models consistently outperform deep tabular networks on medium-sized agri-environmental data, while providing more stable feature attributions.
A multi-scale application contrasting global feature attributions with a national case study (Iran), showing how the same methodological pipeline can support both international benchmarking and country-level mitigation analysis.
The remainder of the paper is structured as follows.
Section 2 describes the dataset, the regression models considered, and the interpretability tools used in the study.
Section 3 presents the experimental results, including a comparative performance evaluation of all models, a multi-model interpretability analysis, and a case study on Iran. Finally,
Section 4 summarizes the main findings, discusses their implications for environmental modeling and policy, and outlines directions for future work.
3. Results and Discussion
This section provides a detailed examination of the experimental results, combining quantitative comparisons, model interpretability analyses, case-specific evaluations, and local error investigations. In
Section 3.1, we first present a comparative assessment of all regression models using tabular metrics, scatter plots, and residual analyses, highlighting their predictive accuracy and generalizability. Next,
Section 3.2 synthesizes model interpretability insights through SHAP values and feature importance rankings, identifying common patterns and divergences across methods.
Section 3.3 focuses on a case study that compares Iran’s emission profile with global trends, uncovering unique national characteristics and their implications. Finally,
Section 3.4 presents an error analysis based on SHAP force plots and outlier diagnostics, shedding light on individual prediction behaviors and revealing conditions under which the models succeed or fail. This helps identify edge cases and evaluate model reliability in high-impact settings.
3.1. Comparative Model Performance
Table 2 provides a comprehensive comparison of the seven machine learning models and the Linear Regression baseline evaluated in this study, based on four standard performance metrics computed on the held-out test set: MSE, MAE, R
2, and EV. Lower values are better for error-based metrics (MSE, MAE), whereas higher values indicate better performance for variance-explaining metrics (R
2, EV). These results allow us to jointly assess the accuracy, robustness, and generalization capability of each model.
To contextualize the rationale behind the selected models, we first establish a Linear Regression model as a simple baseline. As shown in
Table 2, this baseline model performs poorly (MSE = 0.59, R
2 = 0.40), failing to capture even half of the variance in the test data. This result indicates that, although spatio-temporal features such as
Year and
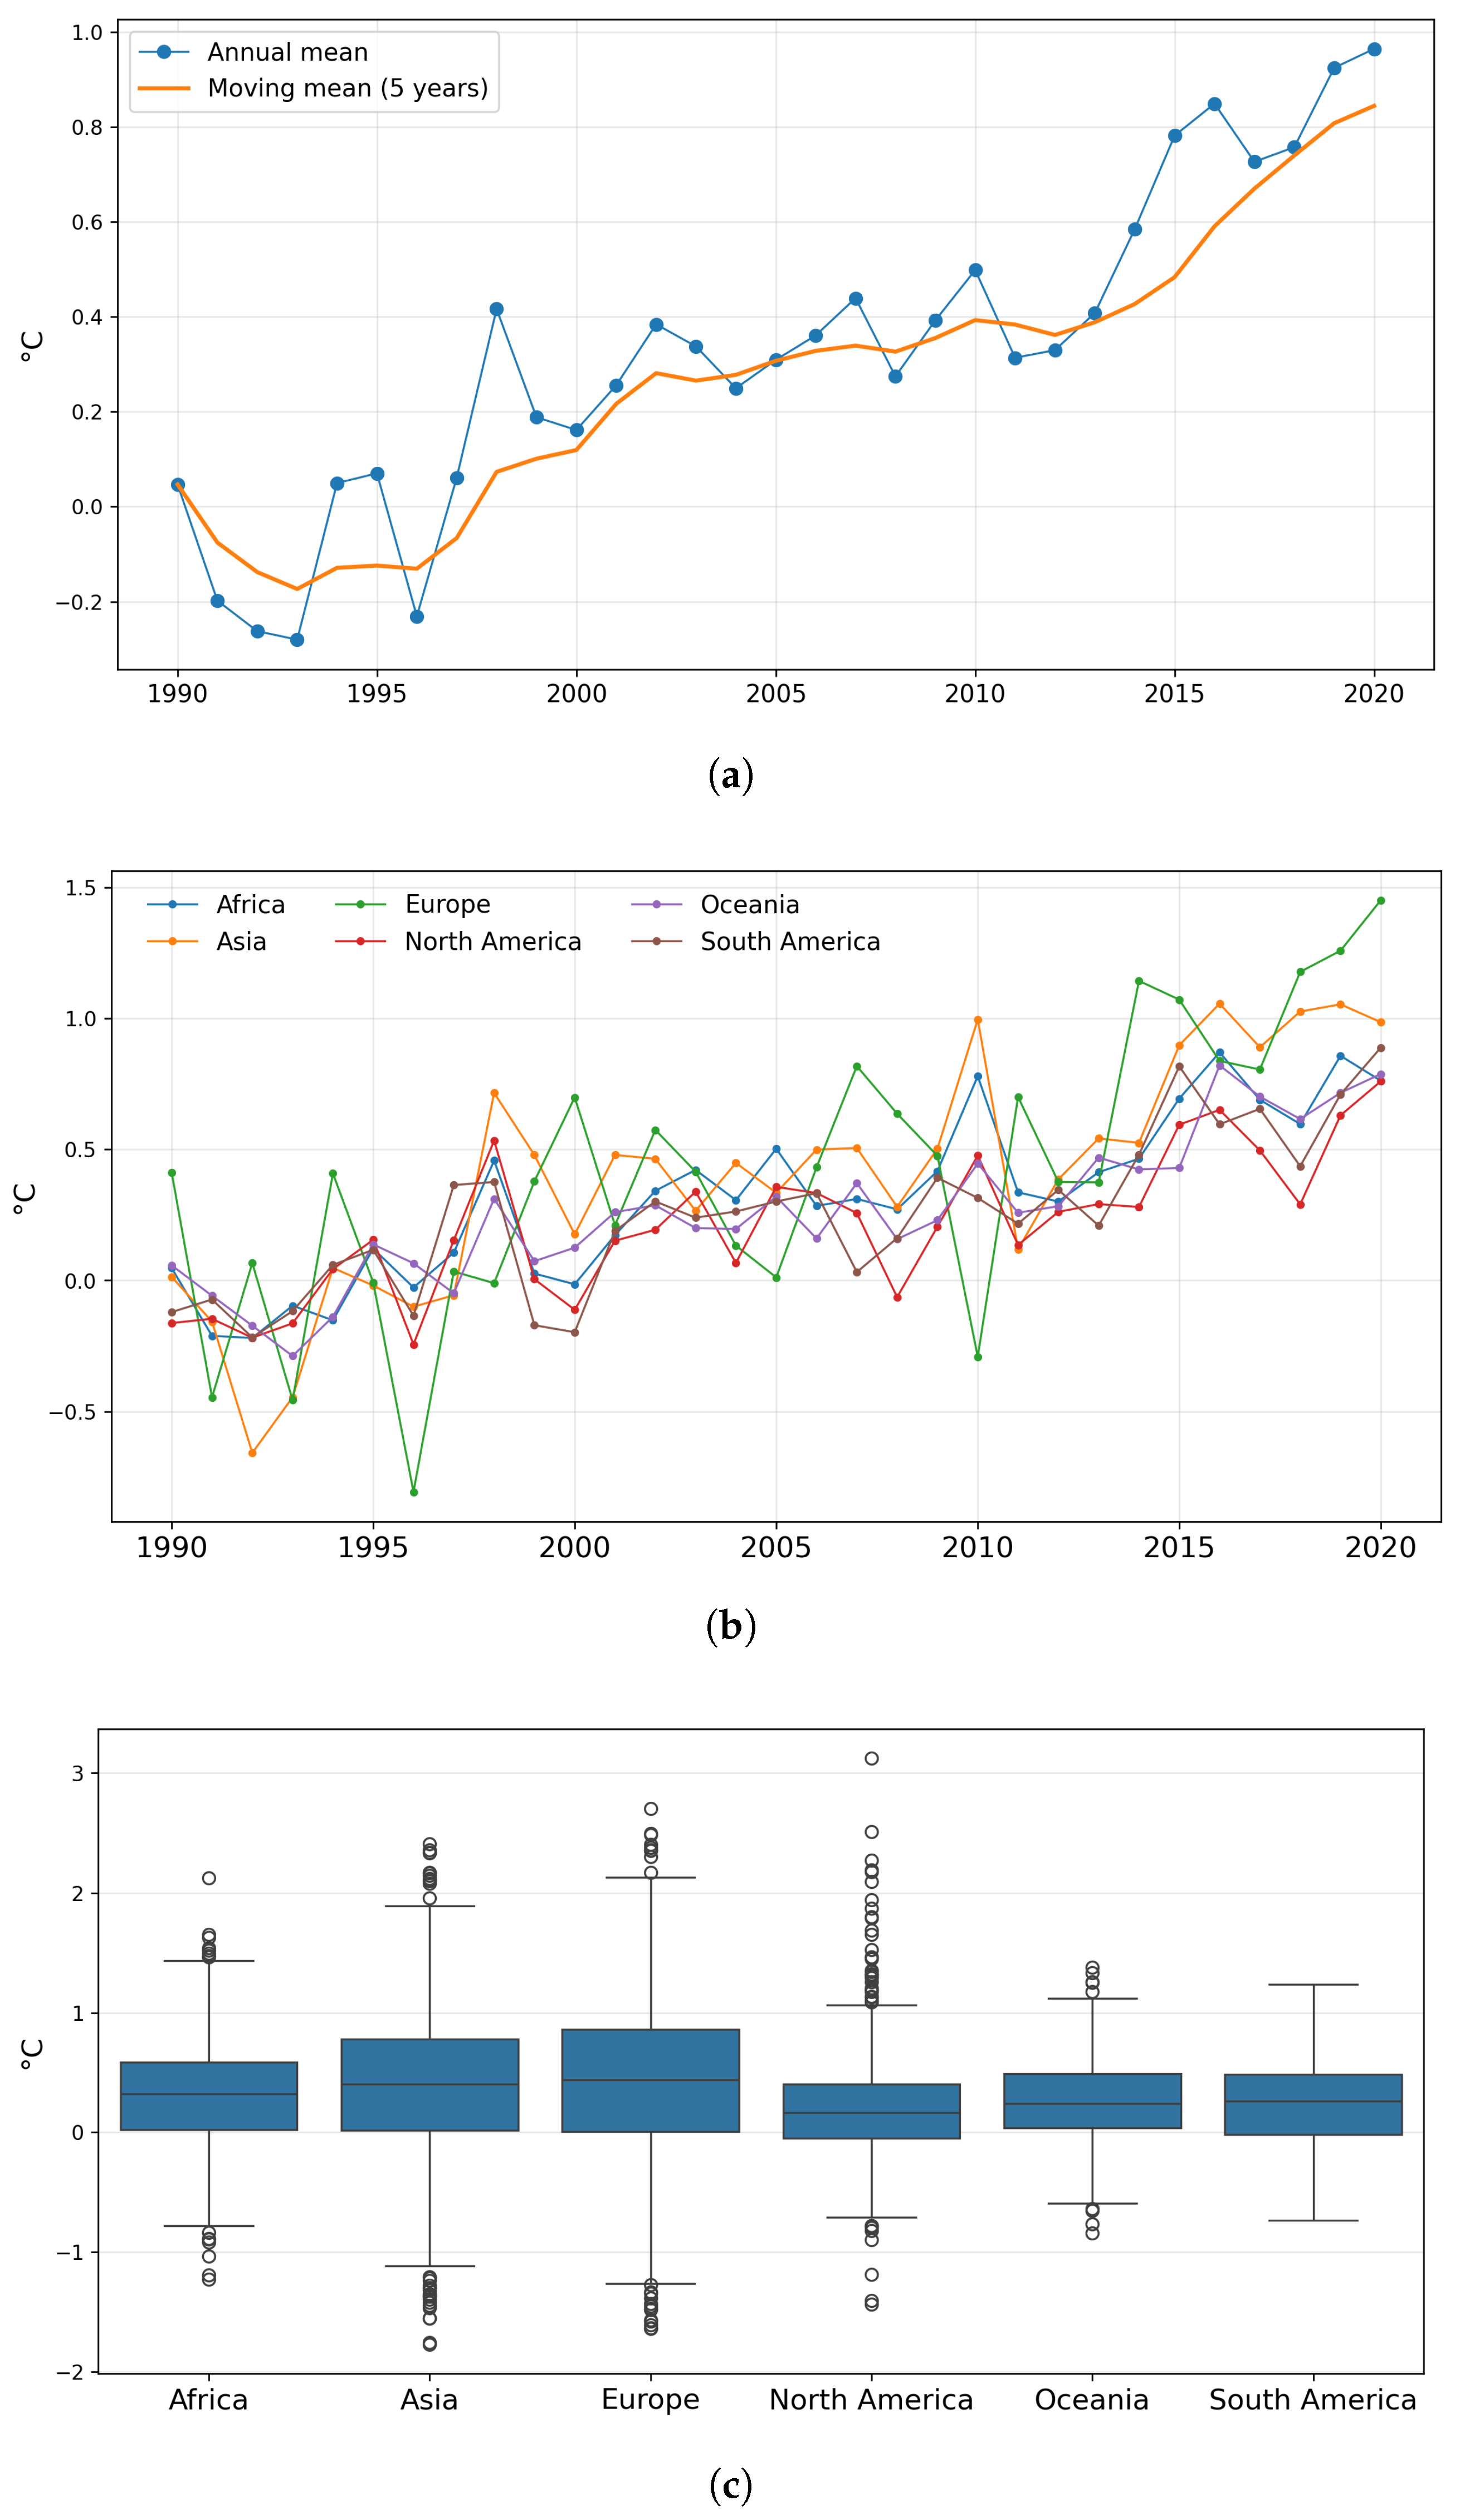
Lat/Lon are informative, their relationship with temperature is markedly non-linear. A single global linear function cannot approximate either the accelerating warming trend (
Figure 2a) or the heterogeneous spatial patterns across regions (
Figure 2b). Consequently, the weak performance of the linear baseline provides empirical support for employing models with non-linear capacity.
With this baseline established, the results reveal a clear performance hierarchy. Gradient-boosted tree ensembles occupy the top tier, with XGBoost achieving the lowest error across the board (MSE = 0.27, MAE = 0.38) and explaining 73% of the variance, marginally ahead of both Gradient Boosting and LightGBM (MSE ≈ 0.29, R
2 ≈ 0.71). The improvement over a standard Random Forest (MSE = 0.33, R
2 = 0.66) illustrates how the sequential error-correction in boosting leads to more accurate annual temperature rise forecasts than the independent aggregation used in simple bagging. A second tier is formed by GRANDE (MSE = 0.37, R
2 = 0.63), whose jointly trained tree ensemble lags the boosting trio, but still outperforms neural baselines. The gap widens for NON (MSE = 0.46) and vanilla MLP (MSE = 0.49), both of which retain barely half of the target variance. These initial figures suggest that for medium-sized datasets in environmental modeling that combine numerical and categorical variables, large parametric networks struggle to generalize, whereas tree ensembles, especially when boosted, translate the heterogeneous feature space into accurate, low-bias estimates. Our results are consistent with earlier studies on agricultural emission modeling, where gradient-boosted trees also outperformed other regression methods [
22,
23]. This agreement reinforces the robustness of ensemble approaches, while the comparatively weaker performance of deep networks in our setting reflects the data size and tabular structure, as similarly noted by Harsanyi et al. [
24].
To translate these numerical rankings into a more intuitive understanding of each model’s strengths and weaknesses, we now turn to a detailed analysis of scatter plots and residual histograms.
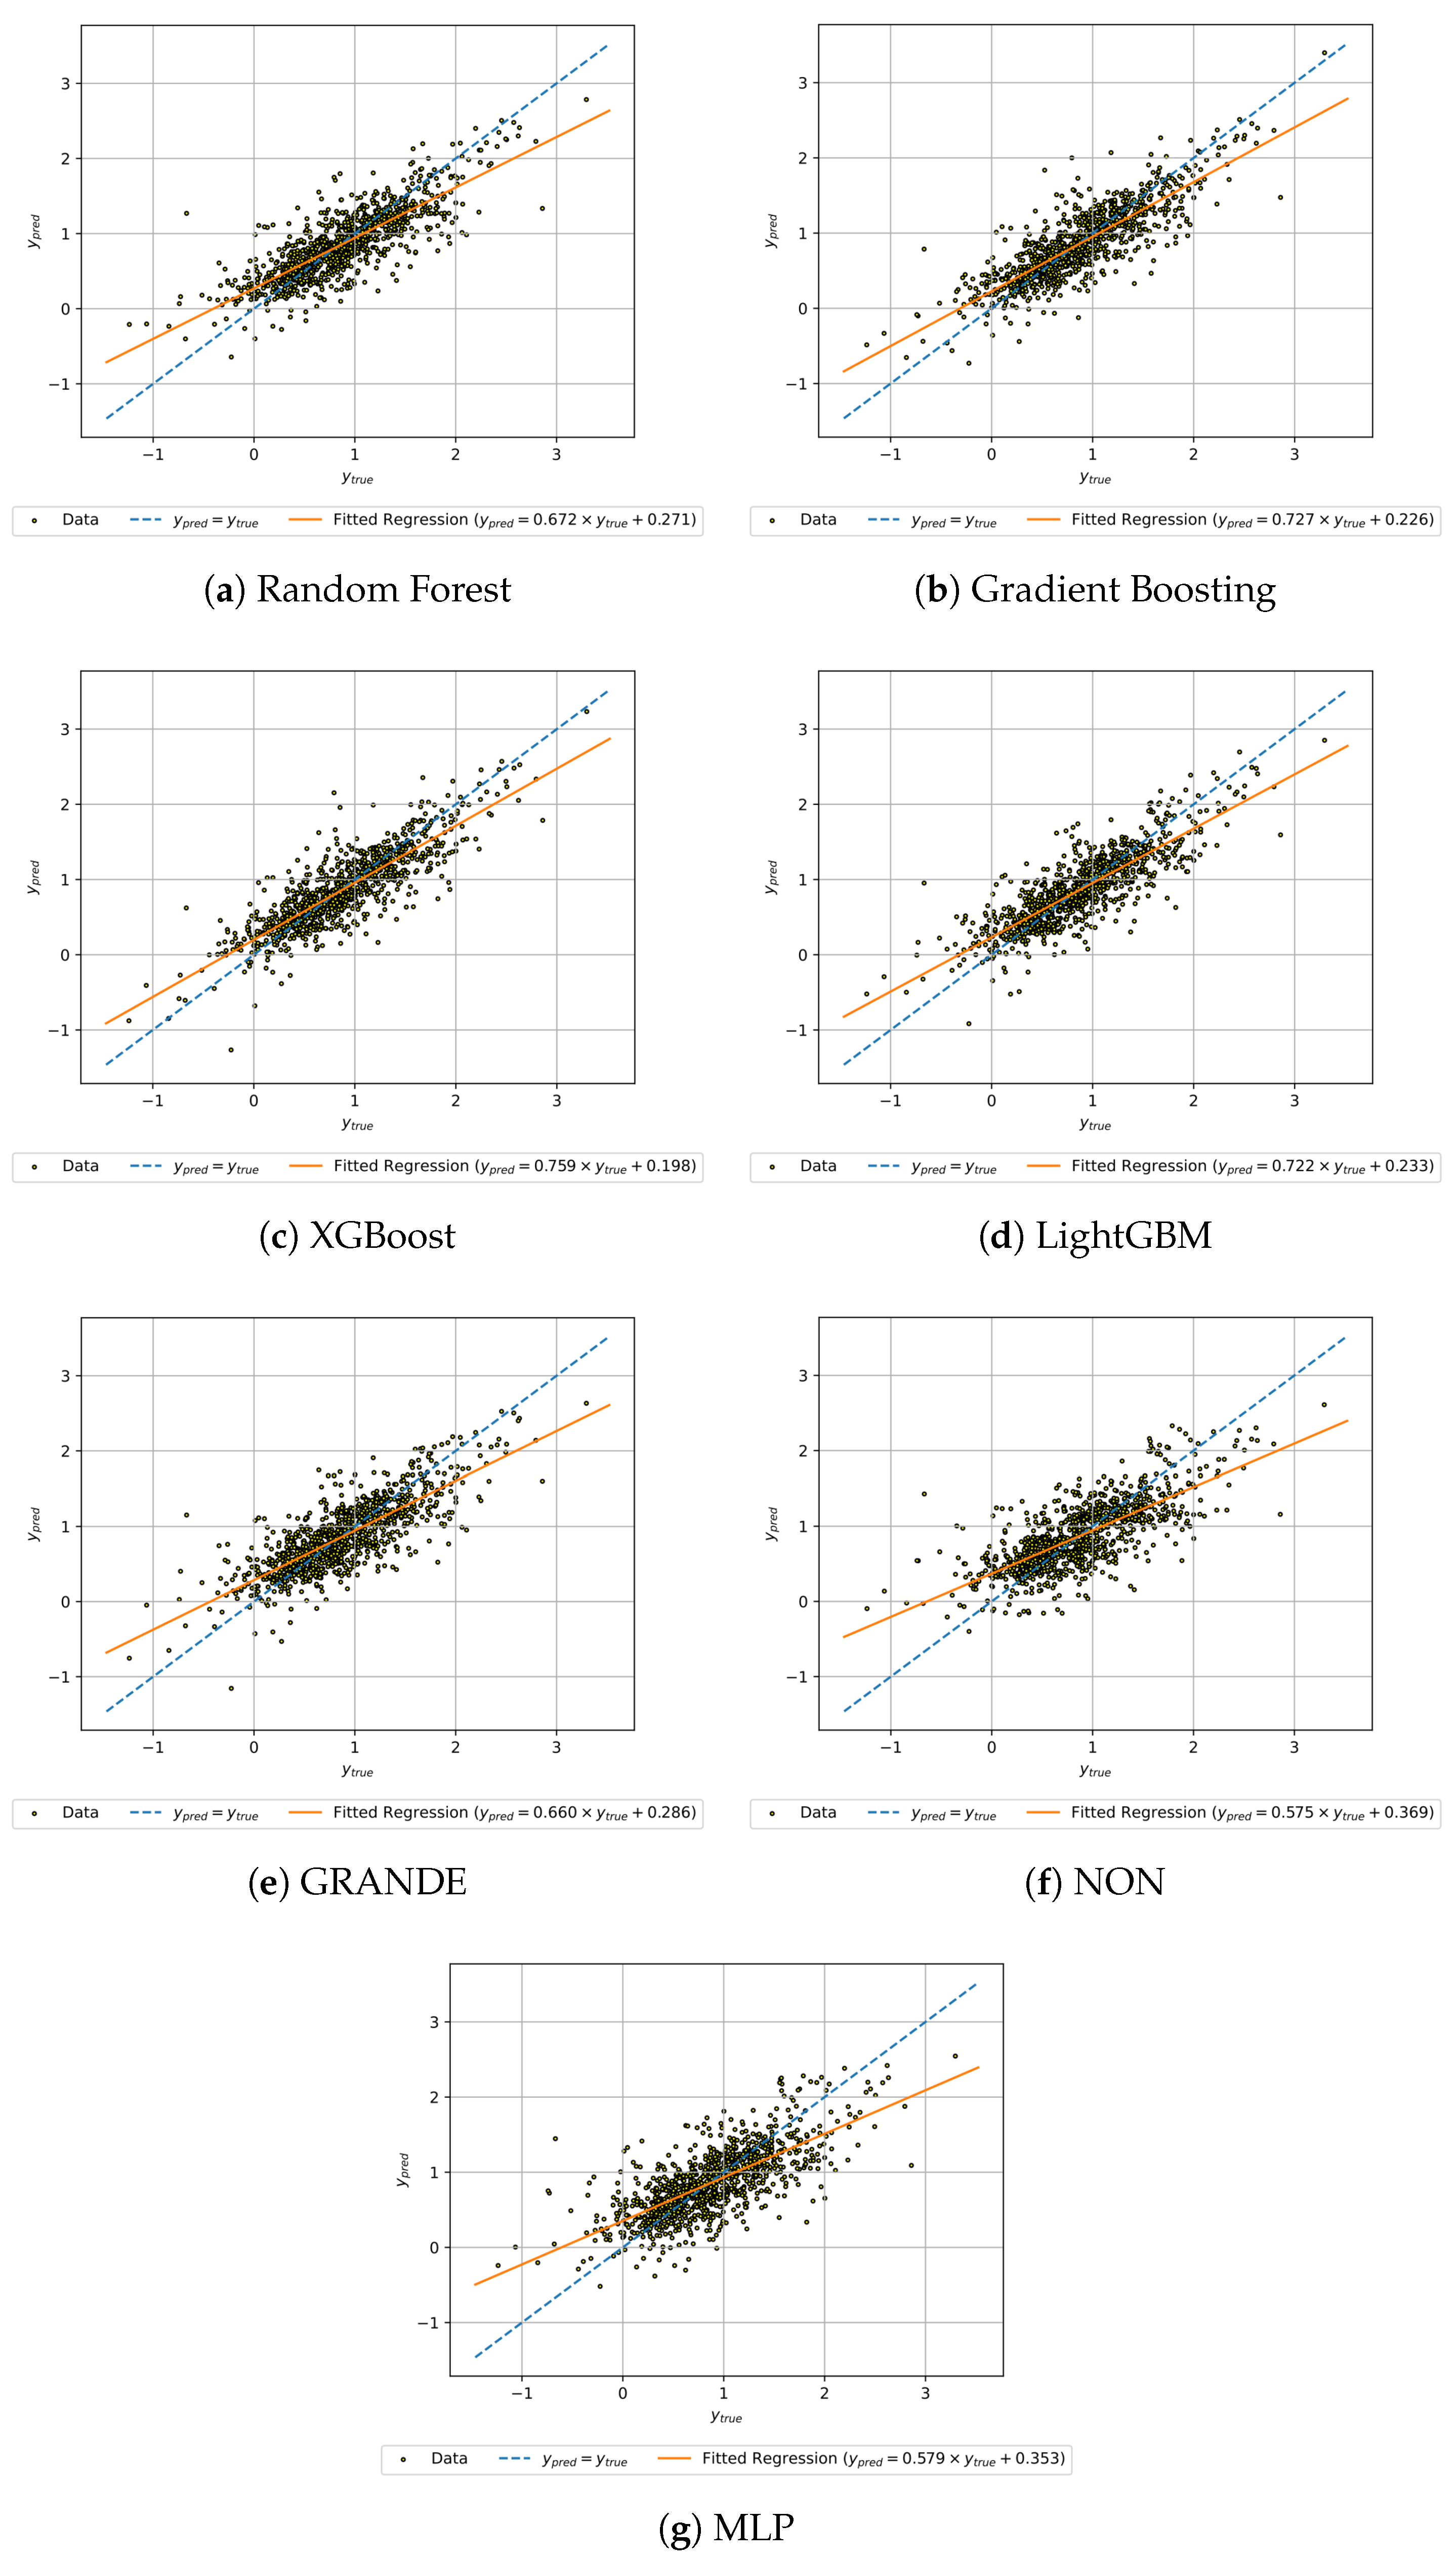
Figure 5 presents the scatter plots of predicted versus real values for each of the seven regression models evaluated in this study. Each subplot shows the ideal prediction line (
, dashed blue) alongside a fitted regression line (solid orange) to visualize systematic biases. These plots provide a graphical assessment of the predictive accuracy, error dispersion, and generalization behavior of each model. A tighter clustering of points around the diagonal indicates better agreement between predictions and ground truth, while systematic deviations highlight model-specific tendencies to under- or overestimate.
The diagrams in
Figure 5 visually reinforce the performance hierarchy identified in the quantitative metrics. Boosted tree ensembles (XGBoost, Gradient Boosting, and LightGBM) show tight clustering around the identity line, with regression slopes near unity and minimal intercepts, indicating strong calibration and a faithful reproduction of the full dynamic range of annual temperature increases. These models are particularly effective at capturing extreme cases, both high- and low-emission scenarios, demonstrating their ability to generalize across diverse geopolitical and environmental contexts. In contrast, Random Forest approximates the overall trend but shows a shallower slope and increased vertical dispersion, suggesting a tendency to compress extreme predictions. This behavior, consistent with its higher MSE and lower R
2, reflects the bias of the model toward the mean due to its independent tree averaging strategy. GRANDE shows a similar pattern, but with wider residual variance, reinforcing its intermediate performance between bagging and boosting approaches. Deep learning models such as NON and MLP visibly collapse their predictions to the mean of the data set, as indicated by regression slopes well below one and limited variance around the central cluster. This pattern is indicative of underfitting, consistent with the limited capacity of the models to capture nonlinear interactions and spatial dependencies embedded in agricultural emission data.
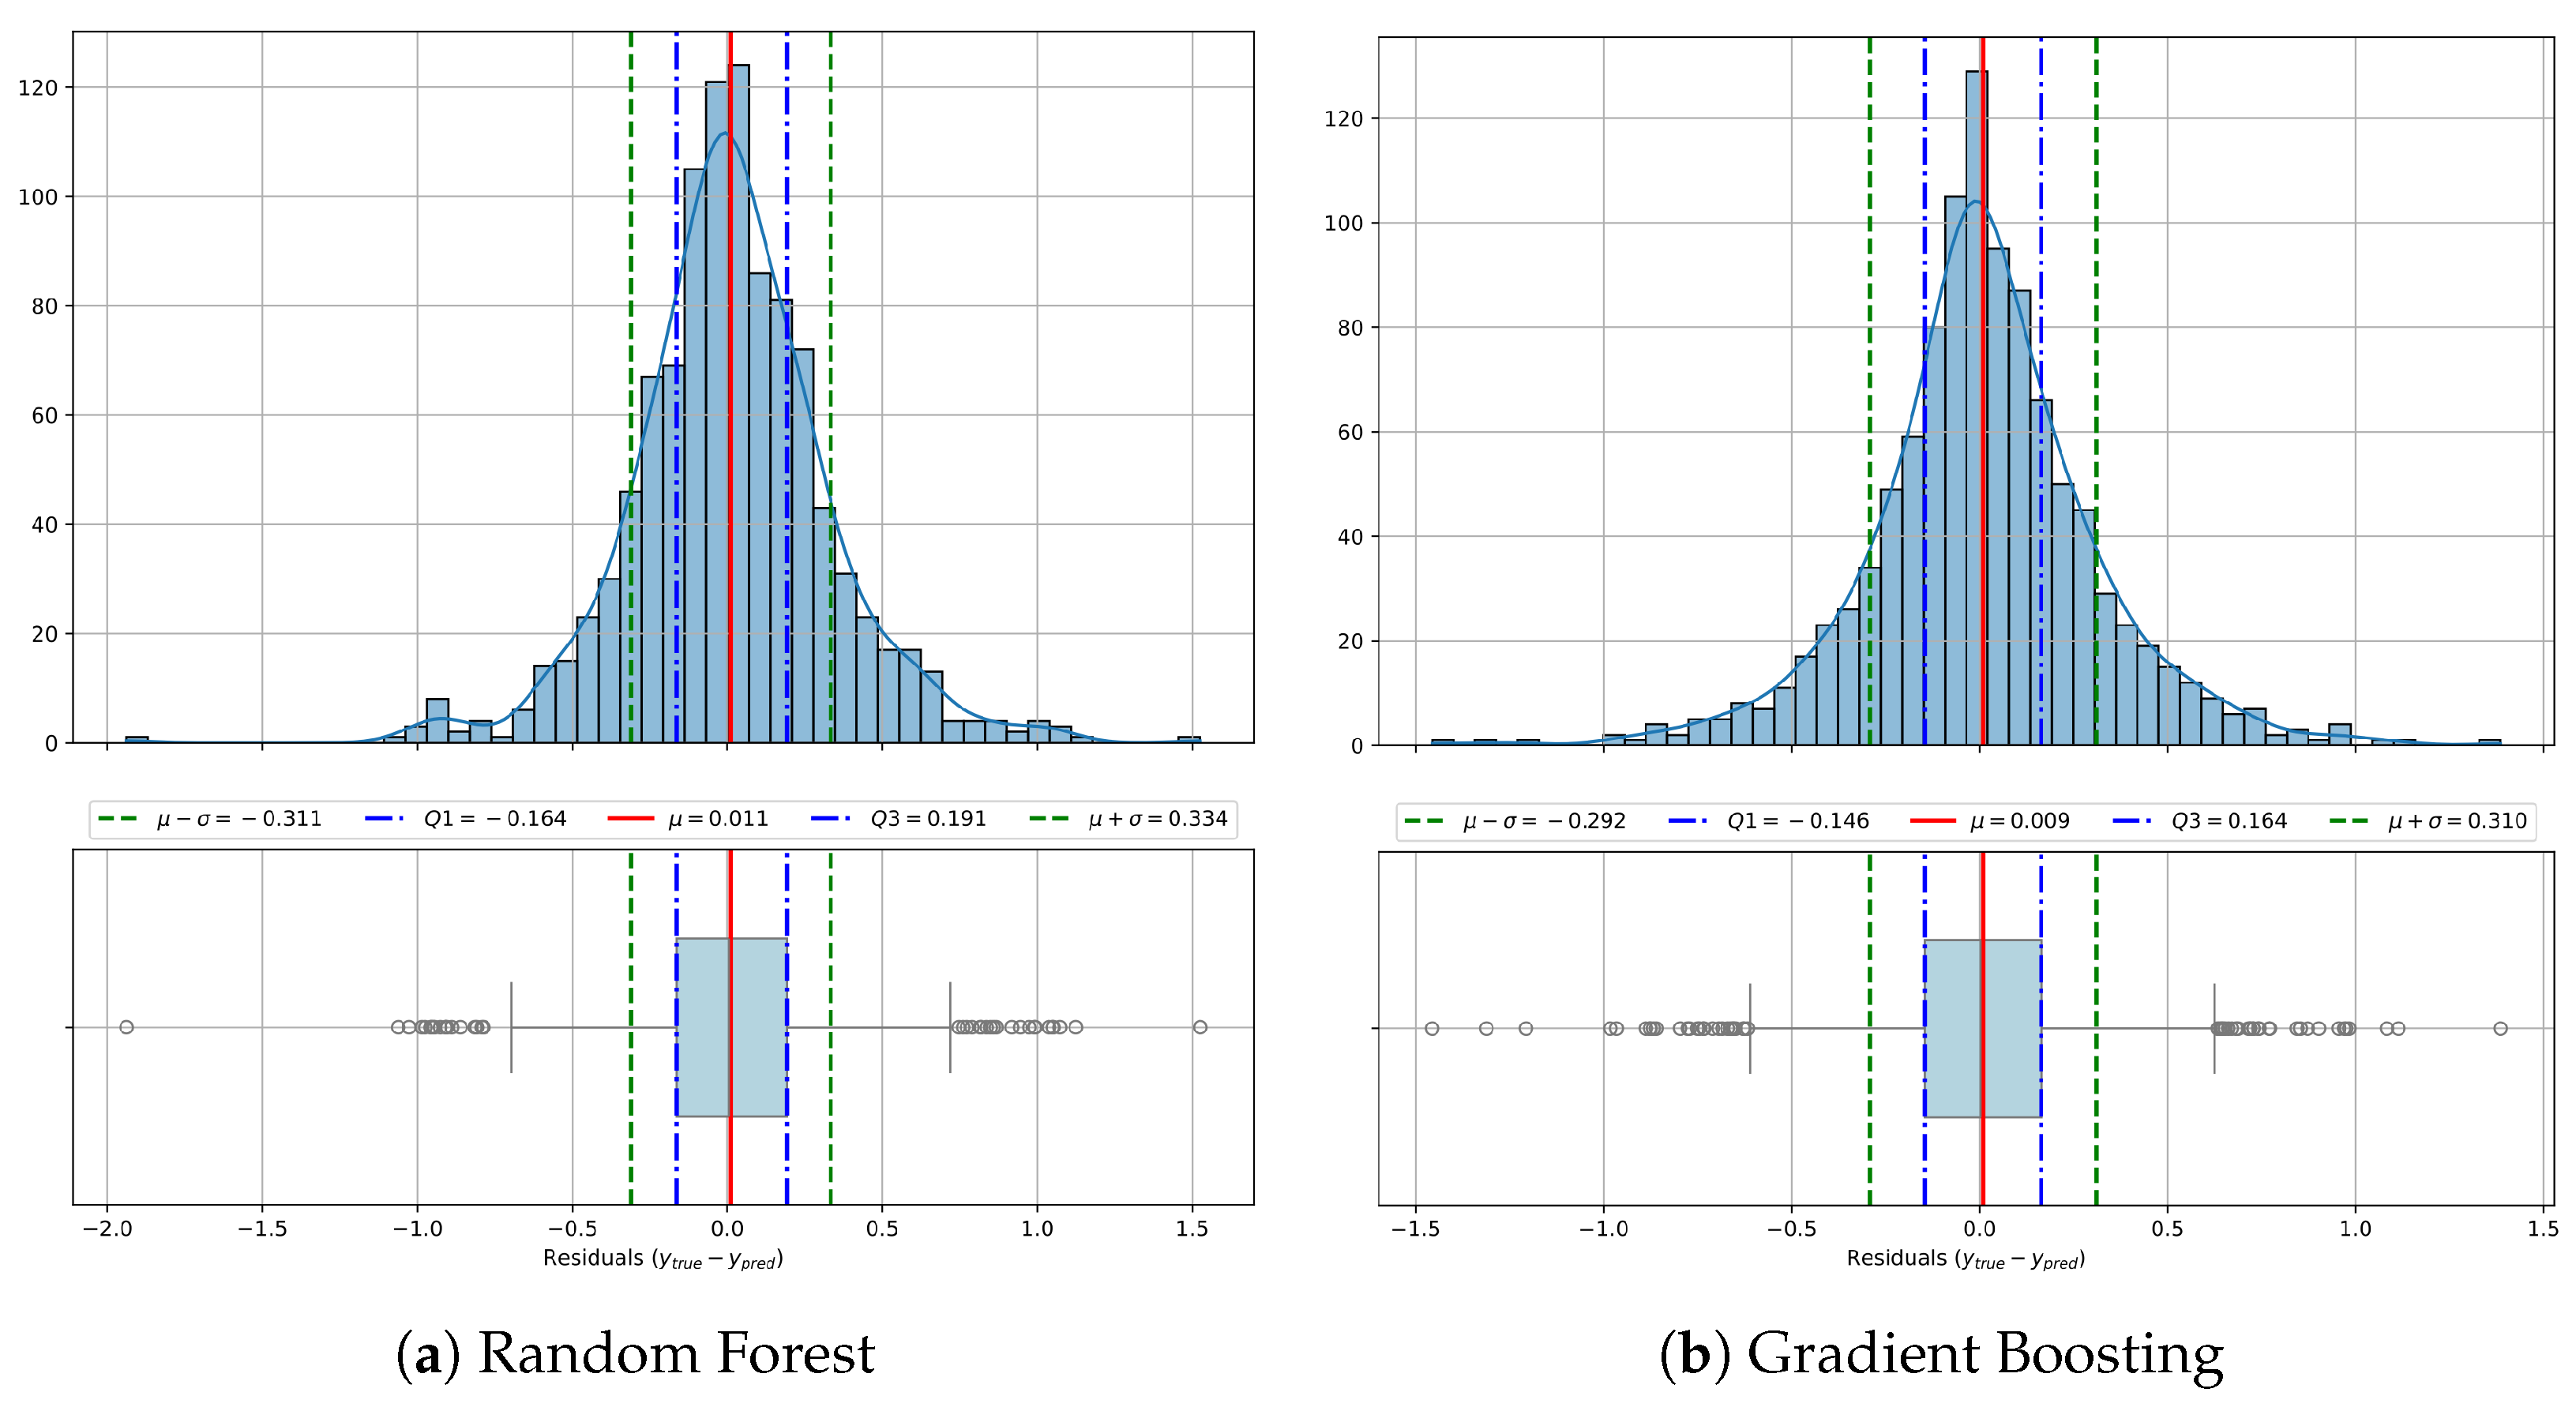
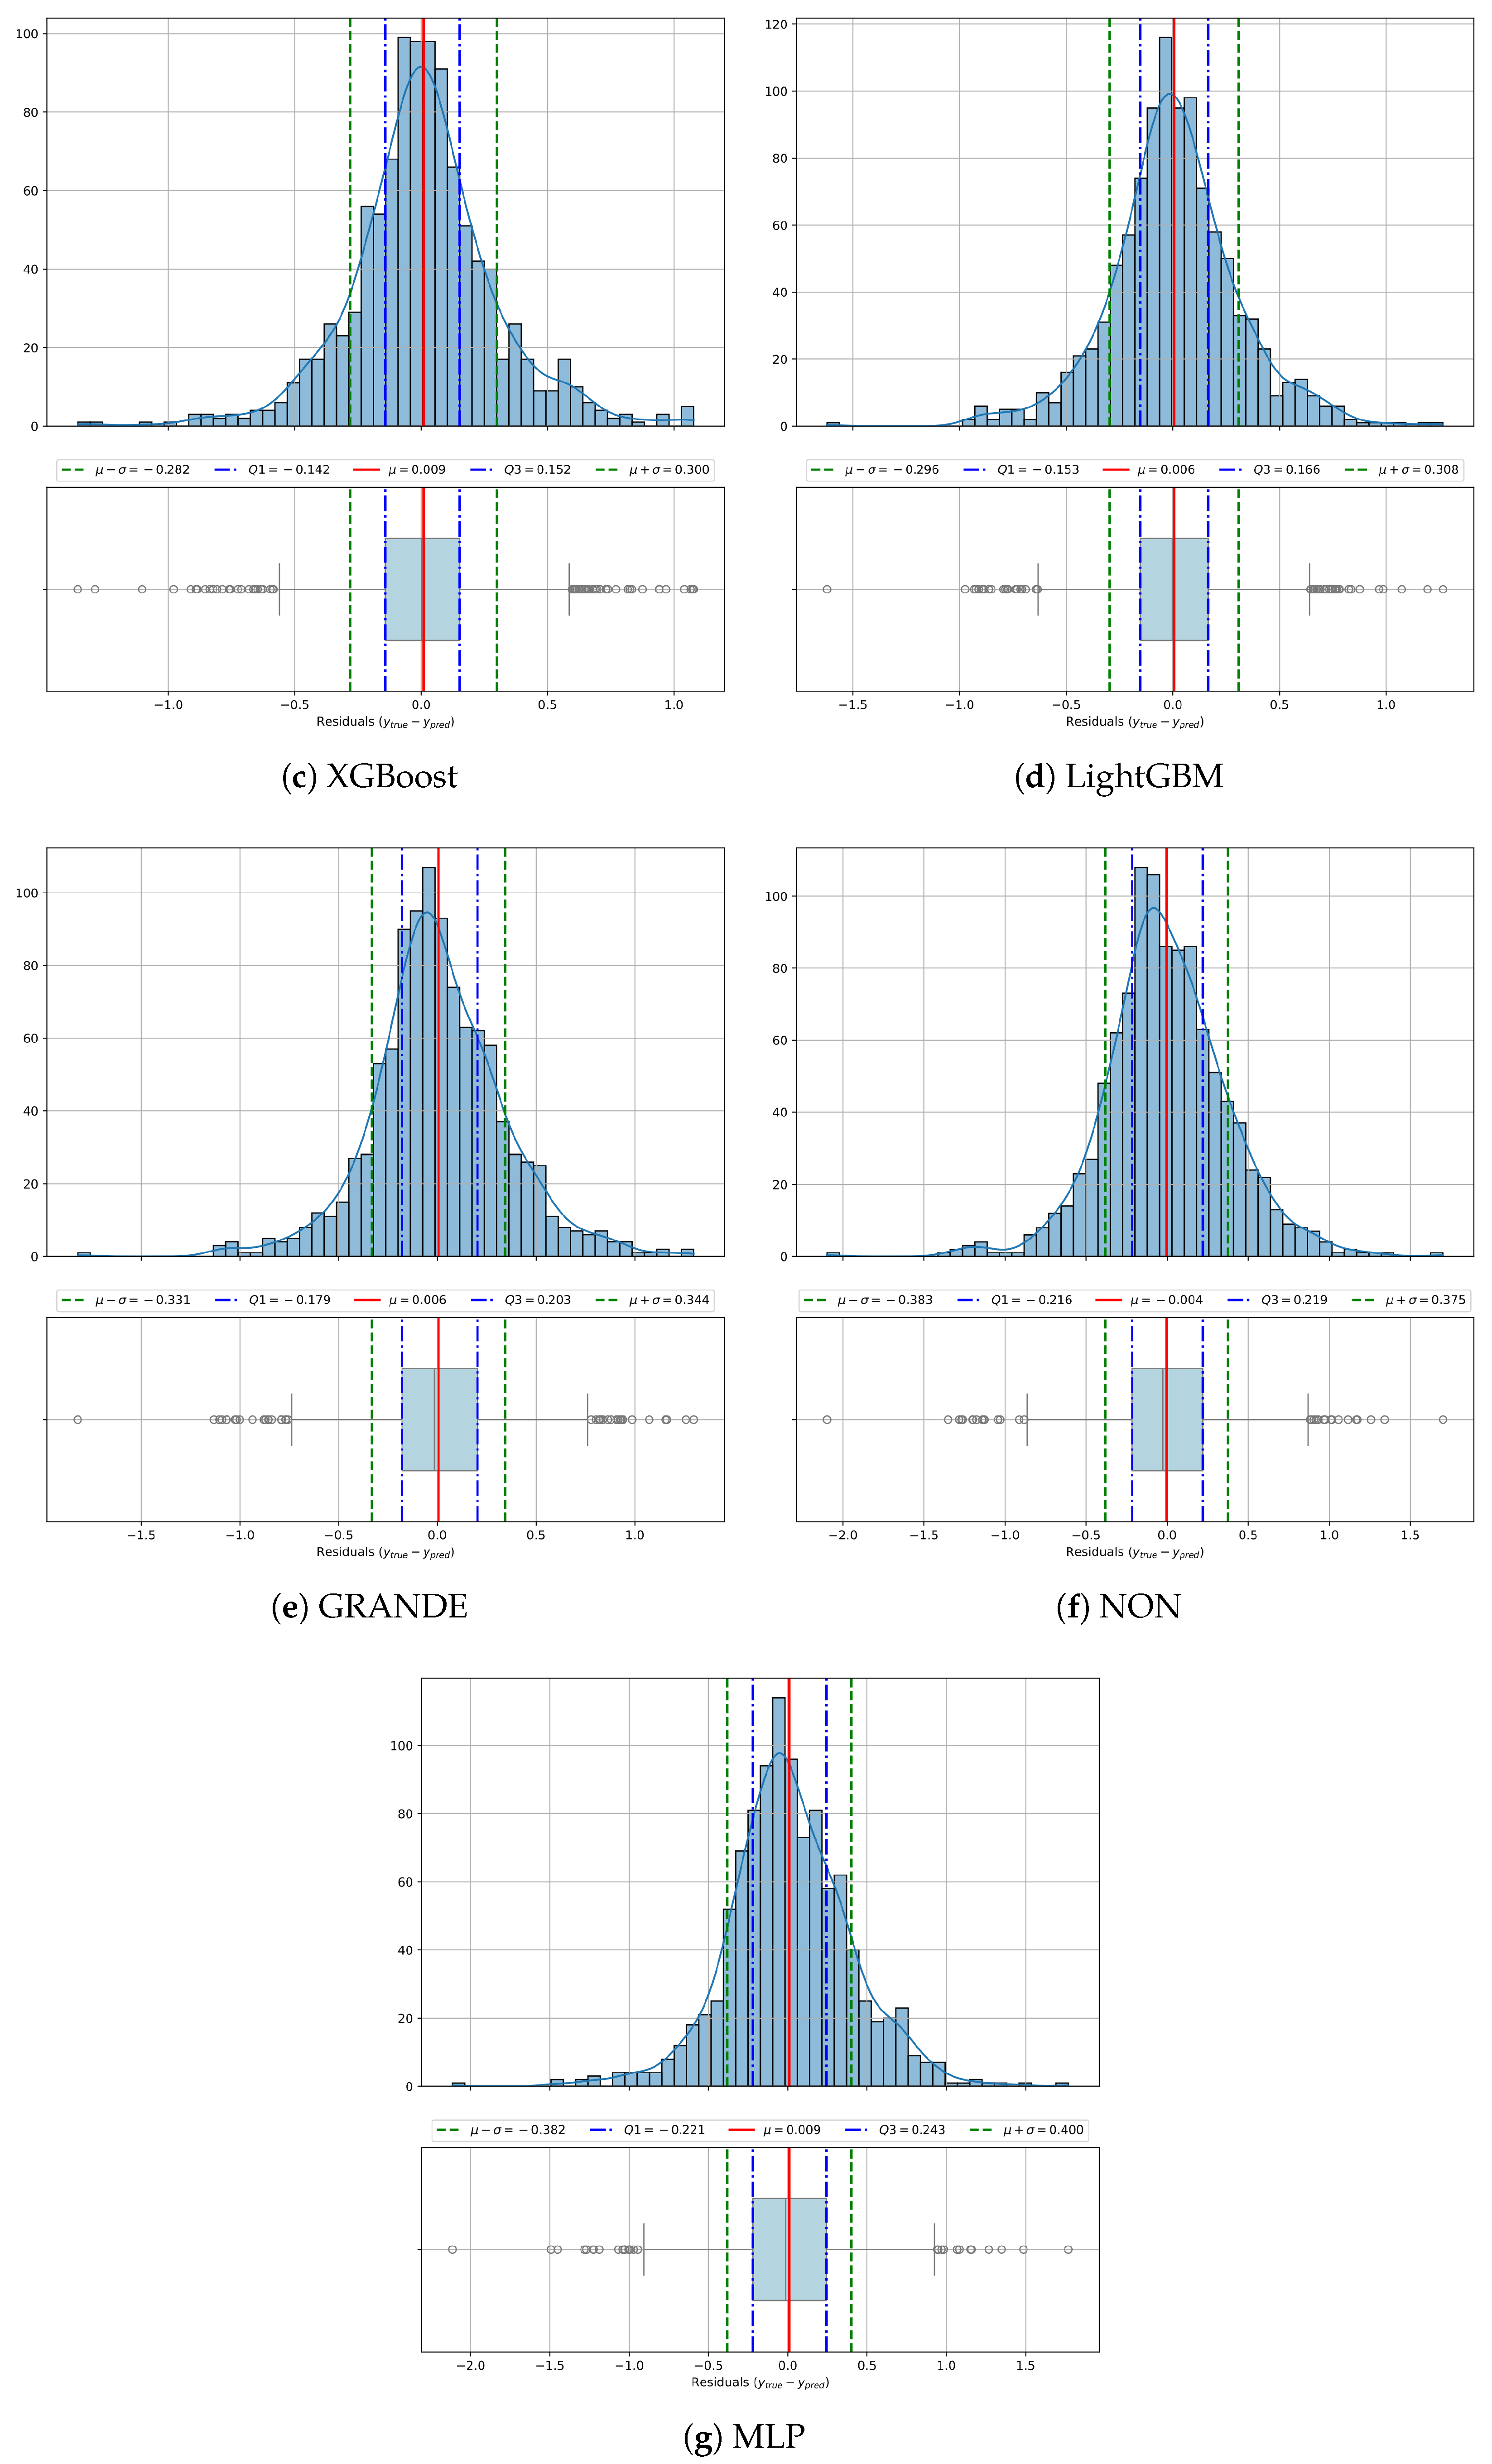
In order to complement the scatter plot analysis and gain deeper insight into the reliability and distribution of model errors,
Figure 6 displays residual histograms and box plots for each regression method. These visualizations summarize how the prediction errors of each model are distributed around zero, providing clues about bias, variance, symmetry, and the presence of outliers. A narrow, centered, and symmetric histogram indicates consistent and unbiased performance, while wider or skewed distributions, as well as heavy tails, suggest instability, systematic bias, or sensitivity to certain samples. By comparing the shape, spread, and frequency of outliers across models, we can assess their robustness and error consistency under diverse conditions.
The residual distributions in
Figure 6 provide a more granular perspective on prediction errors across models. Boosted methods once again emerge as the most effective, with XGBoost showing a mean residual close to zero (
), low variability (
), and a narrow interquartile range (
,
), which reflects stable and unbiased predictions with few extreme errors. Gradient Boosting and LightGBM perform similarly, maintaining symmetric error profiles centered near zero, although with slightly wider dispersion (approximately
). Random Forest (
) and GRANDE (
) display broader distributions, pointing to greater error variability and more frequent moderate misestimations. In contrast, NON and MLP exhibit flatter and wider residual curves with more pronounced tails. For example, NON reaches a standard deviation of 0.384, suggesting lower stability in the predictions. MLP also displays a slight negative skew, indicating a tendency to overestimate. These residual patterns support previous observations, confirming that boosted ensembles not only outperform in global metrics but also produce more consistent and reliable predictions on a case-by-case basis.
From an application point of view, these findings are particularly relevant for environmental forecasting and climate policy design. The ability of boosted ensemble methods to produce accurate, stable and well-calibrated predictions, even in the upper range of the temperature distribution, is crucial when modeling the impacts of agricultural CO2 emissions. If warming in high-emission countries is underestimated, the result could be overly optimistic mitigation targets and inadequate policy responses. In contrast, the strong generalization capacity and low prediction bias shown by XGBoost, Gradient Boosting, and LightGBM ensure that national emission variability is faithfully captured in the forecasts. This level of reliability makes these models especially appropriate for supporting scenario analysis, emission benchmarking, and early warning systems, particularly in regions with limited data availability. In sum, the predictive behavior of tree-based ensemble methods aligns well with the demands of climate-sensitive planning, establishing them as valuable tools for environmental impact assessment.
3.2. Model Interpretability
Here, we explore model interpretability through SHAP values and feature importance rankings. Rather than presenting findings model-by-model, this section synthesizes key insights into a comparative analysis that highlights both shared patterns and meaningful differences across algorithms. We begin with the feature importance scores obtained from the tree-based regressors.
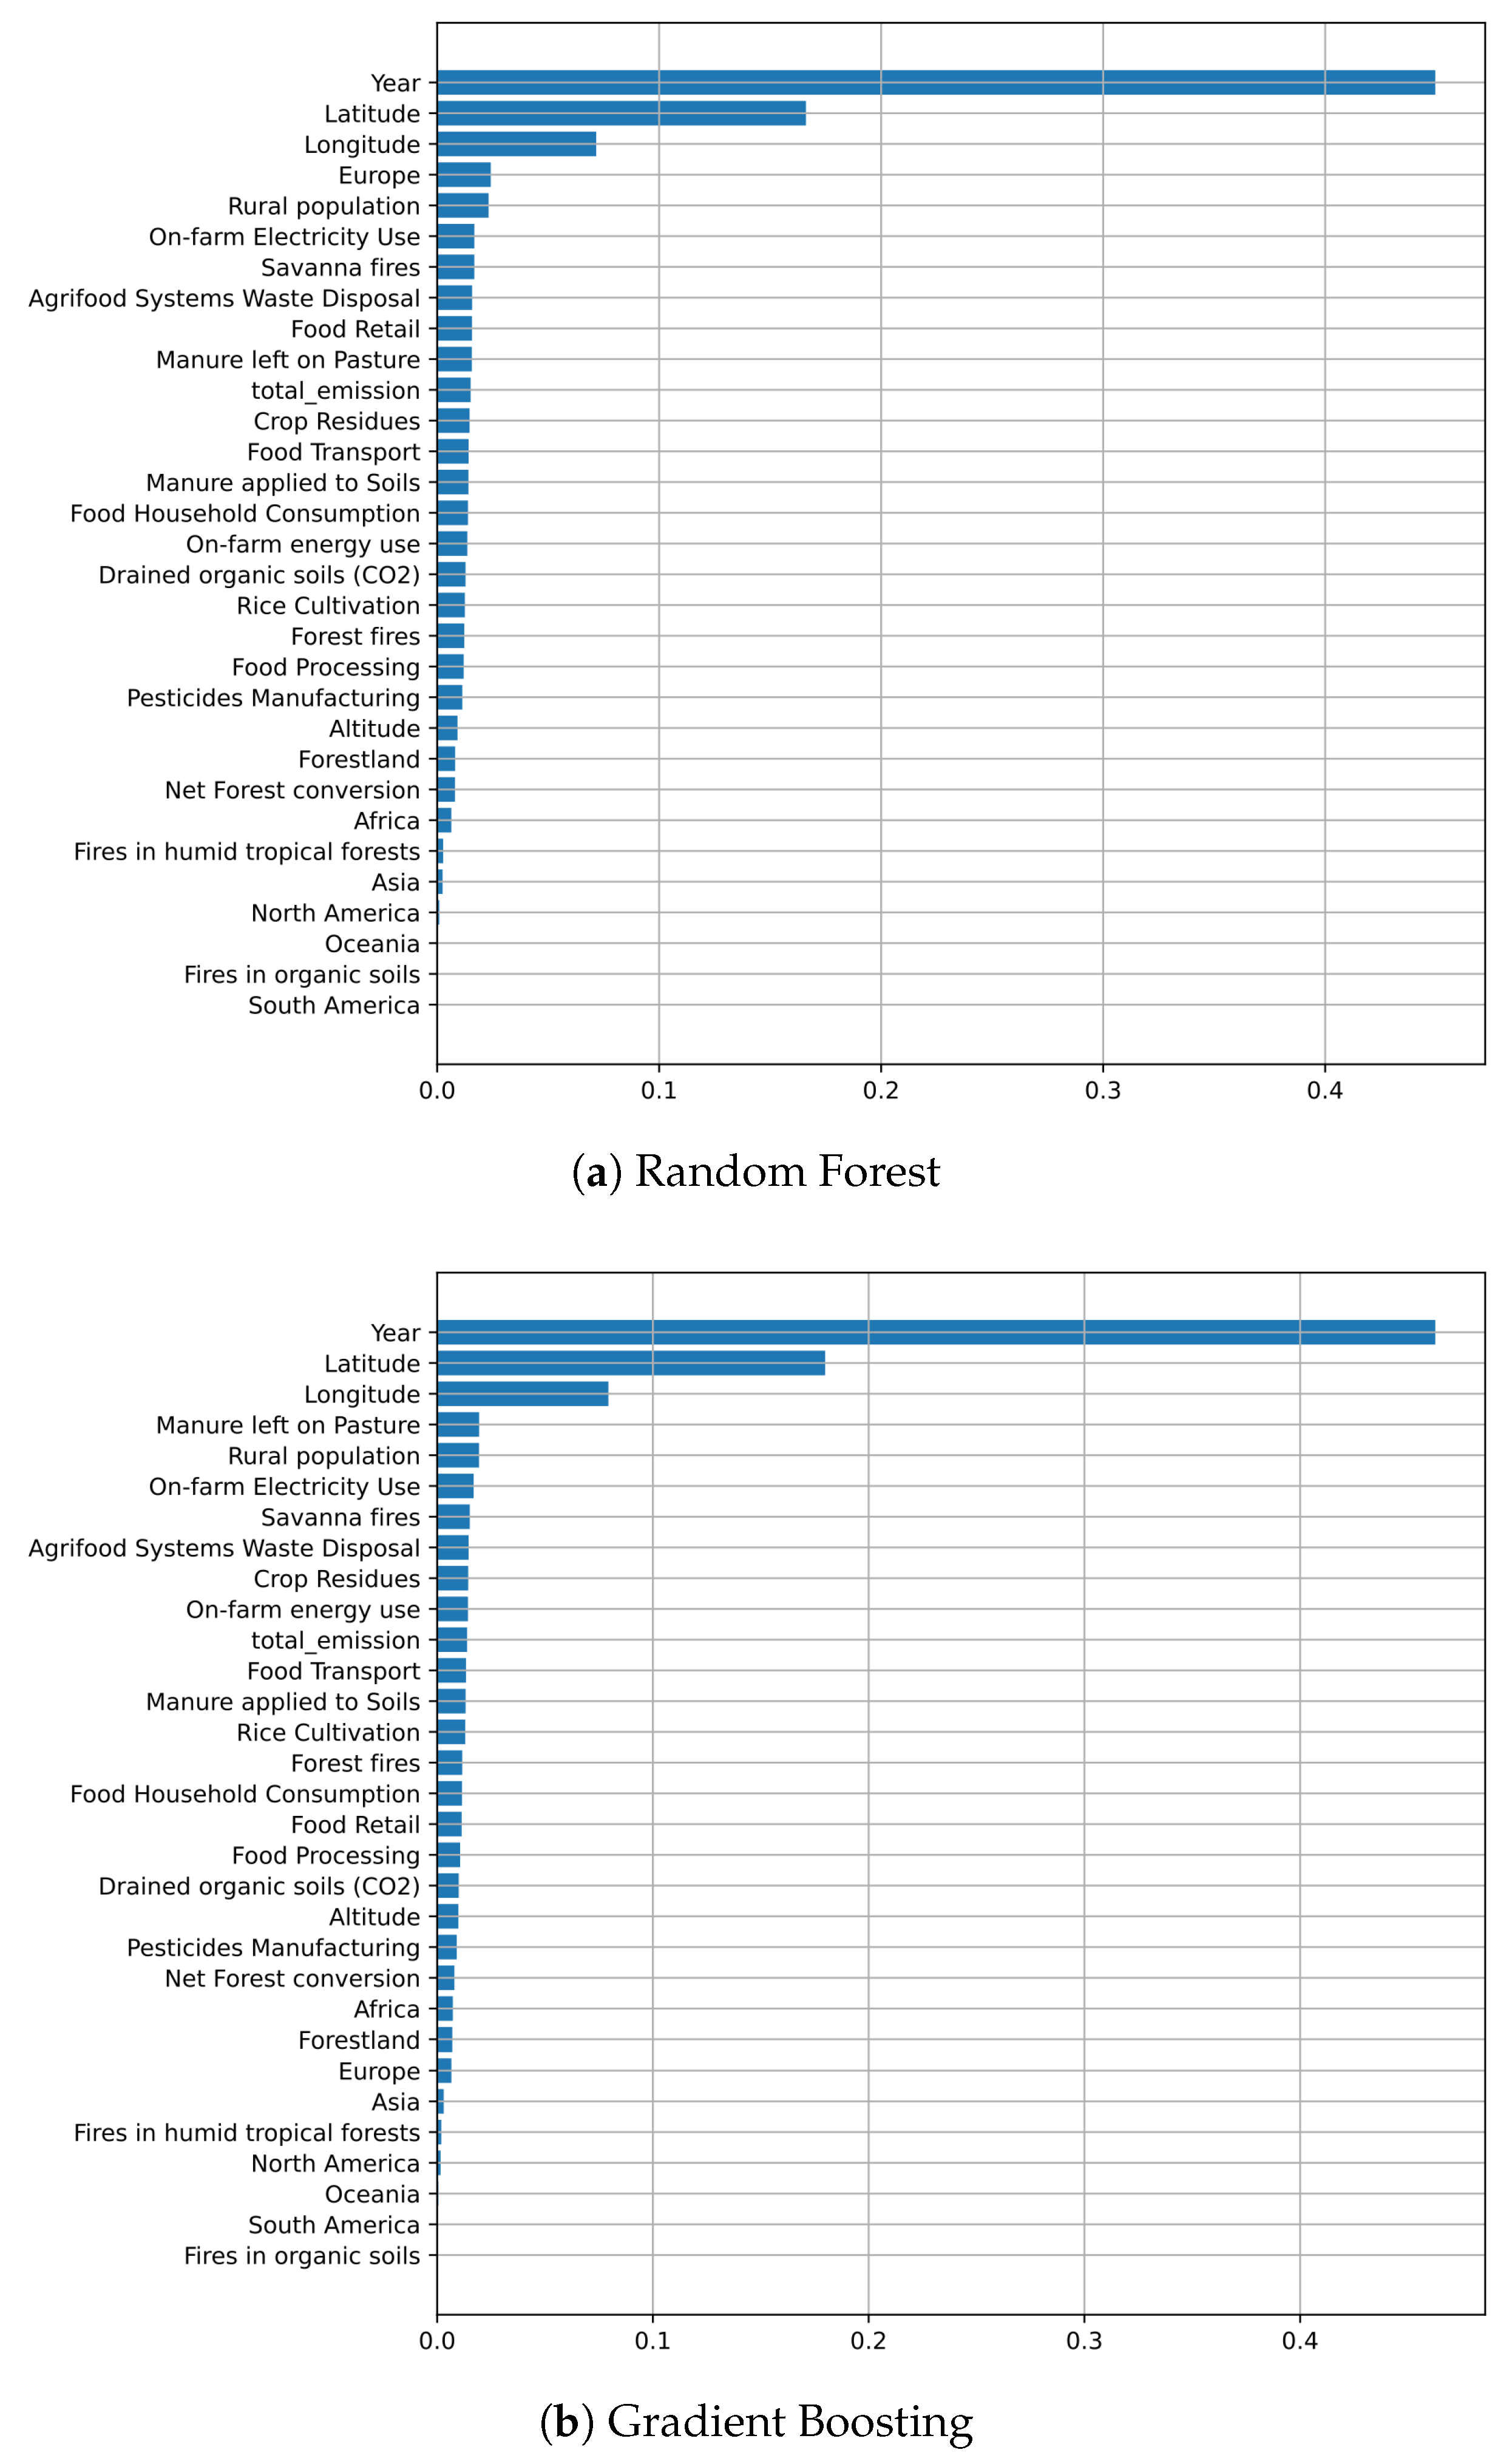
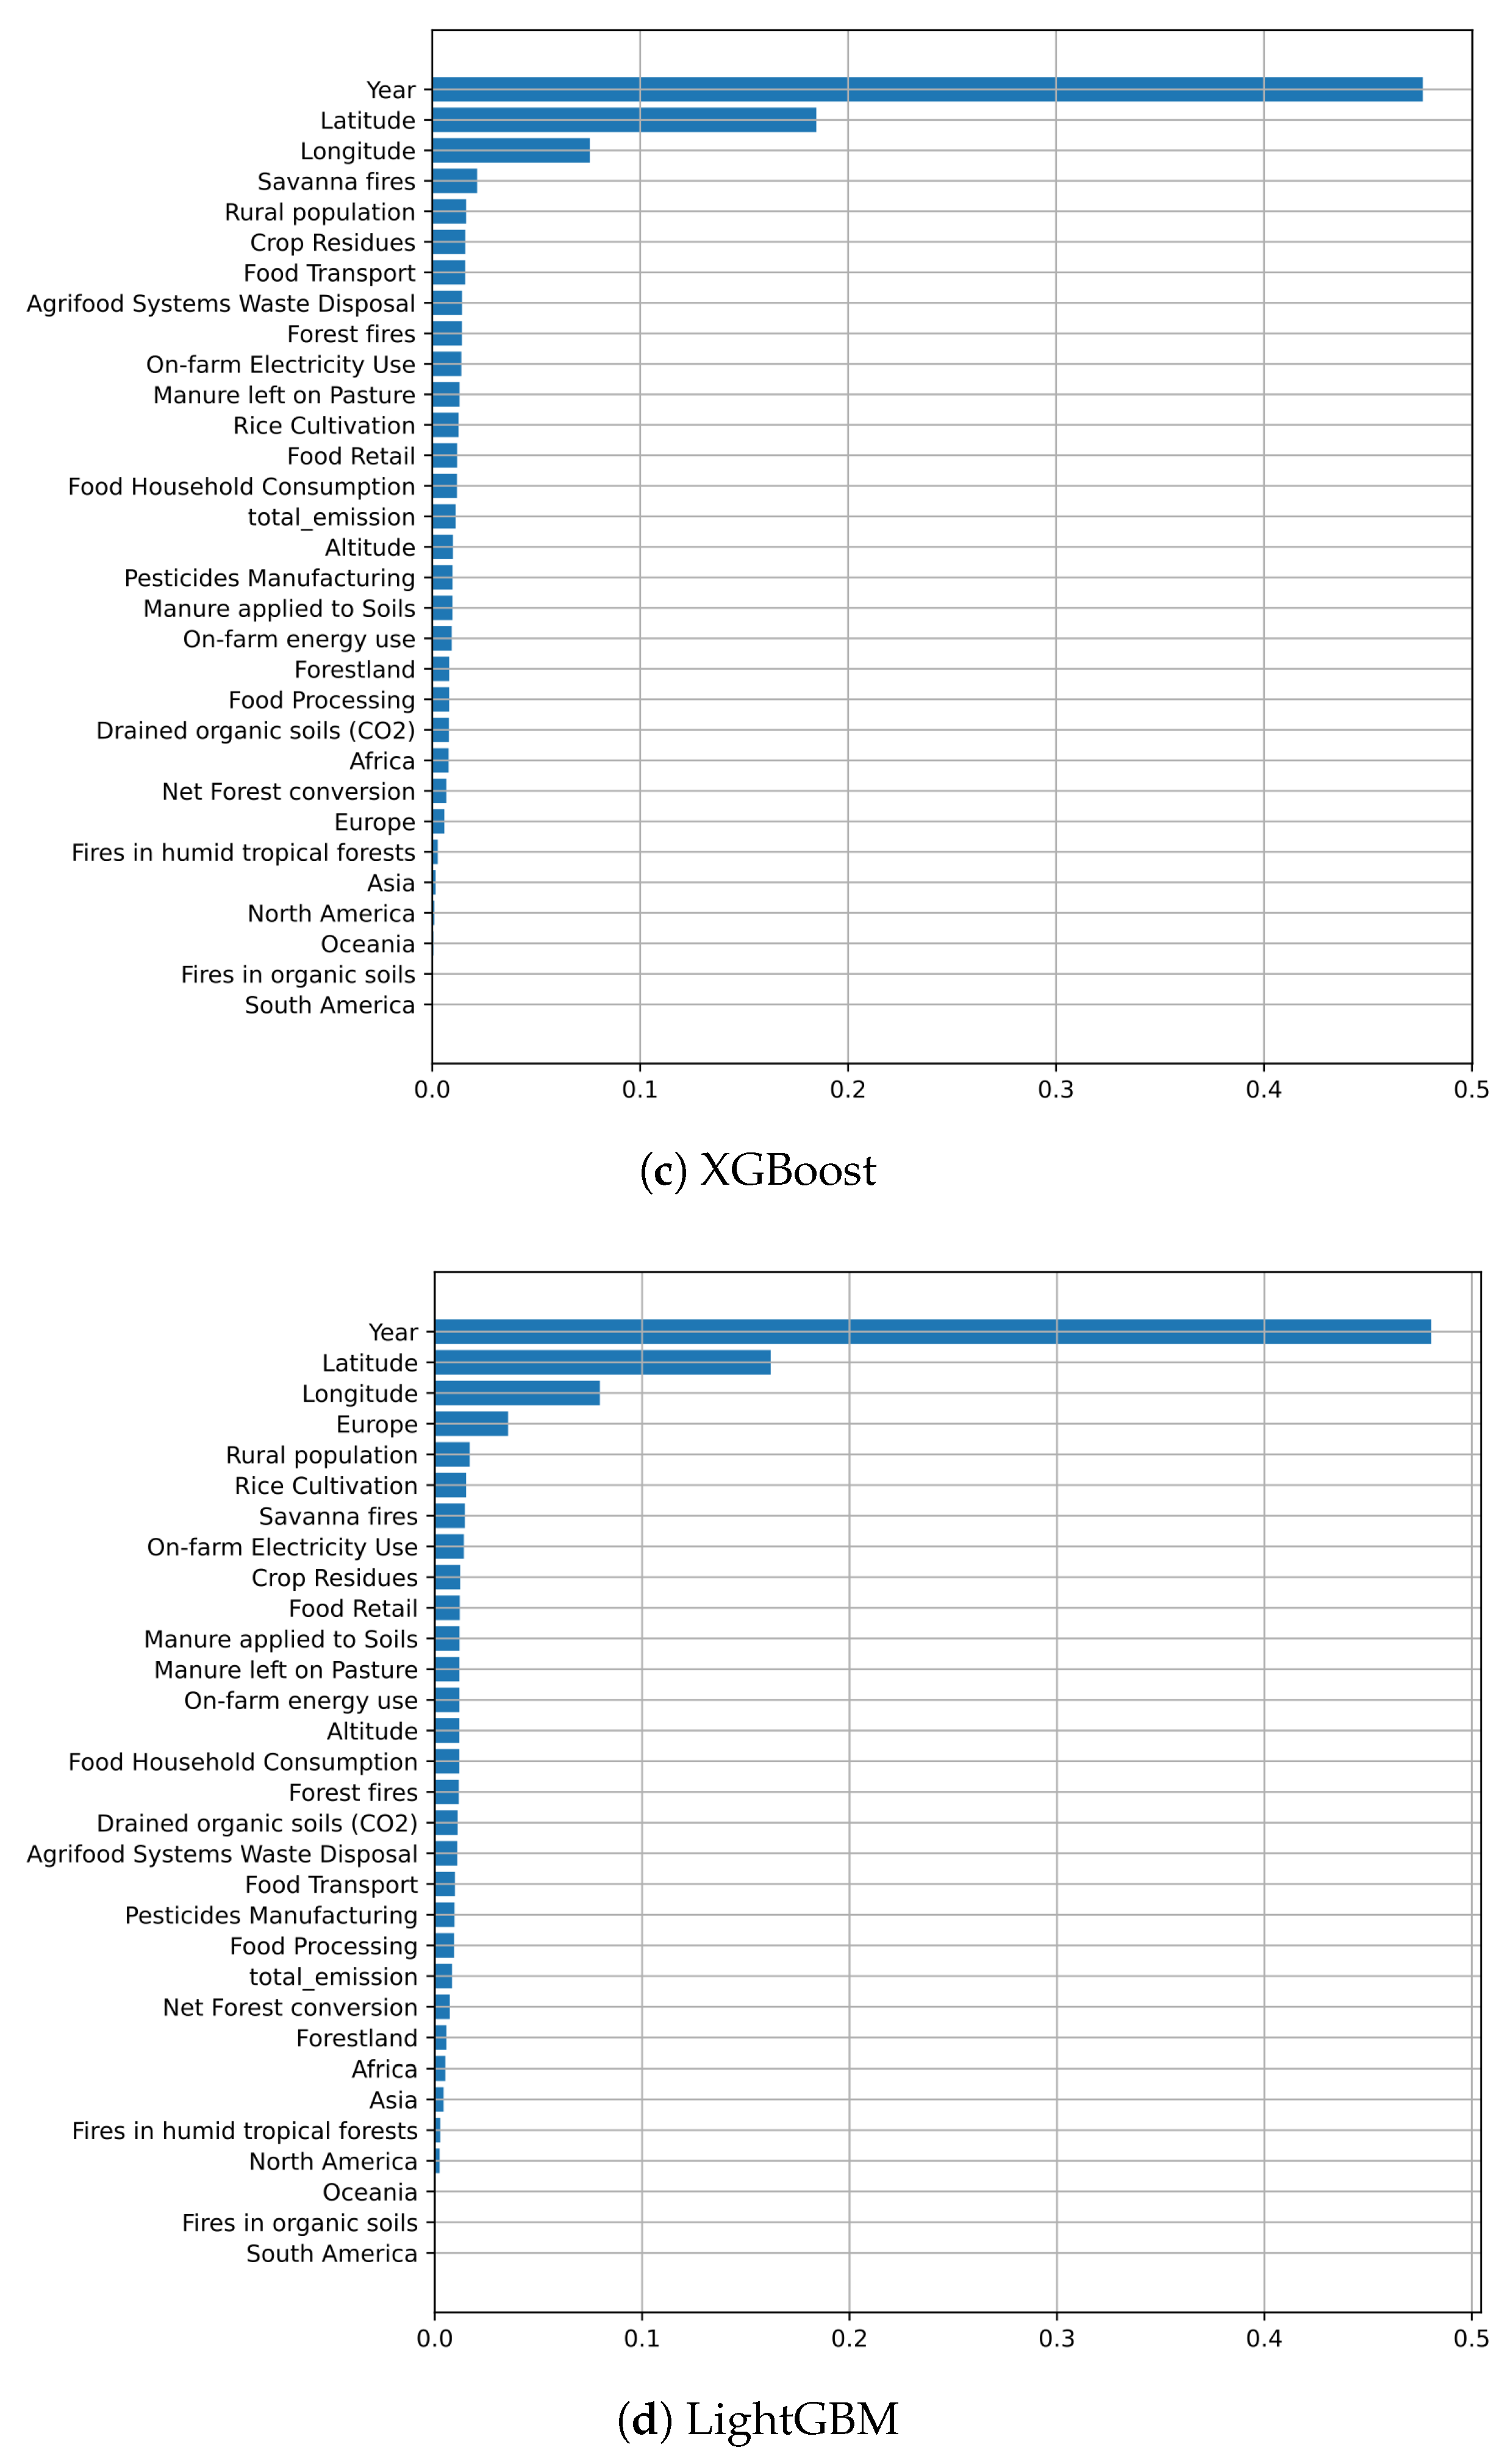
Figure 7 displays the normalized contribution of each input variable to the reduction of impurity during training. This visualization provides a broad perspective on which input categories, such as temporal, spatial, or environmental characteristics, play the most significant role in determining the model predictions. These rankings help to clarify how different types of information influence the learning process and guide the behavior of the ensemble methods.
The feature importance rankings in
Figure 7 exhibit a striking consensus among the tree-based regressors. All models consistently assign the highest importance to temporal and spatial predictors, particularly ‘Year’, ‘Latitude’, and ‘Longitude’. These three characteristics dominate the impurity reduction process in all models, confirming that the general warming trend and geographic location are the main drivers of variation in the annual temperature increase associated with agricultural CO
2 emissions. In contrast, most environmental and sector-specific features, such as ‘Savanna fires’, ‘Crop Residues’, and ‘Rice Cultivation’, occupy lower ranks, often contributing less than 5% to the model’s decisions. Some socio-economic features like ‘Rural population’ or ‘On-farm Electricity use’ register modest importance in select models, but generally remain secondary. This pattern suggests that, while granular environmental factors may shape local emission profiles, it is the broader spatio-temporal structure that most effectively informs predictive modeling in this domain. It is crucial to note that this dominance does not imply that simpler, linear models are sufficient. On the contrary, it reinforces the need for the advanced models benchmarked in this study. The high predictive performance is achieved precisely because these ML models, unlike linear ones, can capture the critical, non-linear interactions between the dominant spatio-temporal drivers and the secondary, sector-specific features.
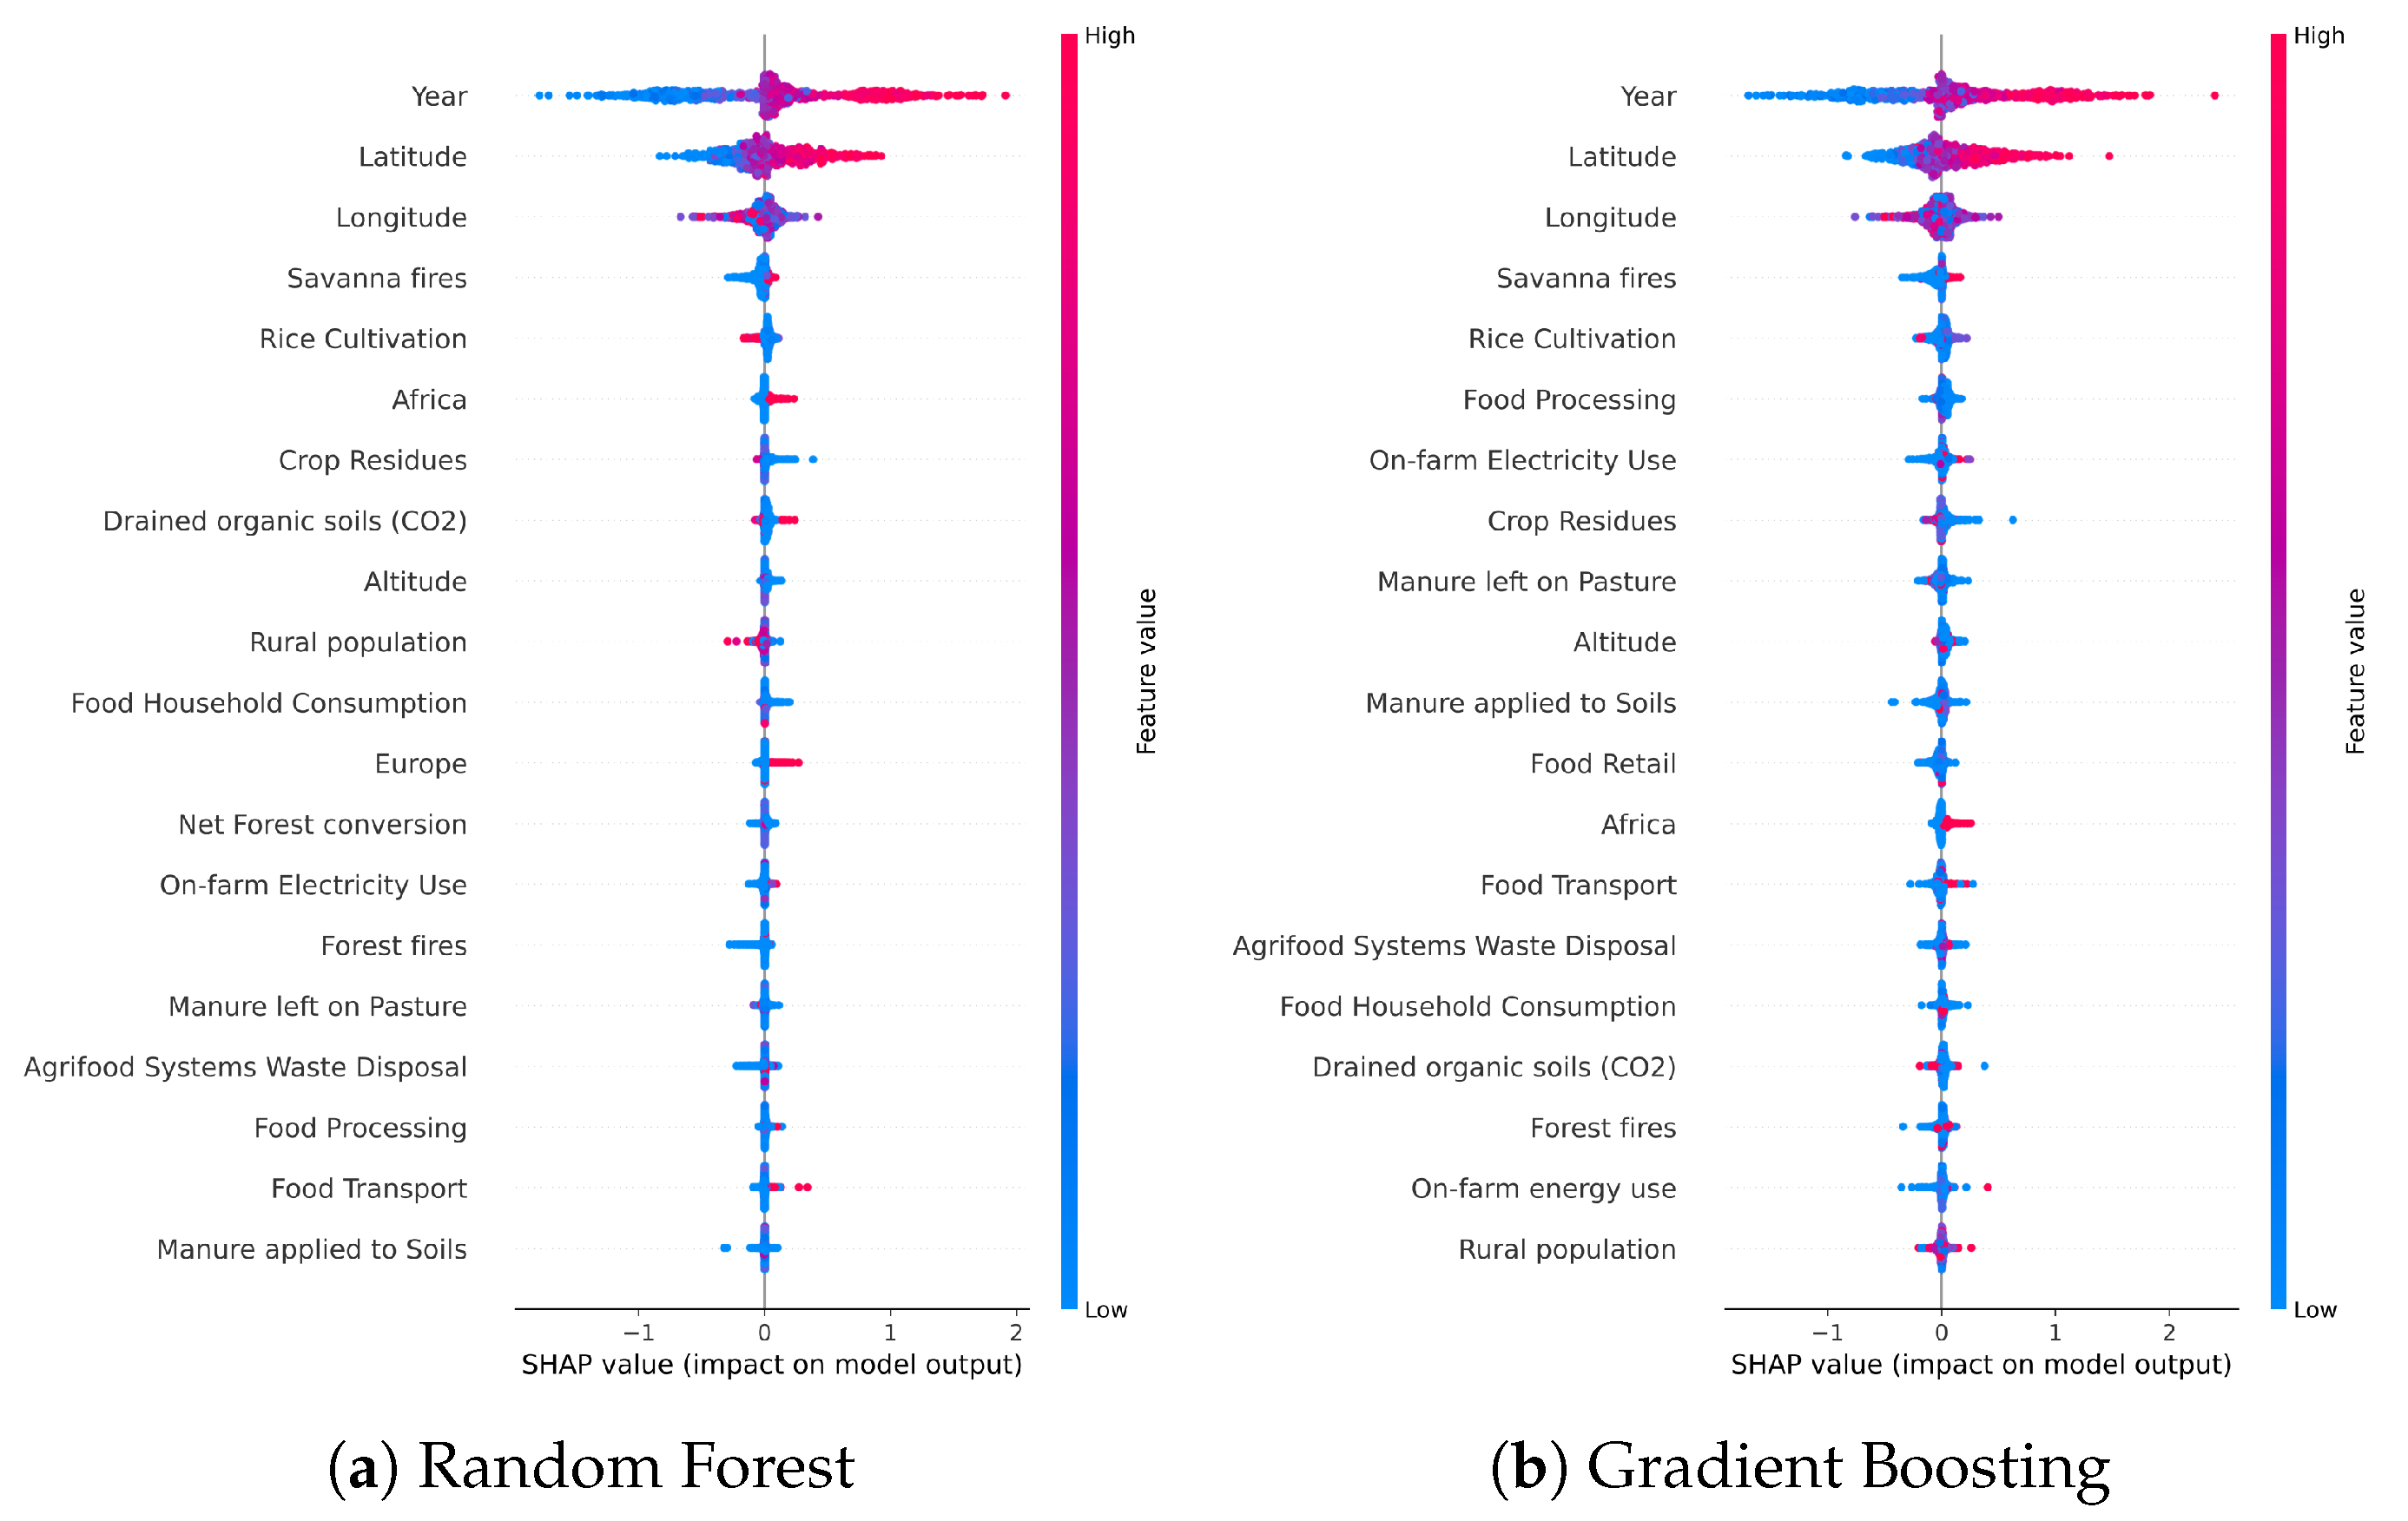
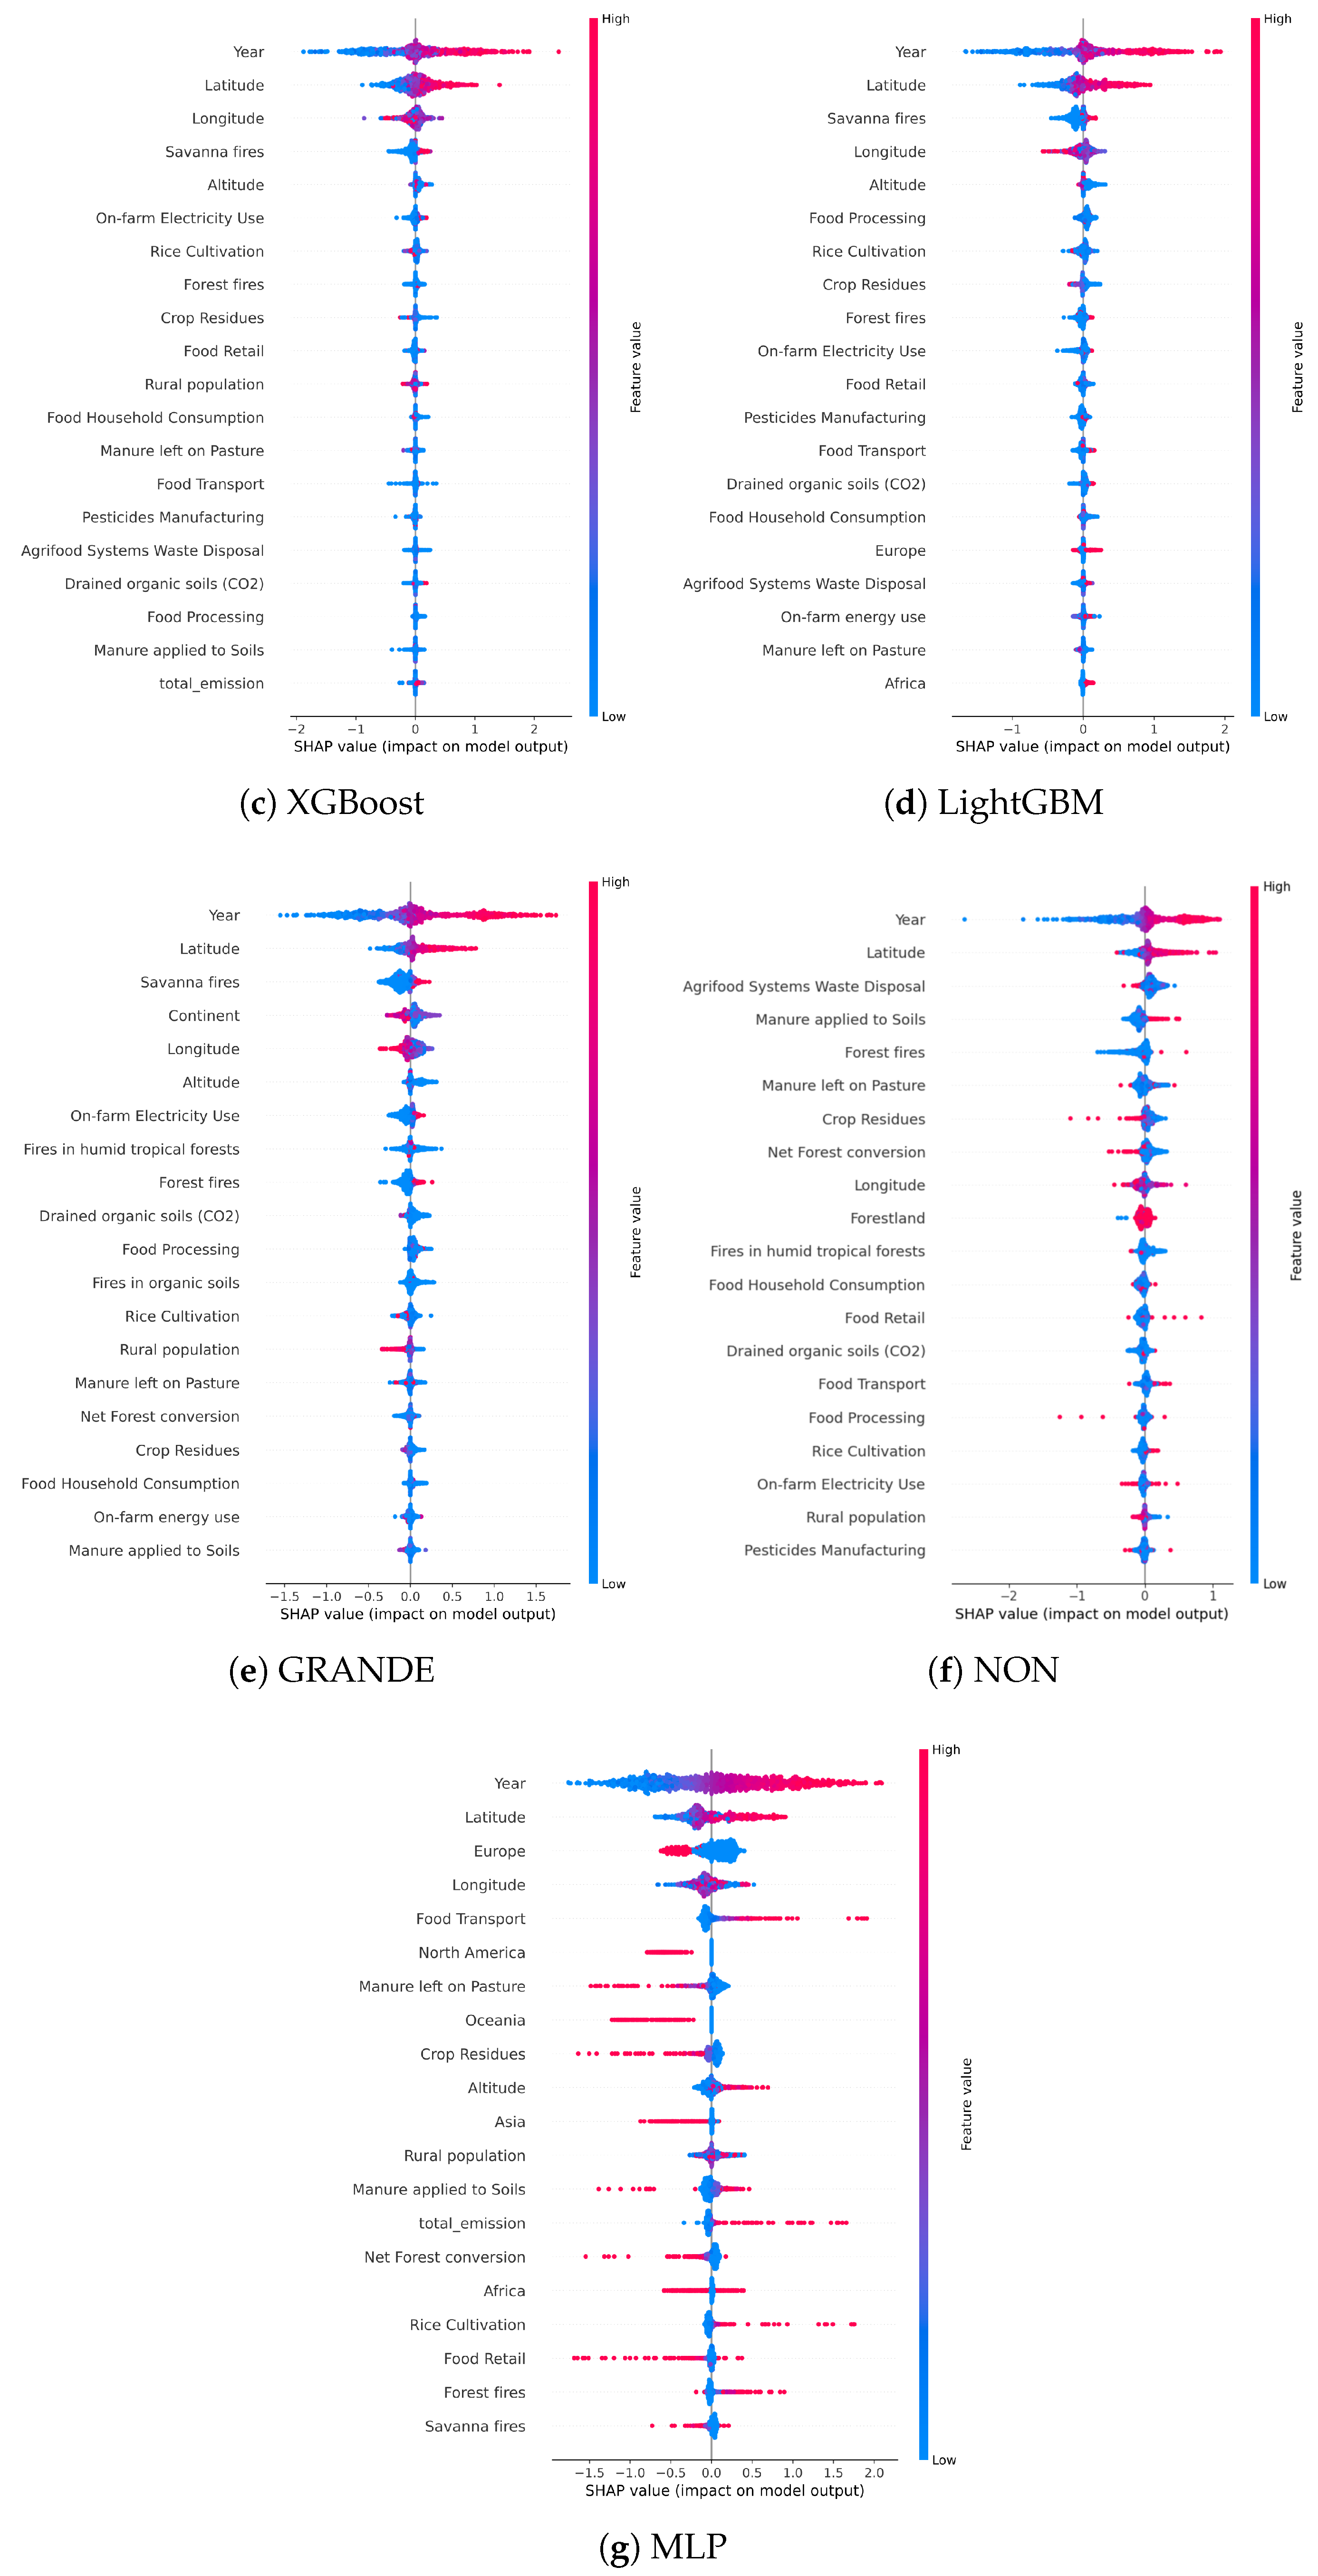
To broaden the interpretability analysis and include all model types, we next examine SHAP values. While traditional feature importance metrics are only applicable to tree-based models, SHAP offers a unified, model-agnostic framework that attributes each prediction to specific input features. This is particularly useful for understanding the behavior of neural networks such as NON and MLP, where native importance rankings are not available.
Figure 8 presents SHAP summary plots for each regressor, highlighting both the magnitude and direction of feature contributions. These visualizations help identify not only which variables matter most, but also how they interact with predictions across different value ranges.
The SHAP diagrams in
Figure 8 provide a detailed and comparative view of feature contributions across models, revealing not only consistent trends but also subtle differences in how each algorithm processes the input data. As previously observed, ‘Year’, ‘Latitude’, and ‘Longitude’ consistently emerge as the most influential variables, reaffirming the dominant role of spatiotemporal context in shaping predictions of agricultural CO
2-induced warming. However, the SHAP distributions offer further nuance. In models such as XGBoost and NON, the broad range of SHAP values associated with ‘Year’ suggests that temporal dynamics exert varying degrees of influence depending on architecture. ‘Longitude’ frequently displays high variance, symmetric spreads (particularly in LGBM and Random Forest), hinting at complex regional interactions or latent feature entanglement. Environmental features including ‘Savanna fires’, ‘Rice Cultivation’, and ‘On-farm Electricity use’ exhibit stronger and more directional impact in GRANDE, NON, and MLP, indicating their importance in models with higher capacity for local or nonlinear structure. In contrast, tree-based models consistently downplay these variables, perhaps due to the dominance of stronger global signals. Socio-demographic and categorical features such as ‘Europe’, ‘North America’, and ‘Oceania’ show wide SHAP dispersions in neural networks, supporting the idea that these architectures integrate regional encodings to capture latent economic and institutional variation. Additionally, variables like ‘Food Transport’ and ‘Manure left on Pasture’ contribute meaningfully to MLP, and ‘Agrifood Systems Waste Disposal’ and ‘Manure applied to Soils’ show strong positive impact in NON, reflecting broader agri-environmental system effects. The feature ‘Rural population’ exhibits high directional variance, sometimes boosting predictions, sometimes damping them, underscoring its entangled role across models. Similarly, ‘Altitude’ appears with a consistent, though weak, negative contribution in several regressors, likely reflecting indirect effects related to land use or elevation patterns. Finally, while intuitively relevant, variables such as ‘Forest fires’ or ‘Crop Residues’ remain marginal across models, suggesting redundancy or multicollinearity with more dominant inputs. Together, these insights reaffirm that boosted trees excel at isolating strong global predictive signals, while deep networks can capture more context-specific or interaction-driven relationships, offering complementary perspectives on the drivers of warming.
All these interpretability findings reinforce the practical value of combining high-performance models with transparent diagnostics. For stakeholders involved in climate-sensitive planning (such as agricultural ministries, environmental agencies, or international policy bodies), the ability to trace predictions back to specific regional, environmental, or temporal factors is crucial. The prominence of spatio-temporal features across models confirms the importance of location and trajectory in emission forecasting, while the selective sensitivity of neural networks to localized or sector-specific variables suggests their utility in exploratory analysis or targeted intervention design. Importantly, SHAP results help identify not only the dominant predictors but also those whose impact varies significantly between models or contexts, such as ‘Rural population‘ or ‘Savanna fires’. These signals can guide data collection priorities, improve scenario testing, and enhance trust in model outputs by making their behavior more intelligible to non-technical decision-makers. Ultimately, interpretability is not merely a diagnostic tool, it is a bridge between technical modeling and actionable climate strategy.
3.3. Case Analysis: Iran vs. Global
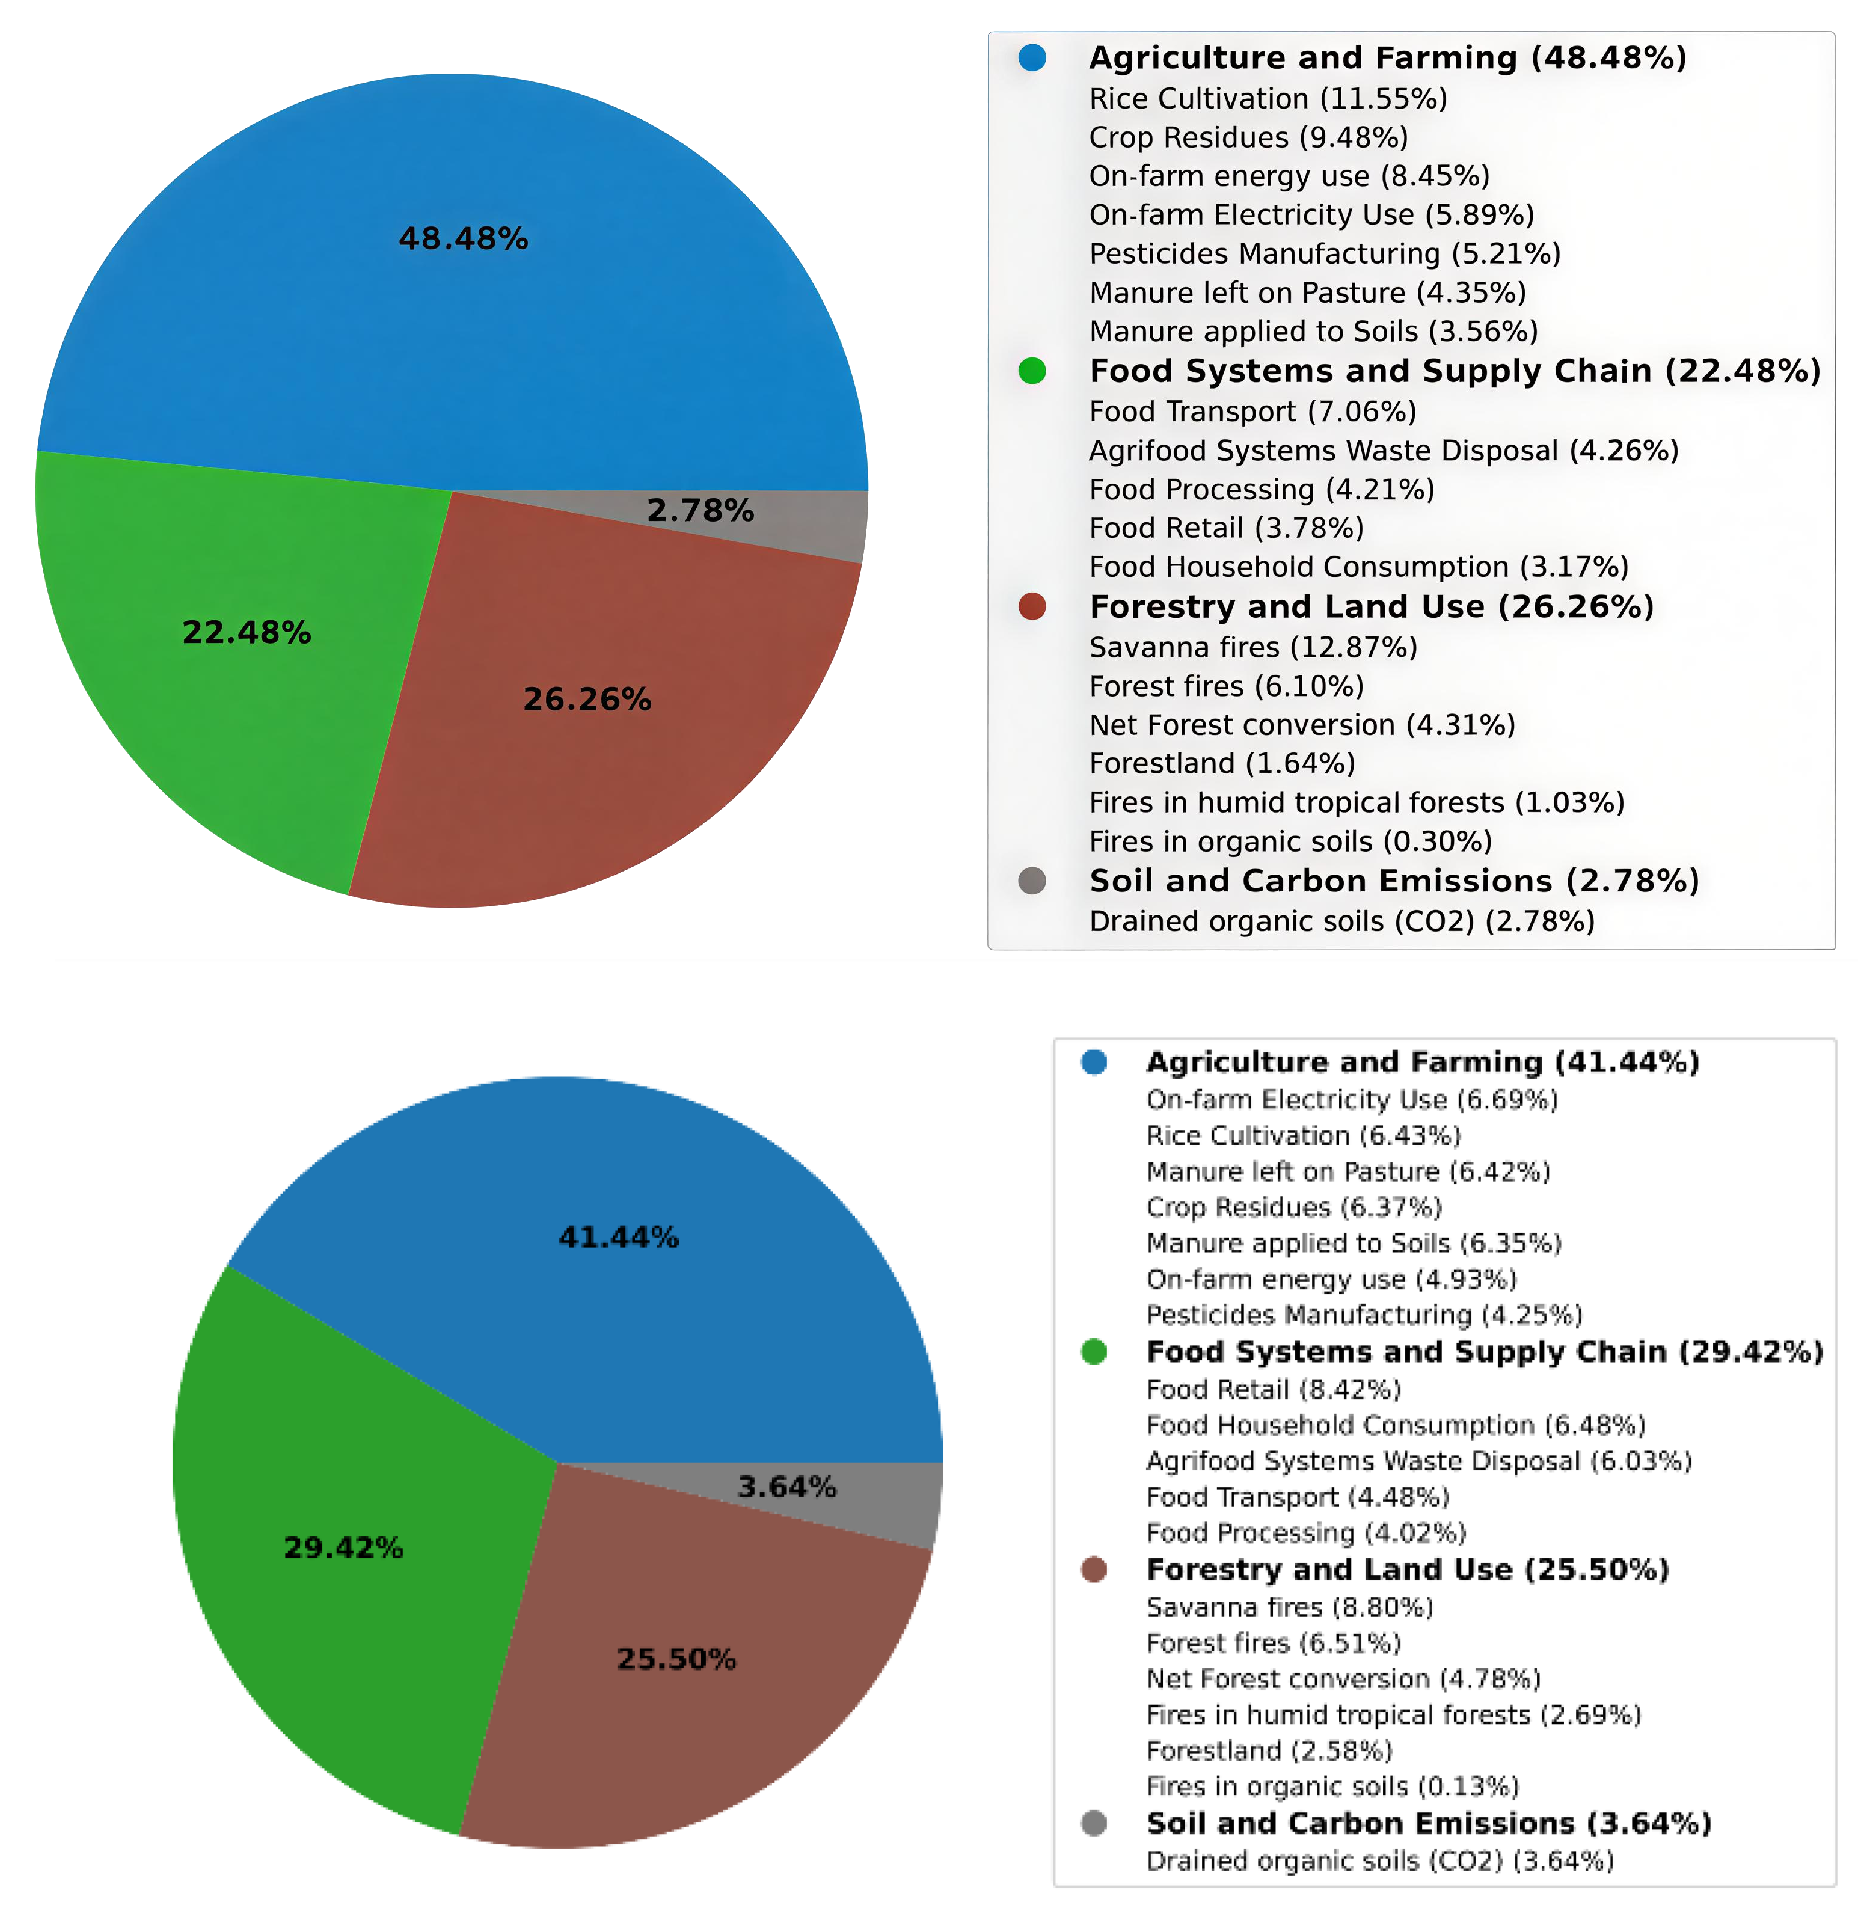
While the previous sections focused on global modeling and interpretability trends, this subsection provides a focused case study of Iran. Given its status as a top greenhouse gas emitter and its unique agroenvironmental profile, Iran offers a compelling opportunity to assess how national characteristics diverge from global patterns. To that end, we analyze the distribution of feature importance derived from mean normalized SHAP values in the XGBoost model, contrasting Iran-specific samples against global trends. These contrasts are visually summarized in
Figure 9, which displays the relative contribution of grouped environmental characteristics to temperature predictions for Iran (top) and the global dataset (bottom).
The analysis highlights marked contrasts in the forces that shape temperature change at national and global scales. In the Iranian case, agriculture is clearly the dominant factor: the variables linked to this sector explain 48.48% of the model’s output, well above the 41.44% observed worldwide. Much of this gap is due to the weight of ‘Rice Cultivation’, which alone contributes 11.55%—almost double the influence of the next agricultural variable, ‘Crop Residues’. The figure mirrors Iran’s dependence on flooded paddy systems, known for their methane release, and on other water-intensive crops. Energy inputs compound the picture: both ‘On-farm energy use’ and ‘On-farm Electricity Use’ carry greater importance in Iran than in the global set, signaling persistent inefficiencies in farm power systems.
The supply chain shows an inverse pattern. The features grouped under food processing, distribution, and consumption account for just 22.48% in Iran versus 29.42% worldwide. Although ‘Food Transport’ remains the main element in this group for Iran (7.06%), variables such as ‘Food Retail’ (3.78%) and ‘Household Consumption’ (3.17%) make only a modest appearance. This aligns with the relatively centralized and less consumer-driven food networks of the country, where shorter supply chains can reduce the relative weight of downstream activities.
Land use dynamics show a similar aggregate weight in both contexts: 26. 26% for Iran and 25. 50% globally, but the underlying composition differs significantly. In Iran, the attribution of models is dominated by ‘Savanna Fires’ (12.87%), a striking figure given the limited extent of the true ecosystems of the savannas in the country. This may reflect rangeland burning practices or inconsistencies in spatial classification. In contrast, the global profile distributes importance more broadly across ‘Tropical Forest Fires’ and ‘Net Forest Conversion’, reflecting well-documented deforestation dynamics in tropical regions.
Soil-related emissions play a minor role in both settings, although the category is 31% less prominent in Iran (2.78%) than globally (3.64%). This reduction is mainly due to the minimal relevance of ‘Drained Organic Soils’, which are uncommon in Iran’s arid landscapes. Other soil-associated variables, such as ‘Manure left on Pasture’ and ‘Manure applied to Soils’, also show lower importance in Iran, suggesting different fertilization practices or land use configurations relative to global norms.
A closer look confirms that Iranian emissions are more concentrated in a limited number of dominant sources. In particular, ‘Rice Cultivation’ and ‘On-farm energy use’ together account for over 40% of the agriculture-related attribution, while the global distribution is more diffuse across a broader set of contributing variables, each with lower individual weights. Similarly, the reduced contribution of ‘Food Retail’ and ‘Household Consumption’ reflects shorter supply chains and limited cold chain infrastructure—features that, if modernized, could increase emissions unless accompanied by robust efforts to decarbonize.
In sum, Iran’s attribution profile reflects structural and agroecological particularities: the reliance on water-intensive cropping systems, centralized food logistics and energy-intensive farming practices differentiates it from global averages. Effective mitigation strategies should therefore prioritize irrigation efficiency, electrification and upgrading of farm equipment, and decentralization of food distribution networks. At the same time, convergence with international priorities, such as sustainable land management, improved manure handling, and improved supply chain efficiency, is essential to achieve integrated climate goals.
3.4. Error Analysis
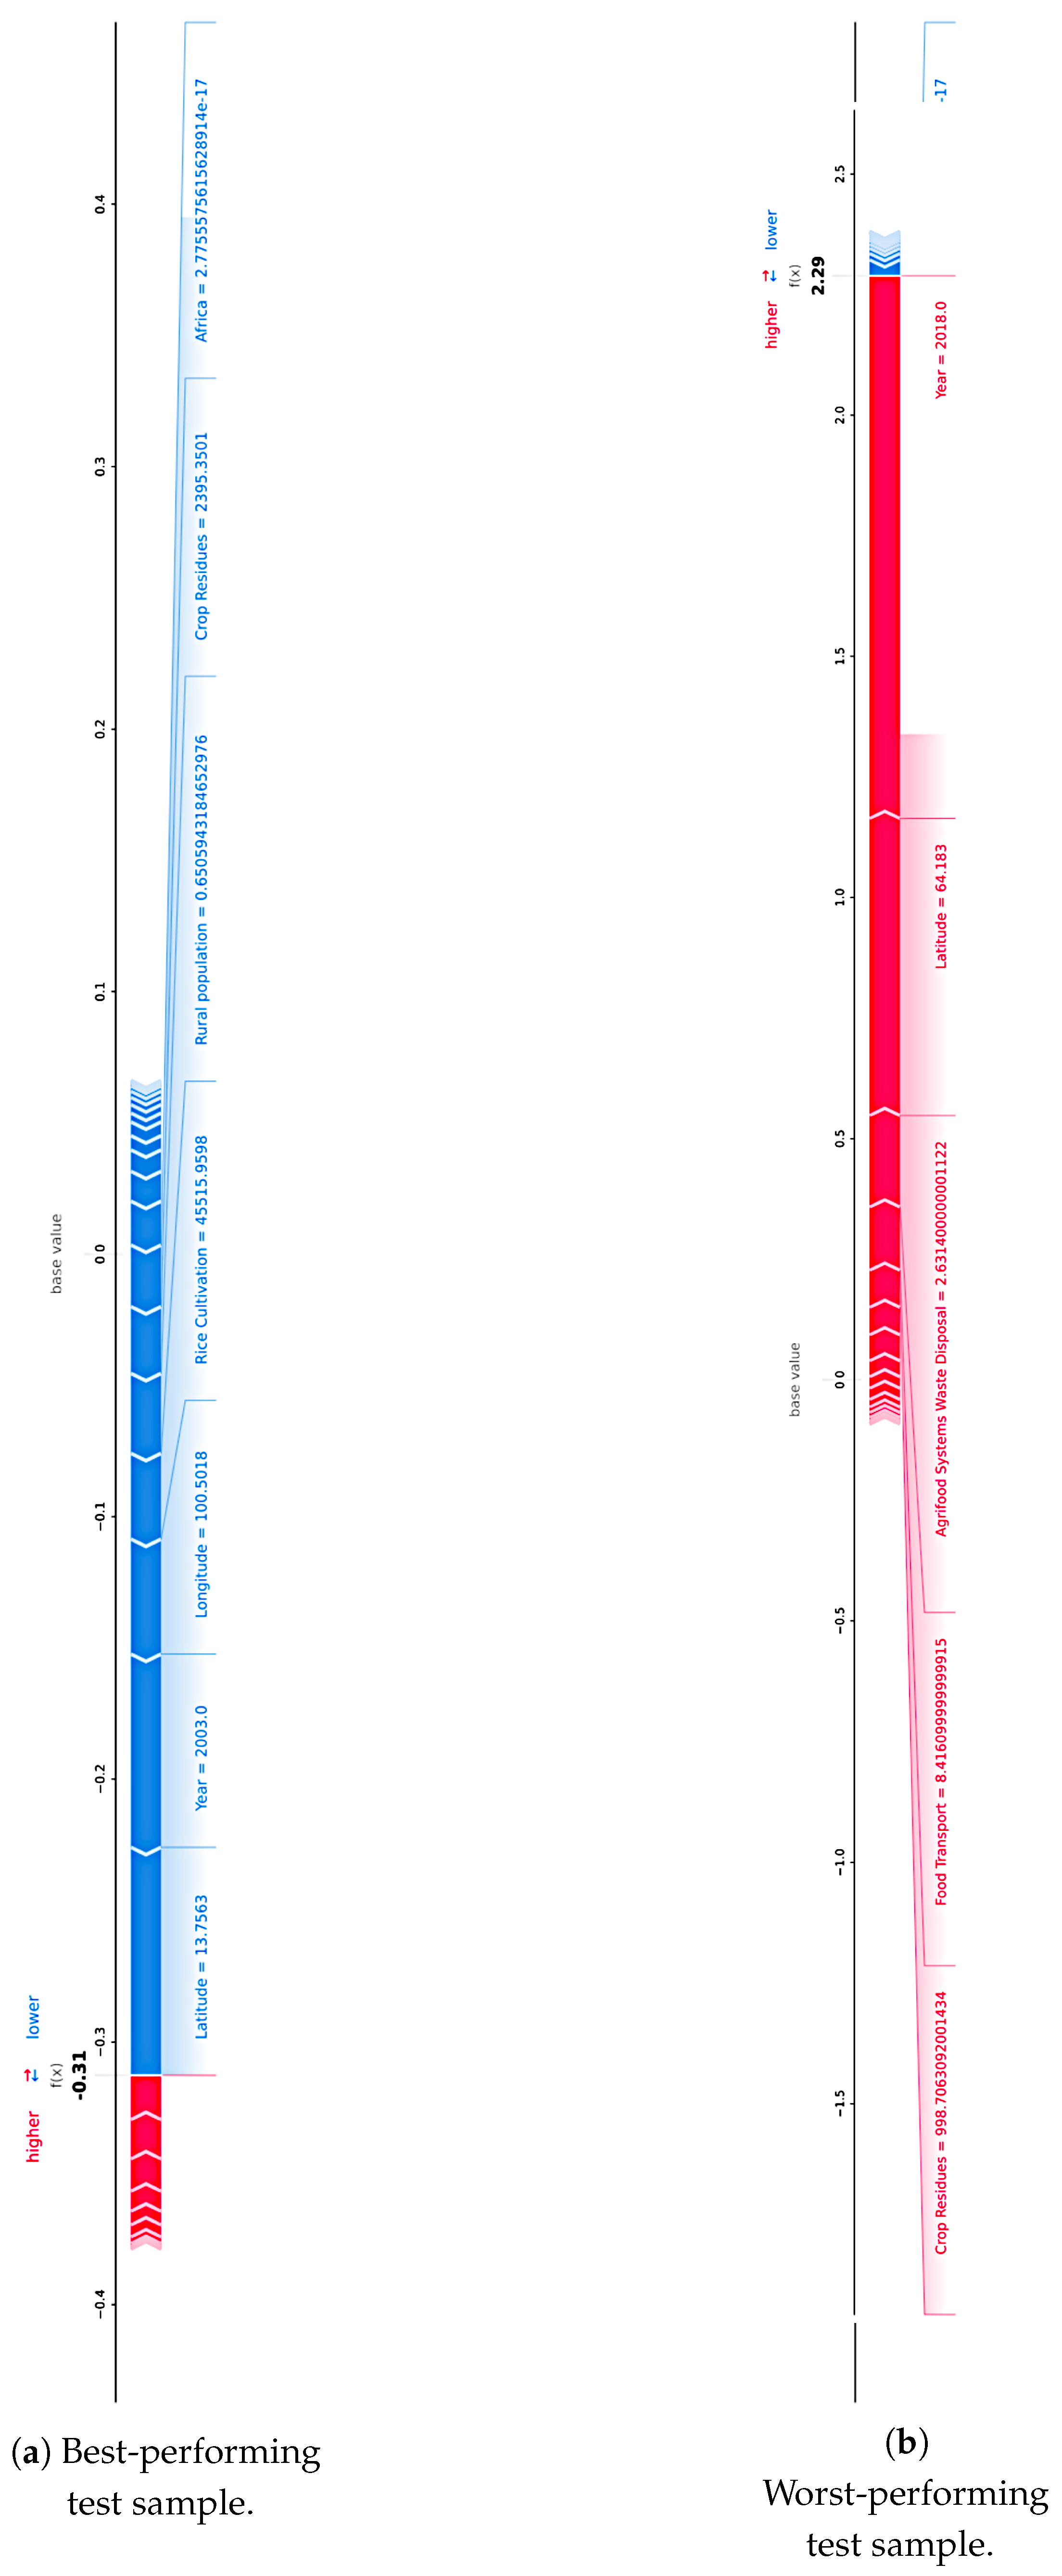
Beyond average performance metrics, understanding how and why models succeed or fail at the individual level is essential to build trust in predictive systems, particularly in high-stakes environmental modeling. Local interpretability techniques, such as SHAP force plots, allow for granular inspection of the model behavior in specific instances, highlighting the internal reasoning behind each prediction. This subsection leverages force plots to explore the extremes of model performance using XGBoost, the top-performing method in our evaluation.
Figure 10 displays two representative samples: the most accurately predicted test instance (top panel) and the one with the highest prediction error (bottom panel), offering complementary insights into the model’s strengths and limitations.
In the best-predicted sample, the contribution of individual characteristics is relatively balanced, with no single variable disproportionately influencing the output. Key features such as ‘Year’, ‘Latitude’, and ‘Rice Cultivation’ exhibit moderate contributions that constructively align to approximate the true value, suggesting that the model correctly internalized the dominant patterns governing the sample’s emission-temperature relationship. This reinforces the validity of our core hypothesis that certain spatial-temporal and agro-environmental variables act as consistent predictors of warming trends and that tree-based ensemble methods are capable of capturing such interactions with high fidelity under typical conditions.
In contrast, the worst-performing prediction reveals signs of local overfitting or misalignment of the feature interaction. Notably, ‘Crop Residues’ and ‘Agrifood Systems Waste Disposal’ display strong positive SHAP values, collectively pushing the prediction well above the true temperature increase. This behavior suggests that in atypical samples, perhaps from countries with unique reporting patterns or extreme feature values, XGBoost may overestimate the impact of certain variables due to spurious correlations or limited contextual nuance. Such cases underscore the importance of integrating domain-specific priors or hybrid modeling strategies in future work. They also validate the inclusion of post hoc interpretability tools in our methodological pipeline, not just to explain average trends, but to diagnose and mitigate outlier behavior that could undermine policy relevance or stakeholder confidence.
4. Conclusions
This study developed a data-driven framework to analyze and predict the impact of agricultural CO2 emissions on annual temperature increase in 236 countries over a 30-year period. Using a diverse suite of regression models, including tree-based ensembles and deep neural architectures, we evaluated the capacity of representative machine learning (ML) techniques to forecast global warming trends from structured agri-environmental data. In parallel, we applied explainability tools (feature importance and SHapley Additive exPlanations (SHAP) values) to understand the drivers behind model predictions, both globally and in a focused national case study (Iran).
Our results show that gradient-boosted tree ensembles, particularly XGBoost, consistently outperform alternative models across all error and variance explanation metrics. These methods achieve high accuracy while maintaining interpretability, which makes them suitable for environmental forecasting. In contrast, deep learning models show weaker performance, likely due to their higher data requirements and lower inductive bias for tabular inputs. SHAP-based interpretability confirms that spatio-temporal features—especially ‘Year’, ‘Latitude’, and ‘Longitude’—are dominant predictors, with environmental and socio-economic variables playing more context-specific roles. Furthermore, local error analysis using SHAP force plots reveals that outlier predictions are often driven by exaggerated influence from less frequent emission sources, highlighting the need for context-aware regularization.
A key contribution of the study lies in the integrative use of predictive modeling and post hoc interpretability to reveal actionable insights. For example, the Iran case study demonstrated a pronounced national dependence on rice cultivation and on-farm energy use, contrasting with global trends that attribute greater weight to downstream supply chain emissions. These insights provide a concrete basis for region-specific mitigation strategies and policy design, offering a bridge between ML and sustainable development goals.
As with any data-driven study, this work has certain limitations. The use of nationally aggregated data, while useful for capturing general trends and enabling global comparisons, may also overlook important local variations in emission behaviors. Similarly, although SHAP provides valuable interpretability, its outcomes can be affected by feature interdependencies and model-specific characteristics. Moreover, the relatively modest performance of neural models probably stems from a combination of factors, including limited data, model complexity, and reduced inductive bias for tabular inputs, rather than the inherent unsuitability of deep learning approaches. Future work should consider hybrid models that combine expert knowledge with data-driven learning, incorporate additional remote sensing or land-use datasets, and explore causal inference techniques to strengthen the interpretability and robustness of predictions. In addition, integrating a formal uncertainty quantification component, such as the propagation of measurement errors or the use of probabilistic and Bayesian approaches, would be a valuable extension of the framework, providing a more explicit assessment of prediction confidence. Finally, extending the analysis to project future emissions under various policy or climatic scenarios would offer substantial value for forward-looking environmental planning.
