1. Introduction
Laser powder bed fusion (LPBF) is currently one of the most advanced and widely used technologies for additive manufacturing of metal products. The technology involves the synthesis of volumetric metallic parts from powder layer by layer using laser irradiation as a heat source. This principle allows synthesizing products of almost any shape from a wide range of materials and has a high resolution [
1]. The resolution of standard LPBF machine is about 150 μm (lower limit), while maximum size of a part is limited by chamber dimensions.
Initial material for LPBF is metallic powder with spherical particles and narrow particle size distribution providing high flowability and tap density of the powder, which is important for smooth powder layer formation during synthesis. Such spherical powders are usually produced via gas atomization and subsequent sieving. Among the wide range of materials adopted for LPBF, the most widely used are aluminum (AlSi10Mg), titanium (Ti-6Al-4V) alloys, and stainless steel (316L) [
2,
3,
4]. AlSi10Mg alloy possesses excellent combination of high mechanical properties, corrosion resistance, low density, and relatively low price, which made it very popular in practice for the production of various parts for aerospace, automotive and other areas [
5].
One of the limiting factors of LPBF technology is the long duration of the synthesis, which causes low productivity and limits the widespread application of the technology in industry. Reducing the synthesis time and increasing the productivity of LPBF is possible due to printing with an increased scanning speed and/or with an increased powder layer thickness. In this case, varying the layer thickness is more significant for overall productivity [
6]. The greater the powder layer thickness, the smaller the total number of layers during product synthesis, which can significantly affect the overall time consumption. The practical implementation of this approach was shown in [
7] using a higher-power laser and an increased diameter of the laser beam spot on the powder layer in order to increase dimensions of melt pool. A number of experimental works are known [
8,
9,
10,
11], in which studies were conducted on the effect of increased layer thickness on the structure and properties of various materials without modifying the equipment. However, an increased layer thickness can lead to negative effects, such as an increase in the number of defects (pores, unmelted areas), deterioration in surface quality, and a decrease in the resolution of the technology. Thus, when implementing high-speed printing using the LPBF method, it is necessary to select a balanced layer thickness value, which, on the one hand, will ensure an increase in productivity, and on the other hand, will not lead to a significant increase in material defects and, as a consequence, a decrease in functional properties. To select such a balanced synthesis mode, it is necessary to construct dependencies of the material properties on the synthesis parameters, which is associated with a large volume of experimental work on printing and certification of samples. The creation of a model that allows predicting the structure and properties of the material after printing depending on the synthesis mode allows minimizing the amount of experimental work and reducing the costs of its implementation.
Numerical simulation is recognized as an alternative solution to the experimental approach to process-parameter optimization, which allows us to predict the final state of the manufactured material and to reduce costs. Many studies are focused on the simulation of the LPBF process, and various methods and techniques have been developed, such as the Lattice Boltzmann method, the finite element method, the finite volume method, smooth particle hydrodynamics, etc. [
12]. The whole range of scales (from melt pool to part) has been considered depending on specific objective. Part-scale modeling comes down to heat transfer and equilibrium equations supplemented in some cases by metallurgical transformation equations [
13]. Such modeling is similar to welding simulations; appropriate approaches and techniques have been developed, and the finite element method is usually used for this purpose, allowing to study and predict heat transfer and residual stress effects [
14,
15]. However, the limitations and simplifications of the part-scale simulation lead to its low accuracy. Mesoscale modeling deals with melt pool simulation that allows consideration of fluid dynamics and surface tension and, in turn, predict single-track morphology and temperature fields [
16]. Powder is usually considered as a continuum layer. Further accuracy can be achieved at the powder scale, i.e., by resolving every particle and taking into account interaction between powder and liquid metal and laser. It makes it possible to conduct deep investigations of melt pool stability, heat and mass transfer, defect formation, and other subtle effects depending on LPBF process parameters, but requires high computational resources [
17,
18,
19].
Thus, the application of deep modeling to investigate the effect of high-speed printing on the manufactured material is rational and promising. This work is the first necessary step towards solving the problem. The aim of the work is to investigate the influence of the main thermophysical properties on the melt pool morphology with the help of a high-fidelity model describing the LPBF process with the possibility of varying the synthesis mode and allowing determination of the parameters of the melt pool. The creation of such a model together with its verification by experimental results is the first stage of the practical implementation of the theoretical prediction of the structure and properties of the material after LPBF, including high-speed printing with increased scanning speeds and powder layer thickness.
2. Mesoscopic Molten Pool Dynamics Model
For modeling single tracks, the KiSSAM (Kintech Simulation Software for Additive Manufacturing,
www.kissam.cloud) software package was used. The software is based on the hydrodynamic modeling of the melt pool using the Lattice Boltzmann method (LBM) [
20,
21]. LBM is one of the most efficient CFD methods and provides a high degree of parallelism and computational performance and at the same time ensures the necessary accuracy and convergence at the mesoscopic level where the characteristic size of the melt pool is about 100 μm. The fluid dynamics simulation kernel is also extended with additional models that are relevant for LPBF, such as surface tension, wetting, phase transitions, evaporation and fluid-gas interaction models at the fluid interface, a thermal solver, and laser beam tracing.
Strictly speaking, LBM does not have a well-defined stability condition. In real world, the standard BGK collision term usually provides stability at Reynolds numbers Re < 1000 and Mach numbers Ma ≲ 0.3 [
22]. Here, the Mach number is not a physical quantity but is defined as
, where
u is a characteristic speed of liquid melt,
cs is a lattice sound speed, and Δ
x and Δ
t are the spatial and time steps, respectively.
LBM also has the second order of convergence in the
Ma number, so it should be as low as possible. So, finally, there are two constraints on the choice of spatial and time steps (∆x and ∆t):
The condition (1) requires that the relaxation parameter τ should be greater than 0.51, that is,
, where
is the kinematic viscosity in LBM units, and ν is the kinematic viscosity in physical units (SI). As a result, the following simple condition was obtained:
From the second condition Ma ≪ 1 from Equation (2) and assuming that typical velocities in the melt pool are of the order of 1 m/s, the following condition was obtained:
And also, the third relation must be satisfied—the Courant condition for the thermal solver:
where κ is the thermal diffusivity of the material in the solid phase and in the liquid phase at low temperature.
In combination with this, the time step ∆t should be chosen after the spatial step ∆x as follows:
where κ
max is the maximum value of thermal diffusivity for the temperature range T < 1.1 T
l (T
l is the liquidus temperature).
Note that the peculiarity of aluminum alloys is that they have a relatively high thermal conductivity. This imposes stronger restrictions on the time step. Considering that, for the AlSi10M alloy, the kinematic viscosity ν = 10
−6 m
2/sec and κ
max = 6.5 × 10
−5 m
2/sec (at a temperature of 300 K) [
23], the recommended parameters for the steps in space and time are presented in
Table 1.
3. Simulation of AlSi10Mg Synthesis with Increased Layer Thickness
Preliminary experiments have shown that, for the synthesis of AlSi10Mg with low defect content using common LPBF systems with a nominal laser power of no more than 400 W, the scanning speed can be increased within the 300–1700 mm/s range. This limitation is due to the low absorptivity of aluminum alloys. As a result, no significant change in productivity will be achieved in this range. Therefore, the study was aimed at increasing the powder layer thickness, which in turn affects productivity to a greater extent than other process parameters. In this work, the limiting values of the layer thickness were determined using the computational model described in the previous section.
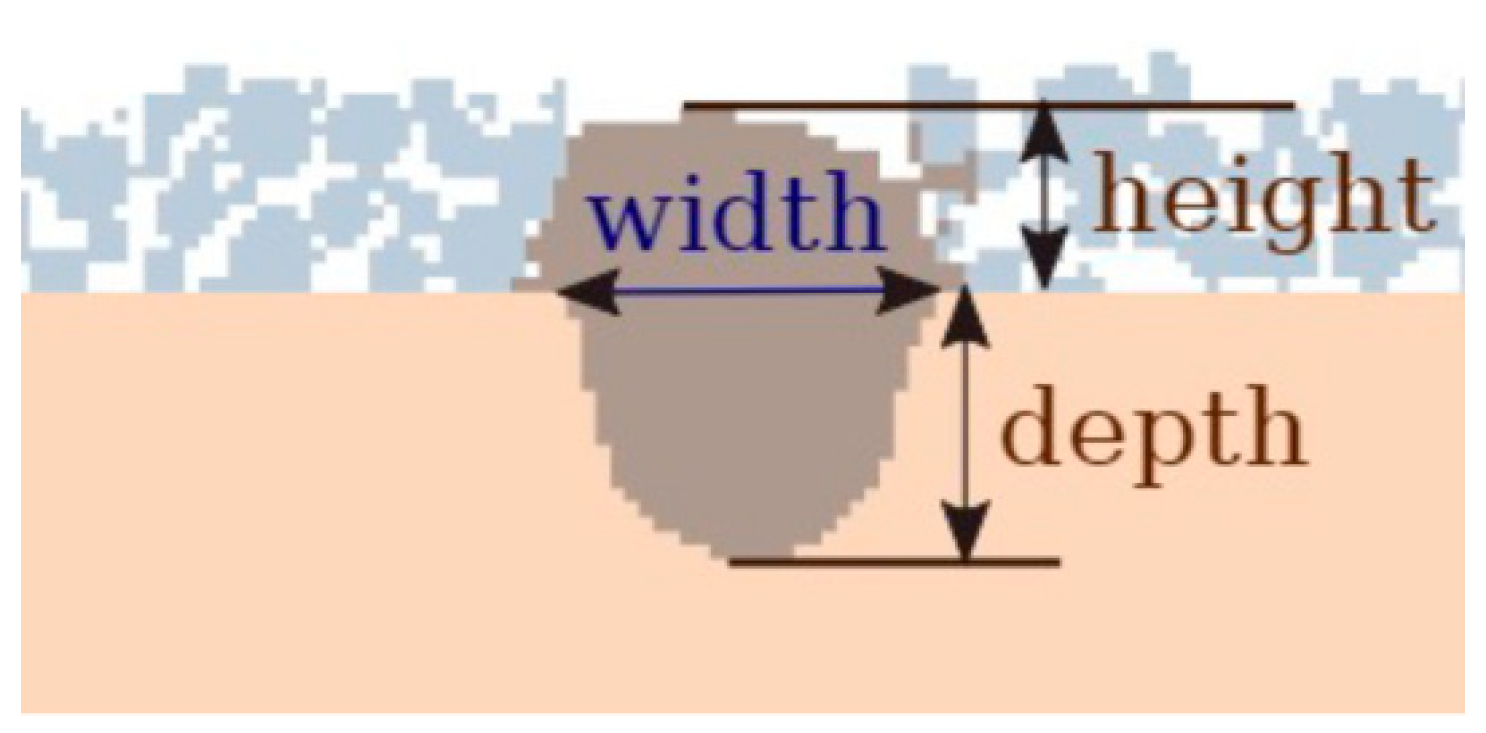
To validate the model, calculations were performed for individual tracks on a substrate without a powder layer. The cross-section of each track was studied using experimental methods. The software was used to study the cross-sections of the simulated remelted areas. The simulation results were compared with the corresponding experimental results for the following parameters:
Since one of the goals of the study is to select the critical powder layer thickness at which sufficient weld penetration occurs to ensure low porosity, the calculation of the depth is of decisive importance in the context of applying the results to real-world problems.
During the calculations of the melting process, melt hydrodynamics, and crystallization of each track, it is necessary to take into account the thermophysical and hydrodynamic parameters of the material. During the validation process, the literature data were used, and the sensitivity of the depth and width values to changes in individual material parameters was also studied.
4. Sensitivity to Laser Beam Diameter
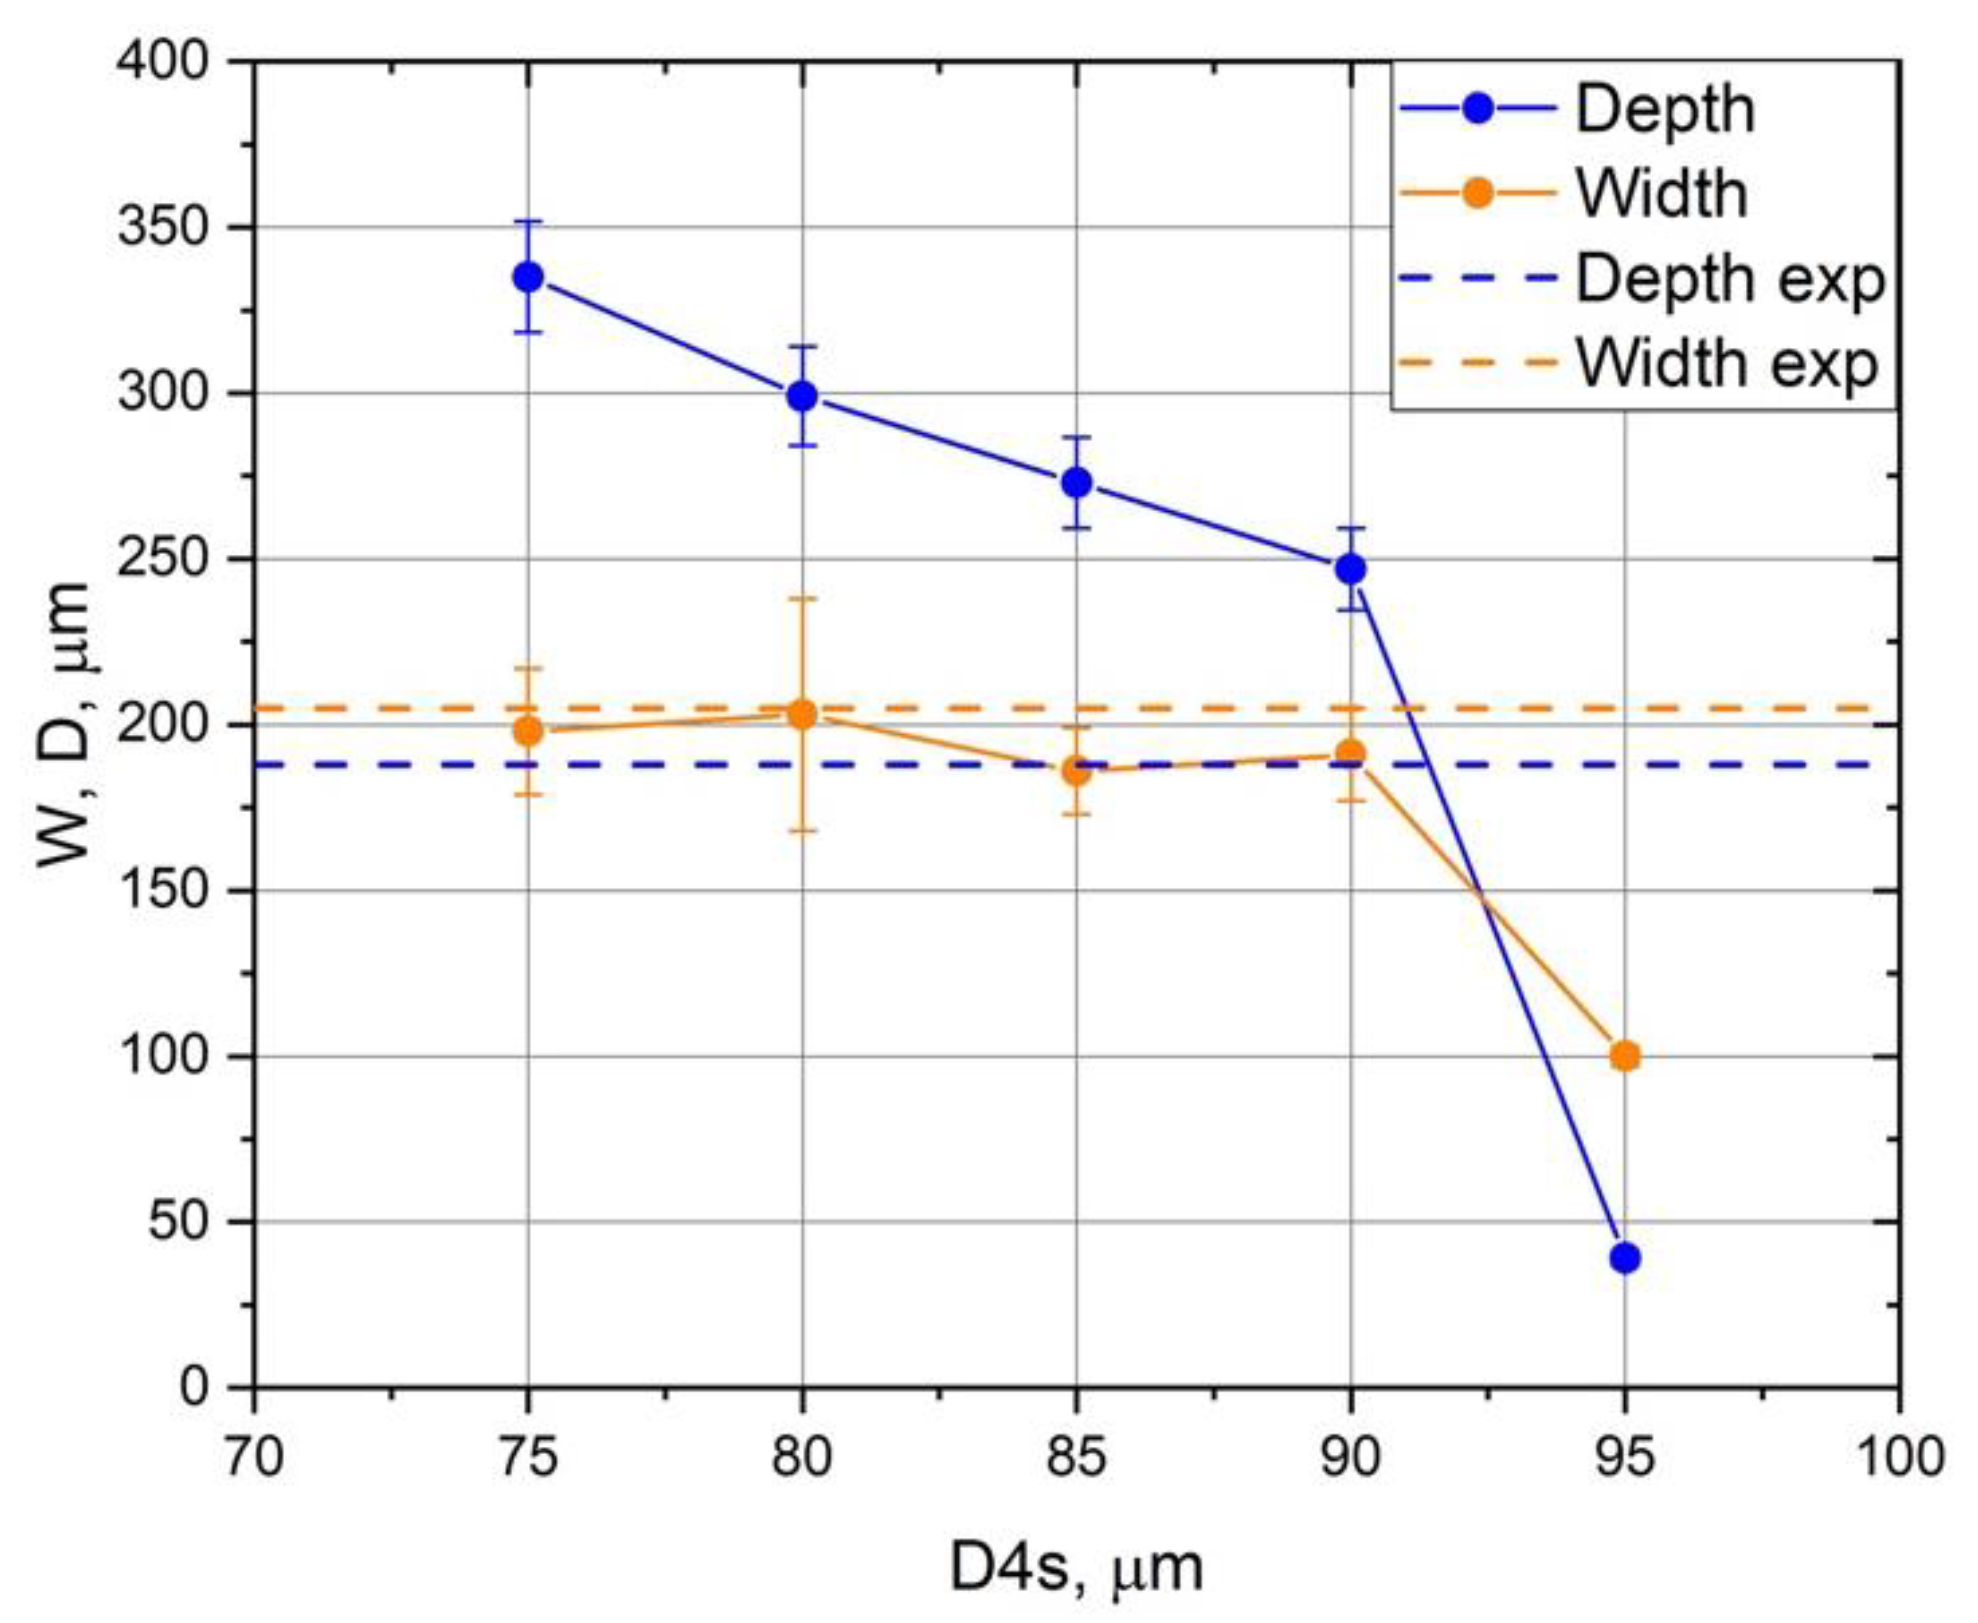
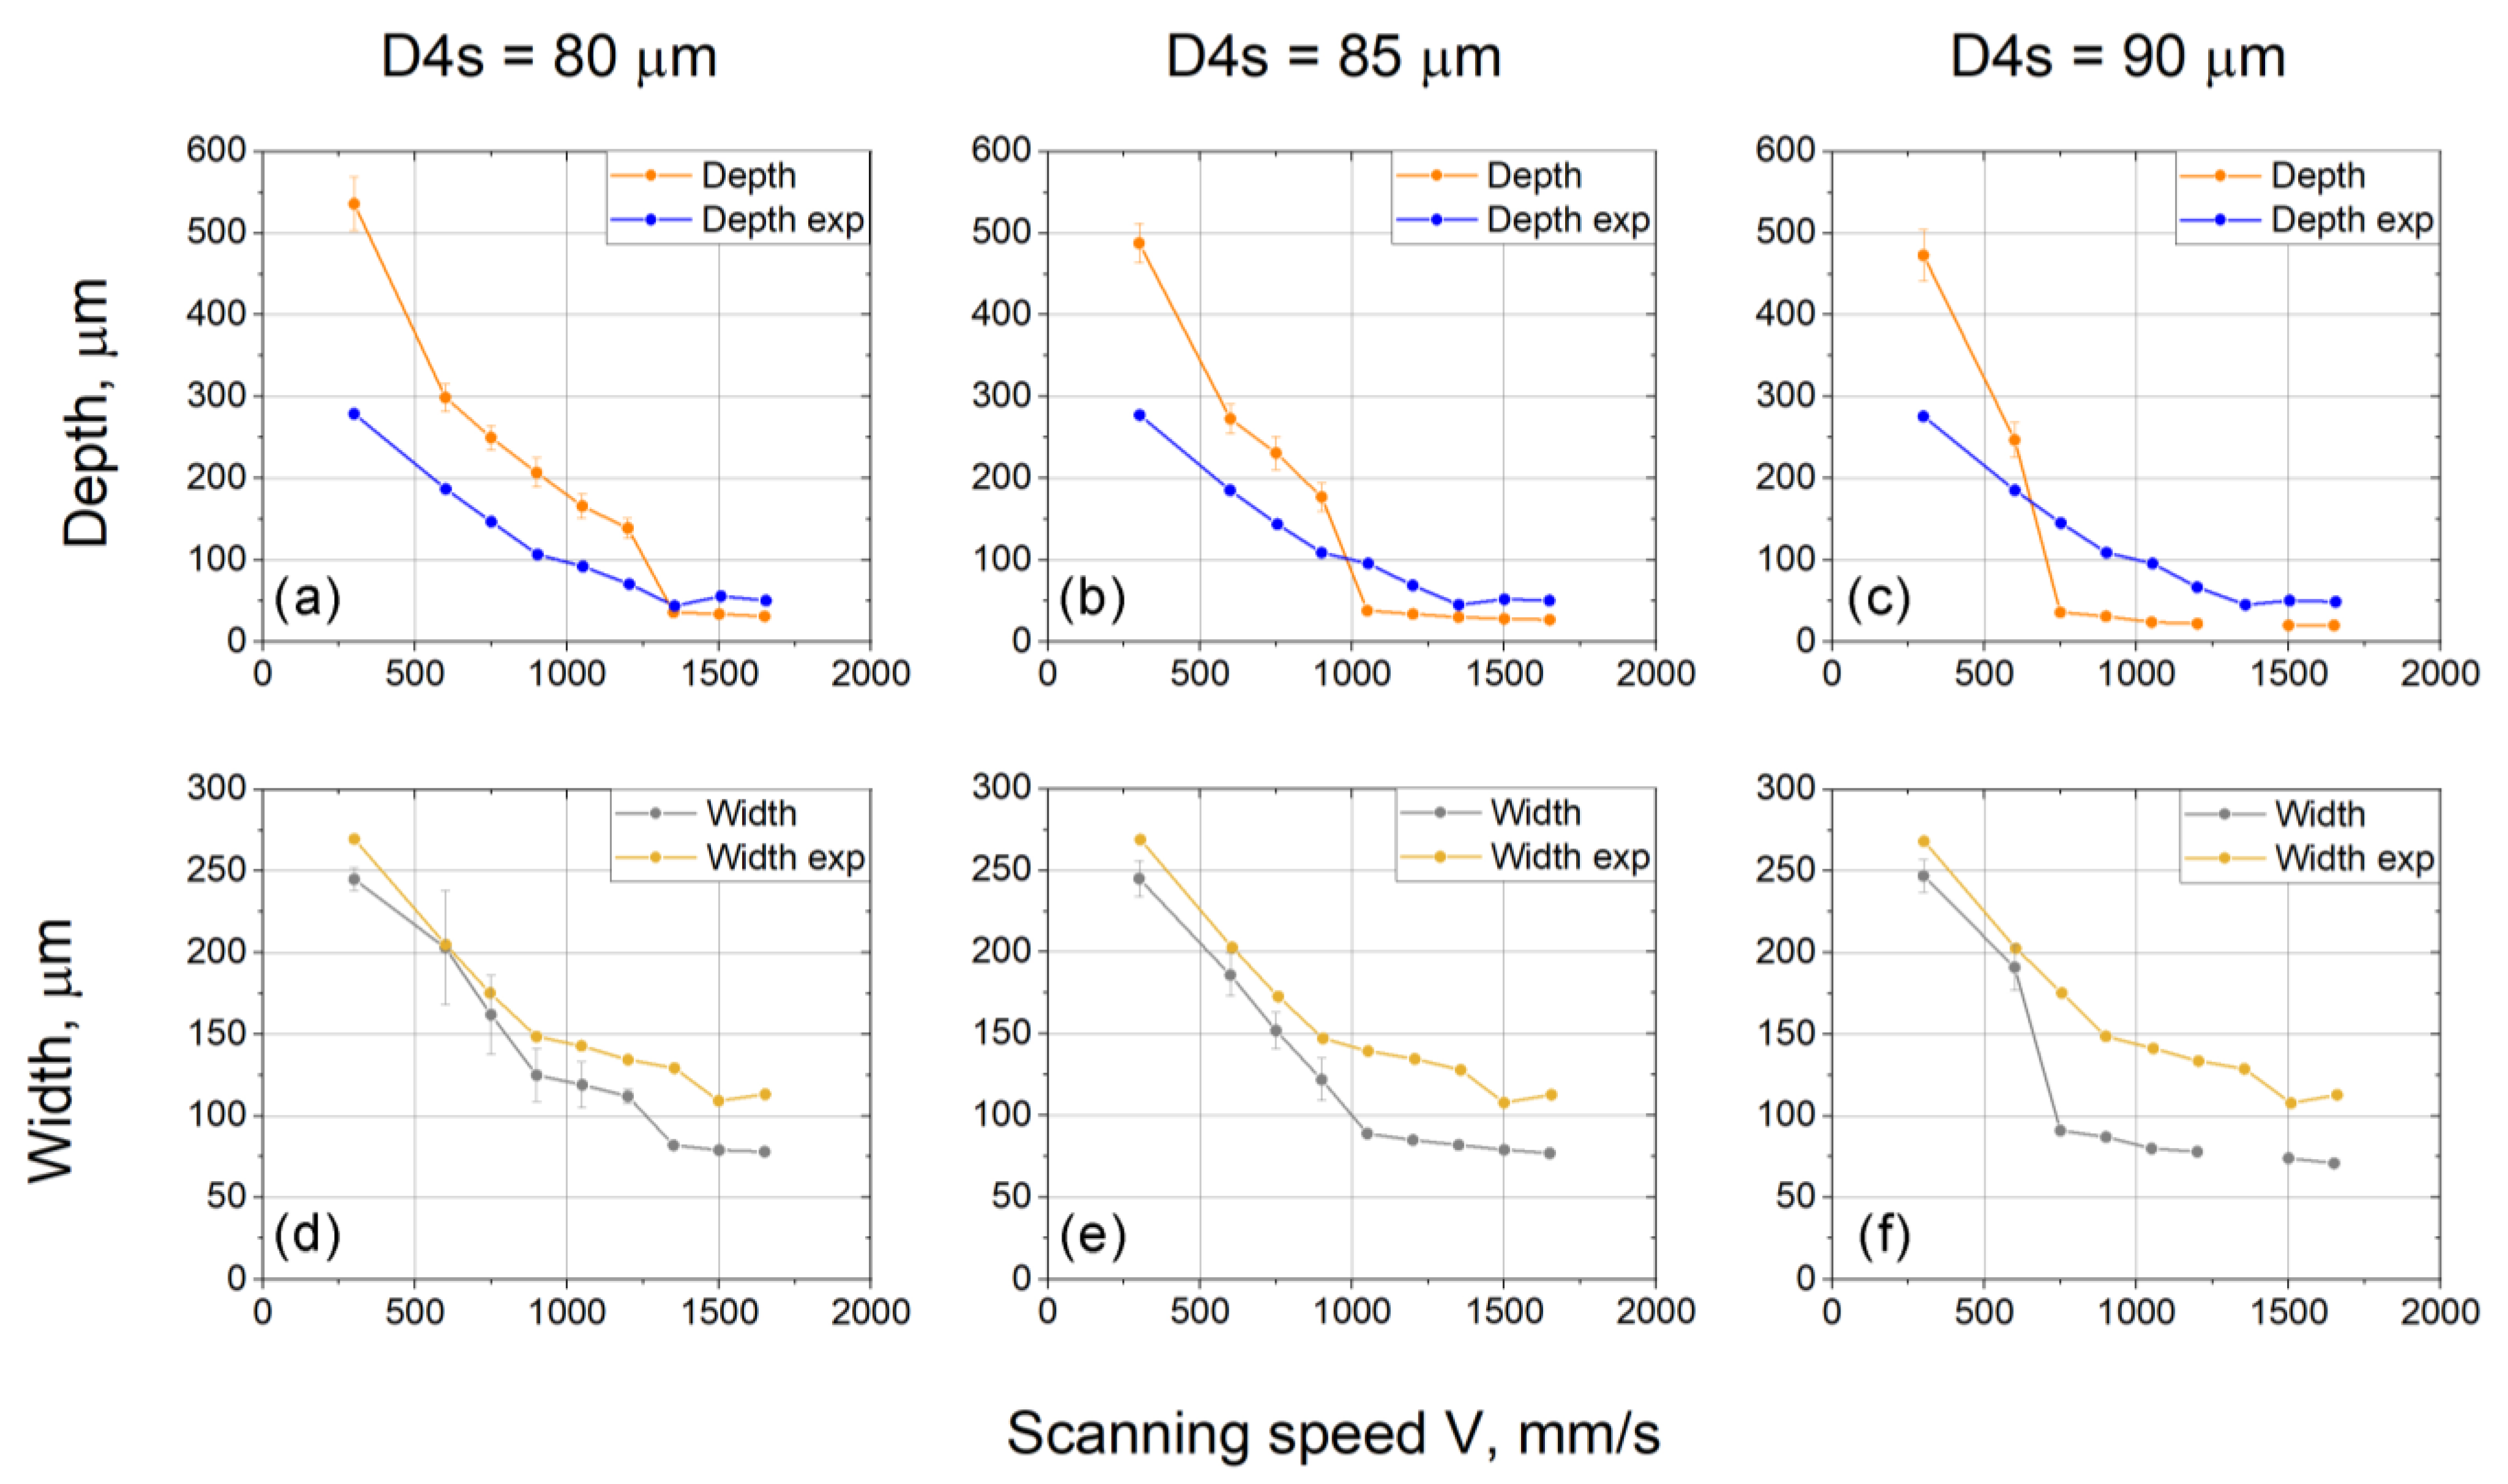
Since it is rather difficult to determine the true diameter of the laser beam experimentally, the dependence of the morphology of the tracks on the beam diameter (D4s) was investigated by simulation. The results of the simulation and comparison with the experiment are shown in
Figure 2 and
Figure 3. The scanning speed was 600 mm/s, and the power was 300 W. Here and below, the unmelted part of the substrate is shown in shades of blue and the melted area is shown in shades of purple.
An analysis of the transition modes between deep and shallow penetration, as well as the values of the track width and depth at different laser beam speeds (see
Figure 4) established that the nominal value of the width D4s = 80 µm is consistent with reality (defocusing is insignificant), and this value was used in further studies.
Generally, one can see that the melt pool depth strongly depends on the laser beam diameter. However, the melt pool width is not sensitive to the beam diameter in the keyhole regime.
5. Sensitivity to Absorption in the Liquid Phase
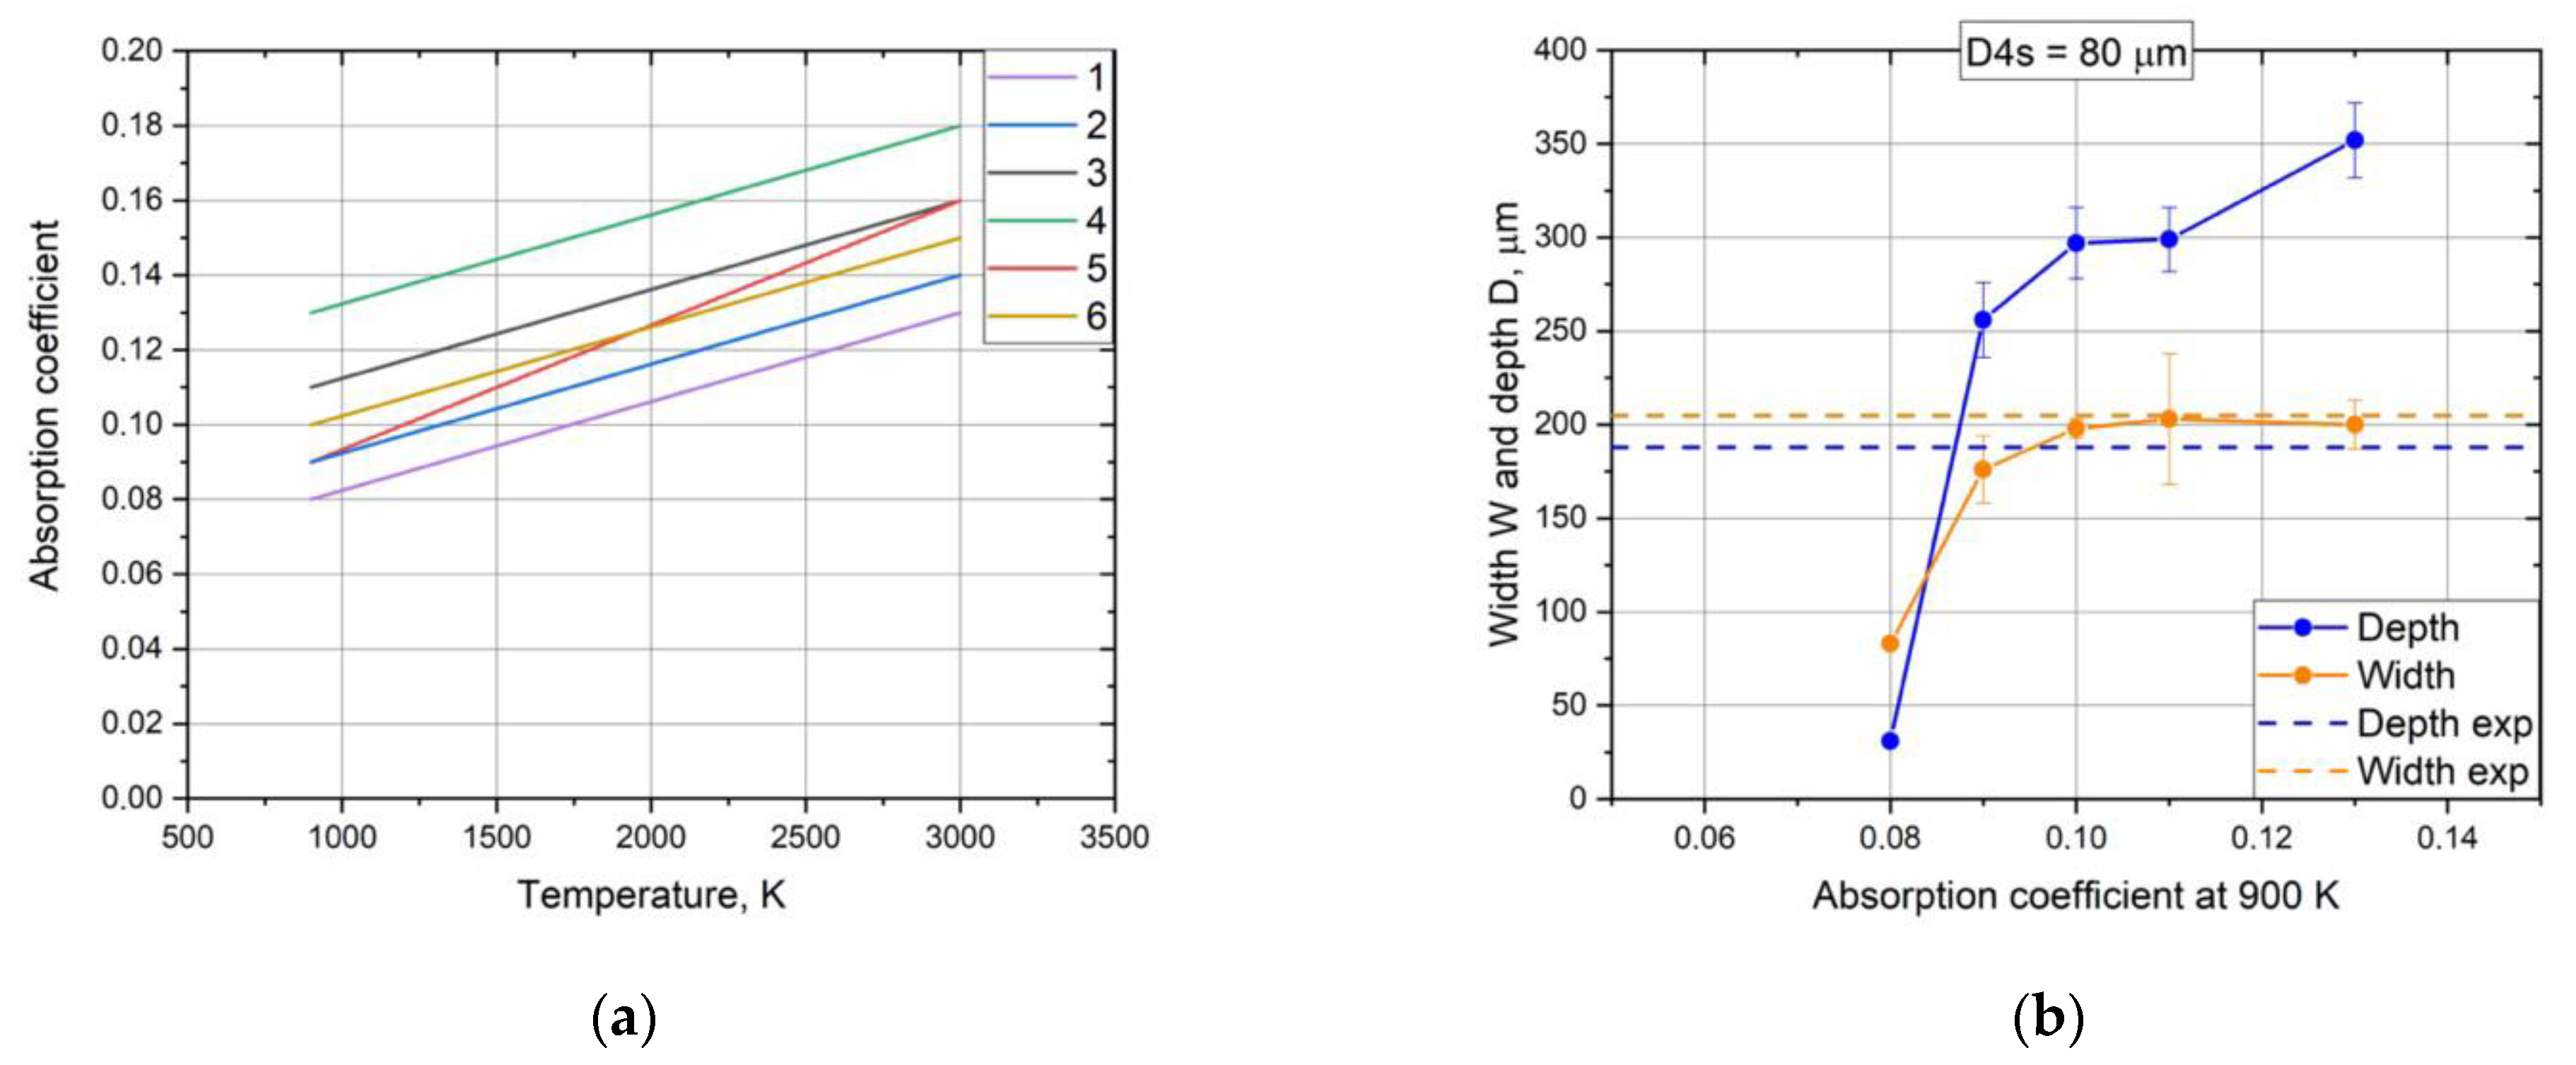
The absorption of the liquid phase (the melt) depends on the temperature. This parameter is rarely studied in the literature, and the specific absorption value may depend on the alloy composition. The effect of the absorption coefficient on the depth and width of the melted region was studied. The results are shown in
Figure 5 and
Figure 6.
The depth of penetration and the morphology of the entire remelted region vary with the absorption coefficient. However, for all the studied absorption values, the track depth exceeds the experimental value, except for one point, where the melting mode changes from the “keyhole” mode to the conductivity mode (A
T=100K = 0.08). The agreement of the width of the remelted region is satisfactory for all cases. The absorption coefficient as a function of temperature for each case is shown in
Figure 6a [
24].
6. Sensitivity to Thermal Diffusivity
The thermal diffusivity of the AlSi10Mg alloy was measured experimentally in [
25] for parts printed by LPBF, as well as for a reference sample that was thermally annealed at 300 °C for 2 h after printing. The data include measurements of the first and second passes, as well as data for the reference sample and are in good agreement with the data for alloys with similar compositions from the handbook [
26] (see
Figure 7).
The sensitivity of the simulation results for a single track on a substrate to the thermal diffusivity value was investigated using the data from [
25] as the base value. The obtained track depth and width values are shown in
Figure 8. The thermal diffusivity
d in
Figure 8 is indicated in m
2/s in the captions along the
x-axis in the format [T, d] and has a linear dependence on temperature. The sensitivity over this range of thermal diffusivity change is low. The depth and width of the tracks change insignificantly.
7. Sensitivity to Surface Tension
The surface tension of the liquid phase of aluminum–silicon alloys (Al-Si) has been measured in several studies [
27,
28]. These studies have shown that the surface tension exhibits a linear dependence on temperature, with the slope of the σ (T) function (which determines the dynamics of Marangoni convection in the liquid) depending on the Si concentration in the alloy. In our case, the silicon content in the AlSi10Mg alloy is 10%. Therefore, the effect of surface tension on the shape of the track was studied, and the result was compared with the experimental cross-section (see
Figure 9). In all the studied cases, the depth of the melted region exceeds the experimental one. The track width is practically independent on the surface tension. The coefficient
c, which corresponds to the silicon concentration in the alloy under study, was chosen as the base value.
The corresponding values for surface tension are shown in
Figure 10 and are marked by the letters a, b, and c.
The final list of the material parameters used in the numerical model is presented in
Table 2.
8. Investigation of the Constructive Convergence of the Solution
It is also important to analyze the numerical convergence with respect to the spatial and temporal steps. Because the exact solution is unknown, only a constructive convergence study is possible to investigate.
The numerical convergence of the solution (track depth) for two cases was also investigated: uniform and intense melting of a single track on the substrate. For this purpose, a series of calculations with different steps in spatial and time were performed.
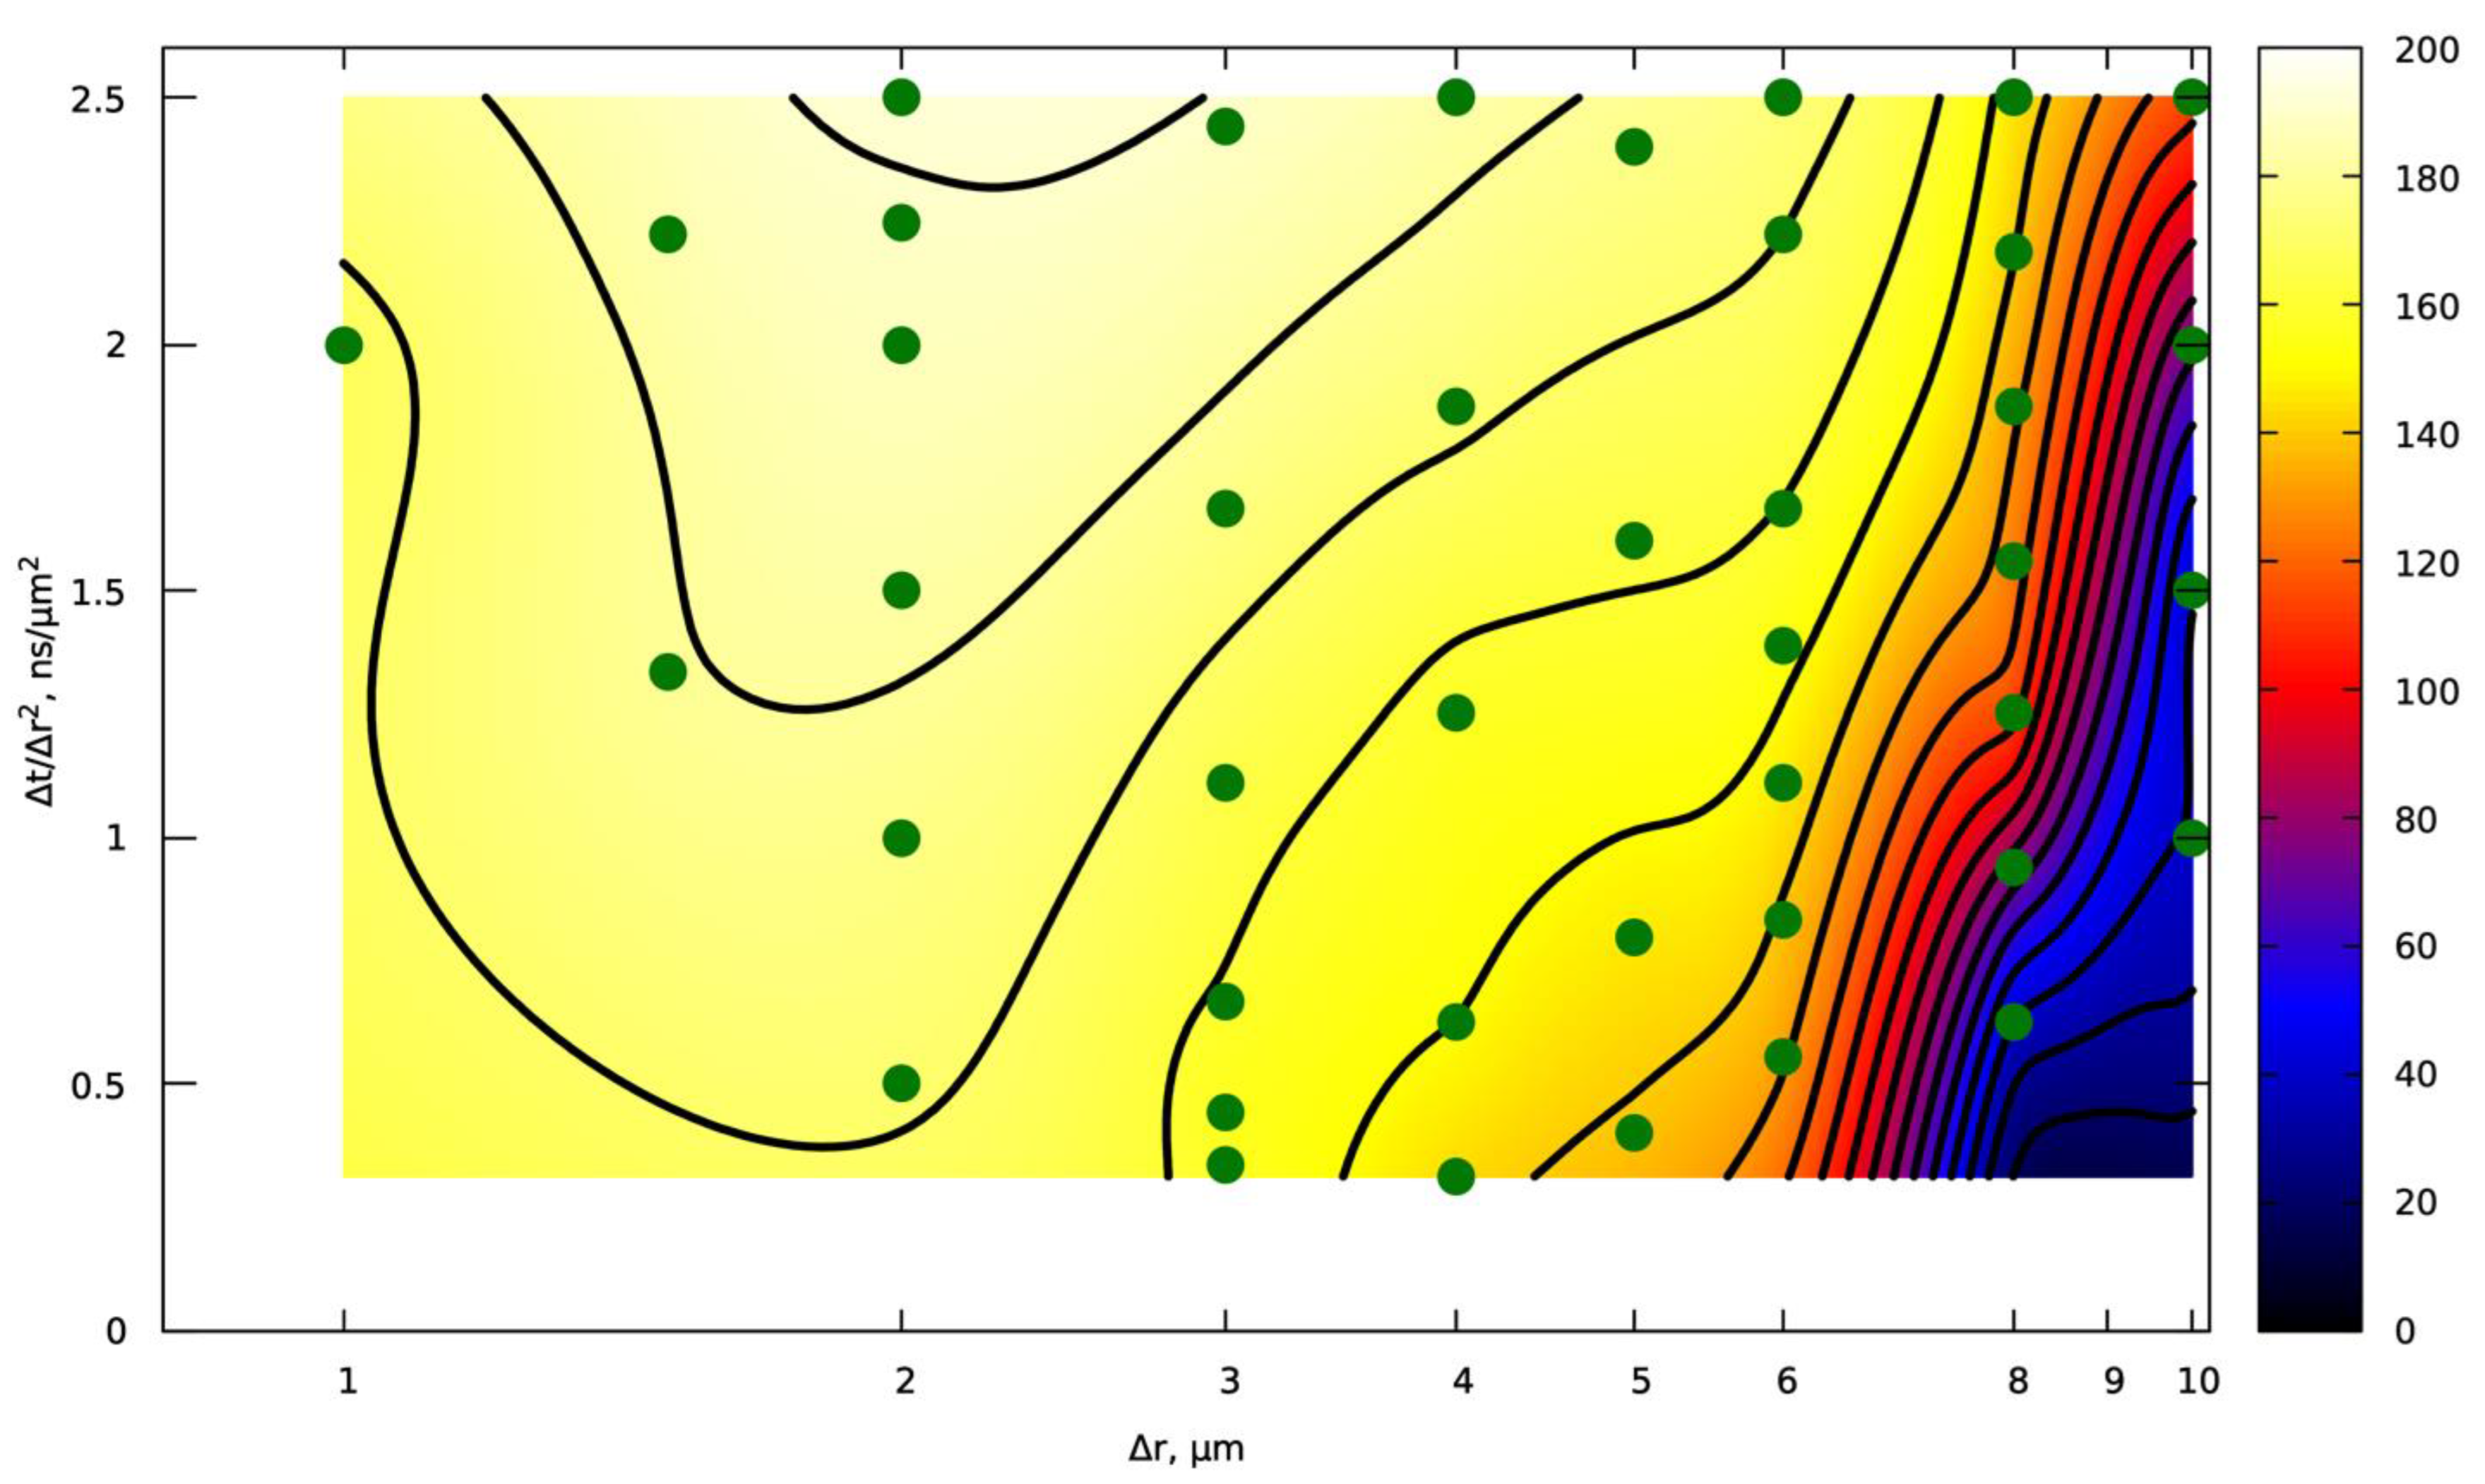
Figure 11 shows the dependence of the track depth on the steps for the case of intense melting. In
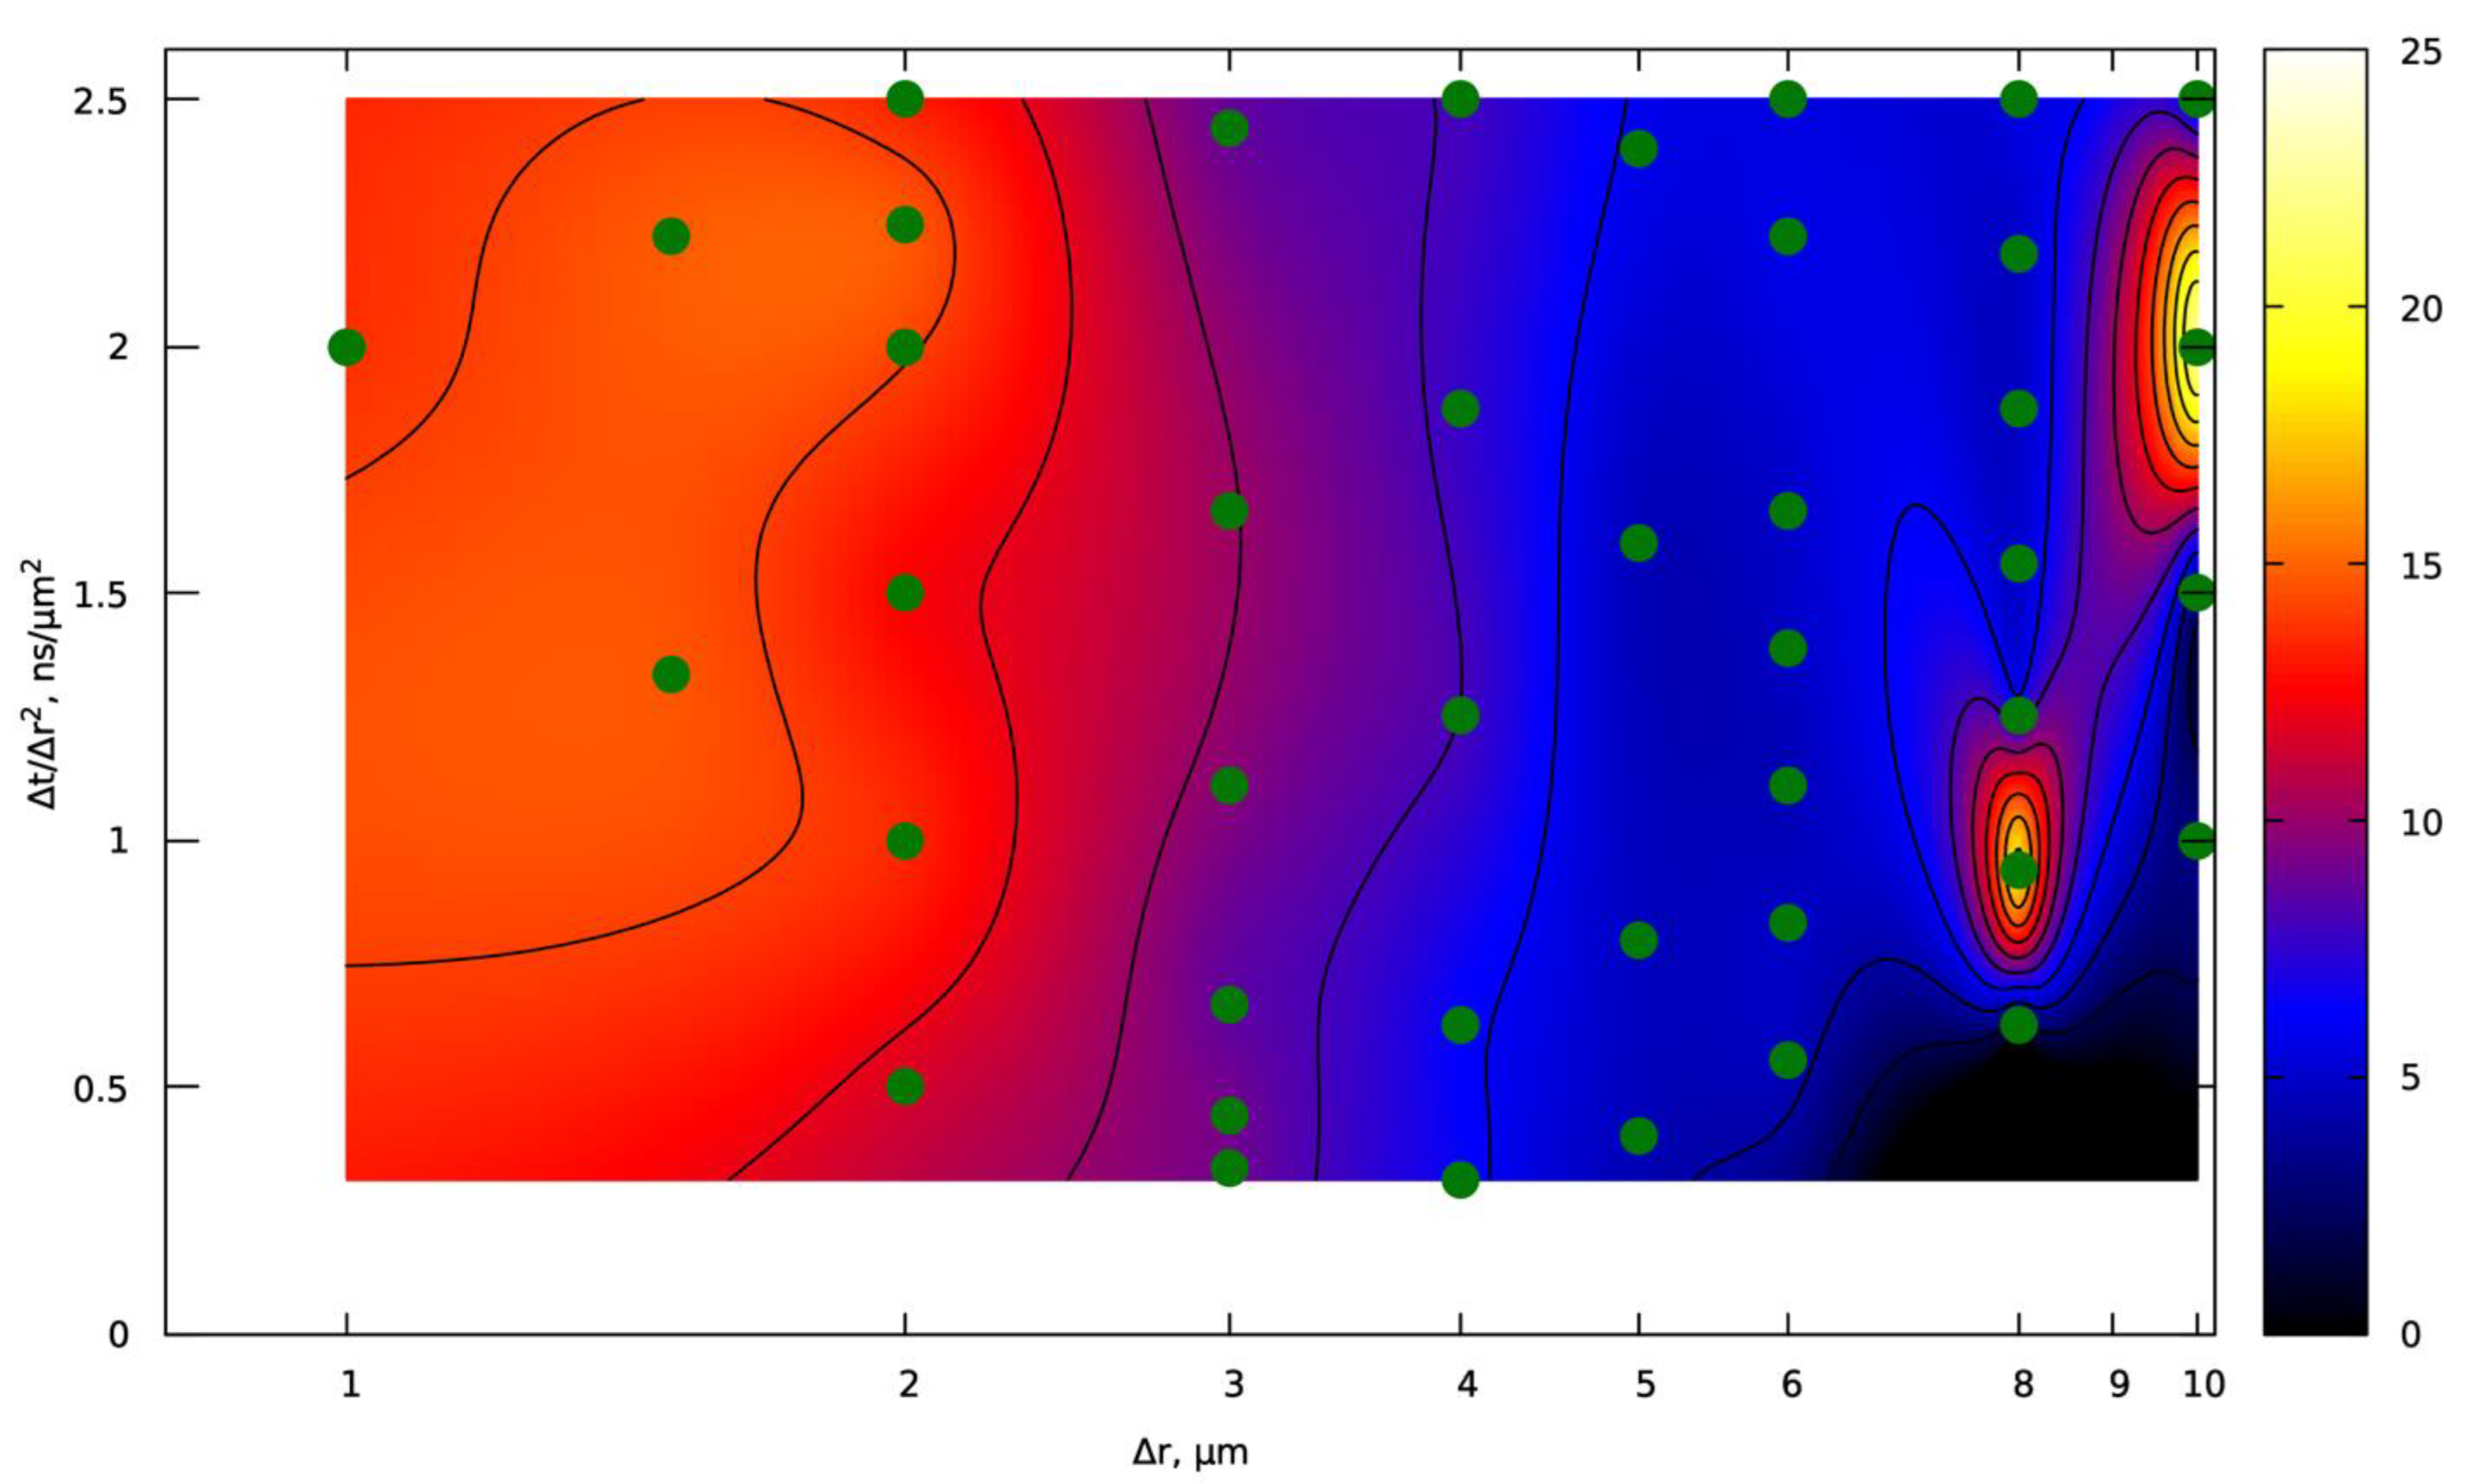
Figure 11,
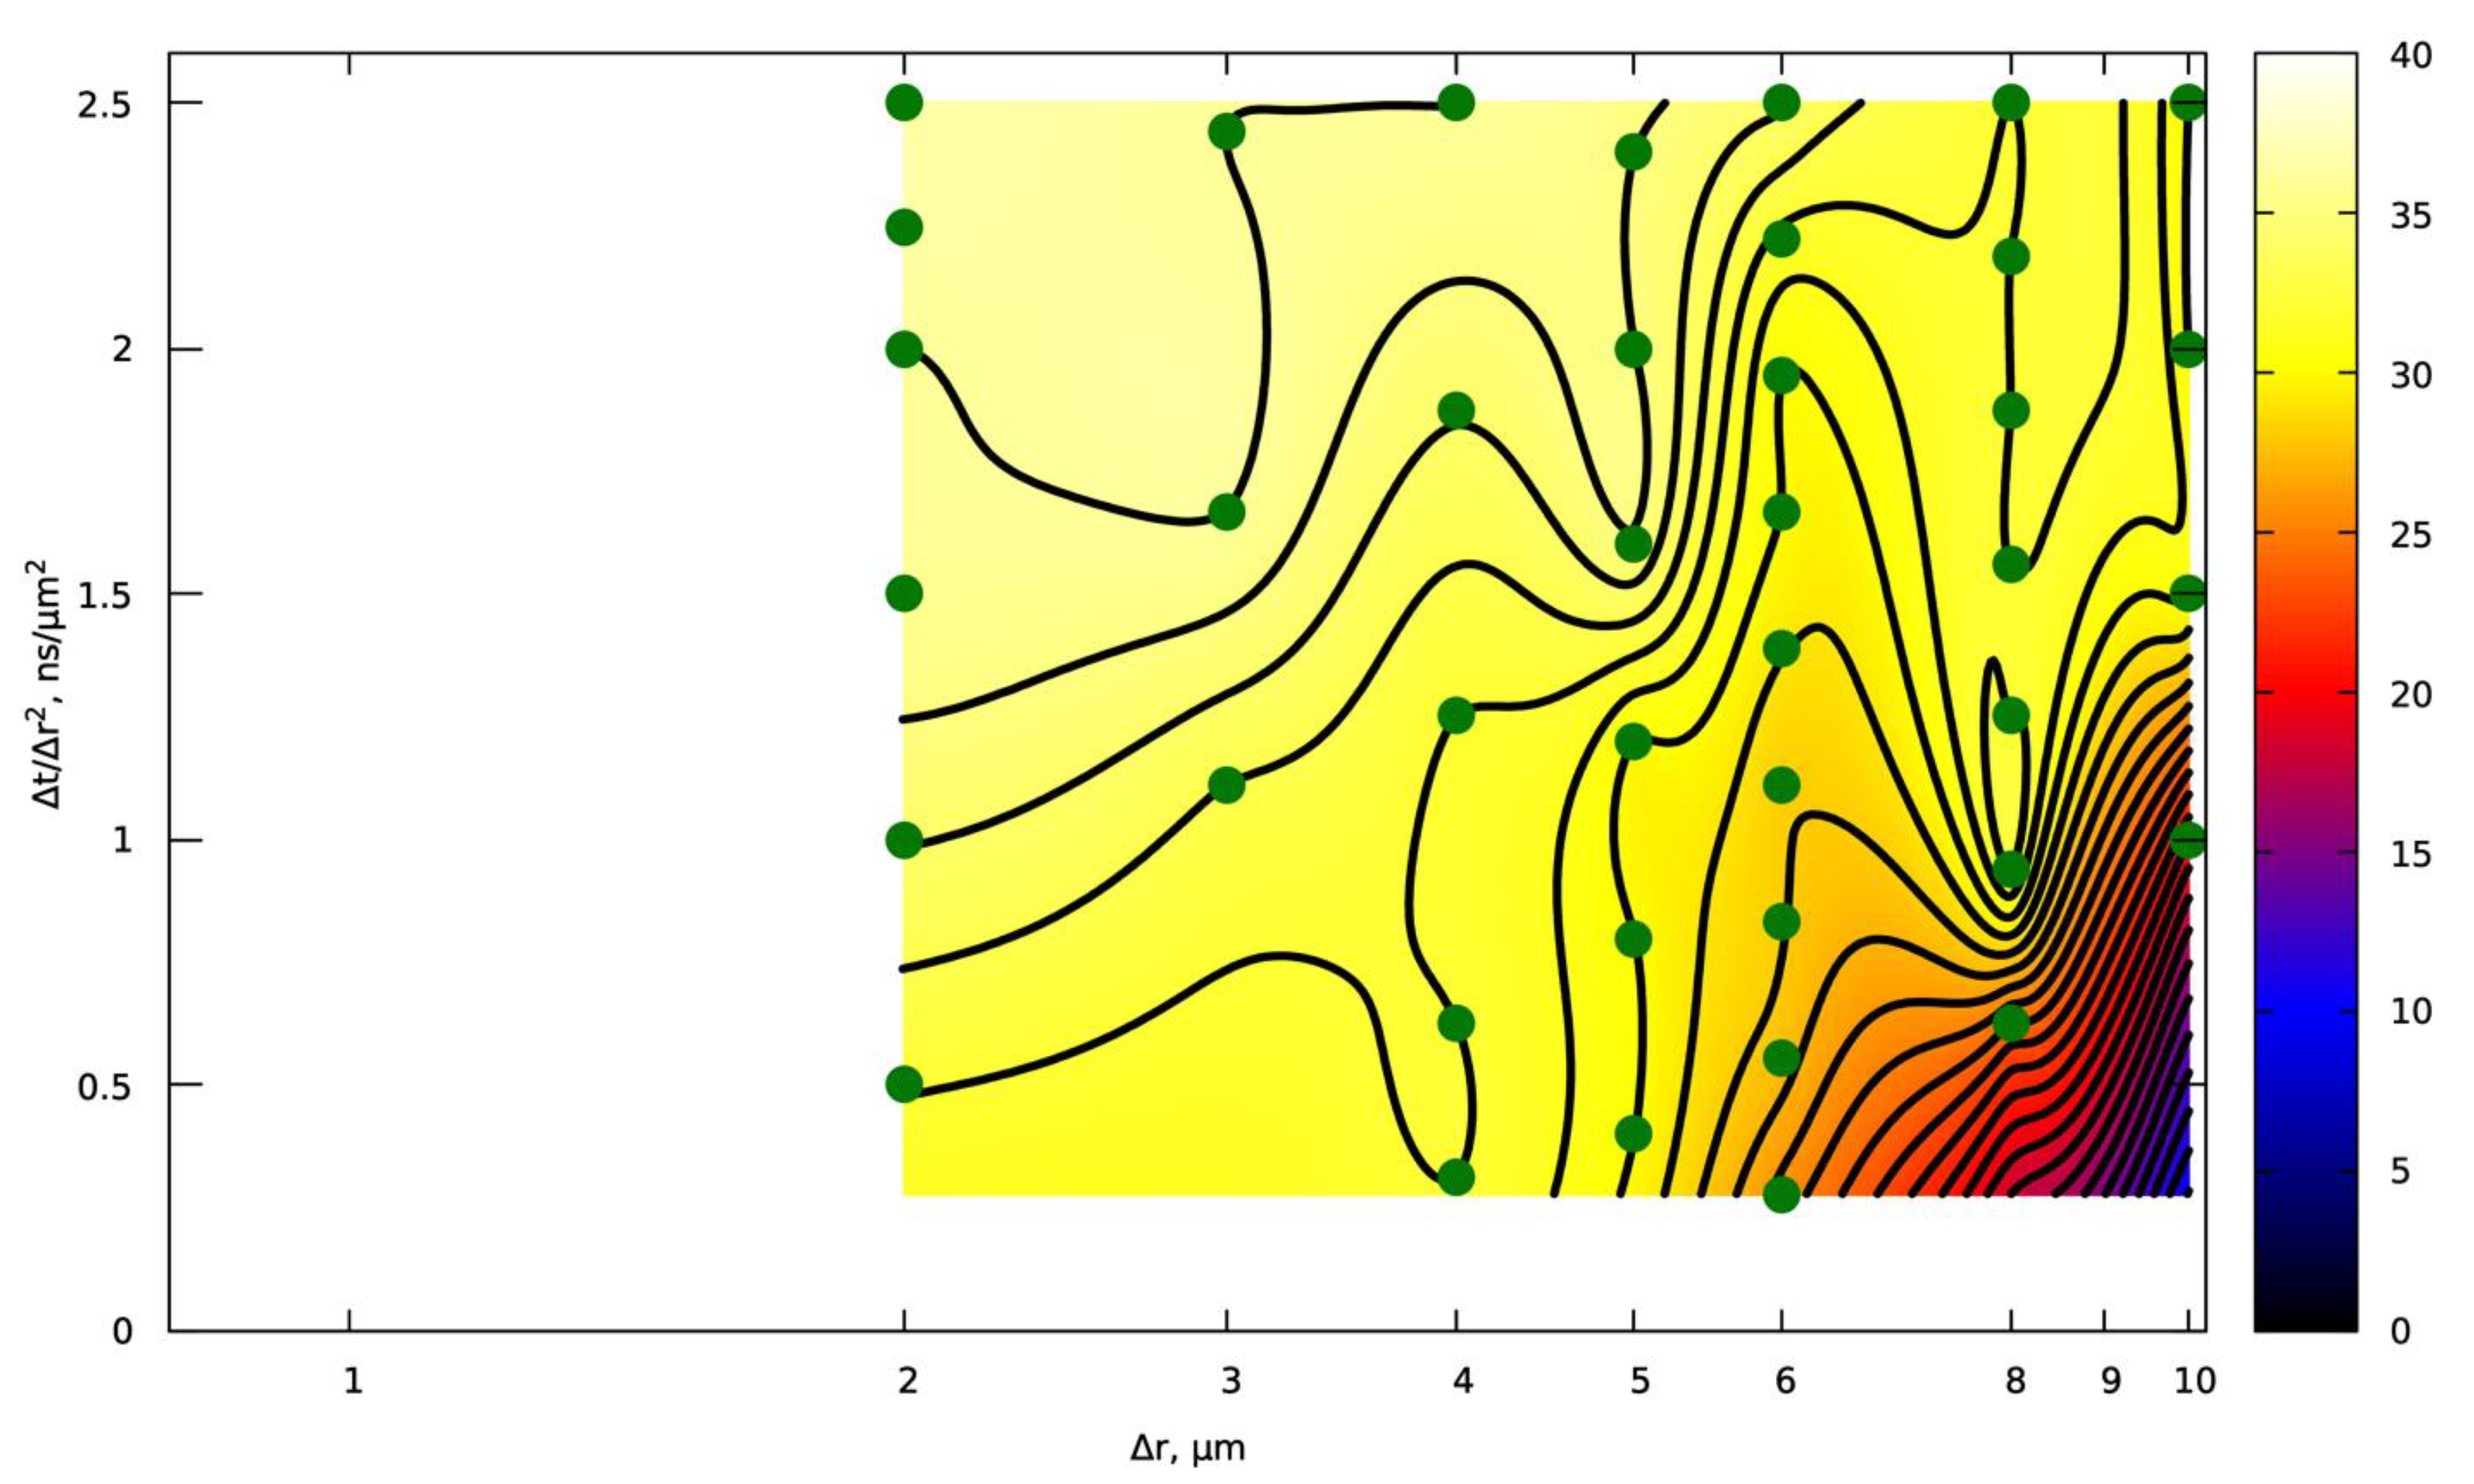
Figure 12 and
Figure 13, the calculations performed are shown in green dots, the abscissa axis shows the step in space ∆
x, and the ordinate axis shows the ratio ∆t/∆
x2. The condition ∆t/∆
x2 < 2.5 (the upper limit of the figures) is limited by the Courant condition.
Figure 12 shows the depth variation (standard deviation) for intense melting.
For the case of uniform melting, a series of calculations were also performed to study the convergence.
Figure 13 shows dependence of the track depth on the steps.
The results show that adequate solution accuracy and constructive convergence can be discussed only for spatial steps of ∆x ≤ 6 μm. If we assume that the most accurate solution is achieved for ∆x, ∆t → 0, then we can state that for the case of intense melting, with a decrease in the time step, the depth generally decreases, and with a decrease in the spatial step (while maintaining the ratio ∆t/∆x2 = const), the depth increases. Nevertheless, in general, the error in the track depth is no greater than the depth variation. It follows that the use of the values ∆x = 6 μm and ∆t = 90 ns is optimal in terms of ensuring high computational throughput while maintaining adequate solution accuracy. For non-intense melting, it is also clear that the values ∆x = 6 μm and ∆t = 90 ns also provide acceptable accuracy.
9. Conclusions
This study investigated the sensitivity of numerical simulations of the LPBF process to various parameters, including mesh resolution, time step, thermal diffusivity, surface tension, and laser absorption coefficient. It was determined that for the AlSi10Mg alloy, the optimal simulation parameters are a grid size of 6 µm and a time step of 90 ns, ensuring a balance between computational accuracy and efficiency for wide range of parameters.
The simulation results were also validated against experimental data. It was found that the melt pool depth is highly sensitive to both the laser beam diameter and the laser absorption coefficient in the liquid phase, with even small variations in these parameters leading to significant deviations in penetration depth. This highlights the importance of accurately defining beam characteristics for reliable model predictions. Surface tension primarily affects the cross-sectional shape of the melt track, while thermal diffusivity has a weak influence on both melt pool depth and width. Additionally, melt pool width is generally insensitive to most parameters, unless the process is operating near the transition between keyholing and conduction melting regimes.
The developed approach can be further applied to study the influence of LPBF process parameters on material structure and quality.
Author Contributions
Conceptualization, S.V.C.; methodology, M.V.B. and A.V.Z.; writing—original draft preparation, I.A.P. and D.D.Z.; writing—review and editing, S.V.C.; visualization, M.V.B., A.V.Z., and I.A.P.; supervision, S.V.C. All authors have read and agreed to the published version of the manuscript.
Data Availability Statement
The data presented in this study are available on request from the corresponding author. The data are not publicly available due to privacy.
Conflicts of Interest
Authors Maria V. Bogdanova and Andrey V. Zakirov were employed by the company Kintech Lab Ltd. The remaining authors declare that the research was conducted in the absence of any commercial or financial relationships that could be construed as a potential conflict of interest.
References
- Nabavi, S.F.; Farshidianfar, A.; Dalir, H. Comprehensive Review: Advancements in Modeling Geometrical and Mechanical Characteristics of Laser Powder Bed Fusion Process. Opt. Laser Technol. 2025, 180, 111480. [Google Scholar] [CrossRef]
- Abd-Elaziem, W.; Elkatatny, S.; Abd-Elaziem, A.-E.; Khedr, M.; El-Baky, M.A.A.; Hassan, M.A.; Abu-Okail, M.; Mohammed, M.; Järvenpää, A.; Allam, T.; et al. On the current research progress of metallic materials fabricated by laser powder bed fusion process: A review. J. Mater. Res. Technol. 2022, 20, 681–707. [Google Scholar] [CrossRef]
- Kusoglu, I.M.; Gökce, B.; Barcikowski, S. Research Trends in Laser Powder Bed Fusion of Al Alloys Within the Last Decade. Addit. Manuf. 2020, 36, 101489. [Google Scholar] [CrossRef]
- Zhang, L.C.; Attar, H. Selective Laser Melting of Titanium Alloys and Titanium Matrix Composites for Biomedical Applications: A Review. Adv. Eng. Mater. 2016, 18, 463–475. [Google Scholar] [CrossRef]
- Aboulkhair, N.T.; Simonelli, M.; Parry, L.; Ashcroft, I.; Tuck, C.; Hague, R. 3D printing of Aluminium alloys: Additive Manufacturing of Aluminum alloys using selective laser melting. Prog. Mater. Sci. 2019, 106, 100578. [Google Scholar] [CrossRef]
- de Souza, A.F.; Al-Rubaie, K.S.; Marques, S.; Zluhan, B.; Santos, E.C. Effect of Laser Speed, Layer Thickness, and Part Position on the Mechanical Properties of Maraging 300 Parts Manufactured by Selective Laser Melting. Mater. Sci. Eng. A 2019, 767, 138425. [Google Scholar] [CrossRef]
- Weingarten, C.; Buchbinder, D.; Pirch, N.; Meiners, W.; Wissenbach, K.; Poprawe, R. Formation and reduction of hydrogen porosity during selective laser melting of AlSi10Mg. J. Mater. Process. Technol. 2015, 221, 112–120. [Google Scholar] [CrossRef]
- Hyer, H.C.; Petrie, C.M. Effect of powder layer thickness on the microstructural development of additively manufactured SS316. J. Manuf. Process. 2022, 76, 666–674. [Google Scholar] [CrossRef]
- Cutolo, A.; Neirinck, B.; Lietaert, K.; de Formanoir, C.; Van Hooreweder, B. Influence of layer thickness and post-process treatments on the fatigue properties of CoCr scaffolds produced by laser powder bed fusion. Addit. Manuf. 2018, 23, 498–504. [Google Scholar] [CrossRef]
- Karimi, P.; Raza, T.; Andersson, J.; Svensson, L.-E. Influence of laser exposure time and point distance on 75-μm-thick layer of selective laser melted Alloy 718. Int. J. Adv. Manuf. Technol. 2018, 94, 2199–2207. [Google Scholar] [CrossRef]
- Sufiiarov, V.; Popovich, A.; Borisov, E.; Polozov, I.; Masaylo, D.; Orlov, A. The Effect of Layer Thickness at Selective Laser Melting. Procedia Eng. 2017, 174, 126–134. [Google Scholar] [CrossRef]
- Jia, Y.; Naceur, H.; Saadlaoui, Y.; Dubar, L.; Bergheau, J.M. A comprehensive comparison of modeling strategies and simulation techniques applied in powder-based metallic additive manufacturing. J. Manuf. Process. 2024, 110, 1–29. [Google Scholar] [CrossRef]
- Jia, Y.; Saadlaoui, Y.; Roux, J.-C.; Bergheau, J.-M. Steady-State Thermal Model Based on New Dedicated Boundary Conditions—Application in the Simulation of Laser Powder Bed Fusion Process. Appl. Math. Model. 2022, 112, 749–766. [Google Scholar] [CrossRef]
- Aarbogh, H.M.; Hamide, M.; Fjaer, H.G.; Mo, A.; Bellet, M. Experimental validation of finite element codes for welding deformations. J. Mater. Process. Technol. 2010, 210, 1681–1689. [Google Scholar] [CrossRef]
- Lu, X.; Lin, X.; Chiumenti, M.; Cervera, M.; Li, J.; Ma, L.; Wei, L.; Hu, Y.; Huang, W. Finite Element Analysis and Experimental Validation of the Thermomechanical Behavior in Laser Solid Forming of Ti-6Al-4V. Addit. Manuf. 2018, 21, 30–40. [Google Scholar] [CrossRef]
- Willy, H.J.; Li, X.; Chen, Z.; Herng, T.S.; Chang, S.; Ong, C.Y.A.; Li, C.; Ding, J. Model of laser energy absorption adjusted to optical measurements with effective use in finite element simulation of selective laser melting. Mater. Des. 2018, 157, 24–34. [Google Scholar] [CrossRef]
- Cook, P.S.; Murphy, A.B. Simulation of melt pool behaviour during additive manufacturing: Underlying physics and progress. Addit. Manuf. 2020, 31, 100909. [Google Scholar] [CrossRef]
- Galy, C.; Le Guen, E.; Lacoste, E.; Arvieu, C. Main defects observed in aluminum alloy parts produced by SLM: From causes to consequences. Addit. Manuf. 2018, 22, 165–175. [Google Scholar] [CrossRef]
- Cadiou, S.; Courtois, M.; Carin, M.; Berckmans, W.; Le Masson, P. Heat transfer, fluid flow and electromagnetic model of droplets generation and melt pool behaviour for wire arc additive manufacturing. Int. J. Heat Mass Transf. 2020, 148, 119102. [Google Scholar] [CrossRef]
- Zakirov, A.; Belousov, S.; Bogdanova, M.; Korneev, B.; Stepanov, A.; Perepelkina, A.; Levchenko, V.; Meshkov, A.; Potapkin, B. Predictive Modeling of Laser and Electron Beam Powder Bed Fusion Additive Manufacturing of Metals at the Mesoscale. Addit. Manuf. 2020, 35, 101236. [Google Scholar] [CrossRef]
- Zakirov, A.; Belousov, S.; Bogdanova, M.; Korneev, B.; Iskandarova, I.; Perepelkina, A.; Potapkin, B. KiSSAM: Efficient Simulation of Melt Pool Dynamics During PBF Using GPUs. Prog. Addit. Manuf. 2024, 9, 1491–1508. [Google Scholar] [CrossRef]
- Krüger, T.; Kusumaatmaja, H.; Kuzmin, A.; Shardt, O.; Silva, G.; Viggen, E.M. The Lattice Boltzmann Equation. In The Lattice Boltzmann Method: Principles and Practice; Springer International Publishing: Cham, Switzerland, 2017; pp. 61–104. [Google Scholar] [CrossRef]
- Ghasemi, A.; Fereiduni, E.; Balbaa, M.; Elbestawi, M.; Habibi, S. Unraveling the Low Thermal Conductivity of the LPBF Fabricated Pure Al, AlSi12, and AlSi10Mg Alloys Through Substrate Preheating. Addit. Manuf. 2022, 59, 103148. [Google Scholar] [CrossRef]
- Brandau, B.; Da Silva, A.; Wilsnack, C.; Brueckner, F.; Kaplan, A.F. Absorbance study of powder conditions for laser additive manufacturing. Mater. Des. 2022, 216, 110591. [Google Scholar] [CrossRef]
- Yang, P.; Deibler, L.A.; Bradley, D.R.; Stefan, D.K.; Carroll, J.D. Microstructure evolution and thermal properties of an additively manufactured, solution treatable AlSi10Mg part. J. Mater. Res. 2018, 33, 4040–4052. [Google Scholar] [CrossRef]
- Mills, K.C. Recommended Values of Thermophysical Properties for Selected Commercial Alloys; Woodhead Publishing: Cambridge, UK, 2002. [Google Scholar]
- Wei, P.; Wei, Z.; Chen, Z.; He, Y.; Du, J. Thermal behavior in single track during selective laser melting of AlSi10Mg powder. Appl. Phys. A 2017, 123, 604. [Google Scholar] [CrossRef]
- Dou, L.; Yuan, Z.; Li, J.; Li, J.; Wang, X. Surface tension of molten Al-Si alloy at temperatures ranging from 923 to 1123 K. Chin. Sci. Bull. 2008, 53, 2593–2598. [Google Scholar] [CrossRef]
Figure 1.
Measuring the depth, width, and height (if there is a powder layer) of the melted area.
Figure 1.
Measuring the depth, width, and height (if there is a powder layer) of the melted area.
Figure 2.
Cross-sections of tracks on the substrate obtained at 300 W power and 600 mm/s scanning speed for different values of the laser beam diameter. D4s = 75 µm, 80 µm, 85 µm, 90 µm, and 95 µm. Top: simulation results. Bottom: experiment; all sections are given on the same scale.
Figure 2.
Cross-sections of tracks on the substrate obtained at 300 W power and 600 mm/s scanning speed for different values of the laser beam diameter. D4s = 75 µm, 80 µm, 85 µm, 90 µm, and 95 µm. Top: simulation results. Bottom: experiment; all sections are given on the same scale.
Figure 3.
Dependence of the depth and width of the track on the substrate on the diameter of the laser beam; experimental values are shown by dotted lines.
Figure 3.
Dependence of the depth and width of the track on the substrate on the diameter of the laser beam; experimental values are shown by dotted lines.
Figure 4.
Dependences of the track dimensions on the scanning speed for different beam width values in the model: (a–c) track depth; (d–f) track width.
Figure 4.
Dependences of the track dimensions on the scanning speed for different beam width values in the model: (a–c) track depth; (d–f) track width.
Figure 5.
Variations in the shape of the track sections on the substrate with changes in absorption in the liquid phase of the alloy.
Figure 5.
Variations in the shape of the track sections on the substrate with changes in absorption in the liquid phase of the alloy.
Figure 6.
Sensitivity to laser radiation absorption in the liquid phase: (a) absorption coefficient as a function of temperature; (b) dependence of the depth and width of the melted area on the absorption value at a temperature of 900 K.
Figure 6.
Sensitivity to laser radiation absorption in the liquid phase: (a) absorption coefficient as a function of temperature; (b) dependence of the depth and width of the melted area on the absorption value at a temperature of 900 K.
Figure 7.
Reference values of thermal diffusivity for the solid and liquid phases for LM13 and LM25 alloys [
26].
Figure 7.
Reference values of thermal diffusivity for the solid and liquid phases for LM13 and LM25 alloys [
26].
Figure 8.
Dependences of the depth and width of the tracks on the thermal diffusivity value at P = 325 W: (a,b) track depth, (c,d) track width at V = 300 and 1200 mm/s, respectively.
Figure 8.
Dependences of the depth and width of the tracks on the thermal diffusivity value at P = 325 W: (a,b) track depth, (c,d) track width at V = 300 and 1200 mm/s, respectively.
Figure 9.
Change in the shape of the cross-section of the remelted part of the track at different values of surface tension: (a–c) simulation, (d) experiment.
Figure 9.
Change in the shape of the cross-section of the remelted part of the track at different values of surface tension: (a–c) simulation, (d) experiment.
Figure 10.
Dependence of surface tension on temperature from literary sources: (a) from work [
27], (b) from work [
28], and (c) approximation.
Figure 10.
Dependence of surface tension on temperature from literary sources: (a) from work [
27], (b) from work [
28], and (c) approximation.
Figure 11.
Track depth in µm with intensive melting parameters (power 350 W, speed 1200 mm/s); contour lines are drawn every 10 µm.
Figure 11.
Track depth in µm with intensive melting parameters (power 350 W, speed 1200 mm/s); contour lines are drawn every 10 µm.
Figure 12.
Variation in the track depth in µm under intensive melting parameters (power 350 W, speed 1200 mm/s); contours of isolines are drawn every 2 µm.
Figure 12.
Variation in the track depth in µm under intensive melting parameters (power 350 W, speed 1200 mm/s); contours of isolines are drawn every 2 µm.
Figure 13.
Track depth in µm under intensive melting parameters (power 300 W, speed 1500 mm/s); contours of isolines are drawn every 1 µm.
Figure 13.
Track depth in µm under intensive melting parameters (power 300 W, speed 1500 mm/s); contours of isolines are drawn every 1 µm.
Table 1.
Recommended parameters for the steps in space and time.
Table 1.
Recommended parameters for the steps in space and time.
| ∆x = 2 µm | ∆t = 10 ns |
| ∆x = 3 µm | ∆t = 22 ns |
| ∆x = 4 µm | ∆t = 40 ns |
| ∆x = 5 µm | ∆t = 60 ns |
| ∆x = 6 µm | ∆t = 90 ns |
| ∆x = 7 µm | ∆t = 120 ns |
Table 2.
List of the material parameters used in the model.
Table 2.
List of the material parameters used in the model.
| Thermophysical Properties of AlSi10Mg | Value |
|---|
| Density at temperature Tliq, kg/m3 | 2500 |
| Viscosity, m2/s | 10−6 |
| Liquidus temperature Tliq, K | 867 |
| Solidus temperature Tsol, K | 831 |
| Surface tension, N/m | 1.00 − 1.52 × 10⁻⁴ T |
| Wetting angle of the substrate surface, ° | 0 |
| Wetting angle of the powder particle surface, ° | 120 |
| Thermal diffusivity in the solid phase, m2/s | 7.40 × 10⁻⁵ − 3.00 × 10⁻⁸ T |
| Thermal diffusivity in the liquid phase, m2/s | 1.88 × 10⁻⁵ + 6.43 × 10⁻⁹ T |
| Isobaric volumetric heat capacity, J/(m3K) | 2.3 × 10⁶, at
0 < T ≤ 600 K |
2.5 × 10⁶, at
600 K < T ≤ 800 K |
2.8 × 10⁶, at
800 K < T ≤ 867 K |
| 2.6 × 10⁶, at T > 867 K |
| Absorption coefficient in solid phase | 0.1 |
| Liquid phase absorption coefficient | 8.86 × 10⁻² + 2.38 × 10⁻⁵ T |
| Latent heat of melting, J/m3 | 1.06 × 10⁹ |
| Evaporation coefficients in the formula Psat(T)[Pa] = 10A−B/(C+T[K]) |
| A | 10.917 |
| B | 16,211 |
| C | 0 |
| Disclaimer/Publisher’s Note: The statements, opinions and data contained in all publications are solely those of the individual author(s) and contributor(s) and not of MDPI and/or the editor(s). MDPI and/or the editor(s) disclaim responsibility for any injury to people or property resulting from any ideas, methods, instructions or products referred to in the content. |
© 2025 by the authors. Licensee MDPI, Basel, Switzerland. This article is an open access article distributed under the terms and conditions of the Creative Commons Attribution (CC BY) license (https://creativecommons.org/licenses/by/4.0/).
