Article

Identifying the Potential of Urban Ventilation Corridors in Tropical Climates

by
Marcellinus Aditama Judanto
1 and
Dany Perwita Sari
2,*
1
Department of Architecture, Diponegoro University, Semarang 50275, Indonesia
2
Research Center for Structural Strength Technology, Research Organization for Energy and Manufacture, National Research and Innovation Agency (BRIN), Tangerang Selatan 15314, Indonesia
*
Author to whom correspondence should be addressed.
Modelling 2025, 6(4), 129; https://doi.org/10.3390/modelling6040129
Submission received: 6 August 2025 / Revised: 7 October 2025 / Accepted: 12 October 2025 / Published: 15 October 2025

Abstract

Rapid urbanization and global climate change are leading to intensified Urban Heat Island (UHI) in tropical regions. This study examined and analyzed urban ventilation corridors to mitigate UHI, paying particular attention to the building arrangement and wind environment. The comprehensive review emphasizes the importance of macro-scale urban planning, including the orientation of street grids and the design of breezeways and air paths. After analyzing these strategies, CFD simulations were applied to the design of high-rise buildings in Semarang and residential areas in Jakarta. These studies revealed that in high-rise building areas in Semarang, the proposed design configuration resulted in a 62% increase in ground-level wind speeds. A further analysis of residential areas in Jakarta revealed that the most comfortable location within a house was in the second row, facing the wind, where the distance between houses was 8.5 m, and the average velocity was 2.78 m/s. Research conducted in this area may contribute to the development of more sustainable and resilient urban areas in tropical climates, as well as assist local governments in planning for these areas.

1. Introduction

Earth’s surface temperature has increasingly warmed in recent decades, with the rate of warming accelerating considerably [1]. With global temperatures on the rise, climate change will likely exacerbate dangerously high temperatures, which in turn will lead to more frequent and intense heatwaves, which will further exacerbate Urban Heat Islands (UHI) already prevalent in many cities [2]. There is no doubt that the accelerated pace of temperature increases suggests that historical climate adaptation methods will not be adequate in the future. Especially in tropical regions, the confluence of global warming and rapid urbanization often associated with diminished green space intensifies the UHI effect [3].
Indonesia, which is located predominantly in tropical areas, has experienced a significant rise in temperatures that has been estimated to be approximately 0.45–0.75 °C over the past century [4]. This leads to a steep increase in the demand for air conditioners, which further contribute to increased carbon emissions and heat outside the building [5]. To counter these impacts and to ensure comfortable and healthy living conditions, effective strategies need to be developed. The Indonesian government has implemented several regulations, including a new regulation regarding green buildings. The implementation of these strategies was not possible in a short period of time due to the fact that they require a large amount of specialized knowledge and information, high costs, and certification for green buildings [6]. A simpler and easier-to-understand strategy is required, especially for newly constructed buildings.
Previous research has shown that cross ventilation during the night can reduce the air temperature during the daytime by up to 2 °C in Indonesia’s tropical climate [7]. However, most buildings in Indonesia had a small amount of openings due to a lack of land available for construction, which reduced the amount of cross ventilation. Moreover, the direction and speed of wind around the building played an important role in maximizing cross ventilation [8]. The design of an urban ventilation corridor was one of the strategies that could be used to increase the wind flow, wind speed, and provide better cross ventilation inside the building.
The implementation of urban ventilation strategies in tropical climate zones presents both unique challenges and significant opportunities [9]. Hong Kong, for example, has demonstrated that tailored ventilation strategies can improve the microclimate of its high-density subtropical city [10]. In these regions, temperatures and humidity levels are consistently high, which makes achieving thermal comfort particularly challenging [11]. Currently, there is not enough research being conducted in tropical climates.
A number of studies have used CFD (Computational Fluid Dynamics) simulations to study the changes in wind patterns around the city in response to the proposed strategy. CFD simulation was chosen as it achieves accurate and similar results to the site measurement [12,13] as well as the wind tunnel experiment [8,14]. CFD can also be configured with domain size, grid discretization, boundary conditions, solution algorithm, and convergence of turbulence models. In many aspects such as wind conditions and parametric study of generic buildings, CFD can provide quantitative information about urban wind conditions with the pattern. Results of this analysis relate to morphology strategies in urban areas (breezeways, density, staggering) on wind flow and ventilation in high-density areas [15]. CFD was able to analyze 12 different urban models and simulate the most effective strategy for Singapore. It is even possible to analyze the performance of internal natural ventilation within common Singapore Public Housing (HDB) flat types using CFD [16]. In order to validate the numerical results, CFD simulations were conducted on typical three-room and four-room HDB flat models and on-site measurements were made to allow comparison among similar results. CFD simulation was an effective tool in simulating wind flow in urban areas as a result of this study.
In this study, urban ventilation corridors were reviewed and analyzed for mitigation of urban heat island effects, with a particular emphasis on building arrangement and wind conditions. A properly designed urban ventilation system can provide substantial benefits in terms of improving both indoor and outdoor thermal comfort, thereby reducing heat stress among the population. The objective of this study is to present a summary of strategies related to urban ventilation corridor design in tropical climates. These strategies will be implemented in two cities in Indonesia: high rise building composition in Semarang and residential area design in Jakarta with the aid of CFD simulations. Further, it will mitigate the intensified effect of UHI, which would otherwise result in dangerously uncomfortable and potentially dangerous conditions for human health.

2. Rising Temperature and Urban Heat Island

Urban environments worldwide face significant and multifaceted challenges as a result of climate change and global warming. Over the past few decades, human activities have primarily contributed to a century-scale increase in Earth’s average temperature. Data indicate a clear warming trend reported that from 2011 to 2020, Earth’s surface warmed by 1.09 °C (0.95 to 1.20 °C) over the 1850–1900 baseline [17]. The National Oceanic and Atmospheric Administration estimates that global temperatures have increased by an average 0.06 °C per decade since 1850, a rate that has more than tripled to 0.20 °C per decade since 1982 [18]. Moreover, the highest temperatures have consistently been recorded since records began, with 2023 standing as the warmest year on record. This rapid warming not only sets new standards for temperature but also interacts with socioeconomic development in a way that compounds climate-related risks, particularly in cities in vulnerable regions [19]. Climate change has significant implications for nations in tropical zones, such as Indonesia. Indonesia’s mean annual temperature has already increased by 0.8 °C relative to the 1951–1980 baseline, which signals a worrying trajectory for future climate conditions. The Intergovernmental Panel on Climate Change (IPCC) has also reported that ongoing climate change increases heat stress risks and UHI in urban centers throughout Asia [2].
Urban Heat Islands (UHI) and extreme heat events in Indonesia have increased significantly [19]. In urban areas, the UHI phenomenon refers to the significantly higher ambient temperatures than in surrounding rural and suburban areas [20,21]. UHI intensity (ΔTUHI) is expressed numerically as a difference between urban (Turban) and rural temperature (Trural):
ΔTUHI = Turban − Trural
There are a number of factors which contribute to the development of this temperature differential. A major contributing factor is the increased absorption and retention of solar radiation by materials such as concrete, asphalt, and dark roofing, which have different thermal properties than natural landscapes. It is important to note that the intricate geometry of urban corridors, caused by tall buildings and relatively narrow streets, can further trap heat, reduce the skyview factor that limits radiative cooling during the night, and impede natural wind flow that might otherwise result in convective cooling [11,22]. These physical changes are compounded by reduced evapotranspiration due to the loss of vegetation and permeable surfaces [5], together with waste heat generated by humans, including buildings, industrial processes, and transportation, which all contribute greatly to the elevated temperatures associated with the UHI effect. It is important to note that the UHI effect does have a significant impact on the environment. Numerous studies have shown that UHI can exacerbate the concentrations of specific urban pollutants and adversely impact urban air quality as a whole. This leads to increased peak electricity demands, higher CO2 emissions, and a larger ecological footprint for cities as well as higher energy consumption [23,24,25]. Further, UHI poses a serious risk to human health by intensifying heat stress, reducing thermal comfort, and possibly affecting the urban economy [19].
The level of UHI has increased in major Indonesian cities such as Jakarta and Bandar Lampung [26]; its effects are also becoming more evident in other tropical regions where rapid urbanization continues to change the landscape [2,19,27]. The rapid warming trend calls for urgent attention to sustainable cooling solutions, corroborated by the need to handle escalating building energy and cooling loads caused by increasing air temperatures and solar radiation [9]. Increasing temperatures in Indonesia contribute to an increased reliance on mechanical cooling systems, primarily air conditioning (AC), in order to mitigate thermal discomfort and maintain livability. In spite of its many benefits, including prolonged productivity in an indoor work environment, enhanced learning conditions, and improved rest, this dependence has significant environmental and energy implications [28]. Data from March 2017 indicates that 7.98 percent of households in Indonesia use air conditioning [29]. It is projected that the number of air conditioning units will increase from 40 million in 2017 to 300 million in 2040, of which half will be located in Indonesia [30]. An increase in the use of air conditioning has profound consequences. According to projections, AC consumption will be the primary driver of global electricity demand by 2040 [30]. It is estimated that global AC use contributed around one billion tons of CO2 emissions during that year alone, nearly doubling from 944 TWh to 2111 TWh in 2022 due to the overall increase in electricity demand [28]. A rise in air temperatures and solar radiation driven by climate change has a direct impact on the need to manage increasing building energy and cooling loads [9].
Aside from this, the operation of air conditioning systems itself contributes to a vicious cycle by aggravated the Urban Heat Island effect. Waste heat released from AC condensers further raises local ambient temperatures [20]. Consequently, urban areas become significantly warmer than their surrounding rural areas, fueling even greater demand for air conditioning [23,24]. This increasing cooling demand poses a particular challenge in rapidly growing cities, thus emphasizing the need for sustainable cooling solutions [19].
Particularly in urbanized tropical regions, the increased use of artificial cooling often results from a significant reduction in the level of outdoor comfort. The concept of comfort refers to the subjective satisfaction with the thermal conditions of the surrounding outdoor environment, influenced by the complex interplay of ambient air temperature, the radiative mean temperature resulting from solar radiation and the surrounding surfaces, as well as wind speed and humidity [31]. In urban areas, particularly those badly affected by the UHI phenomenon, conditions of thermal stress frequently prevail, resulting in a reduction in outdoor public use and a deterioration of quality of life [19]. In order to assess outdoor thermal comfort, comprehensive bioclimatic indices such as the Universal Thermal Climate Index (UTCI) or Physiological Equivalent Temperature (PET) are often used. A temperature equivalent index represents the physiological response of the human body to a given thermal environment. In order to achieve this, several key meteorological variables will be integrated [32,33,34]:
  • Air temperature (Ta);
  • Mean radiant temperature (Tmrt) (the exchange of solar and longwave radiation);
  • Wind speed (va);
  • Water vapor pressure (or relative humidity).
Although the full calculations are complex and often embedded in specialized software [35] (such as PET for classifying wind speeds), understanding these primary inputs illustrates the multifaceted nature of thermal perception. These indices have been used in studies across a wide variety of climates, including tropical and subtropical cities [33,36]. Further, it is becoming increasingly recognized that thermal comfort includes psychological and affective dimensions in addition to these physiological parameters. When individuals experience and interact with outdoor urban spaces, their experiences and interactions with those spaces are shaped critically by their transition from mere thermal sensations (feeling hot or cold) to thermal affects (feeling pleasant or unpleasant) [37]. Increasing discomfort experienced in urban outdoor environments in response to UHI and broader warming trends contributes to the migration of populations indoors towards conditioned spaces, which emphasizes the necessity for interventions which can enhance and restore outdoor living conditions.

3. Urban Ventilation Corridor

Often regarded as one of the most important aspects of urban climatology, urban ventilation strategies accomplish this through a natural mechanism to improve air quality and thermal comfort, thus neutralizing the impacts of global warming and UHI [38]. A ventilation corridor is crucial to reduce air pollution and heat stress in urban areas by supplying fresh air and diluting pollutants and heat. The purpose of the Urban ventilation corridors (air paths) is to channel cooler, fresher air from surrounding areas into the urban core [39,40,41,42]. Generally, this natural process is a result of the interaction between prevailing airflows and the physical structure of the city. Several factors, such as building height, density, layout, street width, and overall porosity, contribute significantly to the ventilation performance of cities [35,38,43,44]. Research has shown that specific building geometries and their arrangement can significantly influence airflow patterns at both pedestrian and district scales [8,14,45]. An urban ventilation corridor’s design, however, relies heavily on the understanding of local meteorological conditions, including wind patterns, speeds, and directions, as well as the interaction between those factors and the architecture and urban landscape [46,47].
In order to understand the current status of research on urban ventilation, a study of publications from 2014 to 2024 was conducted using the journals Taylor & Francis, MDPI, Google Scholar, and Elsevier databases. To locate relevant research that was published during this period, the phrase “urban ventilation in tropical climates” was used in the search. Over the past decade, there have been a significant number of publications relevant to urban ventilation within tropical climates, ranging from four to eight per year. This area of research remains relevant and ongoing, with peaks in 2014, 2021, and 2024, and relative dips in other years. A wide range of factors could explain these fluctuations, including the initiation and completion of specific projects, shifting funding priorities, or responding to environmental concerns and climatic events. Research into urban ventilation highlights the importance of understanding, establishing, and improving strategies as urbanization in tropical regions continues and the impacts of climate change intensify.
A comprehensive review of established and emerging design strategies for urban ventilation in tropical climates is provided in this chapter. The first is to address road grid orientation and make deliberate efforts to create breezeways and air paths to facilitate wind penetration. As the second topic, natural element Integration will be discussed, in order to determine whether it can be of benefit to cooling and air channeling. Furthermore, strategies for optimizing the morphology, disposition, and permeability of buildings at both the district and individual building levels will be discussed. Finally, the chapter examines innovative solutions using smart ventilation approaches to enhance passive design performance.

3.1. An Overview of the Orientation of Street Grids

An important strategy for increasing urban ventilation, particularly in tropical climates, involves orienting street grids in accordance with the prevailing wind direction [35]. According to research, lining main streets, avenues, and breezeways parallel to or within a 30-degree angle of regional winds optimizes wind penetration in urban areas [46], as illustrated in Figure 1. Using this strategic alignment, airflow in the urban environment will not be unduly obstructed, and therefore accumulated heat and pollutants will be dispersed more effectively [35]. High-density cities like Hong Kong demonstrate the successful implementation of this principle in their Air Ventilation Assessment (AVA) guidelines [46].
A developed methodology for identifying and planning optimally oriented street grids and ventilation corridors, such as Geographic Information Systems (GIS), helps identify potential air paths by analyzing urban morphology and surface roughness [47]. The Frontal Area Index (FAI) can be used to map urban permeability, and the Least Cost Path (LCP) methodology is used to delineate potential wind corridors that channel cooling breezes into the urban fabric from suburban areas or natural features [41,48]. In dense urban areas, some comprehensive computational approaches integrate mesoscale meteorological data, satellite-derived Land Surface Temperatures (LST), and detailed building databases [49]. Integrated assessment methods have been demonstrated to be effective in subtropical megacities such as Shenzhen in identifying wind walls and designing ventilation corridors that take into account terrain, vegetation, and open space [42,50]. Quantitative methods have been developed for detecting effective ventilation paths even in complex topographies such as mountainous cities [48].
In addition to the macroscale orientation of the street grid, individual street corridors are influenced by heights and widths of flanking buildings (Aspect Ratio, AR). CFD (Computational Fluid Dynamics) studies have shown that air renewal in street corridors decreases with increasing aspect ratios (i.e., in narrower and deeper corridors), and that their airflow patterns are sensitive to wind velocity [45]. In order to enhance thermal comfort in a city, a well-aligned street grid, accompanied by appropriate street corridor design, is fundamental [35].

3.2. The Creation of Breezeways and Air Paths

Another critical design strategy for improving urban ventilation is to create well-defined air paths and breezeways [46]. Using this method, cooler, fresher air is guided from less congested areas, such as parks, water bodies, or the urban periphery, into densely built urban areas [39,46]. Planning these ventilation corridors often relies on advanced analytical techniques. Geographic Information System (GIS) can be used to identify high ventilation areas and map out potential air paths by evaluating urban morphology, including surface roughness and the Frontal Area Index (FAI) [41,47]. These corridors are commonly identified using Least Cost Path (LCP) methodologies within GIS frameworks, channeling breezes through paths with low urban resistance [42,48]. The wind paths of dense urban environments can even be planned using mesoscale meteorological data and satellite imagery [49], or models can be used to track natural cold air flows into cities at night [51].
When implementing breezeways and air paths, existing open spaces should be strategically linked, open plazas are established at road junctions, and lower building heights should be maintained [46]. As shown in Figure 2, widening minor roads that connect major thoroughfares, which act as primary air pathways, can further contribute to the development of an air pathway hierarchy [46]. Research in cities such as Shenzhen has shown how integrated assessment can optimize ventilation corridors that consider terrain, vegetation, and open spaces [42,50]. All air paths must avoid or minimize obstacles such as extensive podium structures or sky bridges that can impede pedestrian airflow at all scales [46]. A strategy of creating clear, interconnected breezeways is particularly beneficial and relevant in tropical cities, where even gentle breezes can significantly improve outdoor thermal comfort and urban air quality.

3.3. The Integration of Natural Elements

The strategic incorporation of natural elements, encompassing significant green spaces (such as parks, street trees, and widespread vegetation), is a cornerstone of effective urban environmental management, which can play a crucial role in mitigating the UHI effect and improving natural ventilation, especially in tropical climates [5,52]. The presence of these elements in at least 50% of the urban area can yield significant microclimatic benefits [53]. Urban greeneries, as shown in Figure 3, contribute by providing shade, reducing ambient and surface temperatures, and acting as sources of cooler air. Various factors, including species composition, canopy cover, and the size and shape of the green area, affect the cooling efficiency of parks [52,53,54]. Historically, every city in Indonesia has had a central park called an alun-alun. This park has served as a hub of social, political, and religious activity. Alun-alun has evolved over time into a community center, a meeting place, or even a tourist attraction (Figure 3a). The design of these central parks could be used as one of the strategies for creating urban ventilation in Indonesia.
In addition, green corridors can act as vital ventilation channels, facilitating the movement of fresher, cooler air from the urban periphery into the denser urban core [55]. Choosing the right tree species, canopy density, Leaf Area Index (LAI), and even distributing trees within residential quarters and along streets are key elements in optimizing airflow and shade provision [5,56,57,58]. The shadow cast patterns of different tree species have been shown to directly impact thermal comfort within street corridors and adjacent neighborhoods [56].
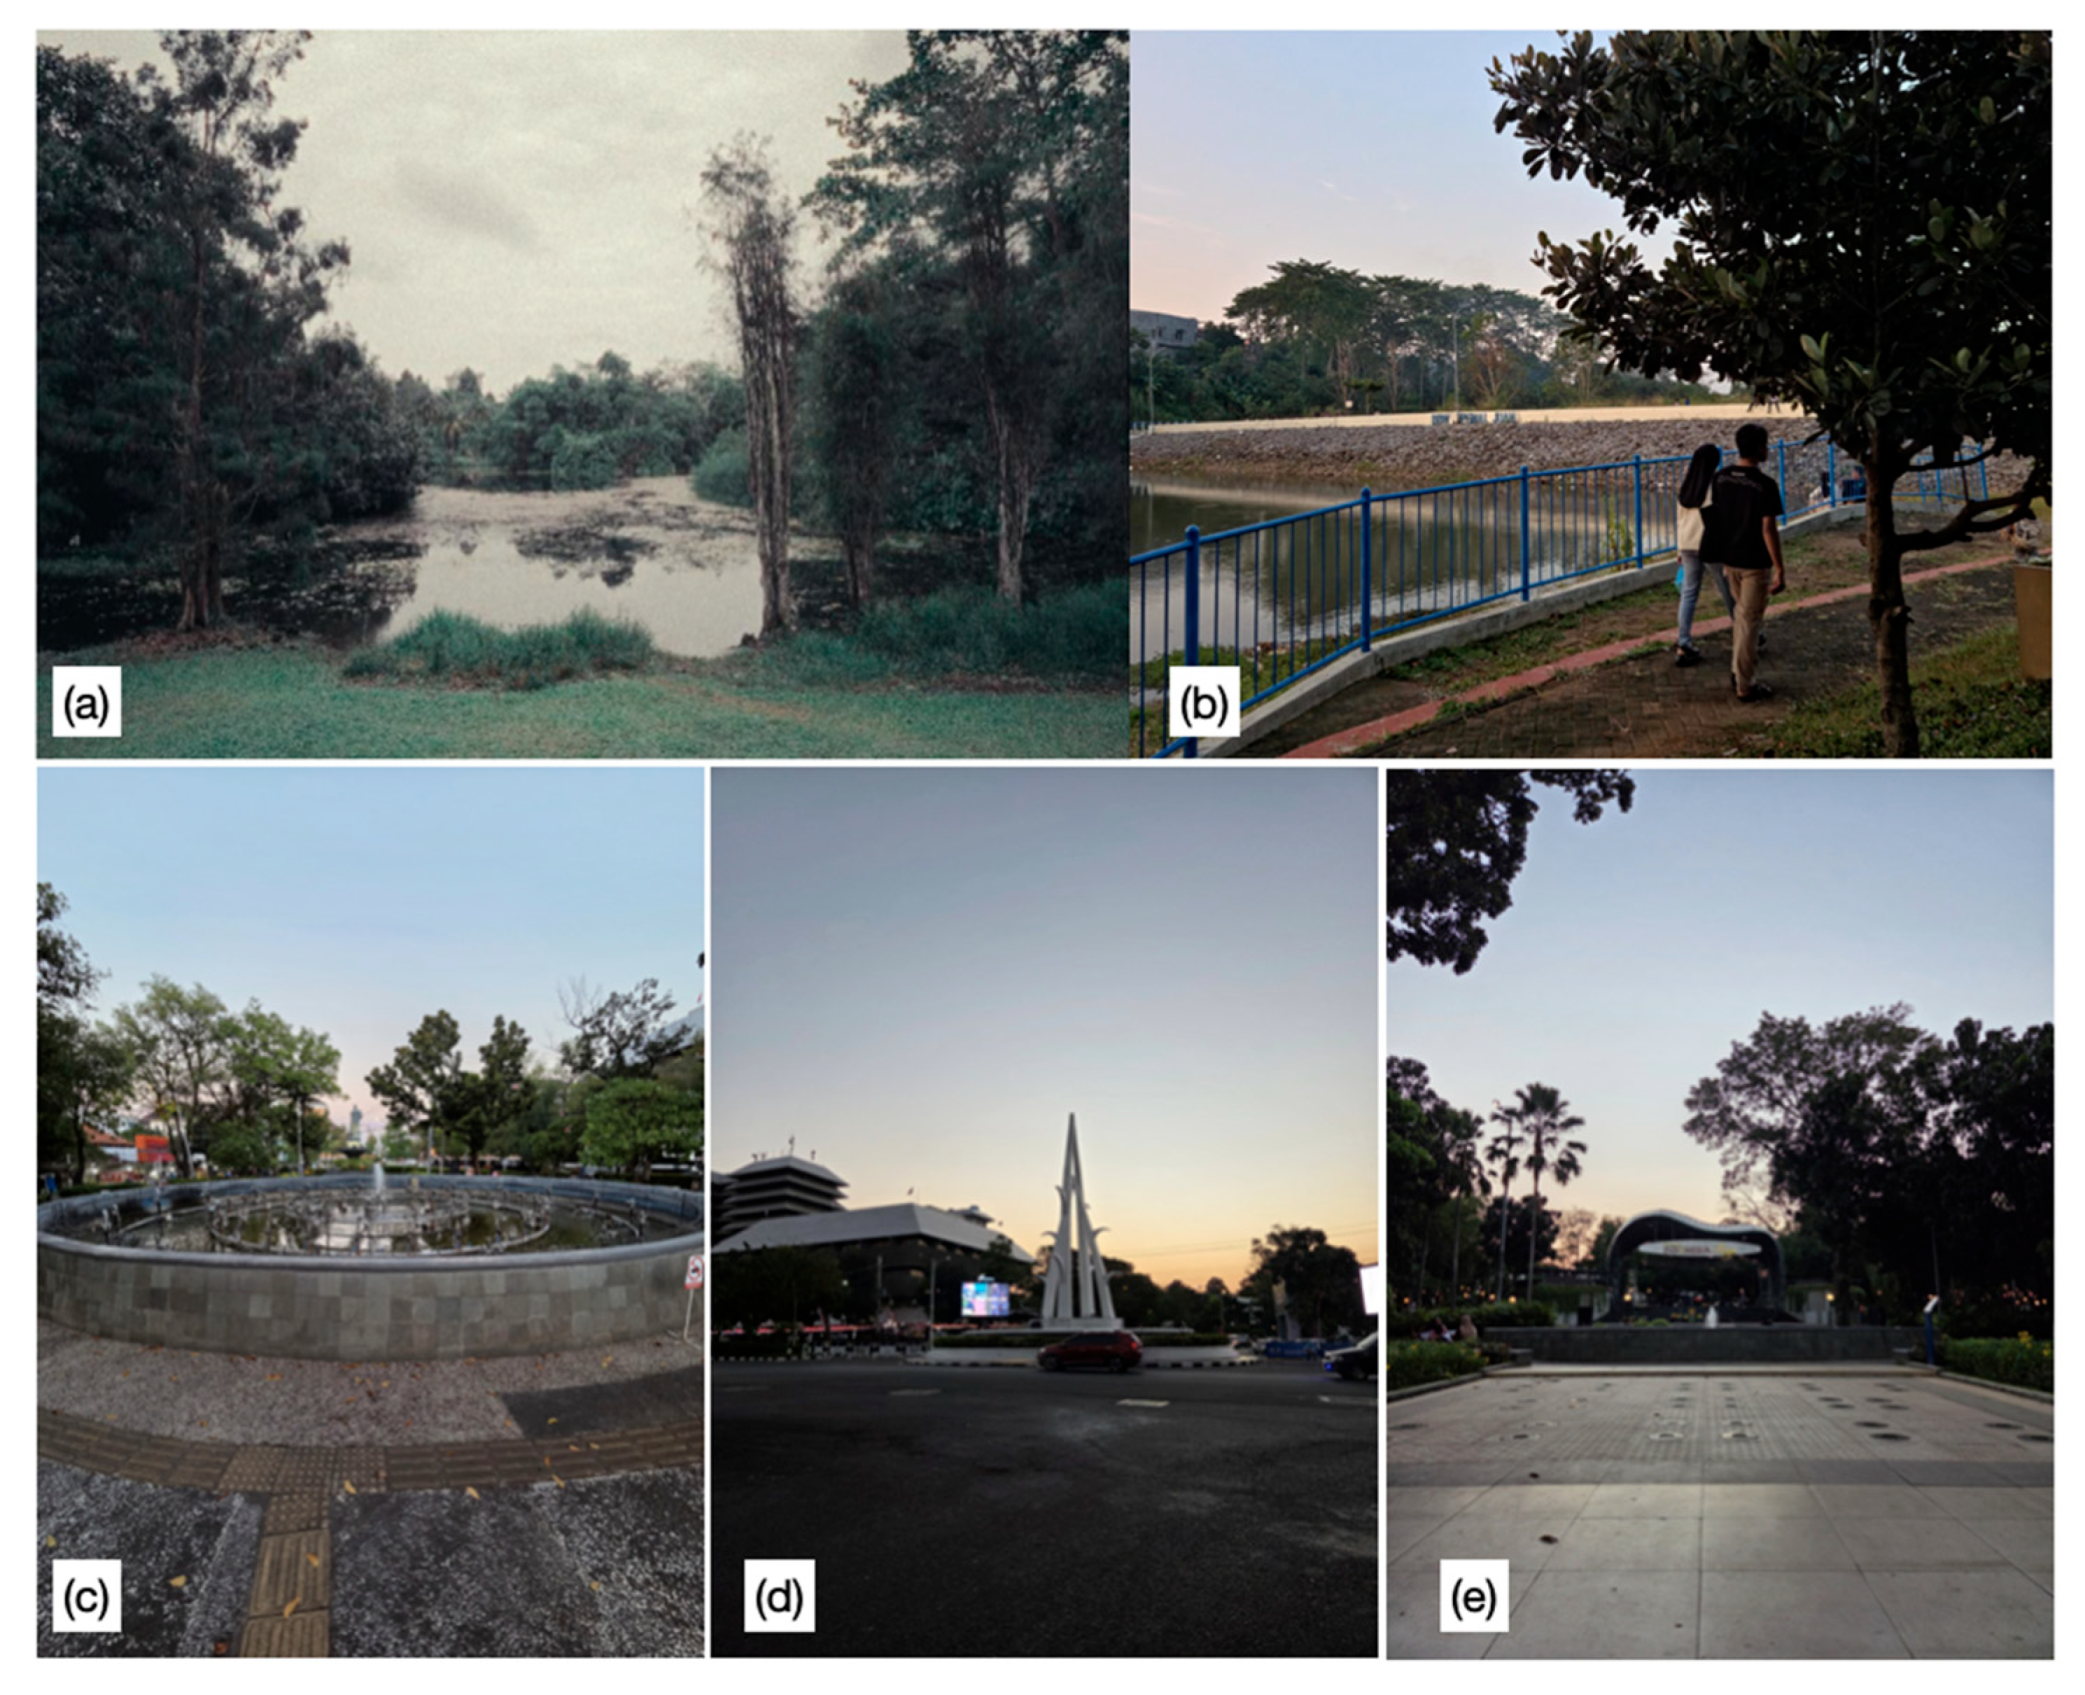
Blue spaces have notable benefits as well. The placement of a strategically located water body, even a small one, reduces localized temperatures and increases thermal comfort through evaporation cooling, which is amplified by wind movement [5] as illustrated in Figure 4. Research has also quantified the relationship between urban water bodies and Land Surface Temperature (LST), confirming their cooling influence [59]. Like alun-alun, Indonesian cities have also historically been fond of designing blue spaces and presenting them as decorative fountains (Figure 4c–e). Besides serving as decorative elements, these fountains can also provide a place for social and recreational activities for the community and also provide air circulation in the city. Orienting street landscaping perpendicular to water bodies will further assist in channeling this cooled air deeper into urban areas [5].
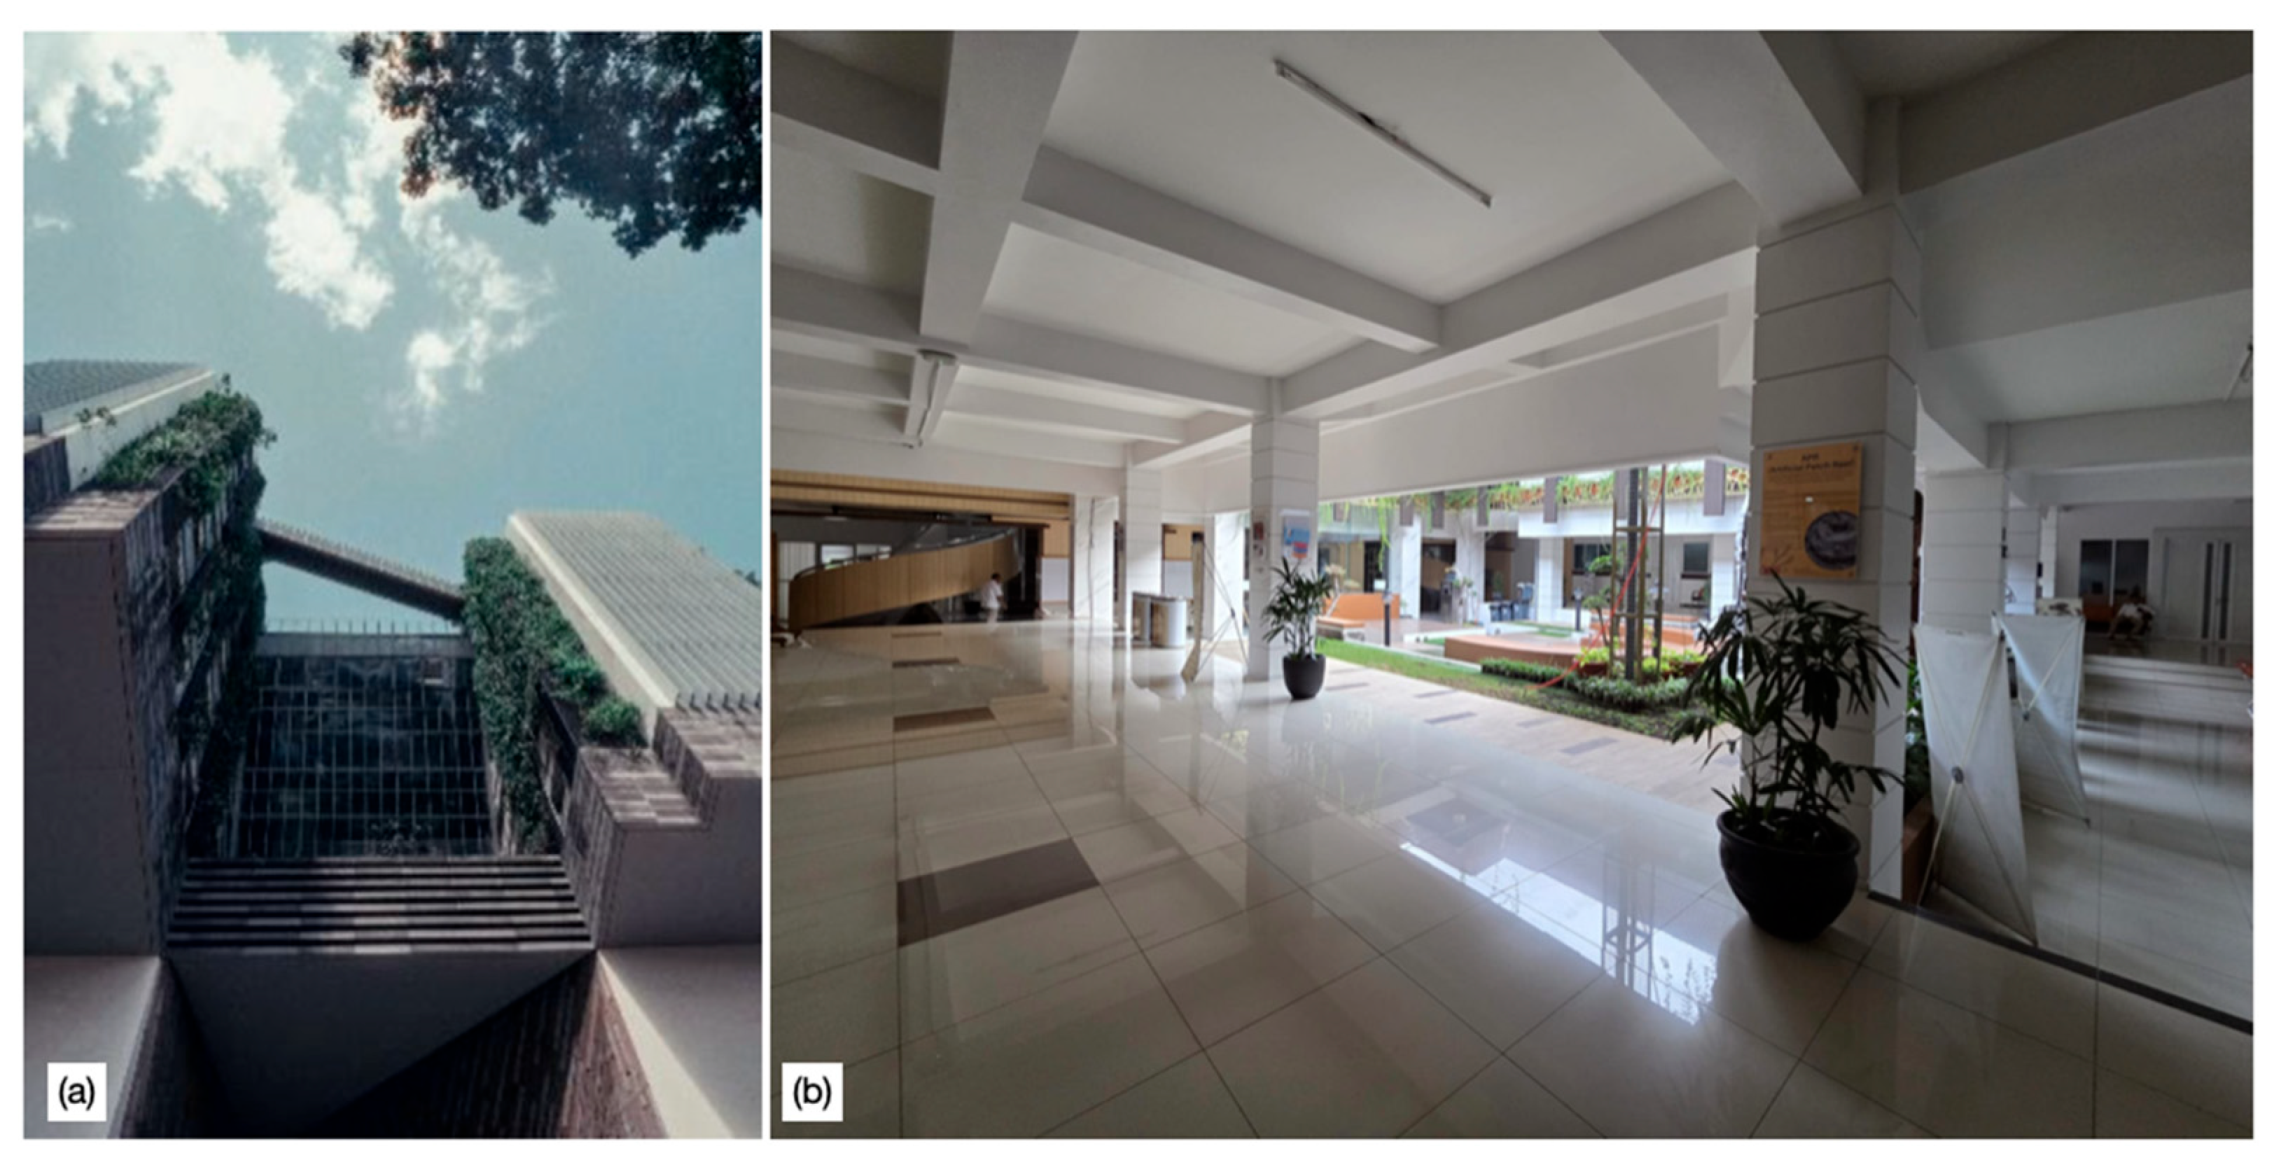
Building facades with high solar exposure can be effectively equipped with Vertical Greening Systems (VGS) for reducing heat gain and improving microclimate [60], as illustrated in Figure 5. The use of living walls, a form of VGS, has demonstrated significant benefits in terms of heat transfer. To avoid issues related to increased humidity, it is important to ensure that proper ventilation is provided behind VGS installations [5]. Urban surface evapotranspiration (ET) from soil and vegetation plays an important role in regulating environmental temperatures and alleviating UHI effects, with studies indicating that it is stronger during the warmer months [61].

3.4. Designing a Building with Optimal Morphology, Disposition, and Permeability

An urban city’s physical structure, or urban morphology, shapes wind patterns and ventilation potential, especially in tropical cities that are characterized by compact urban forms [39]. Building height, density, layout, and spacing must be carefully considered. A general decrease in height along the prevailing wind direction may optimize wind capture and penetration into the urban canopy [46]. Studies have shown that the shape of buildings can have a significant impact on both the outdoor thermal environment and pedestrian-level wind conditions at the district scale [8]. Optimizing air permeability requires adequate gaps between building blocks [46]. The use of CFD optimizes building configurations to enhance urban ventilation potential [43].
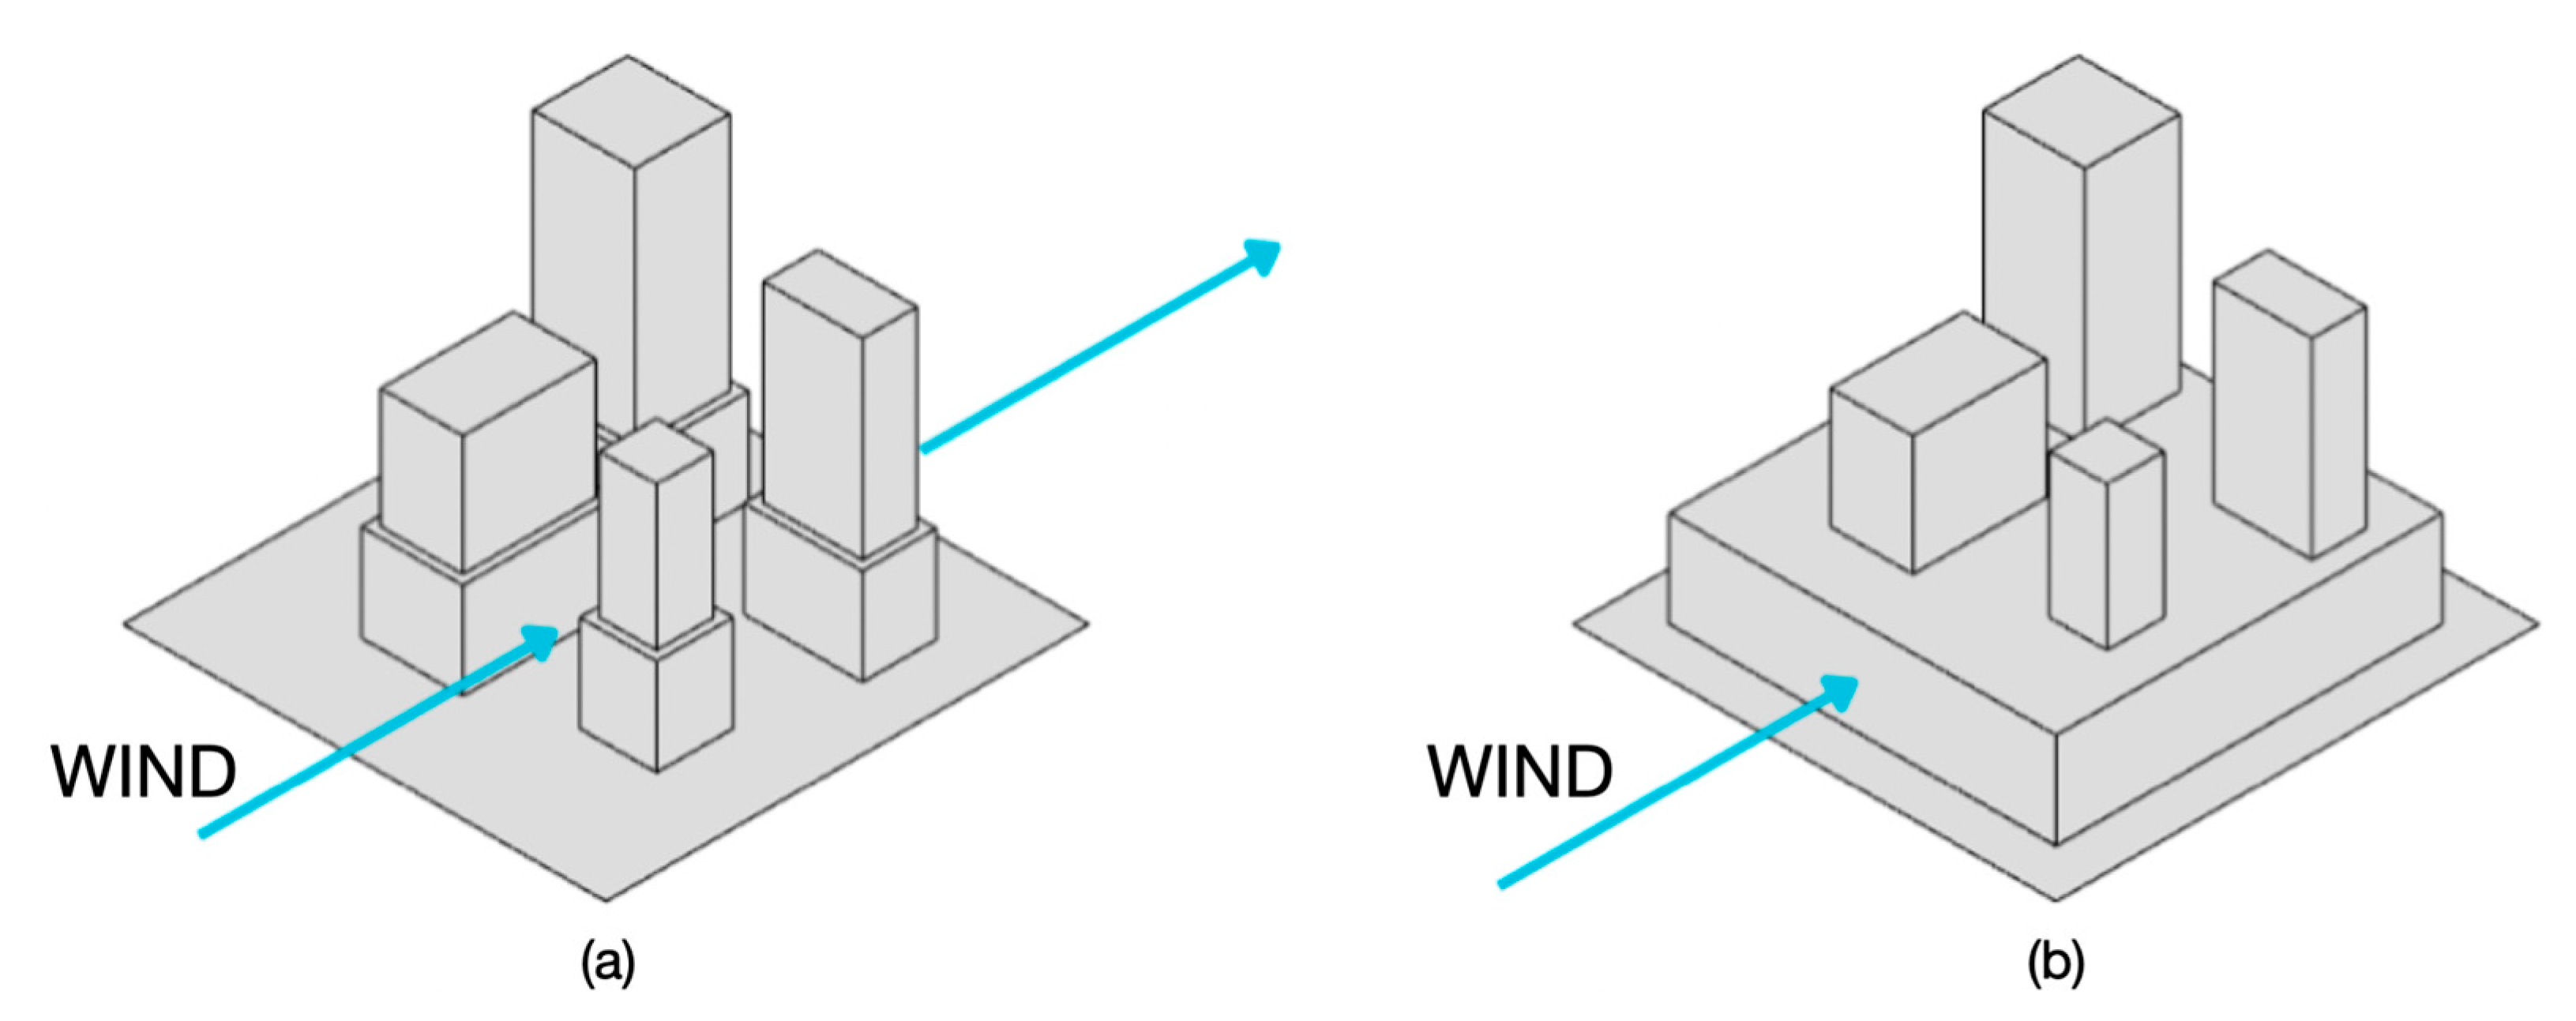
The overall urban morphology should aim to create a permeable fabric, as illustrated in Figure 6, allowing wind to flow through and around buildings, thereby preventing the formation of stagnant air pockets. This involves strategies such as reducing the building site coverage (BSC) and floor area ratio (FAR) where appropriate, and incorporating building setbacks and separations to enhance airflow [35]. Quantitative investigations into the correlation between parameters like FAR and BSC and outdoor ventilation efficiency indices have shown that while density plays a role, the specific arrangement of buildings is crucial; indeed, some high-density configurations, if well-designed, can achieve better ventilation than some low-density ones [44]. Furthermore, the impact of different urban block typologies (e.g., slab, tower, courtyard) on factors like solar potential and energy use efficiency in tropical high-density cities underscores the importance of morphological choices at the block level [62]. Both two-dimensional (e.g., impervious surface area) and three-dimensional (e.g., sky view factor, building volume) morphological parameters have been shown to control urban thermal environments, with their relative importance varying between daytime and nighttime conditions [22].
Design strategies for individual buildings should emphasize improving inherent permeability to facilitate natural ventilation [35]. Buildings with raised floors, for example, can significantly improve air flow at pedestrian level and provide pollution and heat removal at the ground level [7,12], a factor which is key to improving conditions in dense urban areas [35]. Having large openings on opposite walls and a roof opening can provide cross ventilation in tropical climates [7,13]. The free movement of air within buildings is further enhanced by ensuring that interior layouts are open and adaptable [63]. AVA guidelines [46] advocate adding stepped podiums or setbacks to increase pedestrian-level wind flow and thermal comfort (Figure 7).

3.5. The Integration of Smart Ventilation Approaches

Integrated smart technologies and intelligent control systems show significant potential to dynamically manage and optimize ventilation in buildings as well as urban public spaces. In this method, sensors are used to monitor real-time environmental conditions (such as temperature, humidity, wind speed, air quality) and automate ventilation parameters accordingly [64]. By dynamically opening and closing vents, adjusting shading devices, or enabling localized fans, intelligent systems can optimize airflow in public spaces [65]. The case study of an industrial park in China suggests innovative solutions to improve comfort through smart ventilation, including “urban ventilation furniture” and geothermal heat pumps [65].
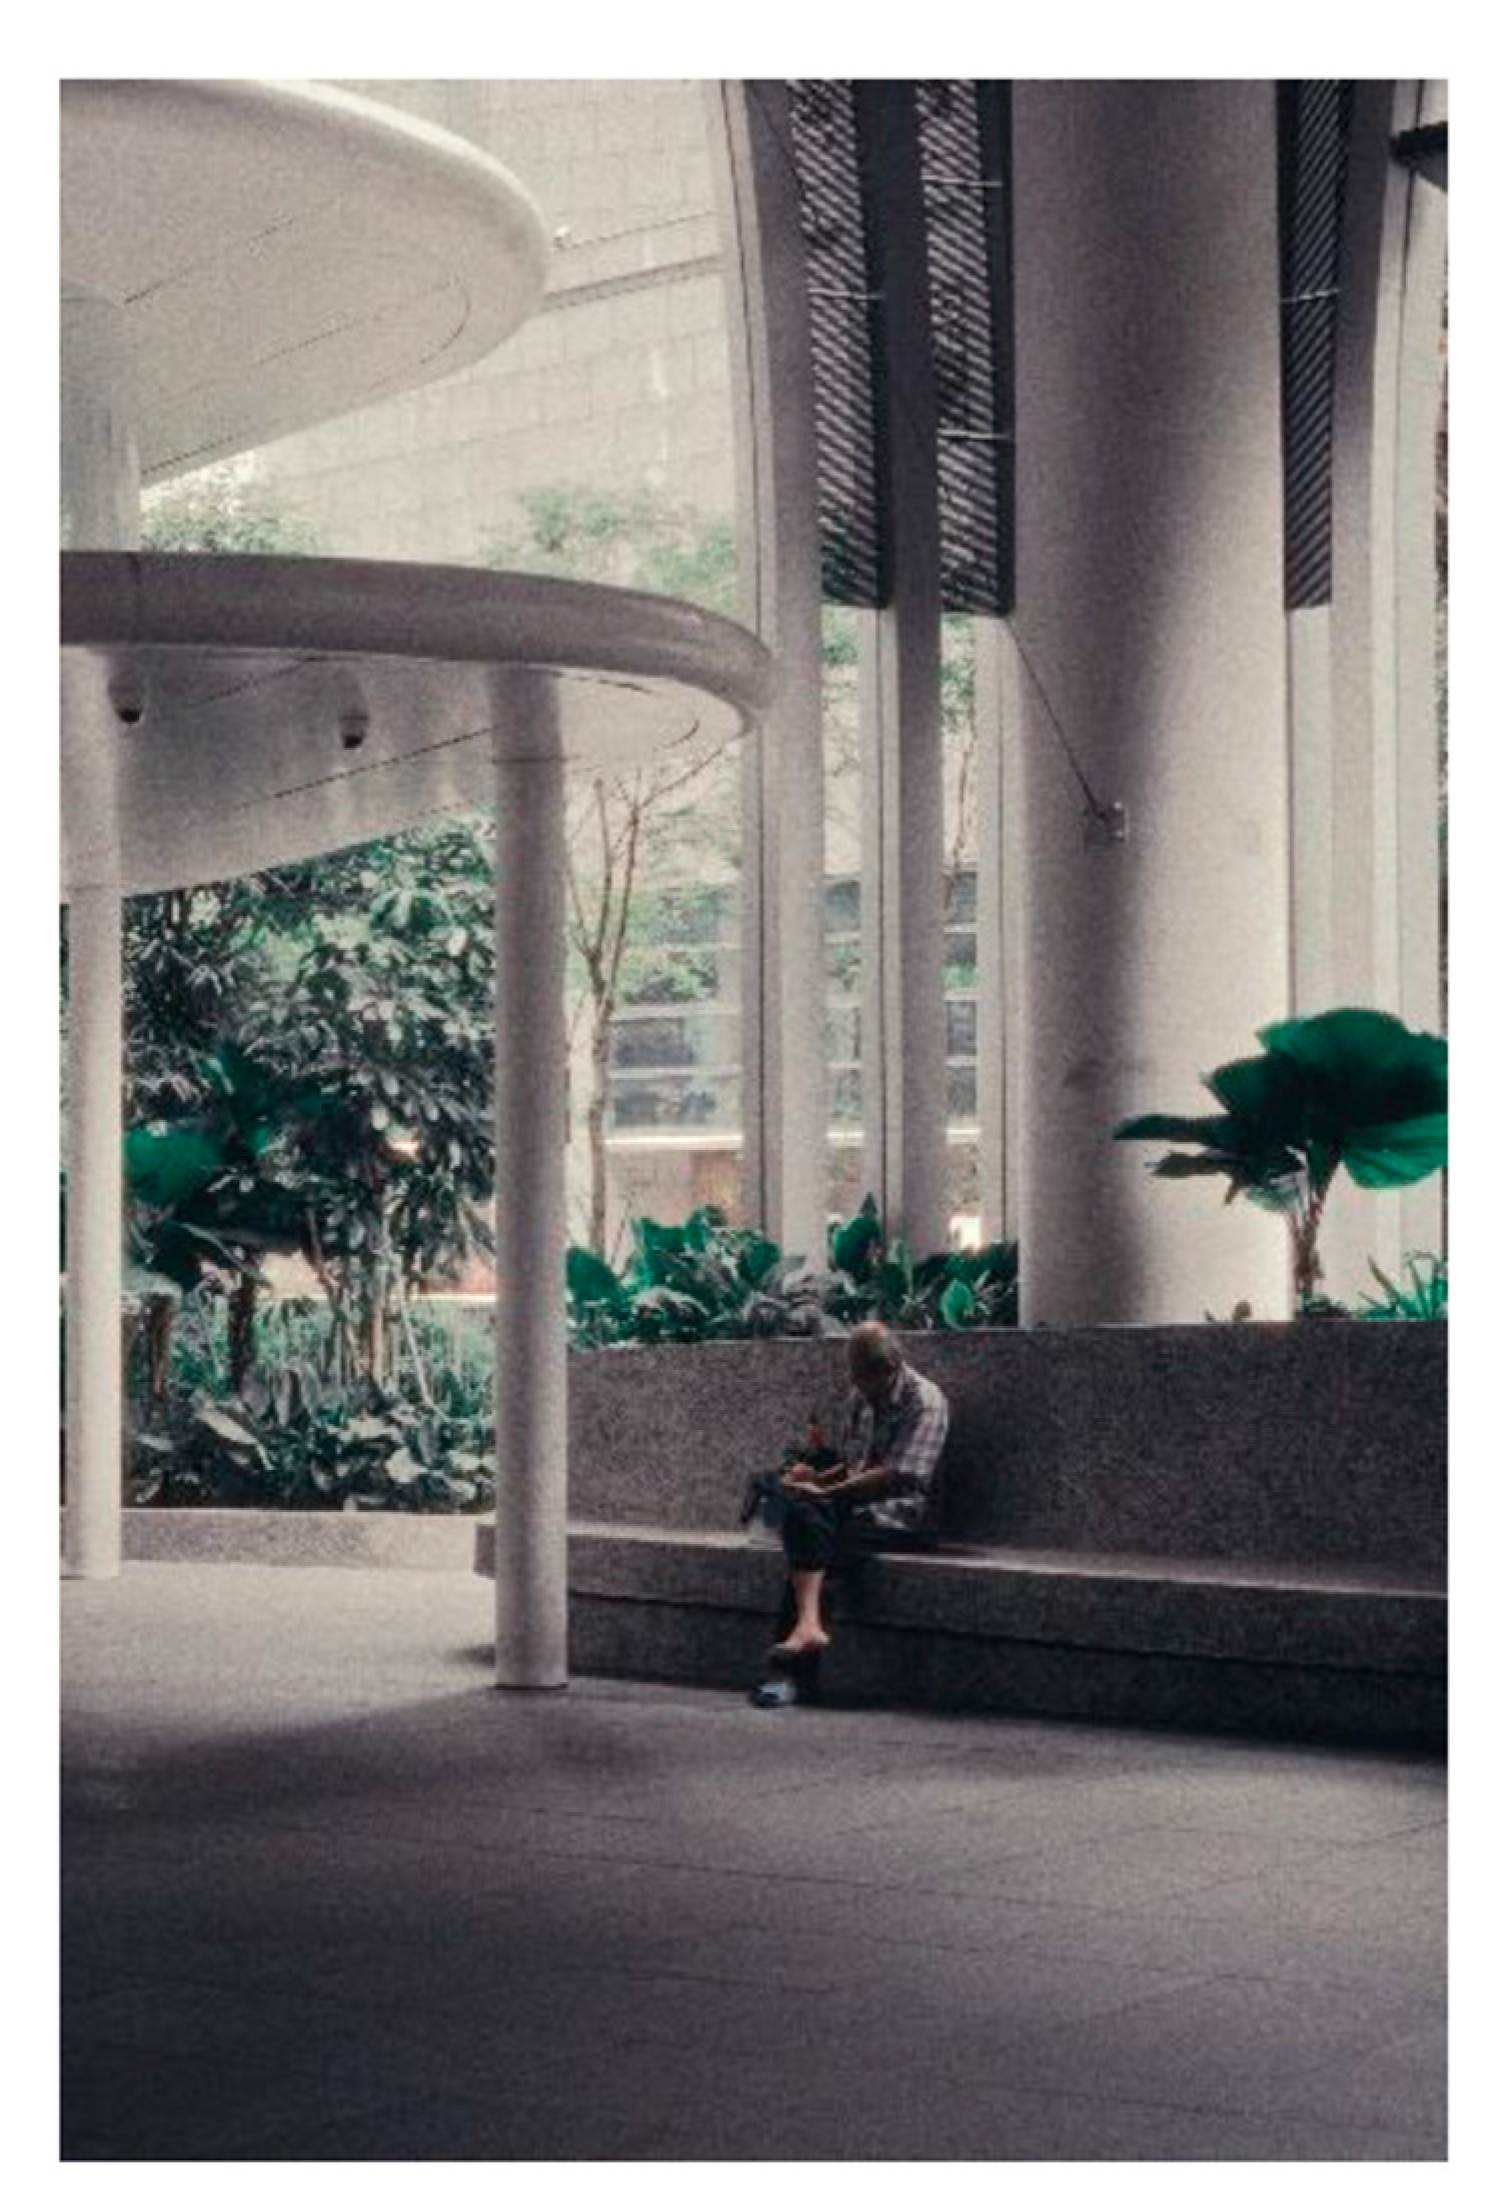
Natural ventilation offers substantial energy savings potential, but its effectiveness can be greatly enhanced through well-designed and integrated controls. The use of advanced control systems, such as fuzzy logic, neural networks, and genetic algorithms, can help ensure optimal indoor environmental quality without compromising the comfort of occupants [64]. By combining passive design principles with these smart technologies, more energy-efficient, responsive, and resilient ventilation strategies can be achieved. As illustrated in Figure 8, one example of a solar-powered “breeze shelter” near Marina Bay Sands in Singapore, in which ceiling fans are powered by solar power, is an example of how technology can be integrated into outdoor public spaces to enhance localized comfort, and offers an example of how this can be achieved.
The review on intelligent control systems for natural ventilation underscores that while natural ventilation offers substantial energy-saving potential, its effectiveness is greatly enhanced when implemented with well-designed and integrated controls [64]. Advanced control systems, potentially utilizing fuzzy logic, neural networks, or genetic algorithms, can help overcome the challenges of fluctuating external conditions and ensure optimal indoor environmental quality without compromising occupant comfort. Combining robust passive design principles with these smart technologies can lead to more energy-efficient, responsive, and resilient ventilation strategies, particularly crucial in the face of variable tropical weather conditions. The “breeze shelters” near Marina Bay Sands in Singapore, as depicted in Figure 8—which use solar power to operate ceiling fans—offer a tangible example of how technology can be integrated to enhance localized comfort in outdoor public spaces.

4. CFD Simulation Analysis

After conducting a literature review in Section 3, CFD was applied to two different Indonesian cities, Jakarta and Semarang, which represent tropical climates, respectively. In this study, two popular simulation software programs were used for analysis, DesignBuilder Engineering Pro 2024 and Autodesk Forma student version. The DesignBuilder program simplifies modeling processes, allowing efficient evaluation of building aspects, such as energy consumption, comfort, CFD, daylighting, and energy optimization. The software has been validated and has been used in several analyses [7,13,63]. Meanwhile, Autodesk Forma is an AI-driven cloud tool for planners and designers [66]. By using these new software programs, designers can analyze the performance of a building with several possible outcomes for a wide range of scenarios. In contrast with DesignBuilder with manual input data, Autodesk Forma can generate hundreds of possible scenarios and predict the effectiveness of each. To analyze these two pieces of software and test the effectiveness of urban ventilation corridor strategy in Section 3, this study used DesignBuilder simulation to simulate low-rise residential areas in Jakarta and Autodesk Forma to simulate high-rise office buildings.

4.1. CFD Simulation Using DesignBuilder

Jakarta’s rapid urbanization has resulted in a continuous increase in residential building construction. Originally, Greater Jakarta (Jakarta, Bogor, Tangerang, Bekasi) had a population of 11.4 million in 1980, but by 2018, it topped 34 million people, with 10 million living in Jakarta [67]. As a consequence, land was continuously converted into urban uses and for large-scale housing developments. A combination of green area conversion and urbanization can result in Jakarta’s urban temperature being higher [3]. There is an increase in the intensity of heat in Jakarta due to the UHI (Urban Heat Island) phenomenon. As a result of UHI in 2013, Jakarta’s temperature ranged between 30.1 and 34.0 °C [68].
The previous research reviews [3,68,69] found that early planning and building based on local weather data can reduce energy consumption and minimize the UHI effect. A solution to this problem is to design urban ventilation corridors to increase wind velocity. For investigating the wind flow field in order to create city ventilation, Computational Fluid Dynamics (CFD) analysis allows compiling data from different house arrangements to perform comparative analyses of urban heat island effects [42,70,71]. Specifically, the residential area design (buildings and roads) can be analyzed for creating urban ventilation corridors, which should reduce temperature and increase wind velocity. A few studies have focused on creating city ventilation, but a limited number have concentrated on tropical climates. CFD simulations are used in the present study to evaluate the design of a residential area. The goal of this research is to increase knowledge of residential area design in tropical climates, provide strategic recommendations for planners, designers, and urban decision-makers on how to mitigate and create natural city ventilation and reduce urban heat islands.
Wind velocity was calculated from the Jakarta meteorological station [72]. Calculations of wind distribution in the region were conducted using DesignBuilder software v7.2.0.032. Additionally, the weather data was input into the software using power law calculations (2), where Vz is the wind velocity at a certain height (z), and V1 is the wind velocity at the reference height. Because the K-ε epsilon RNG model is more stable, the calculation type of viscosity is applied, with the positioning and type of inlet as the inflow, and that of the outlet as the outflow, inputting a value for variable speed. Calculations must be repeated in order to obtain convergent results.
V z = V 1 Z Z 1

4.1.1. Study Area and Case Study Model in Jakarta

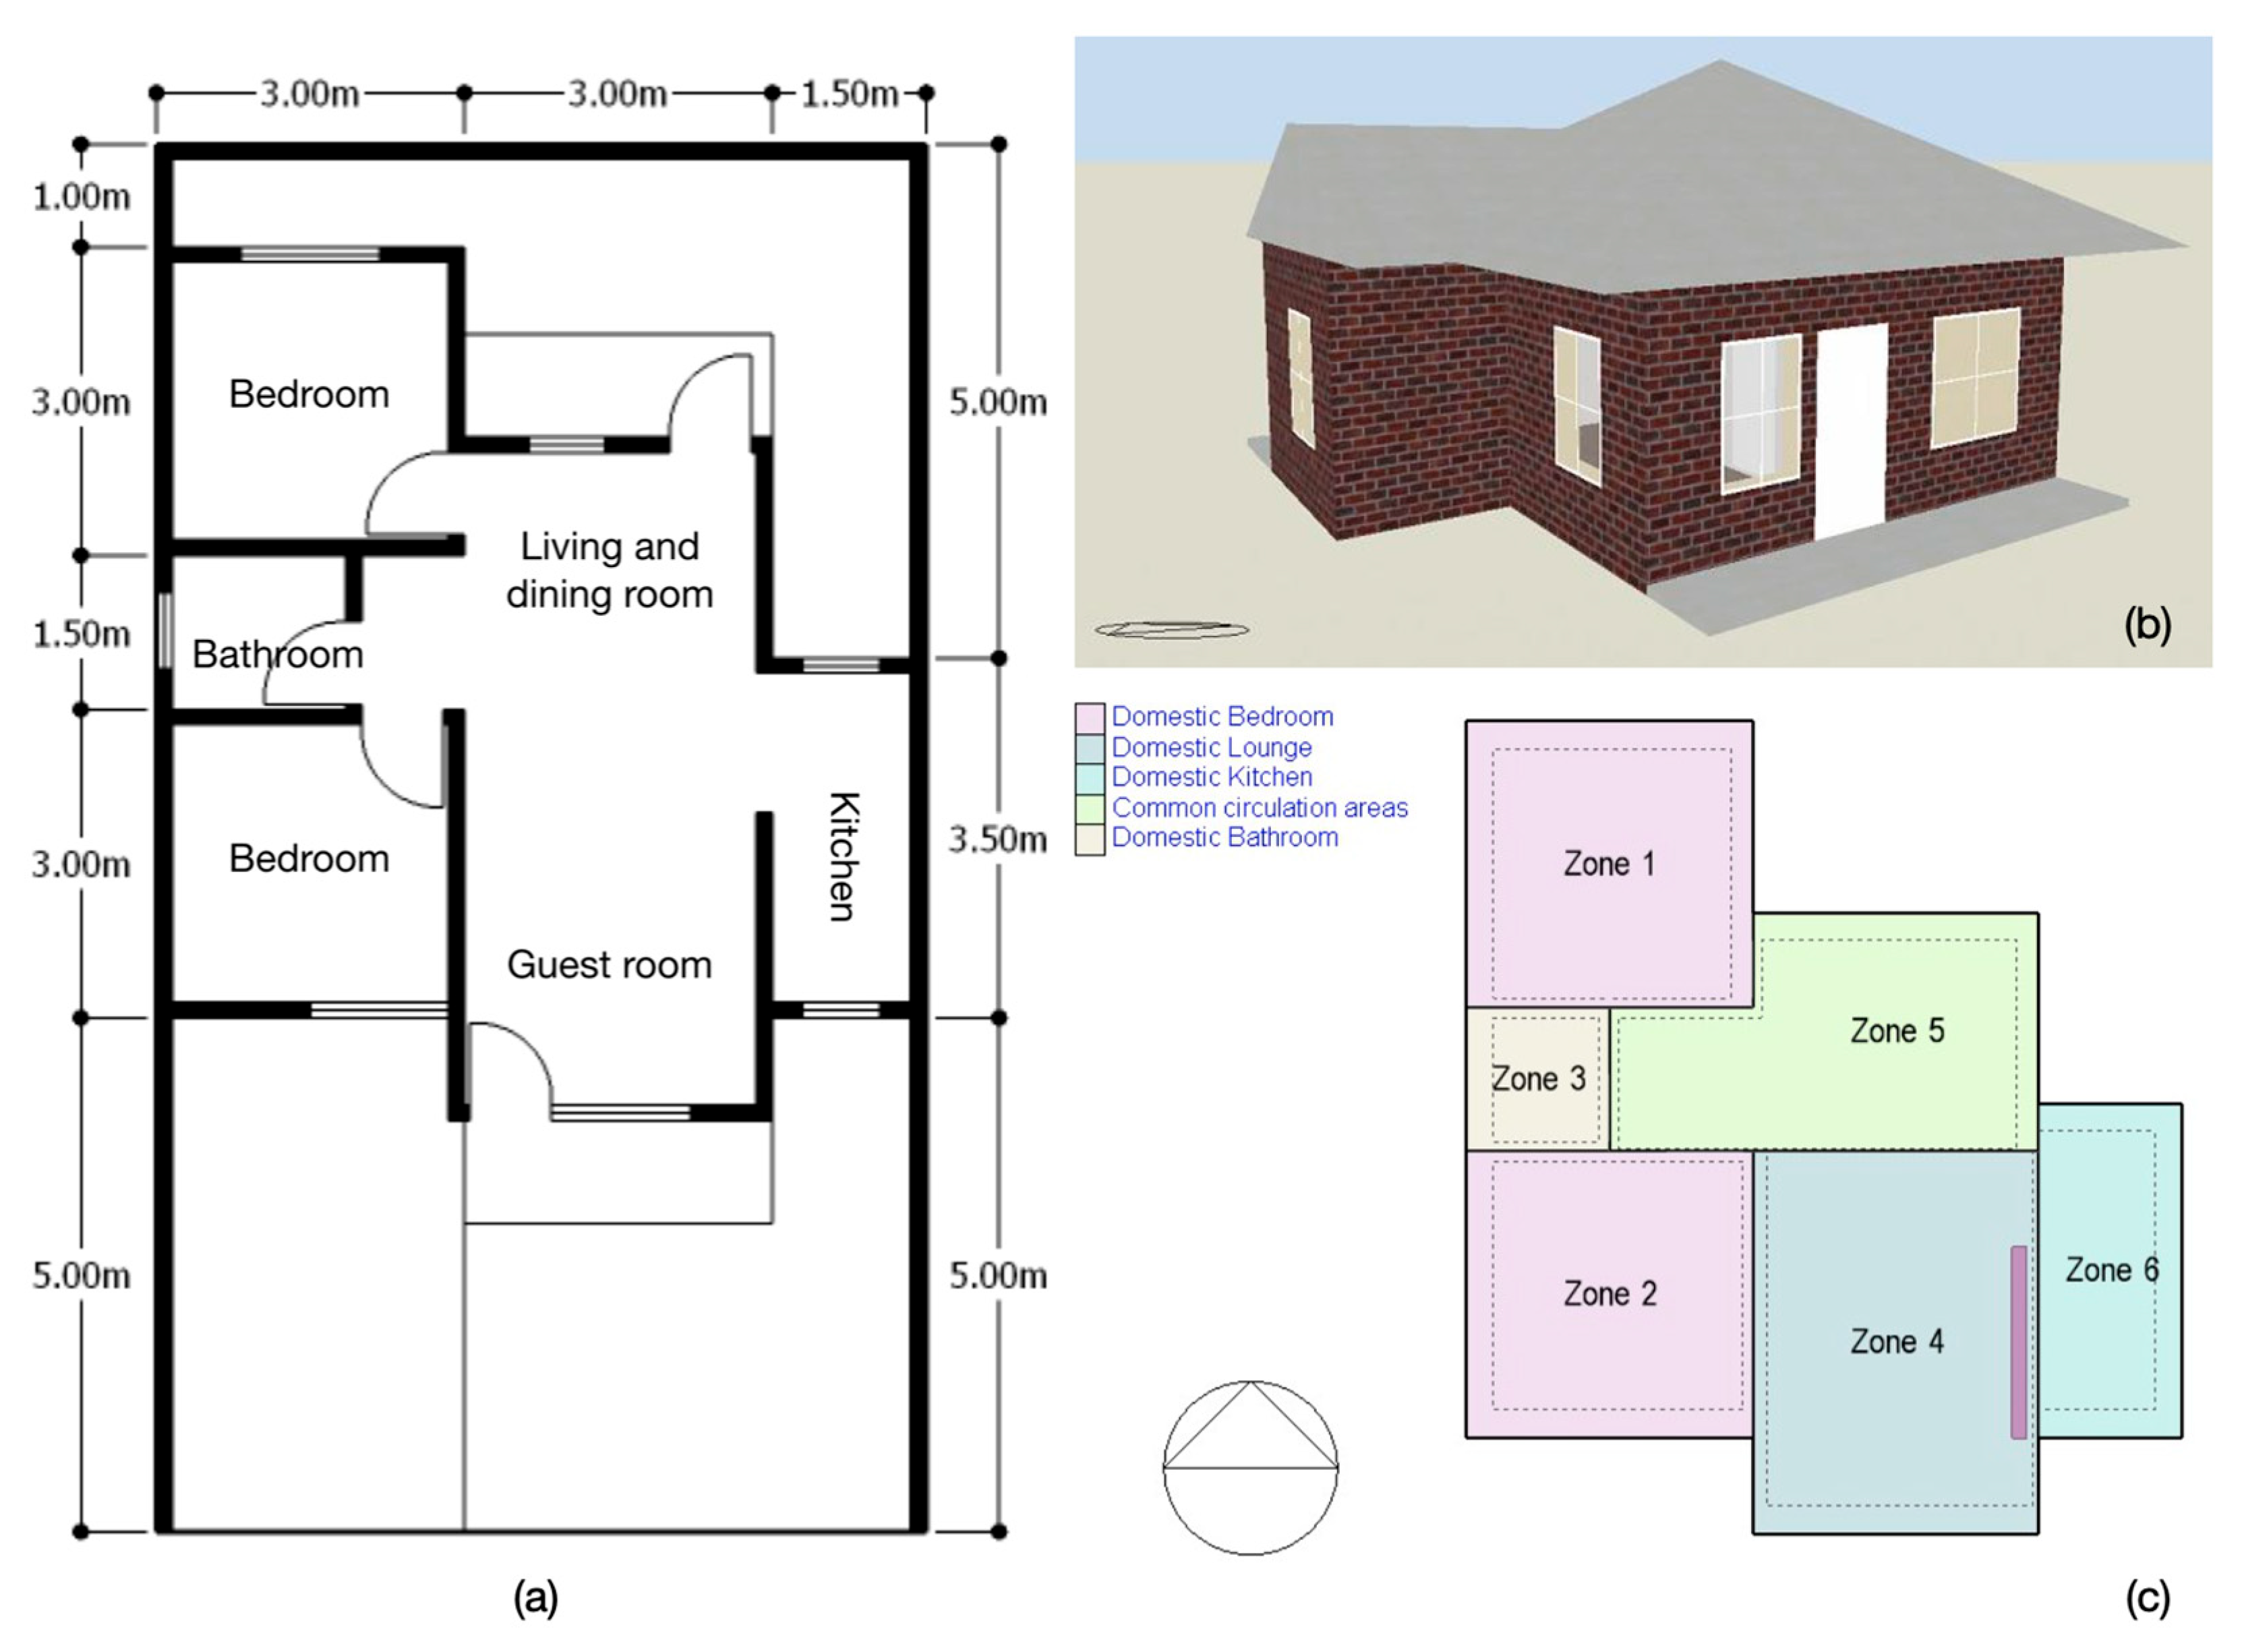
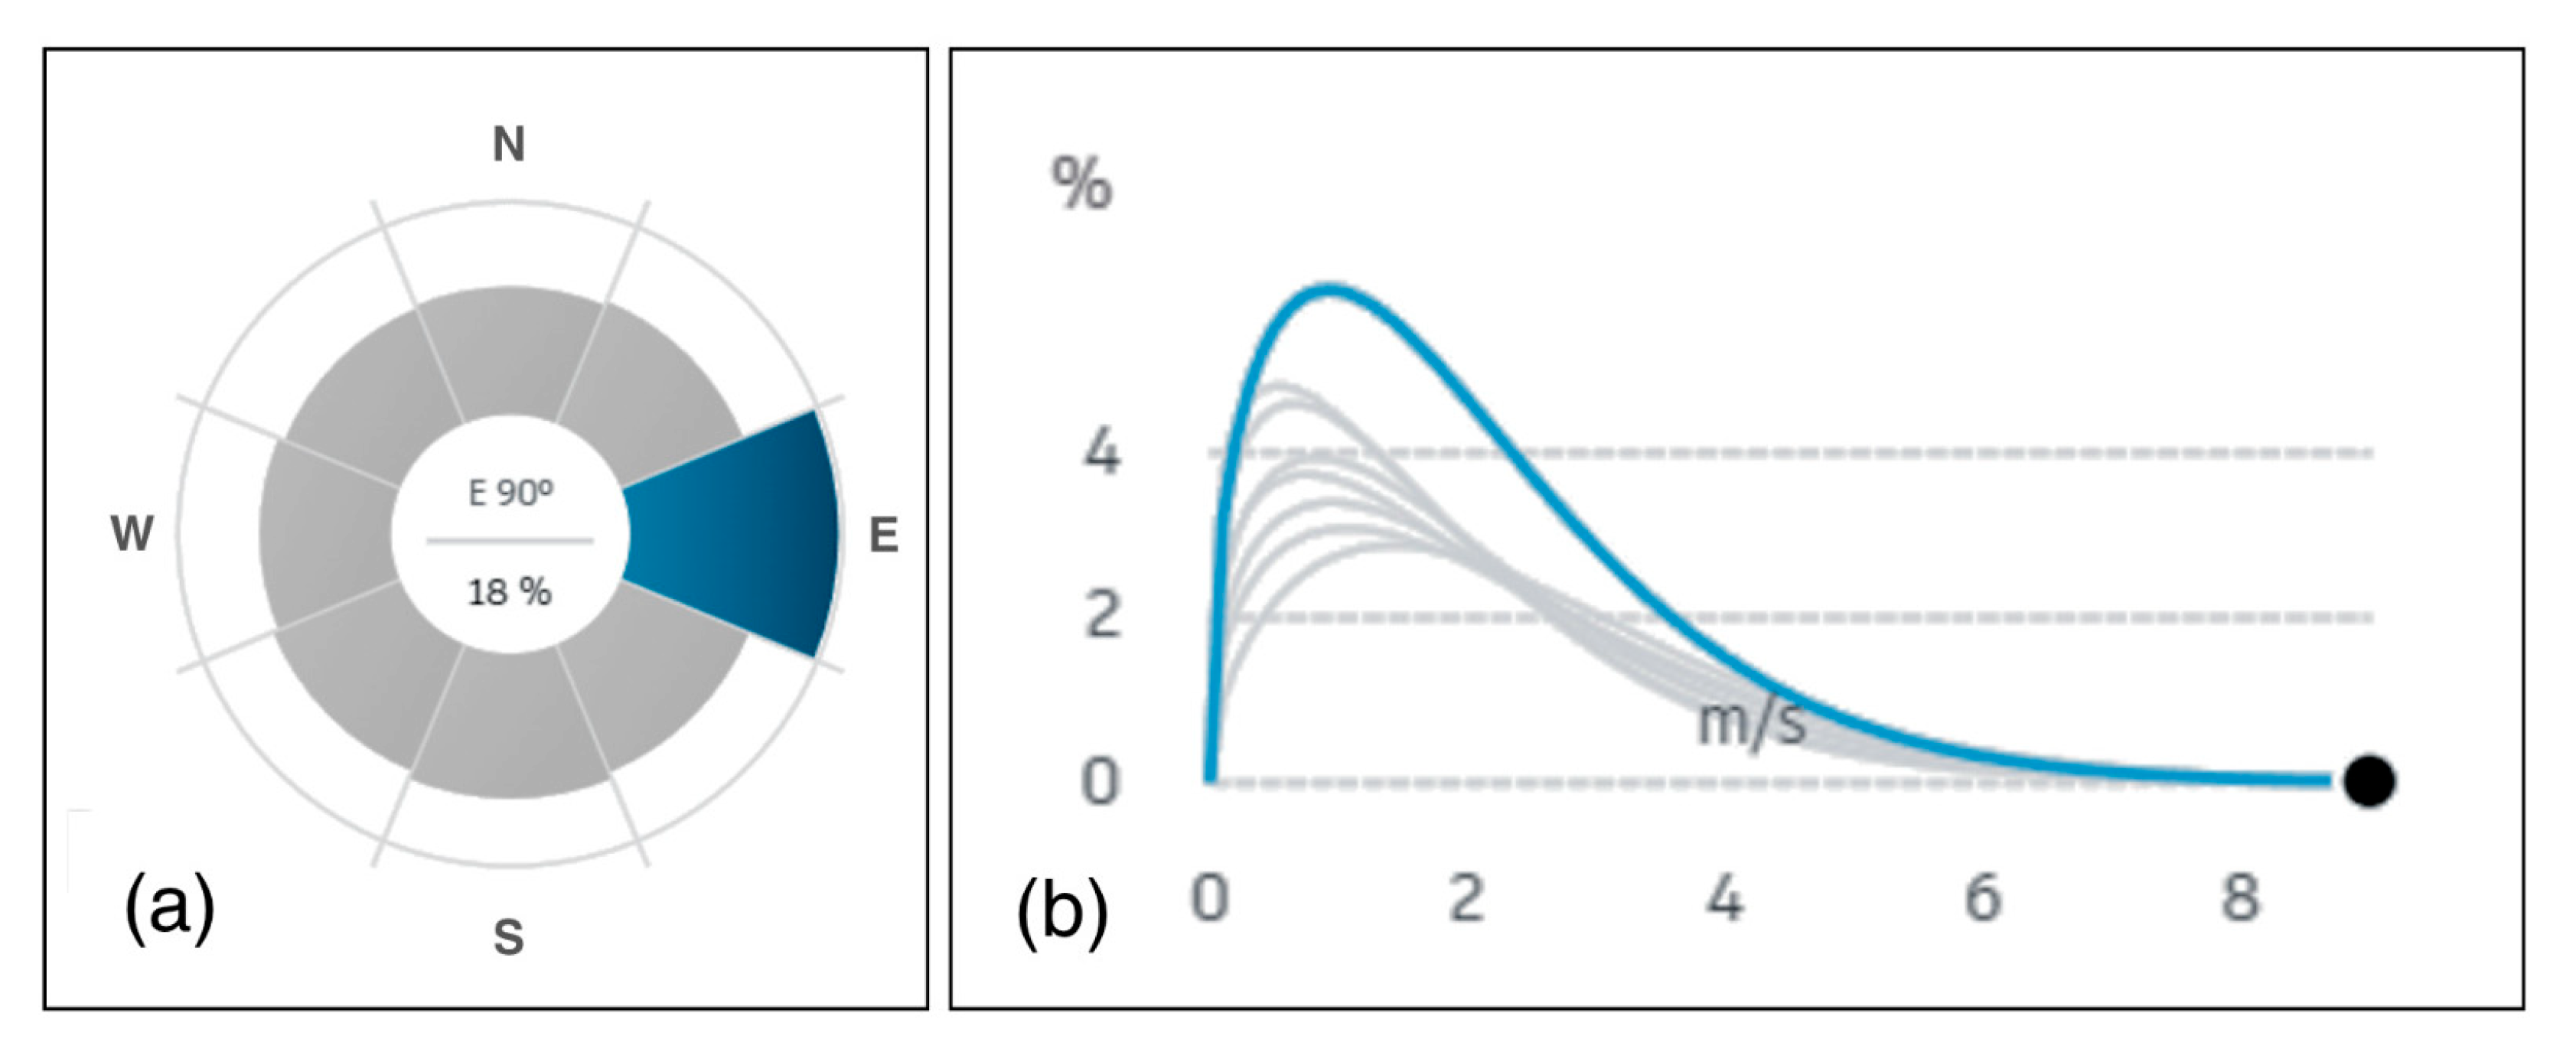
An analysis of Jakarta City, Indonesia has been conducted via CFD simulations and evaluations. The wind direction in Jakarta is 175 degrees. There are two months of the year with the highest temperatures: May and October. The results of the analysis of the weather data are shown in Figure 9. Simulations are conducted using an average wind speed of 5 m/s. The house model used for this analysis was house type 36 [73]. This type of house is the most popular residential house type in Jakarta, and it is usually chosen by newlyweds and young families. The popularity of this house has led future house developers to build this type of house in Jakarta. The detailed house model is shown in Figure 10. It consists of 1 guest room, 1 bedroom, 1 kitchen, 2 bedrooms, 1 living room, 1 dining room, and 1 bathroom (Figure 10). Furthermore, the following houses are separated according to their zone (Figure 10c). The zoning was designed to differentiate activities between spaces.
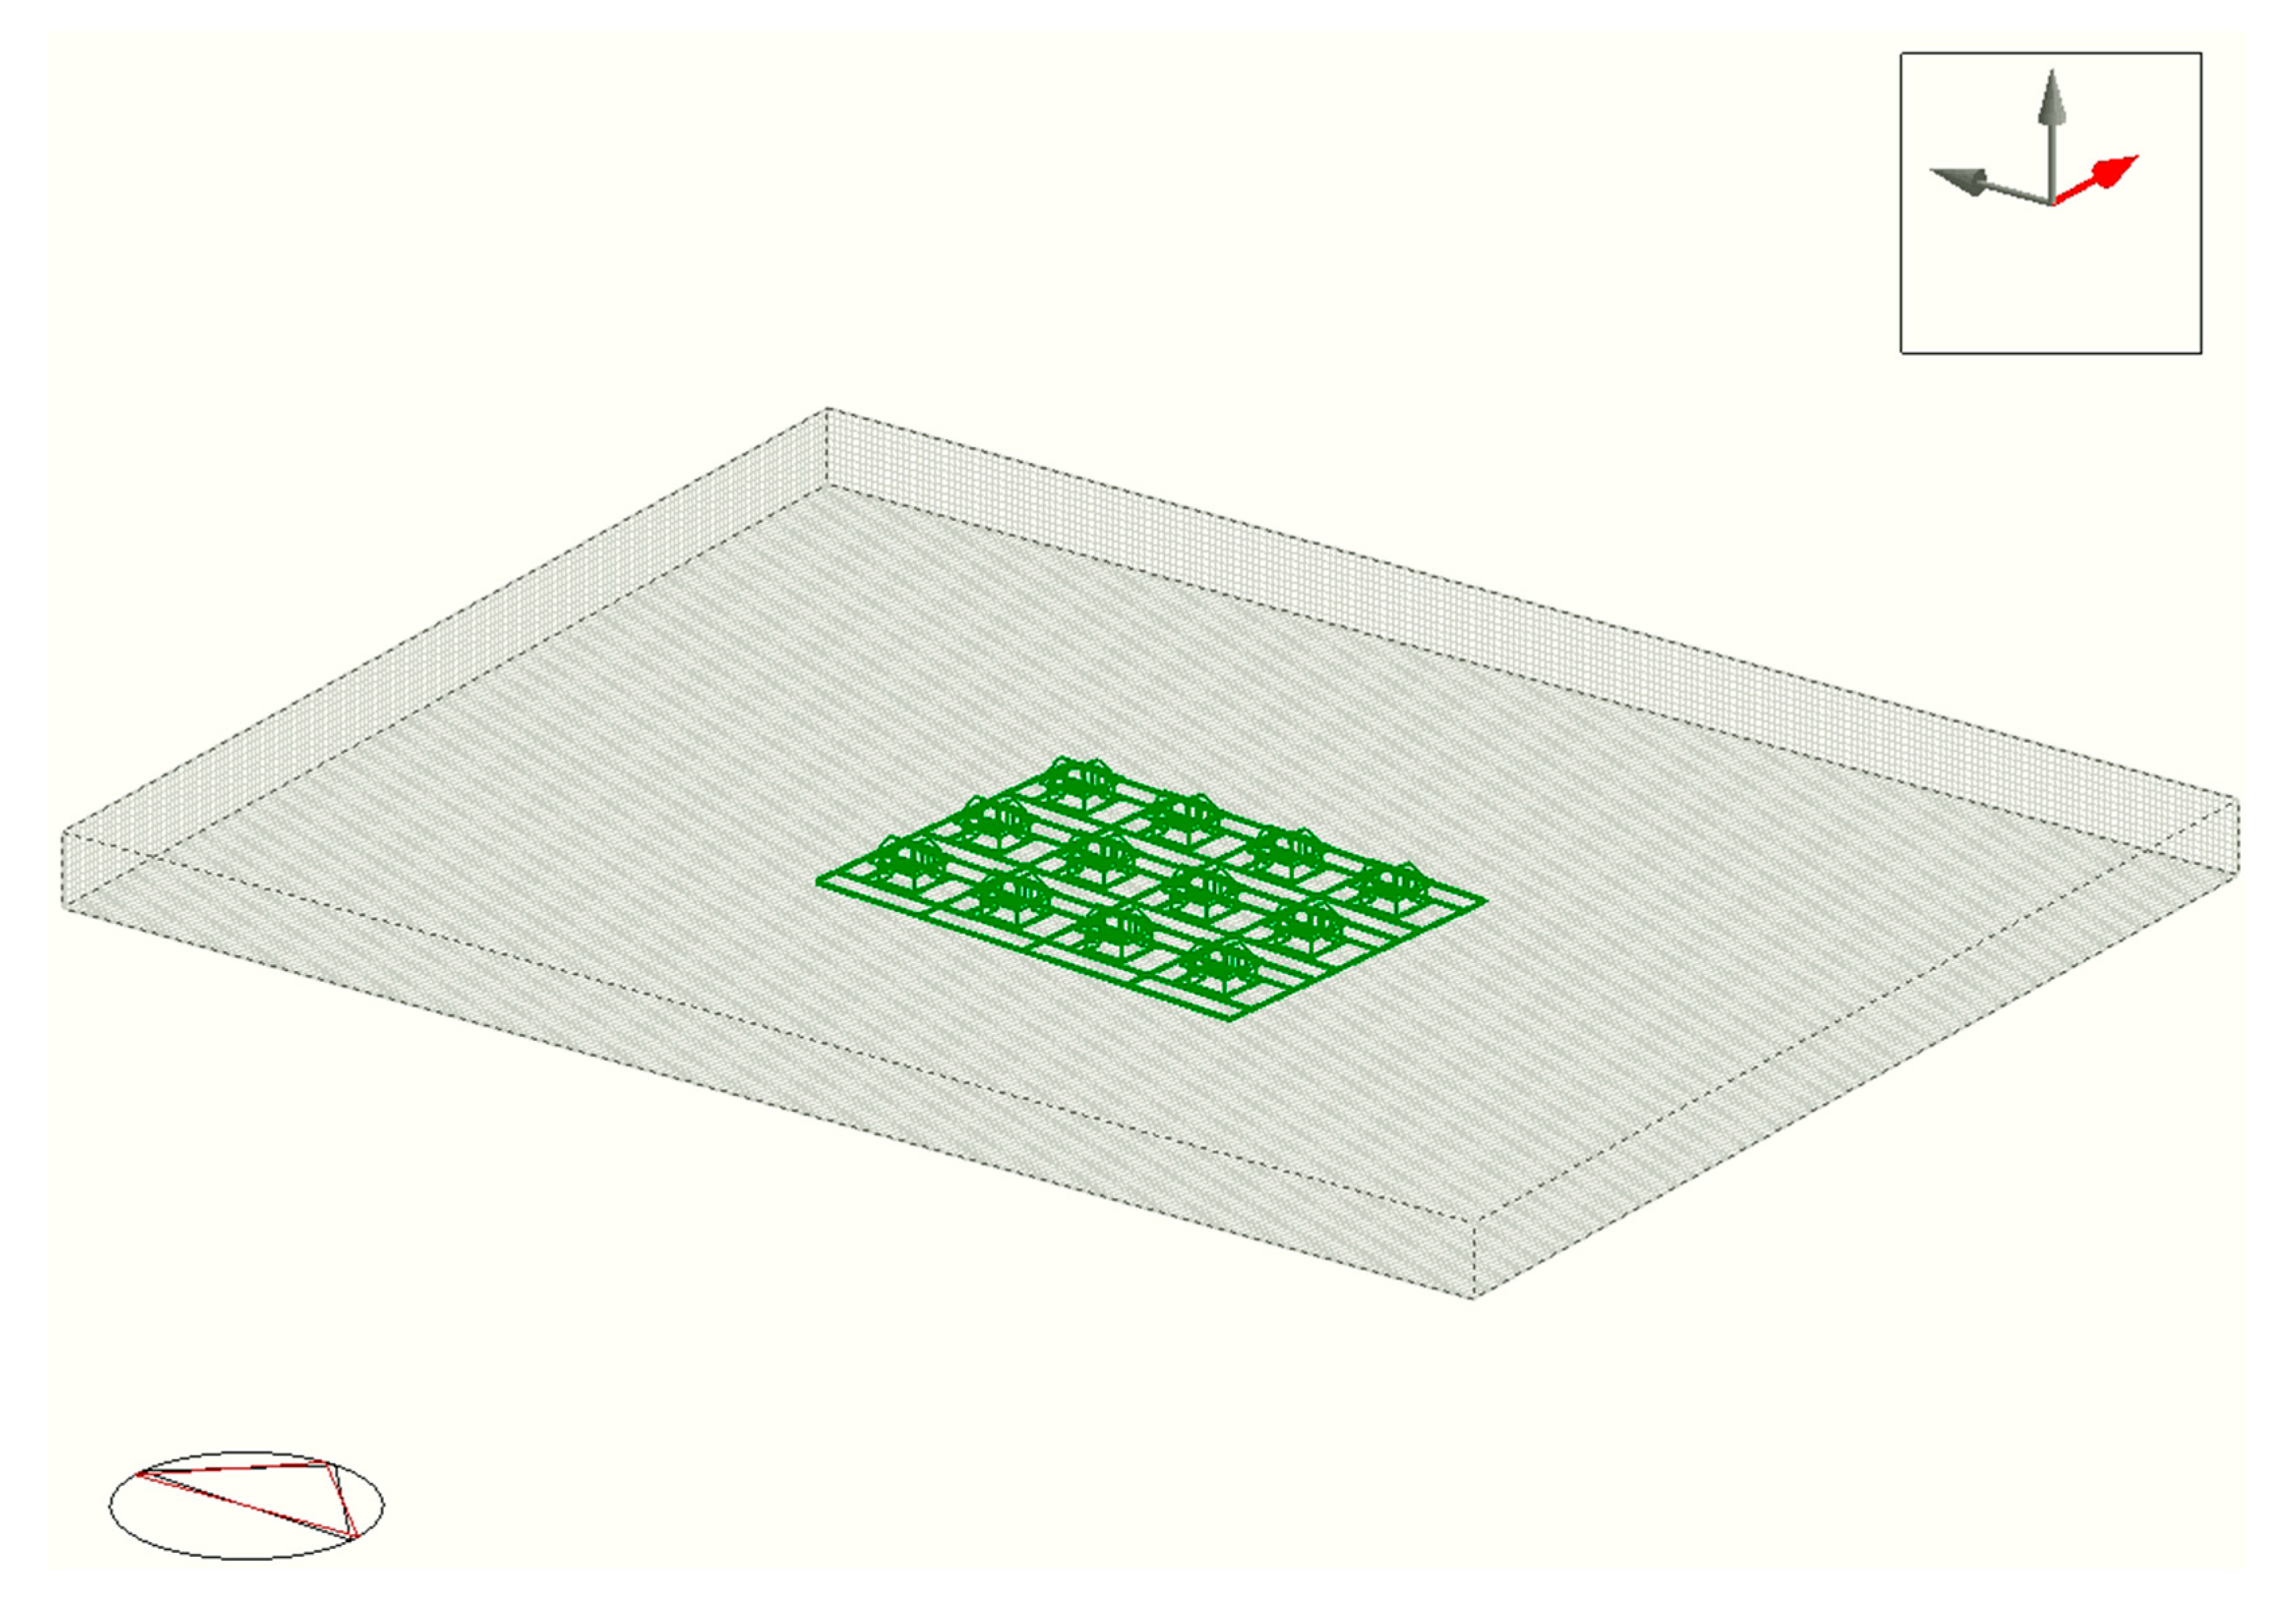
Figure 11 shows that there are 12 houses in the residential area (house type 36). Every house is separated by 8.50 m. There is a total of 8.50 m including 7.50 m for the street and 1 m for pedestrians. The following street length was determined based on the regulations of the Ministry of Public Works and Public Housing (Kemen PUPR) No. 32/PERMEN/M/2006 [74]. The grid configuration was intended to create a ventilation tunnel for the wind flow. Arrangements of houses and streets were oriented towards the direction of the wind in Jakarta, ensuring that airflow was not constrained by obstructions.

4.1.2. Grid Arrangement and Meshing

This study used computational fluid dynamics (CFD) simulation for wind flow and velocity prediction. The use of CFD can be used for analyzing flow movement in a built environment, such as wind. The software used was DesignBuilder. The software analyzes and calculates wind flow on a building’s interior as well as the area around the building’s exterior. A CFD simulation and evaluation were conducted in the city of Jakarta, Indonesia. A grid was generated using DesignBuilder to discretize the governing transport equations. Simulated data was generated on a uniform grid with a 1 m grid spacing. The speed was set at 5 m/s with an exposure of 175 degrees Celsius in an urban setting. As shown in Figure 12, the house area is divided into grid cells. A total of 170 cells are in X, 222 cells are in Y, and 10 cells are in Z. The aspect ratio maximum is 1058. Convergence was achieved for all mesh calculations.

4.1.3. Simulation Results

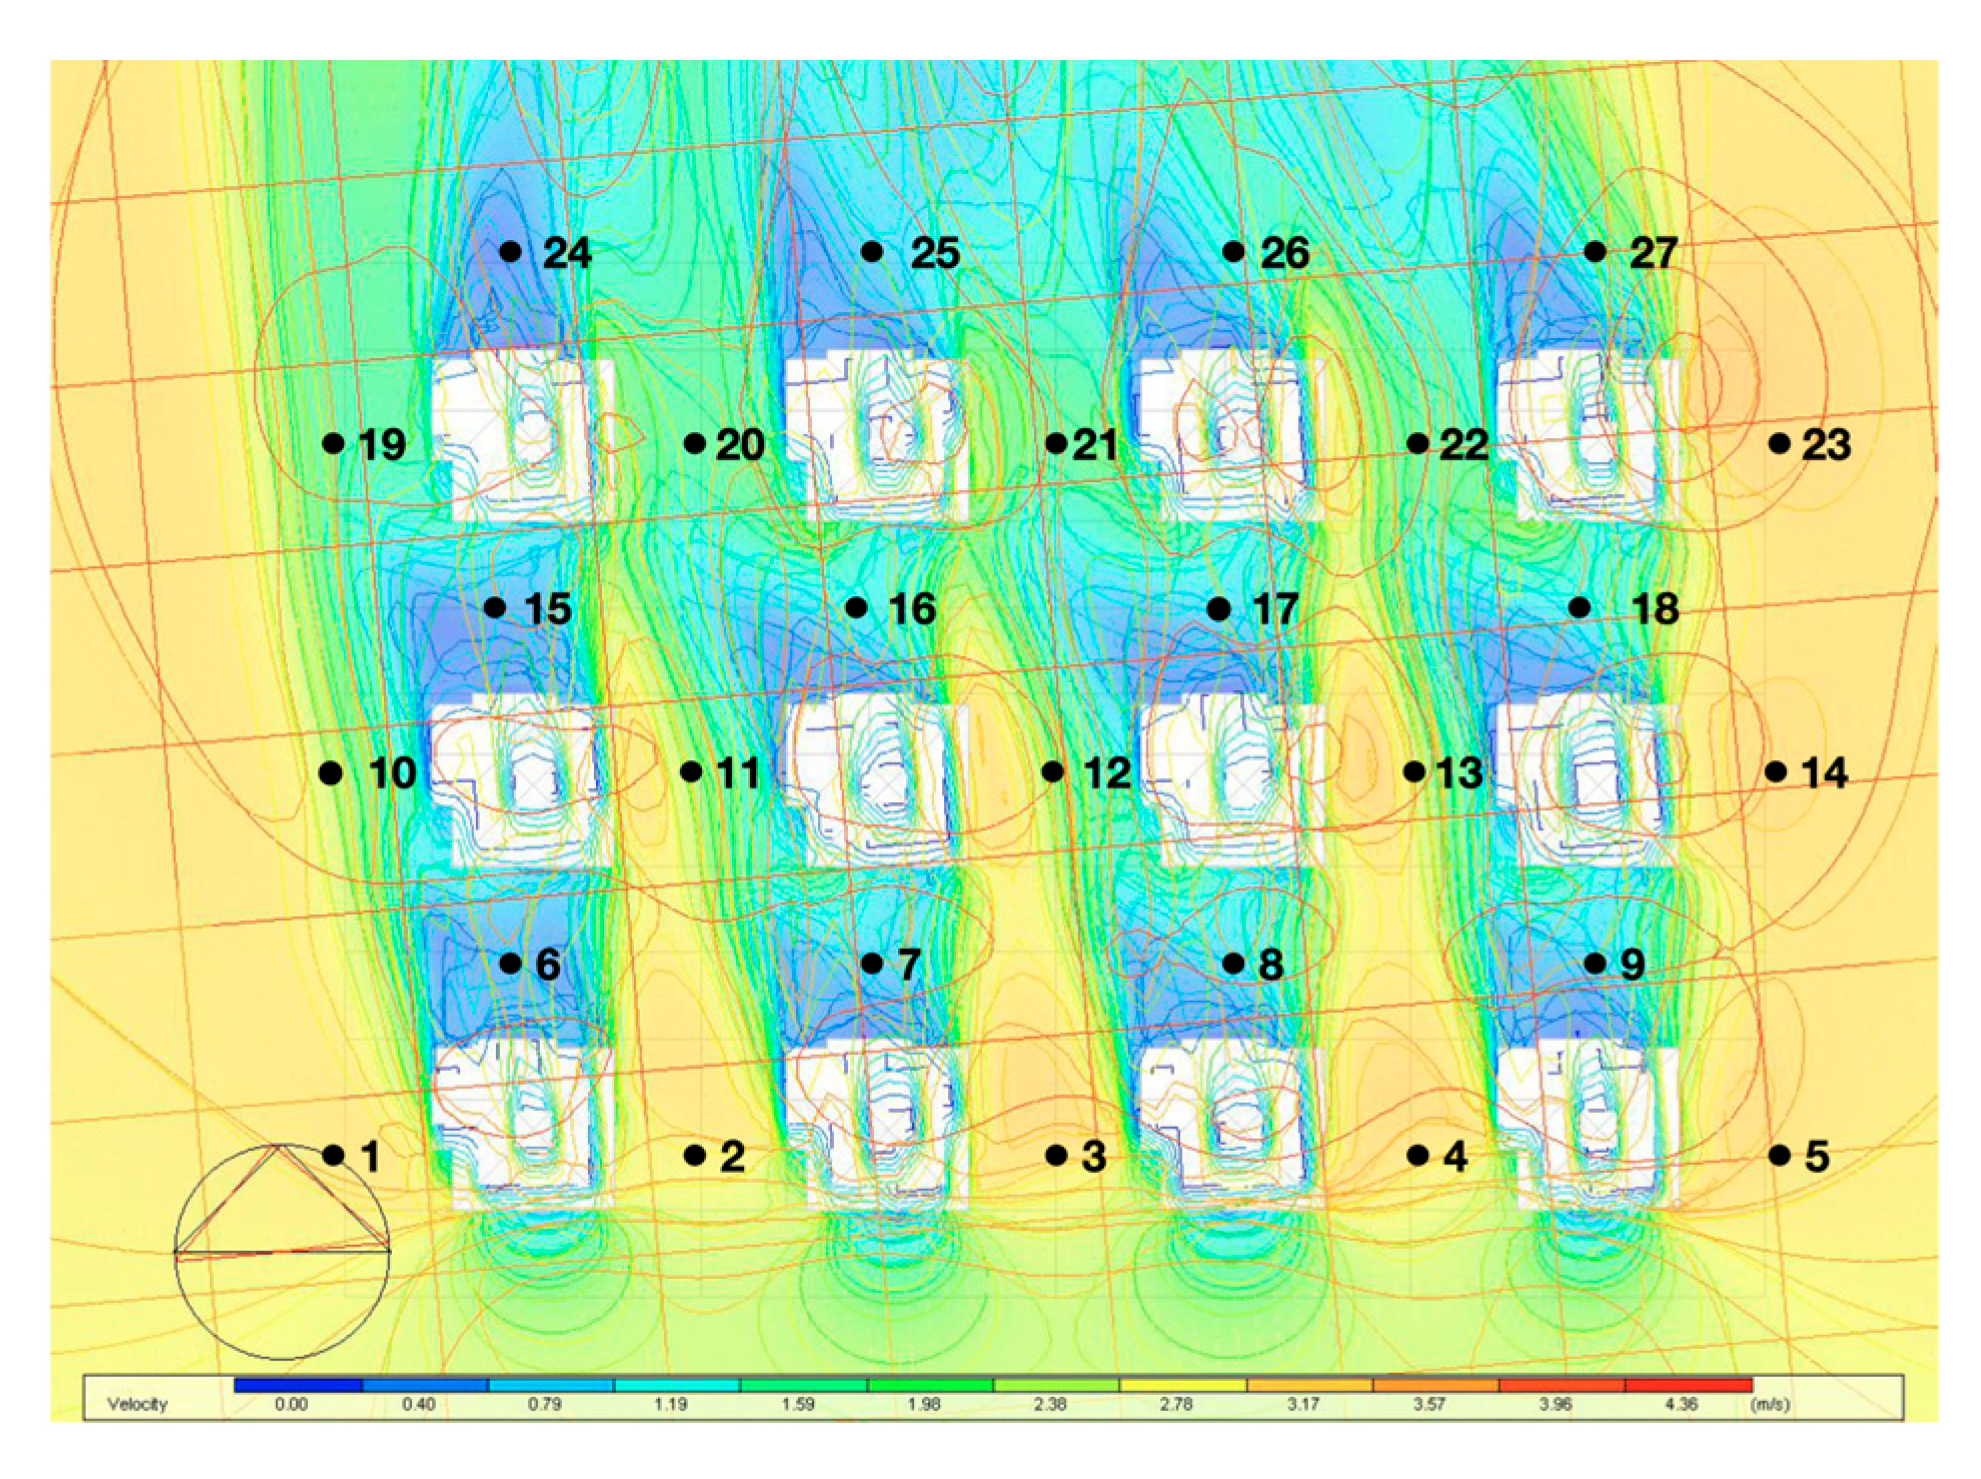
Figure 13 shows a wind contour on an urban residential building in Jakarta (z = 2 m). A high wind velocity was found at points 1, 2, 3, 4, 5, 14, and 23 on the road toward the southeast (3.17 m/s) before decreasing toward the northeast (2.38 m/s). A ventilation corridor was created by the road going southeast. At points 6, 7, 8, 9, 15, 16, 17, 18, 24, 25, 26, and 27, the wind speed was all less than 0.50 m/s, indicating weak airflow behind the houses. There was almost no wind at observation points 6, 15, and 24, and the wind speed was less than 0.40 m/s at these points. There was a similarity between the wind speeds of points 7, 8, 9, 16, 17, 18, 25, 26 and 78, which were only 0.79 m/s. The points were located behind the houses.
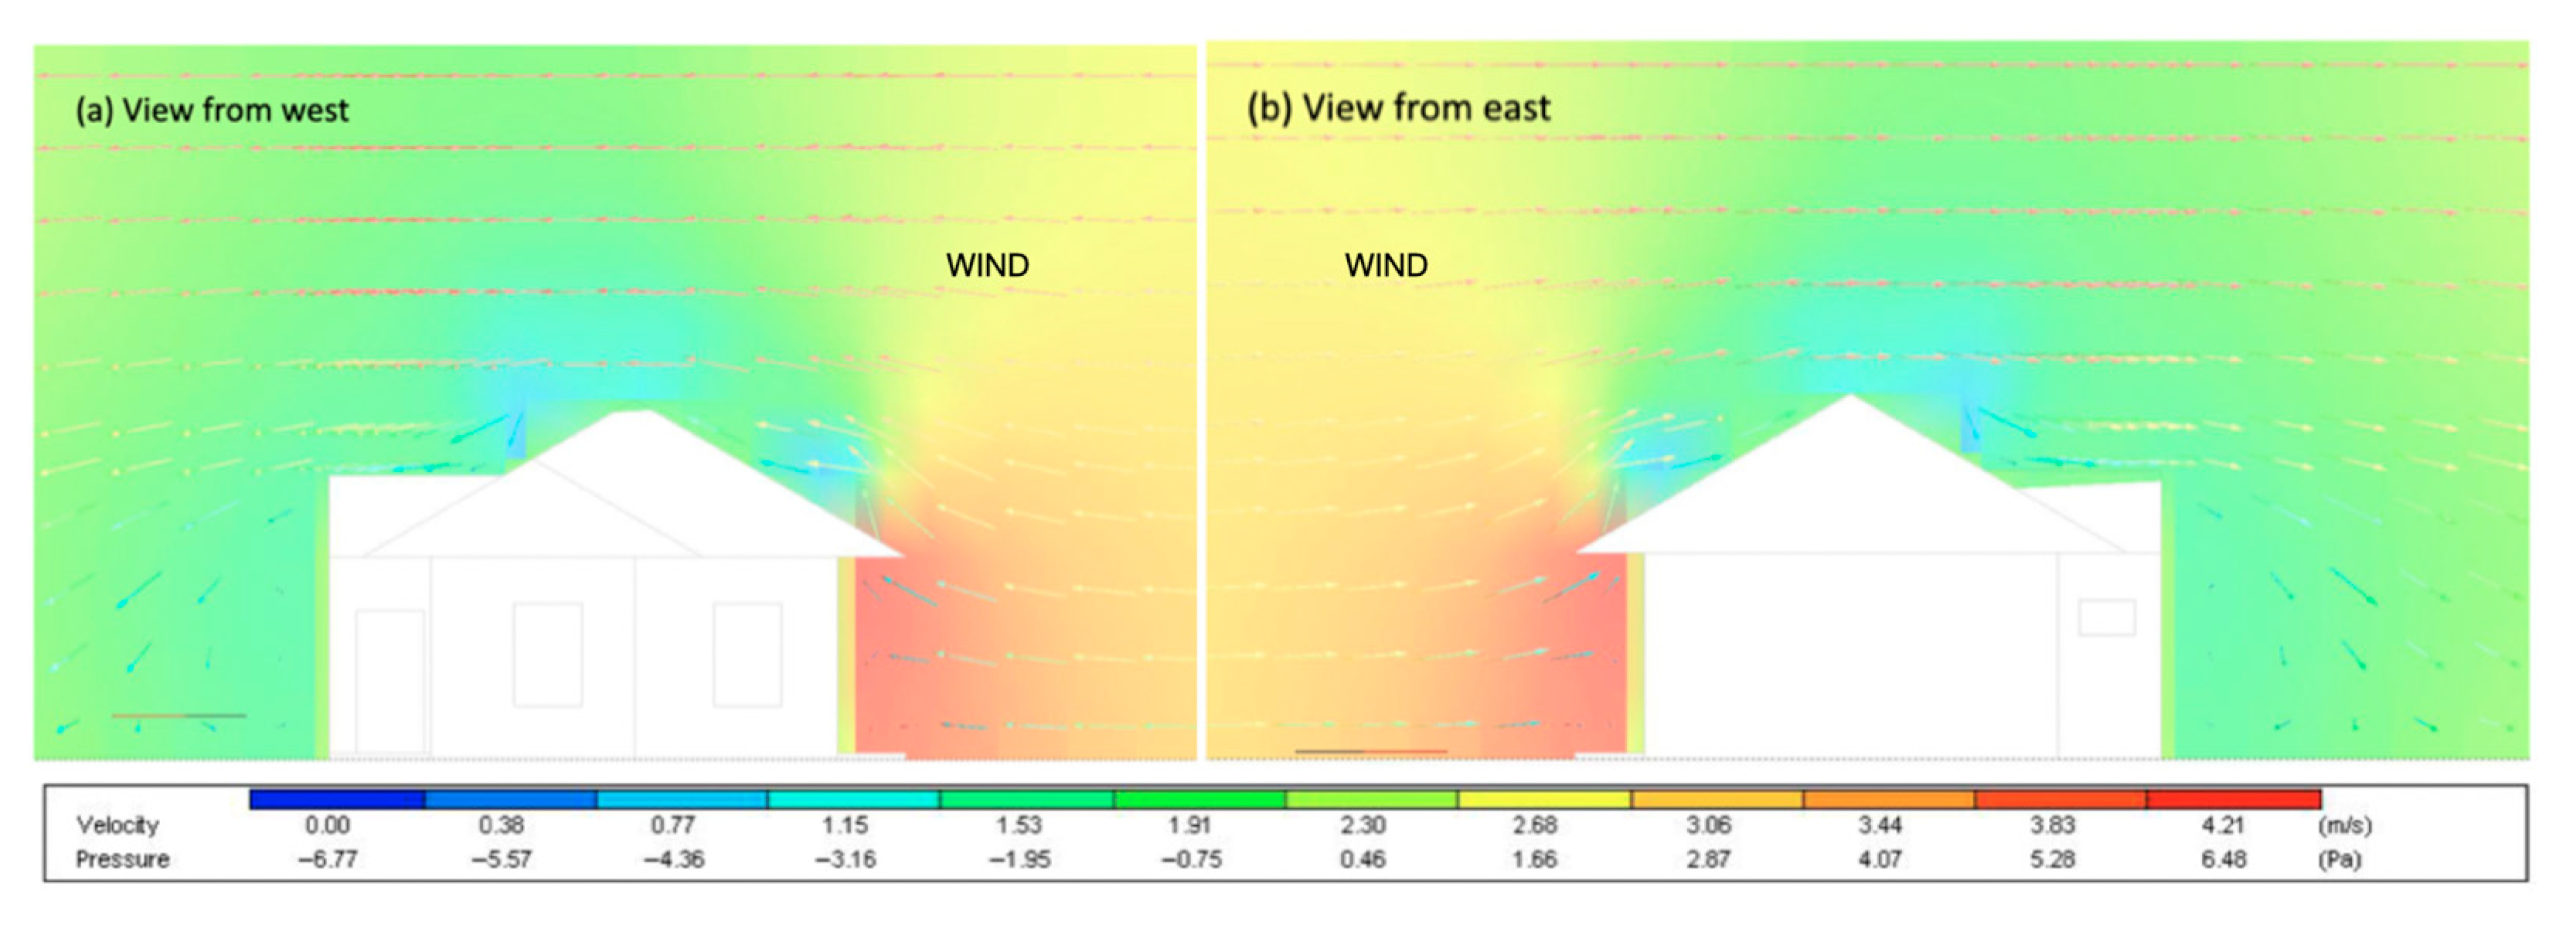
Figure 14 shows wind velocity and wind pressure at the front of a residential house in the west view (Figure 14a) and the east view (Figure 14b). The north side (front) of the building has a wind velocity of approximately 4 m/s. There are, however, some areas of the roof where the wind velocity reduces to about 1 m/s. A house’s roof shape reduces wind flow.
The effects of building arrangement on the wind environment in buildings are simulated and analyzed. Residential grid arrangements can have an impact on urban ventilation corridors, mainly in the following areas:
  • The best urban ventilation corridor can be created from south to north (points 1, 2, 3, 4, 5, 10, 11, 12, 13, 14, 19, and 23). Due to the pipe-tube effect, access points to residential buildings increase with wind speed.
  • A low wind speed in between houses is measured at points 6, 7, 8, 9, 15, 16, 17, 18, 24, 25, 26, and 27. It is possible to reduce the length of this road.

4.2. CFD Simulation Using Autodesk Forma

Semarang, the capital city of Central Java, exhibits this with an observed warming rate of 0.0257 °C per year, surpassing the national average rise of 0.016 °C [4]. As a result of the accelerated warming in Semarang, the area is more vulnerable to the effects of UHI. Heat stress in Semarang has led to an increased reliance on artificial cooling. In addition to these thermal challenges, Semarang’s local wind environment offers an important resource for passive cooling. As a tropical coastal city, Semarang’s climate is governed by the Asian-Australian monsoon system, which generates distinct seasonal wind patterns. Wind speeds during the dry season range from 2.1 to 5.7 m/s, mainly from the east and southeast [75]. Conversely, during the wet season, winds shift westward and northwestward. As thermal comfort and heat dissipation are most important during the hotter, dry season, the easterly wind presents an important natural benefit. As dense urban morphology can obstruct airflow, resulting in reduced ventilation and stagnant microclimates, this potential can be lost without strategic urban design [11]. Mitigating the city’s heat-related challenges requires understanding and strategically harnessing these prevailing easterly winds.

4.2.1. Study Area and Case Study Model in Semarang

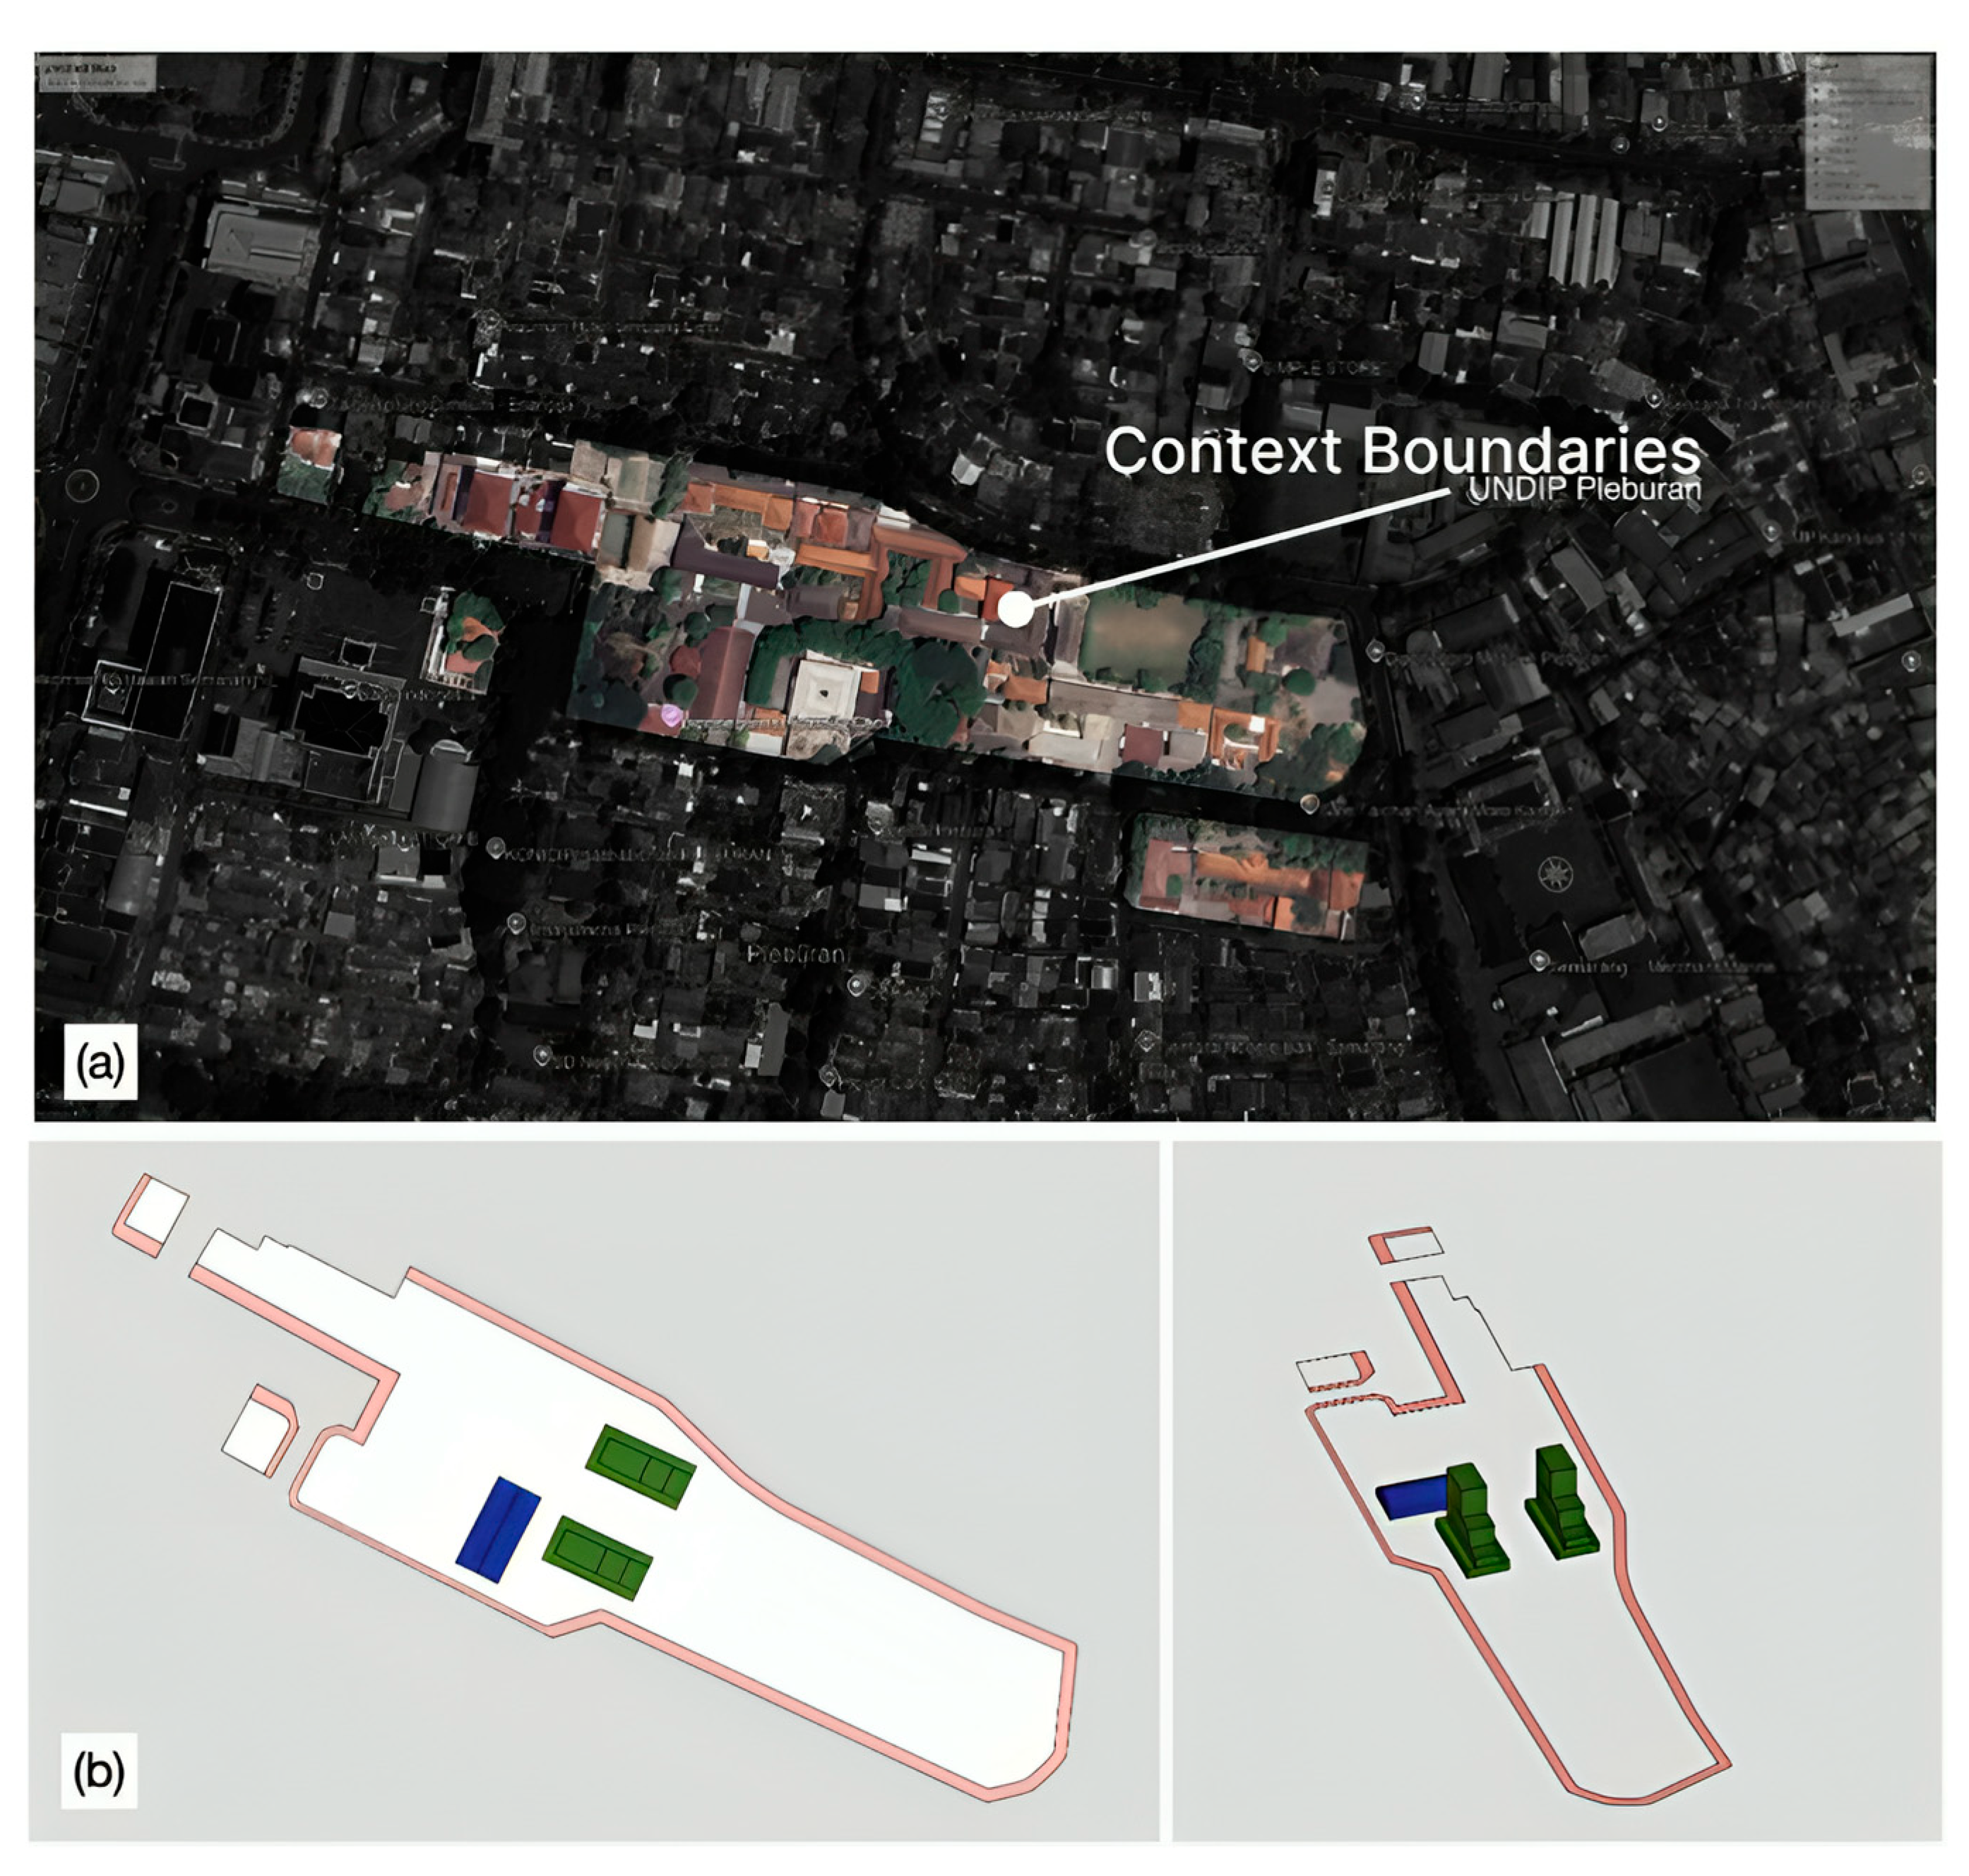
A CFD analysis of the potential impact of the design configurations on the local wind environment for high rise buildings was conducted using the Autodesk Forma software. This study will take place at the Universitas Diponegoro Pleburan Campus in Pleburan, Semarang, Central Java, Indonesia. According to the Urban Design Planning document (KRK) issued by the Semarang City Government Spatial Planning Agency (PUPR), the land area for the campus masterplan is approximately 87,522 m2, with a maximum buildable area of approximately 52,513 m2. It is shown in Figure 15b that the KRK borders are indicated in red on the site image. The masterplan context should include three significant existing buildings: the twin towers (indicated in green) and the Imam Barjo Auditorium (indicated in blue) (Figure 15). As well as new proposed developments, these existing structures will be incorporated into the 3D model.
As a first step, the street grid was strategically designed in order to optimize wind penetration. The current layout lacks ventilation-conscious design strategies, such as oriented street corridors or permeable building arrangements, which almost entirely halt airflow and prevent wind from penetrating the campus interior (Figure 15a). Consequently, there are extensive areas of poor air circulation and stagnant conditions in the most frequently used pedestrian areas.
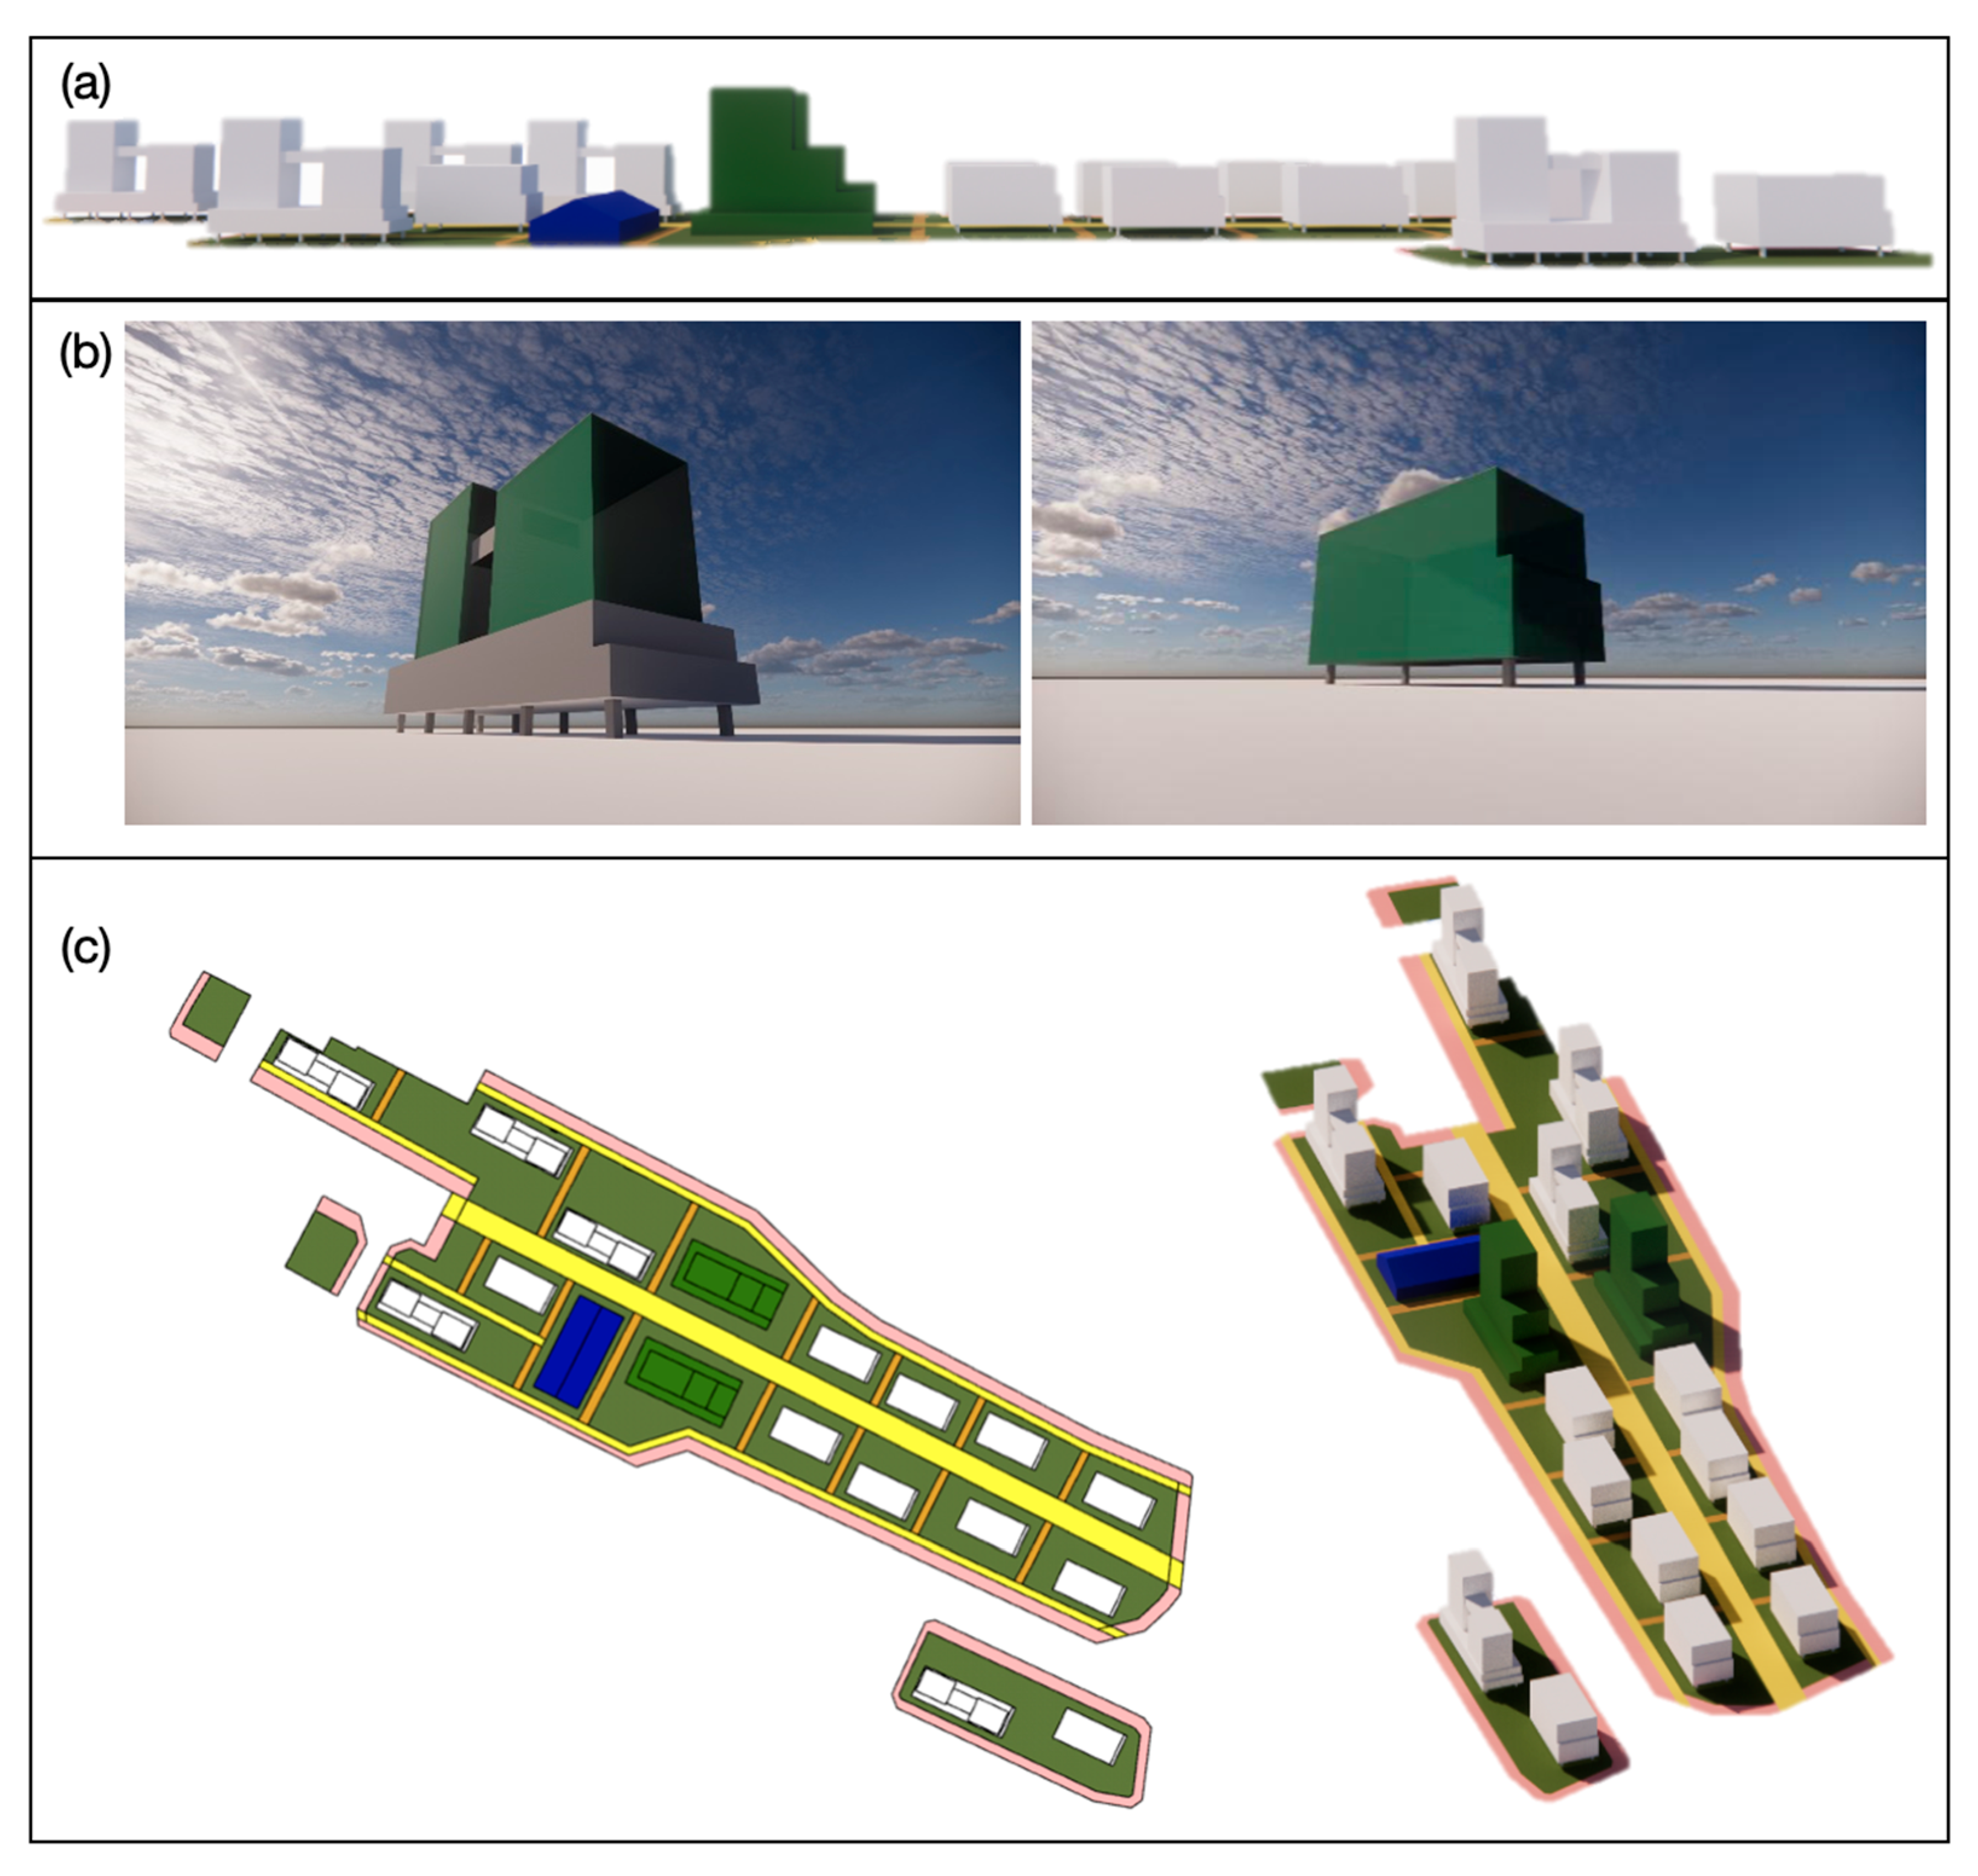
The placement and configuration of these building templates (along with the twin towers and Imam Barjo Auditorium) will adhere to particular ventilation principles (Figure 15b). In all new template buildings, the longer facades will be aligned parallel to the prevailing southeasterly (SE) wind and the main longitudinal roads (Figure 16). In addition, buildings will not be arranged in a strictly uniform, linear pattern. The placement of these items will be staggered or offset from each other. A deliberate application of strategies aimed at optimizing urban permeability, encouraging air flow, and reducing stagnant air zones is central to this approach to building disposition. In accordance with urban ventilation research, principles of building disposition were discussed. This scenario was generated using contextual data from OpenStreetMap (OSM) available within the Autodesk Forma platform. Airflow patterns at various heights were examined in order to determine the interaction between an easterly prevailing wind and the existing urban morphology.
As part of the new masterplan, two distinct building typologies have been conceptualized: a high-rise and a mid-rise. Both types of buildings will be elevated 3 m from the ground from their base, which is a distinctive feature (Figure 17a). In this way, a pedestrian level underneath the structures has been created that is open and permeable, introducing direct strategies to enhance the ground-level airflow and to improve pedestrian thermal comfort by allowing the wind to pass relatively unobstructed. High-rise buildings have a raised floor and twin towers. The building measures 60 m × 20 m and has an occupied height of 8 m (resulting in an overall building height of 11 m, including the 3 m lift). The building is topped by two towers. Tower 1 has a footprint of 20 m × 15 m and an occupied height of 20 m (reaching a height of 31 m from the ground), while Tower 2 has a footprint of 20 m × 15 m and an occupied height of 30 m (reaching a height of 41 m from the ground). In order to break up wind patterns and enhance permeability, the towers are arranged in a non-parallel, slightly offset configuration. Building templates for mid-rise buildings were designed with rectangular footprints of 20 m × 40 m and occupied heights of 21 m (Figure 17a). This building will have a height of 24 m from the ground to its roof, including the 3 m lift.
The new masterplan’s street designed a 15 m wide main road for motor vehicles, bicycles, and pedestrians (Figure 17b). The road traverses the site longitudinally, aligned with the prevailing southeasterly wind in the Semarang region. A secondary road dedicated to pedestrian and bicycle traffic will run parallel to the main road on either side of the site, maintaining the same favorable orientation with the easterly wind. In order to facilitate cross-site air movement and create minor breezeways, these three longitudinal roads will be connected by transverse paths (Figure 17b). In order to promote natural ventilation throughout the district, this network design directly applies principles of orienting thoroughfares with weather patterns and creating interconnected air paths.

4.2.2. Simulation Results and Optimized Design

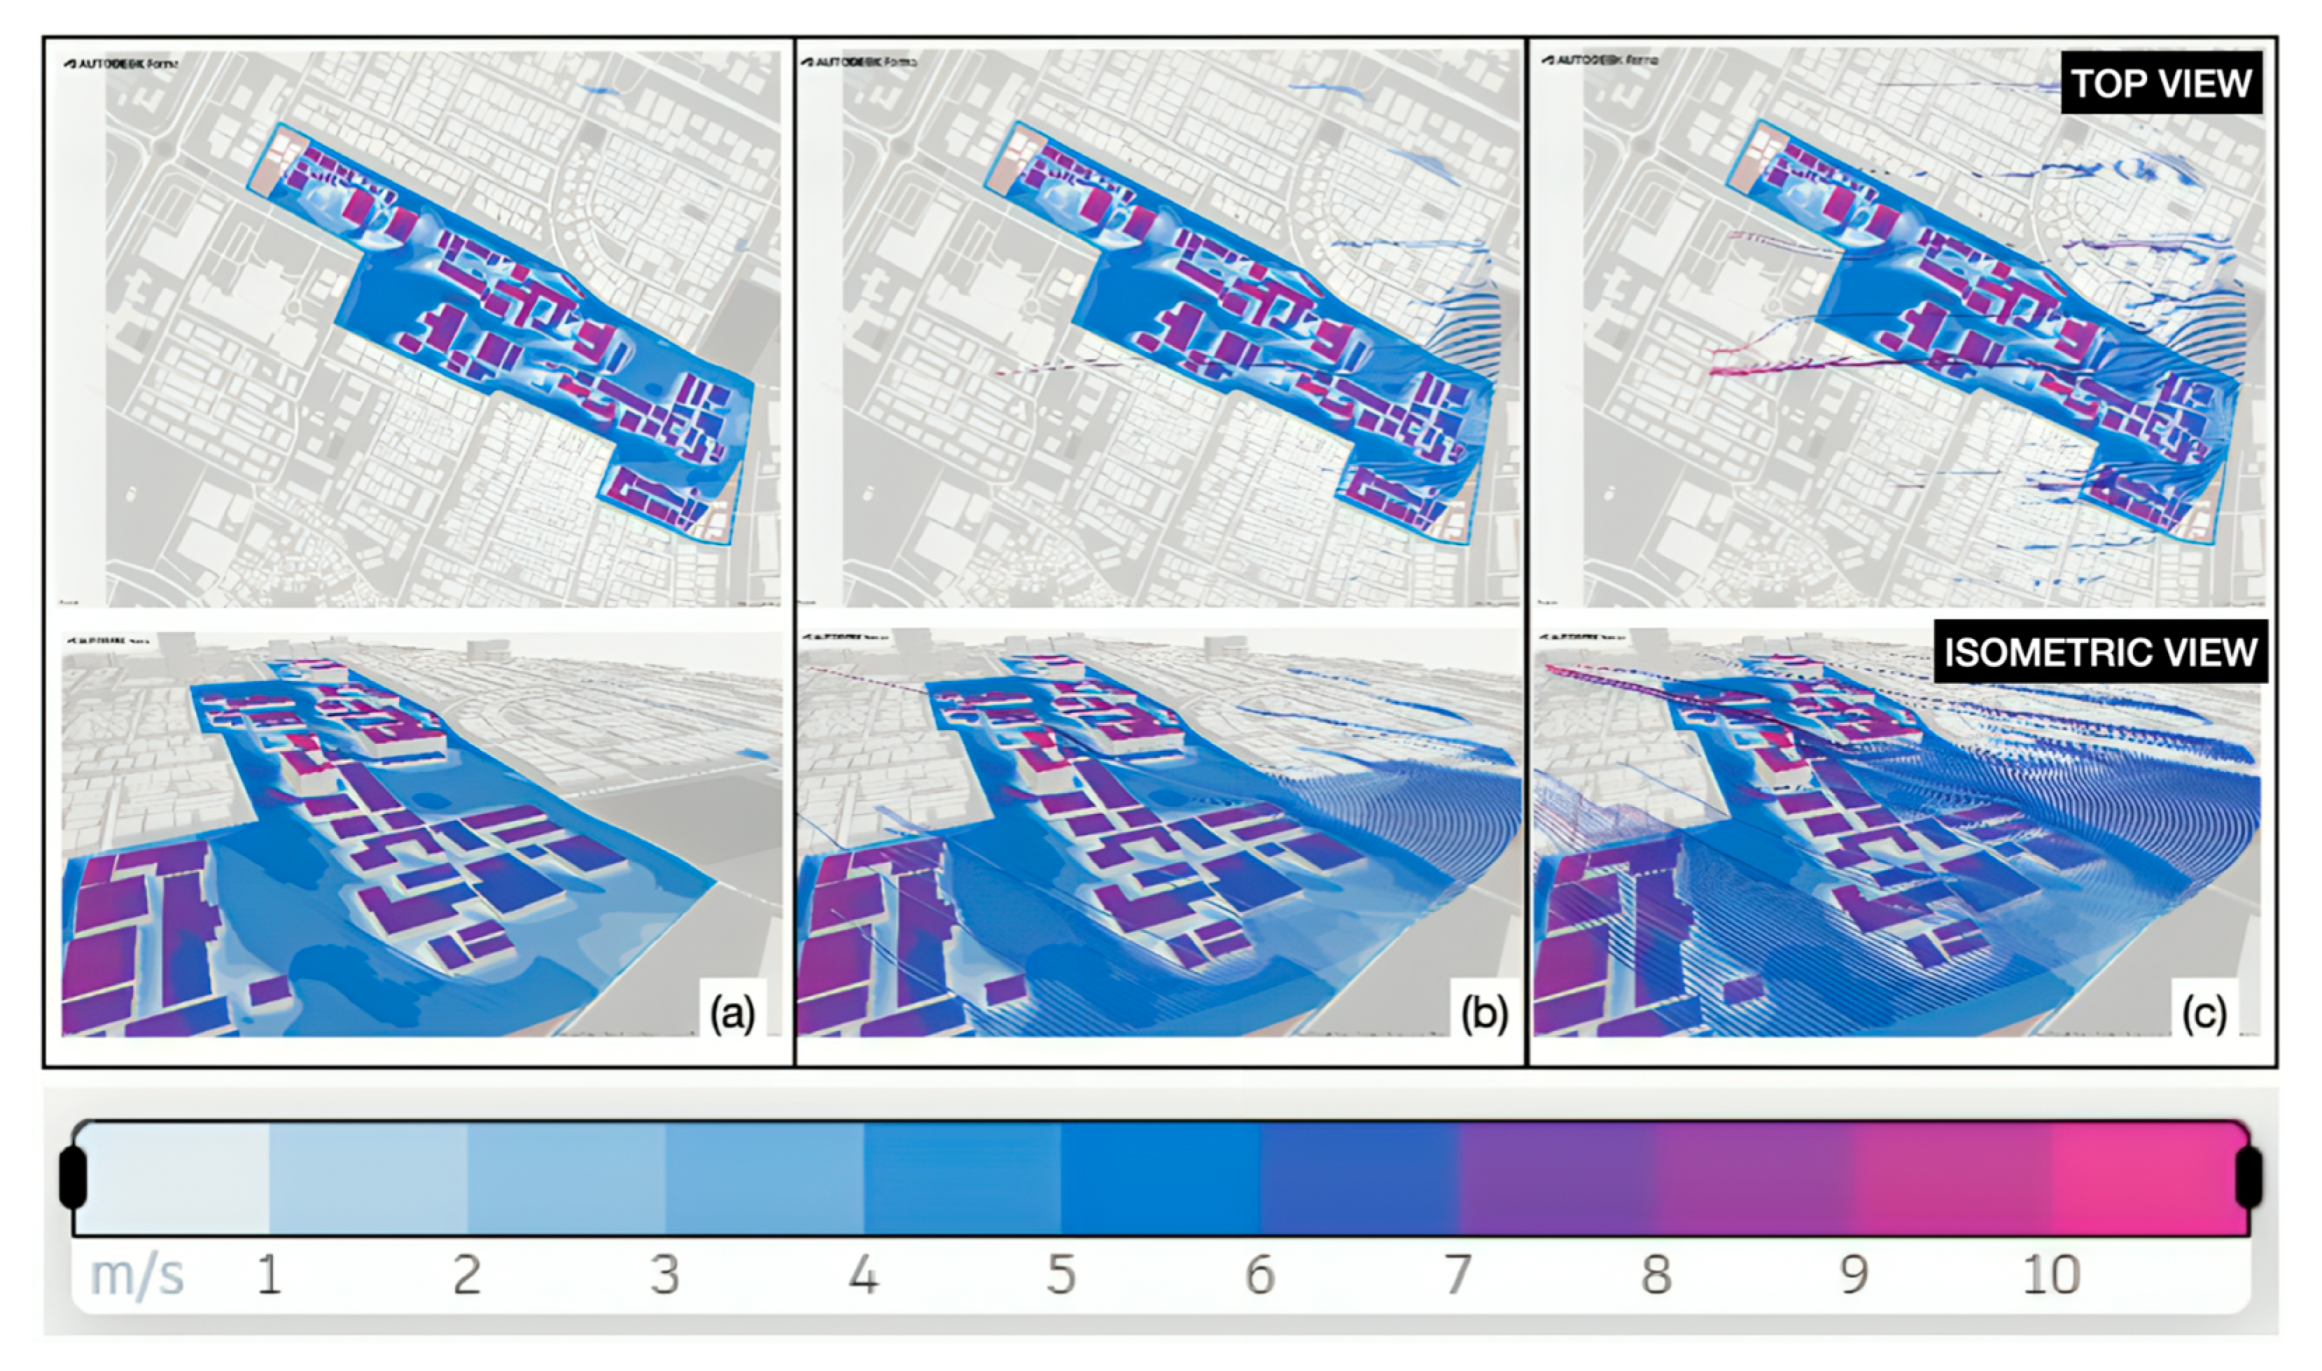
The first simulation was conducted under current conditions. The simulation of the existing campus layout reveals significant impediments to natural ventilation (Figure 18). The solid building masses significantly restrict airflow at pedestrian levels (1–2 m), resulting in extensive stagnant zones within the interior of the site. Only high-speed winds can pass over shorter buildings at 3 m, resulting in little widespread air movement. Specifically, the analysis shows that at pedestrian levels, which correspond to heights of one and two meters, the prevailing wind vortexes significantly affect the solid walls of the existing buildings (Figure 18). The wind environment varies at a height of 3 m. Some shorter existing buildings can be passed over by high speed wind vortexes. However, even at this elevation, lower speed winds are still obstructed by the general building mass, failing to create widespread air movement across the site. Based on the baseline simulation, the current campus configuration presents a poorly ventilated environment at the human scale, indicating that air permeability and thermal comfort can be improved through design interventions.
Simulated airflow patterns and the effectiveness of urban ventilation strategies were examined based on an easterly prevailing wind direction. Simulation results indicated that air flow was generally continuous throughout the conceptual campus layout. The areas identified as stagnant zones appeared relatively small and exhibited very low wind movement (shown in the simulation by a very light blue color, indicating minimal air speed) (Figure 18).
The existing simulation was used to develop some strategies that focused on the layout of the site and the mass of the buildings. Figure 19 shows the comparison for the existing masterplan (a) and redesign masterplan (b). Figure 20 illustrates the simulation results for the redesign area. The primary wind path was observed to channel effectively through the main road, which is aligned with the prevailing easterly wind. Following the central corridor, airflow was distributed to the minor paths and open spaces within the campus design. A key observation, in line with the design intent, was the substantial airflow underneath the lifted mass of the buildings. As a result, these elevated structures can provide pedestrians with shaded areas as well as a cooling breeze (Figure 20).
When comparing the result of the existing and redesign condition, several points as shown in Figure 19 resulted in a significant increase in ground-level wind speed as shown in Table 1. The wind speed at Point 1, located along the eastern section of the main road, increased from 4.5 m/s in the baseline scenario to 7.3 m/s (62%). A significant improvement in percentage was observed at Point 3, a previously identified stagnant area, where wind speed increased approximately 139%, demonstrating the effectiveness of the design in enhancing ventilation in poorly ventilated areas. To maximize wind velocity in the corridor, the new design provides a markedly improved wind environment. Throughout the main road, a continuous flow is channeled and distributed effectively to the minor pathways. As a result of the lifted building masses, a ventilated pedestrian realm is created beneath, while the staggered building placement appears to break up large wake regions, which promotes a better circulation of air in general.
In both scenarios, increased wind velocity was primarily associated with differences in building typologies. The new masterplan replaces several low-rise buildings with taller mid-rise and high-rise buildings, resulting in an increase in wind velocity. However, these larger leeward stagnant air zones, or “wind shadows,” may worsen pedestrian conditions in some areas. Nevertheless, the simulation results indicate that the potential negative effects have been greatly minimized. Ultimately, this successful mitigation is due to the core design strategies implemented: the elevation of all new building masses and their staggered placement. Lifted structures allow wind to pass underneath building volumes instead of completely blocking it, while offset layouts prevent extensive, uninterrupted wind shadows from developing that could occur if tall buildings were arranged in a rigid grid. Consequently, the proposed design is not only an improvement over the poorly ventilated baseline but also effectively manages the new aerodynamic challenges posed by increased building heights and densities.

5. Discussion

Ventilation corridors in urban areas are complex. Wind velocity can be increased in residential areas to access natural ventilation, especially in tropical climates, and this can reduce the UHI in urban areas. Simulating using CFD does not provide a perfect level of accuracy since the model form is simplified. The validation is therefore crucial. Furthermore, this method was useful for early planning before moving forward. In the future, this will lead to the validation of the CFD results through further research. Based on the findings of this study in residential areas, the wind usually blows from the south (front) and east sides of the houses, so it is recommended to design openings on both sides. Furthermore, between houses’ wind velocity that is not windward with low wind velocity, the road length can be reduced as desired.
The specific design strategies detailed for high rise buildings demonstrated positive outcomes in the simulation:
  • Lifted Building Mass: The simulation visually confirmed that lifting the high-rise and mid-rise building templates 3 m off the ground successfully enhances air circulation at the pedestrian level, as intended. Wind was able to flow beneath the main building volumes, promoting a more ventilated environment in these frequently used spaces.
  • Street Orientation: The alignment of the main road with the easterly wind allowed for continuity of airflow through the site, rather than the wind being significantly blocked or prematurely dispersed by building structures.
  • Offset Building Placement: The staggered or offset placement of the building templates, as opposed to a rigid linear arrangement, appeared to contribute to preventing the formation of large, extensive stagnant air zones, promoting better air mixing between building clusters.
The few identified areas with minimal airflow (small stagnant zones) are not necessarily viewed as a concern. Instead, the simulation results suggest these localized zones of calm could present opportunities for strategic landscape interventions, such as the placement of green or blue spaces (e.g., small parks, water features, dense planting areas). Such features could thrive in lower-wind conditions and further contribute to microclimatic amelioration and esthetic quality, transforming potential weaknesses into design possibilities. The combination of street layout aligned with prevailing winds, permeable building arrangements due to the offset placement, and significantly improved ground-level airflow resulting from the lifted building masses collectively contributes to a wind environment conducive to improved thermal comfort and air quality.
Based on the research conducted previously in Jakarta, several strategies were employed to increase the wind flow around the building, and it was found that the average wind velocity ranged from 0 m/s to 4 m/s [76,77]. In this case, the results were similar to those of CFD simulations conducted using DesignBuilder, which produced results between 0.40 m/s and 4 m/s. According to previous research regarding rooftop pitches of houses in Semarang, the average wind velocity ranged from 2 m/s to 5 m/s [78]. When compared to CFD analysis using Autodesk Forma for a similar location in Semarang, the average wind velocity in existing conditions ranges from 2.3 m/s to 4.5 m/s. The results of this simulation were similar to those of previous research, showing that the simulation result was valid.
Each city or province local government in Indonesia developed its city planning program based on the needs of the local population over a 20-year period. In addition, an evaluation and monitoring process were conducted every ten years to determine whether a revision was necessary regarding the current planning design. The current city planning programs for both cities, Semarang and Jakarta, emphasize the development of smart cities and digitalization in order to contribute to the increase in local economic activity [79,80]. As part of the smart city masterplan concept, almost all dimensions of the smart city are addressed, including smart living, smart branding, smart economy, smart environment, and smart society. Nevertheless, local governments place less emphasis on UHI, which shows by current data that this aspect has a significant effect on human comfort and consumes a great deal of electricity. By conducting this research, we are providing opportunities for a more climate-responsive urban environment to receive better ventilation and fewer urban heat islands. With the help of this study, we hope that the strategies and methods proposed will serve as a guide for Indonesian government suggestions regarding the design of future city planning. As well, within this study, planning strategies, approaches, and methods will stimulate more relevant empirical research in other countries in tropical climates and Asia that struggle with high urbanization and UHI. Urban wind corridors have become a policy direction for cooling cities and promoting sustainable and ecological cities.

6. Conclusions

Urban ventilation is a critical and ongoing strategy for mitigating the adverse effects of climate change in tropical urban areas. A comprehensive literature review identified the persistent challenges of Urban Heat Island (UHI) effects and declining outdoor thermal comfort, exacerbated by global warming and driving an increase in energy-intensive cooling systems, particularly in Indonesian cities like Jakarta and Semarang. Ventilation in urban environments contributes to the creation of healthier, more comfortable environments, as well as saving energy and protecting the environment. Especially in residential areas that require a high level of safety and comfort.
The current research has identified a wide range of design strategies, including optimizing street grids, creating breezeways, integrating natural elements, and designing building morphology carefully. In order to test the viability of this approach, a preliminary CFD analysis was conducted using DesignBuilder and Autodesk Forma. In both software programs, a significant improvement in wind velocity and flow was demonstrated for the urban ventilation corridor strategy. Residential areas with low-rise buildings in Jakarta were designed with specific aspects related to street layout aligned with prevailing winds, permeable building arrangements due to offset placements, and enhanced ground-level airflow. Additionally, for the area of high rise university buildings located in Semarang city, it has been found that by lifting building masses and designing the street layout in accordance with the direction of the wind, pedestrian air circulation is enhanced under the building masses, and large stagnant areas can be effectively reduced. CFD simulation software such as DesignBuilder and Autodesk Forma provided an easier alternative to conducting wind flow simulations. The simulation can provide designers with fast and validated results for their designs.
This study has certain limitations, which should be noted. The simplified modeling of building porosity may not accurately capture wind–architecture interactions. Other limitations relate to the validation of the simulation results with the site measurements. In order to address these limitations, similar studies conducted at the same site were compared and similar results were obtained. The research presented here is a preliminary study and will be developed through analysis. Further research will focus on the simulation validation using existing measurements derived from this preliminary research and the transfer of the design to wider urban contexts. Improvement strategies generally reflected sustainable development guidelines and reflected the development trend.

Author Contributions

Conceptualization, D.P.S.; methodology, D.P.S. and M.A.J.; software, D.P.S. and M.A.J.; validation, D.P.S. and M.A.J.; formal analysis, D.P.S. and M.A.J.; investigation, D.P.S. and M.A.J.; resources, D.P.S. and M.A.J.; data curation, D.P.S.; writing—original draft preparation, M.A.J.; writing—review and editing, D.P.S.; visualization, D.P.S. and M.A.J.; supervision, D.P.S.; project administration, D.P.S.; funding acquisition, D.P.S. All authors have read and agreed to the published version of the manuscript.

Funding

This research received no external funding.

Data Availability Statement

Data are contained within the article.

Acknowledgments

This study was supported by the National Research and Innovation Agency (BRIN) with RIIM research project no. B-802/II.7.5/FR/6/2022 by LPDP. This research was supported by the Department Architecture, Diponegoro University.

Conflicts of Interest

The authors declare no conflicts of interest.

References

  1. Haunschild, R.; Bornmann, L.; Marx, W. Climate Change Research in View of Bibliometrics. PLoS ONE 2016, 11, e0160393. [Google Scholar] [CrossRef] [PubMed]
  2. Zheng, Y.; Li, W.; Fang, C.; Feng, B.; Zhong, Q.; Zhang, D. Investigating the impact of weather conditions on urban heat island development in the subtropical city of Hong Kong. Atmosphere 2023, 14, 257. [Google Scholar] [CrossRef]
  3. Sari, D.P. A Review of How Building Mitigates the Urban Heat Island in Indonesia and Tropical Cities. Earth 2021, 2, 653–666. [Google Scholar] [CrossRef]
  4. Climate Resilience Development Policy 2020–2045. Available online: https://lcdi-indonesia.id/wp-content/uploads/2021/04/Buku-0_Ringkasan-Eksekutif-Dokumen-Kebijakan-Pembangunan-Berketahanan-Iklim.pdf (accessed on 15 July 2025). (In Bahasa).
  5. Priya, U.K.; Senthil, R. A review of the impact of the green landscape interventions on the urban microclimate of tropical areas. Build. Environ. 2021, 205, 108190. [Google Scholar] [CrossRef]
  6. Sari, D.P.; Harsritanto, B.I.R.; Pinassang, J.L. Green Building Curriculum: Towards Indonesia’s Net Zero Ambitions. J. Green Build. 2024, 19, 209–224. [Google Scholar] [CrossRef]
  7. Sari, D.P.; Sudirman, M.; Chiou, Y.S. Modernity in Javanese tradition: Adapting vernacular design and local culture to Indonesian urban living. Archit. Sci. Rev. 2022, 67, 105–119. [Google Scholar] [CrossRef]
  8. Sari, D.P.; Cho, K.P. Performance Comparison of Different Building Shapes Using a Wind Tunnel and a Computational Model. Buildings 2022, 12, 144. [Google Scholar] [CrossRef]
  9. Al Niyadi, S.; Mahgoub, M.H.E. Advancing hybrid ventilation in hot climates: A review of current research and limitations. Front. Built Environ. 2025, 10, 1502941. [Google Scholar] [CrossRef]
  10. Urban Ventilation Strategies for Micro Climate Improvement in Subtropical High-Density Cities: A Case Study of Tai Po Market in Hong Kong. Available online: https://core.ac.uk/download/pdf/526616663.pdf (accessed on 20 January 2025). (In Chinese).
  11. Rajagopalan, P.; Lim, K.; Jamei, E. Urban heat island and wind flow characteristics of a tropical city. Sol. Energy 2014, 107, 159–170. [Google Scholar] [CrossRef]
  12. Sari, D.P.; Gunawan, I.; Chiou, Y.S. Investigation of Ecohouse through CFD Simulation. In Proceedings of the 6th International Conference on Industrial, Mechanical, Electrical and Chemical Engineering (ICIMECE), Solo, Indonesia, 20 October 2020. [Google Scholar] [CrossRef]
  13. Sari, D.P.; Chiou, Y.S.; Sugianto, W. The impact of natural ventilation on the adaptive reuse of a Taiwanese heritage house: An analysis using anemometers and CFD. J. Asian Archit. Build. Eng. 2024, 24, 1791–1804. [Google Scholar] [CrossRef]
  14. Cho, K.; Jeong, S.; Sari, D.P. Harvesting Wind Energy from Aerodynamic Design for Building Integrated Wind Turbines. Int. J. Technol. 2011, 2, 189–198. Available online: https://ijtech.eng.ui.ac.id/article/view/1056 (accessed on 14 September 2025).
  15. Tablada, A.; He, Y. Modeling City Patterns for Urban Ventilation: Strategies in High Density Areas of Singapore. In Designing Cooler Cities; Springer: Berlin/Heidelberg, Germany, 2018; pp. 119–135. [Google Scholar] [CrossRef]
  16. Wong, N.H.; Loke, A. A Study of Natural Ventilation of Public Housing in Singapore Using Computational Fluid Dynamics (CFD) Simulations. Int. J. Archit. Sci. 2009, 9, 35–45. Available online: https://hkapi.lib.cuhk.edu.hk/items/a8ecb951-7566-4bbd-809b-82e389569ac7 (accessed on 5 October 2025).
  17. Contribution of Working Groups I, II and III to the Sixth Assessment Report of the Intergovernmental Panel on Climate Change. Climate Change 2023: Synthesis Report. Available online: https://doi.org/10.59327/IPCC/AR6-9789291691647.001 (accessed on 20 January 2025).
  18. Climate Change: Global Temperature. Available online: https://www.noaa.gov/climate (accessed on 4 March 2025).
  19. Katzschner, A.; Diem, N.K.; Dang, T.; Downes, N. The Challenge of Cooling Rapidly Growing Cities: The Case of Densification and Peri-Urbanisation in Ho Chi Minh City and Adaptation Responses. In Climate Change and Cooling Cities; Downes, N.K., Katzschner, A., Nguyen, T.H.T., Eds.; Springer Nature: Singapore, 2023; pp. 115–127. Available online: https://link.springer.com/chapter/10.1007/978-981-99-3675-5_7 (accessed on 17 August 2025).
  20. Reduce Heat Island. Available online: https://www.epa.gov/green-infrastructure/reduce-heat-islands (accessed on 11 March 2025).
  21. Santamouris, M. Energy and Climate in the Built Environment; Routledge: London, UK, 2001. [Google Scholar] [CrossRef]
  22. Xu, Y.; Yang, J.; Zheng, Y.; Li, W. Impacts of two-dimensional and three-dimensional urban morphology on urban thermal environments in high-density cities: A case study of Hong Kong. Build. Environ. 2024, 252, 111249. [Google Scholar] [CrossRef]
  23. Kolokotroni, M.; Ren, X.; Davies, M.; Mavrogianni, A. London’s urban heat island: Impact on current and future energy consumption in office buildings. Energy Build. 2012, 47, 302–311. [Google Scholar] [CrossRef]
  24. Santamouris, M. Analyzing the heat island magnitude and characteristics in one hundred Asian and Australian cities and regions. Sci. Total Environ. 2015, 512–513, 582–598. [Google Scholar] [CrossRef] [PubMed]
  25. Sari, D.P.; Pinassang, J.L. Examining the Impact of COVID-19 in Indonesia through Household Electricity Consumption and Modern Lifestyle. Civ. Eng. Archit. 2023, 11, 1032–1047. [Google Scholar] [CrossRef]
  26. The Impact of Urban Heat Islands: Assessing Vulnerability in Indonesia. Available online: https://www.iied.org/10721iied (accessed on 7 March 2025).
  27. Diem, N.; Diem, P.; Thien, P.; Downes, N. Monitoring Urban Heat Island Spatial Variability over Urban Structure Types–A Case Study from a Fast-growing City in the Vietnamese Mekong Delta. In Proceedings of the IOP Conference Series: Earth and Environmental Science of the National Conference on GIS Application, Hanoi, Vietnam, 11–12 November 2023. [Google Scholar] [CrossRef]
  28. Park, R.J.; Goodman, J.; Hurwitz, M.; Smith, J. Heat and learning. Am. Econ. J. Econ. Policy 2020, 12, 304–339. [Google Scholar] [CrossRef]
  29. Percentage of Households with Air Conditioning by Province and Behavior of Turning on the Air Conditioning Below 25c (2013 and 2017). Available online: https://www.bps.go.id/id/statistics-table/1/MjA1MyMx/persentase-rumah-tangga-yang-memiliki-ac-menurut-provinsi-dan-perilaku-menyalakan-ac-dibawah-25-c--2013-dan-2017.html (accessed on 7 March 2025). (In Bahasa).
  30. The Future of Cooling in Southeast Asia: Increasing Energy Efficiency Through Stronger Policy Action. Available online: https://www.iea.org/reports/the-future-of-cooling-in-southeast-asia (accessed on 7 March 2025).
  31. Provençal, S.; Bergeron, O.; Leduc, R.; Barrette, N. Thermal comfort in Quebec City, Canada: Sensitivity analysis of the UTCI and other popular thermal comfort indices in a mid-latitude continental city. Int J Biometeorol 2016, 60, 591–603. [Google Scholar] [CrossRef]
  32. Ge, Q.; Kong, Q.; Xi, J.; Zheng, J. Application of UTCI in China from tourism perspective. Theor. Appl. Climatol. 2016, 124, 635–644. [Google Scholar] [CrossRef]
  33. Li, J.; Niu, J.; Mak, C.M.; Huang, T.; Xie, Y. Exploration of applicability of UTCI and thermally comfortable sun and wind conditions outdoors in a subtropical city of Hong Kong. Sustain. Cities Soc. 2020, 52, 101793. [Google Scholar] [CrossRef]
  34. Silva, T.J.V.; Hirashima, S.Q.S. Predicting urban thermal comfort from calibrated UTCI assessment scale—A case study in Belo Horizonte city, southeastern Brazil. Urban Clim. 2020, 36, 100778. [Google Scholar] [CrossRef]
  35. Yuan, C.; Ng, E. Building porosity for better urban ventilation in high-density cities—A computational parametric study. Build. Environ. 2012, 50, 176–189. [Google Scholar] [CrossRef] [PubMed]
  36. Assessment on Summer Comfort Level of Southern Cities in China by UTCI. Available online: https://m.qikan.cqvip.com/Article/ArticleDetail?id=667746170&from=Article_ArticleDetail (accessed on 7 March 2025). (In Chinese).
  37. Liu, S.; Nazarian, N.; Niu, J.; Hart, M.A.; de Dear, R. From thermal sensation to thermal affect: A multi-dimensional semantic space to assess outdoor thermal comfort. Build. Environ. 2020, 182, 107112. [Google Scholar] [CrossRef]
  38. Palusci, O.; Cecere, C. Urban Ventilation in the Compact City: A Critical Review and a Multidisciplinary Methodology for Improving Sustainability and Resilience in Urban Areas. Sustainability 2022, 14, 3948. [Google Scholar] [CrossRef]
  39. A Study of Air Path and Its Application in Urban Planning. Available online: https://www.researchgate.net/publication/297561480_A_Study_of_Air_Path_and_Its_Application_in_Urban_Planning_chengshitongfenglangdaojiqiguihuayingyong (accessed on 10 March 2025). (In Chinese).
  40. Gu, K.; Fang, Y.; Qian, Z.; Sun, Z.; Wang, A. Spatial planning for urban ventilation corridors by urban climatology. Ecosyst. Health Sustain. 2020, 6, 1747946. [Google Scholar] [CrossRef]
  41. Hsieh, C.M.; Huang, H.C. Mitigating urban heat islands: A method to identify potential wind corridor for cooling and ventilation. Comput. Environ. Urban Syst. 2016, 57, 130–143. [Google Scholar] [CrossRef]
  42. Liu, X.; Huang, B.; Li, R.; Zhang, J.; Gou, Q.; Zhou, T.; Huang, Z. Wind environment assessment and planning of urban natural ventilation corridors using GIS: Shenzhen as a case study. Urban Clim. 2022, 42, 101091. [Google Scholar] [CrossRef]
  43. Lim, J.; Ooka, R. Correlation analysis of urban morphological parameters using GIS data of Tokyo: Parameterization of urban ventilation potential in high-density urban area Part 1. J. Environ. Eng. 2014, 79, 785–794. (In Japanese) [Google Scholar] [CrossRef]
  44. Peng, Y.; Gao, Z.; Buccolieri, R.; Ding, W. An Investigation of the Quantitative Correlation between Urban Morphology Parameters and Outdoor Ventilation Efficiency Indices. Atmosphere 2019, 10, 33. [Google Scholar] [CrossRef]
  45. Sarria, F.R.; Delgado, M.G.; Ramos, J.S.; Amores, T.P.; Félix, J.L.M.; Domínguez, S.A. Assessing Urban Ventilation in Common Street Morphologies for Climate-Responsive Design toward Effective Outdoor Space Regeneration. Sustainability 2024, 16, 6861. [Google Scholar] [CrossRef]
  46. Ng, E. Policies and technical guidelines for urban planning of high-density cities—Air ventilation assessment (AVA) of Hong Kong. Build. Environ. 2009, 44, 1478–1488. [Google Scholar] [CrossRef]
  47. Yuan, C.; Ren, C.; Ng, E. GIS-based surface roughness evaluation in the urban planning system to improve the wind environment—A study in Wuhan, China. Urban Clim. 2014, 10, 585–593. [Google Scholar] [CrossRef]
  48. Chen, S.L.; Lu, J.; Yu, W.W. A quantitative method to detect the ventilation paths in a mountainous urban city for urban planning: A case study in Guizhou, China. Indoor Built Environ. 2017, 26, 422–437. [Google Scholar] [CrossRef]
  49. Zhan, Q.; Fan, Y.; Xiao, Y.; Ouyang, W.; Lan, Y.; Jin, Z.; Yin, J.; Zhang, L. Sustainable Strategy: Comprehensive Computational Approach for Wind Path Planning in Dense Urban Area. Int. Rev. Spat. Plan. Sustain. Dev. 2018, 6, 148–164. [Google Scholar] [CrossRef] [PubMed]
  50. Zhang, S.; Fang, X.; Cheng, C.; Chen, L.; Zhang, L.; Yu, Y.; Li, L.; Luo, H. Research on the Planning Method and Strategy of Urban Wind and Heat Environment Optimization—Taking Shenzhen, a Sub-Tropical Megacity in Southern China, as an Example. Atmosphere 2022, 13, 1395. [Google Scholar] [CrossRef]
  51. Son, J.M.; Eum, J.H.; Kim, S. Wind corridor planning and management strategies using cold air characteristics: The application in Korean cities. Sustain. Cities Soc. 2022, 77, 103512. [Google Scholar] [CrossRef]
  52. Gao, W.; Li, H.; Ojima, T. Mitigating the Urban Thermal Environment of Tokyo through a Cluster Planning. J. Asian Archit. Build. Eng. 2002, 1, 131–136. Available online: https://www.aij.or.jp/paper/detail.html?productId=16281 (accessed on 5 January 2025). (In Japanese). [CrossRef]
  53. Schroth, O.; Ju, Q. Modelling microclimates in the smart city: A campus case study on natural ventilation. In Proceedings of the 21st International Conference on Urban Planning, Regional Development and Information Society, Hamburg, Germany, 22–24 June 2016; Available online: https://repository.corp.at/160/ (accessed on 7 January 2025).
  54. Feyisa, G.L.; Dons, K.; Meilby, H. Efficiency of parks in mitigating urban heat island effect: An example from Addis Ababa. Landsc. Urban Plan. 2014, 123, 87–95. [Google Scholar] [CrossRef]
  55. Liu, Z.; Cheng, W.; Jim, C.Y.; Morakinyo, T.E.; Shi, Y.; Ng, E. Heat mitigation benefits of urban green and blue infrastructures: A systematic review of modeling techniques, validation and scenario simulation in ENVI-met V4. Build. Environ. 2021, 200, 107939. [Google Scholar] [CrossRef]
  56. Morakinyo, T.E.; Kong, L.; Lau, K.K.L.; Yuan, C.; Ng, E. A study on the impact of shadow-cast and tree species on in-canyon and neighborhood’s thermal comfort. Build. Environ. 2017, 115, 1–17. [Google Scholar] [CrossRef]
  57. Tan, Z.; Lau, K.K.L.; Ng, E. Urban tree design approaches for mitigating daytime urban heat island effects in a high-density urban environment. Energy Build. 2016, 114, 265–274. [Google Scholar] [CrossRef]
  58. Zhang, X.Y.; Jiang, C.; Sun, J.X.; Zhou, M.F. Spatio-temporal variations and influencing factors of thermal comfort at different elevations. Chin. J. Appl. Ecol. 2018, 29, 2808–2818. (In Chinese) [Google Scholar] [CrossRef]
  59. Wang, Y.; Zhan, Q.; Ouyang, W. How to quantify the relationship between spatial distribution of urban waterbodies and land surface temperature? Sci. Total Environ. 2019, 671, 1–9. [Google Scholar] [CrossRef] [PubMed]
  60. Priya, U.K.; Senthil, R. Enhancing Sustainable Thermal Comfort of Tropical Urban Buildings with Indoor Plants. Buildings 2024, 14, 2353. [Google Scholar] [CrossRef]
  61. Wang, Y.; Zhang, Y.; Ding, N.; Qin, K.; Yang, X. Simulating the Impact of Urban Surface Evapotranspiration on the Urban Heat Island Effect Using the Modified RS-PM Model: A Case Study of Xuzhou, China. Remote Sens. 2020, 12, 578. [Google Scholar] [CrossRef]
  62. Zhang, J.; Xu, L.; Shabunko, V.; Tay, S.E.R.; Sun, H.; Lau, S.S.Y.; Reindl, T. Impact of urban block typology on building solar potential and energy use efficiency in tropical high-density city. Appl. Energy 2019, 240, 513–533. [Google Scholar] [CrossRef]
  63. Sari, D.P.; Chiou, Y.-S. Do Energy Conservation Strategies Limit the Freedom of Architecture Design? A Case Study of Minsheng Community, Taipei, Taiwan. Sustainability 2019, 11, 2003. [Google Scholar] [CrossRef]
  64. Saber, E.M.; Chaer, I.; Gillich, A.; Ekpeti, B.G. Review of Intelligent Control Systems for Natural Ventilation as Passive Cooling Strategy for UK Buildings and Similar Climatic Conditions. Energies 2021, 14, 4388. [Google Scholar] [CrossRef]
  65. Xie, H.Y.; Li, Y.; Liu, Y.; Zhong, P.; Liu, H.; Li, C.; Xie, E. The transformation of microclimate adaption in public spaces by smart ventilation approach: A case study of Eastern Banlieue memory industrial Park, China. J. Asian Archit. Build. Eng. 2023, 22, 3732–3758. [Google Scholar] [CrossRef]
  66. Autodesk Forma: Get More Done in the Design Phase. Available online: https://www.autodesk.com/products/forma/overview (accessed on 22 May 2025).
  67. Rustiadi, E.; Pravitasari, A.E.; Setiawan, Y.; Mulya, S.P.; Pribadi, D.O.; Tsutsumida, N. Impact of continuous Jakarta megacity urban expansion on the formation of the Jakarta-Bandung conurbation over the rice farm regions. Cities 2021, 111, 103000. [Google Scholar] [CrossRef]
  68. Putra, C.D.; Ramadhani, A.; Fatimah, E. Increasing Urban Heat Island area in Jakarta and it’s relation to land use changes. In Proceedings of the 5th International Seminar on Sustainable Urban Development, Jakarta, Indonesia, 5 August 2020. [Google Scholar] [CrossRef]
  69. Takkanon, P. Urban Geometry Design Guidelines for Heat Mitigation and Airflow in Bangkok. In Proceedings of the Passive Low Energy Architecture (PLEA), Edinburgh, UK, 2–5 July 2017. [Google Scholar]
  70. Gagliano, A.; Nocera, F.; Aneli, S. Computational Fluid Dynamics Analysis for Evaluating the Urban Heat Island Effects. Energy Procedia 2017, 134, 508–517. [Google Scholar] [CrossRef]
  71. Kouhirostami, M.; Abukhalaf, A.H.I.; Kouhirostami, M. Eliminating Air Pollution in Cities Through Sustainable Urban Planning. Acad. Lett. 2022, 4588. [Google Scholar] [CrossRef]
  72. DKI Jakarta Weather Data. Available online: https://www.bmkg.go.id/cuaca/prakiraan-cuaca.bmkg?Kota=Semarang&AreaID=501262&Prov=35 (accessed on 25 October 2023).
  73. Sari, D.P.; Sumarno, A.; Prasetyo, A.M.; Ngeljaratan, L.N.; Maidina. Modern Home Design Adapted from Traditional Javanese Homes. Dir. Gen. Intellect. Prop. 2024, EC00202411821. (In Bahasa) [Google Scholar]
  74. No.32/PERMEN/M/2006 About Technical Instructions for Ready-to-Build Areas and Stand-Alone Environments. Available online: https://jdih.pu.go.id/internal/assets/assets/produk/PermenPUPR/2006/12/PermenPU32-2006.pdf (accessed on 1 February 2025). (In Bahasa).
  75. Hidayat, R.; Subardjo, P.; Ismanto, A. Sea Surface Temperature Variability in the North Coast of Semarang Using Aqua Modis Satellite Imagery. J. Oseanografi 2014, 3, 164–173. Available online: https://ejournal3.undip.ac.id/index.php/joce/article/view/7679 (accessed on 7 February 2025). (In Bahasa).
  76. Bramiana, C.N.; Aminuddin, A.M.R.; Ismail, M.A.; Widiastuti, R.; Pramesti, P.U. The Effect of Window Placement on Natural Ventilation Capability in a Jakarta High-Rise Building Unit. Buildings 2023, 13, 1141. [Google Scholar] [CrossRef]
  77. Hariyanto, F.; Indradjati, P.N.; Chikamoto, T. CFD Approach on Analtzing Temperature Distribution in Urban Area. Available online: https://digilib.itb.ac.id/assets/files/2019/MjAxOSBUUyBQUCBGUklTQ0FST05BIEhBUklZQU5UT19KVVJOQUwucGRm.pdf (accessed on 5 October 2025).
  78. Sari, D.P. Measurement of the influence of roof pitch to increasing wind power density. Energy Procedia 2015, 65, 42–47. [Google Scholar] [CrossRef]
  79. Semarang City Government. Semarang City Regional Regulation (PERDA) Number 5 of 2021. Available online: https://peraturan.bpk.go.id/Details/175985/perda-kota-semarang-no-5-tahun-2021 (accessed on 5 October 2025). (In Bahasa)
  80. Jakarta Province Government. Jakarta Province Spatial and Regional Planning Plan Number 1 Year 2012. Available online: https://bappeda.jakarta.go.id/rtrw (accessed on 5 October 2025). (In Bahasa)
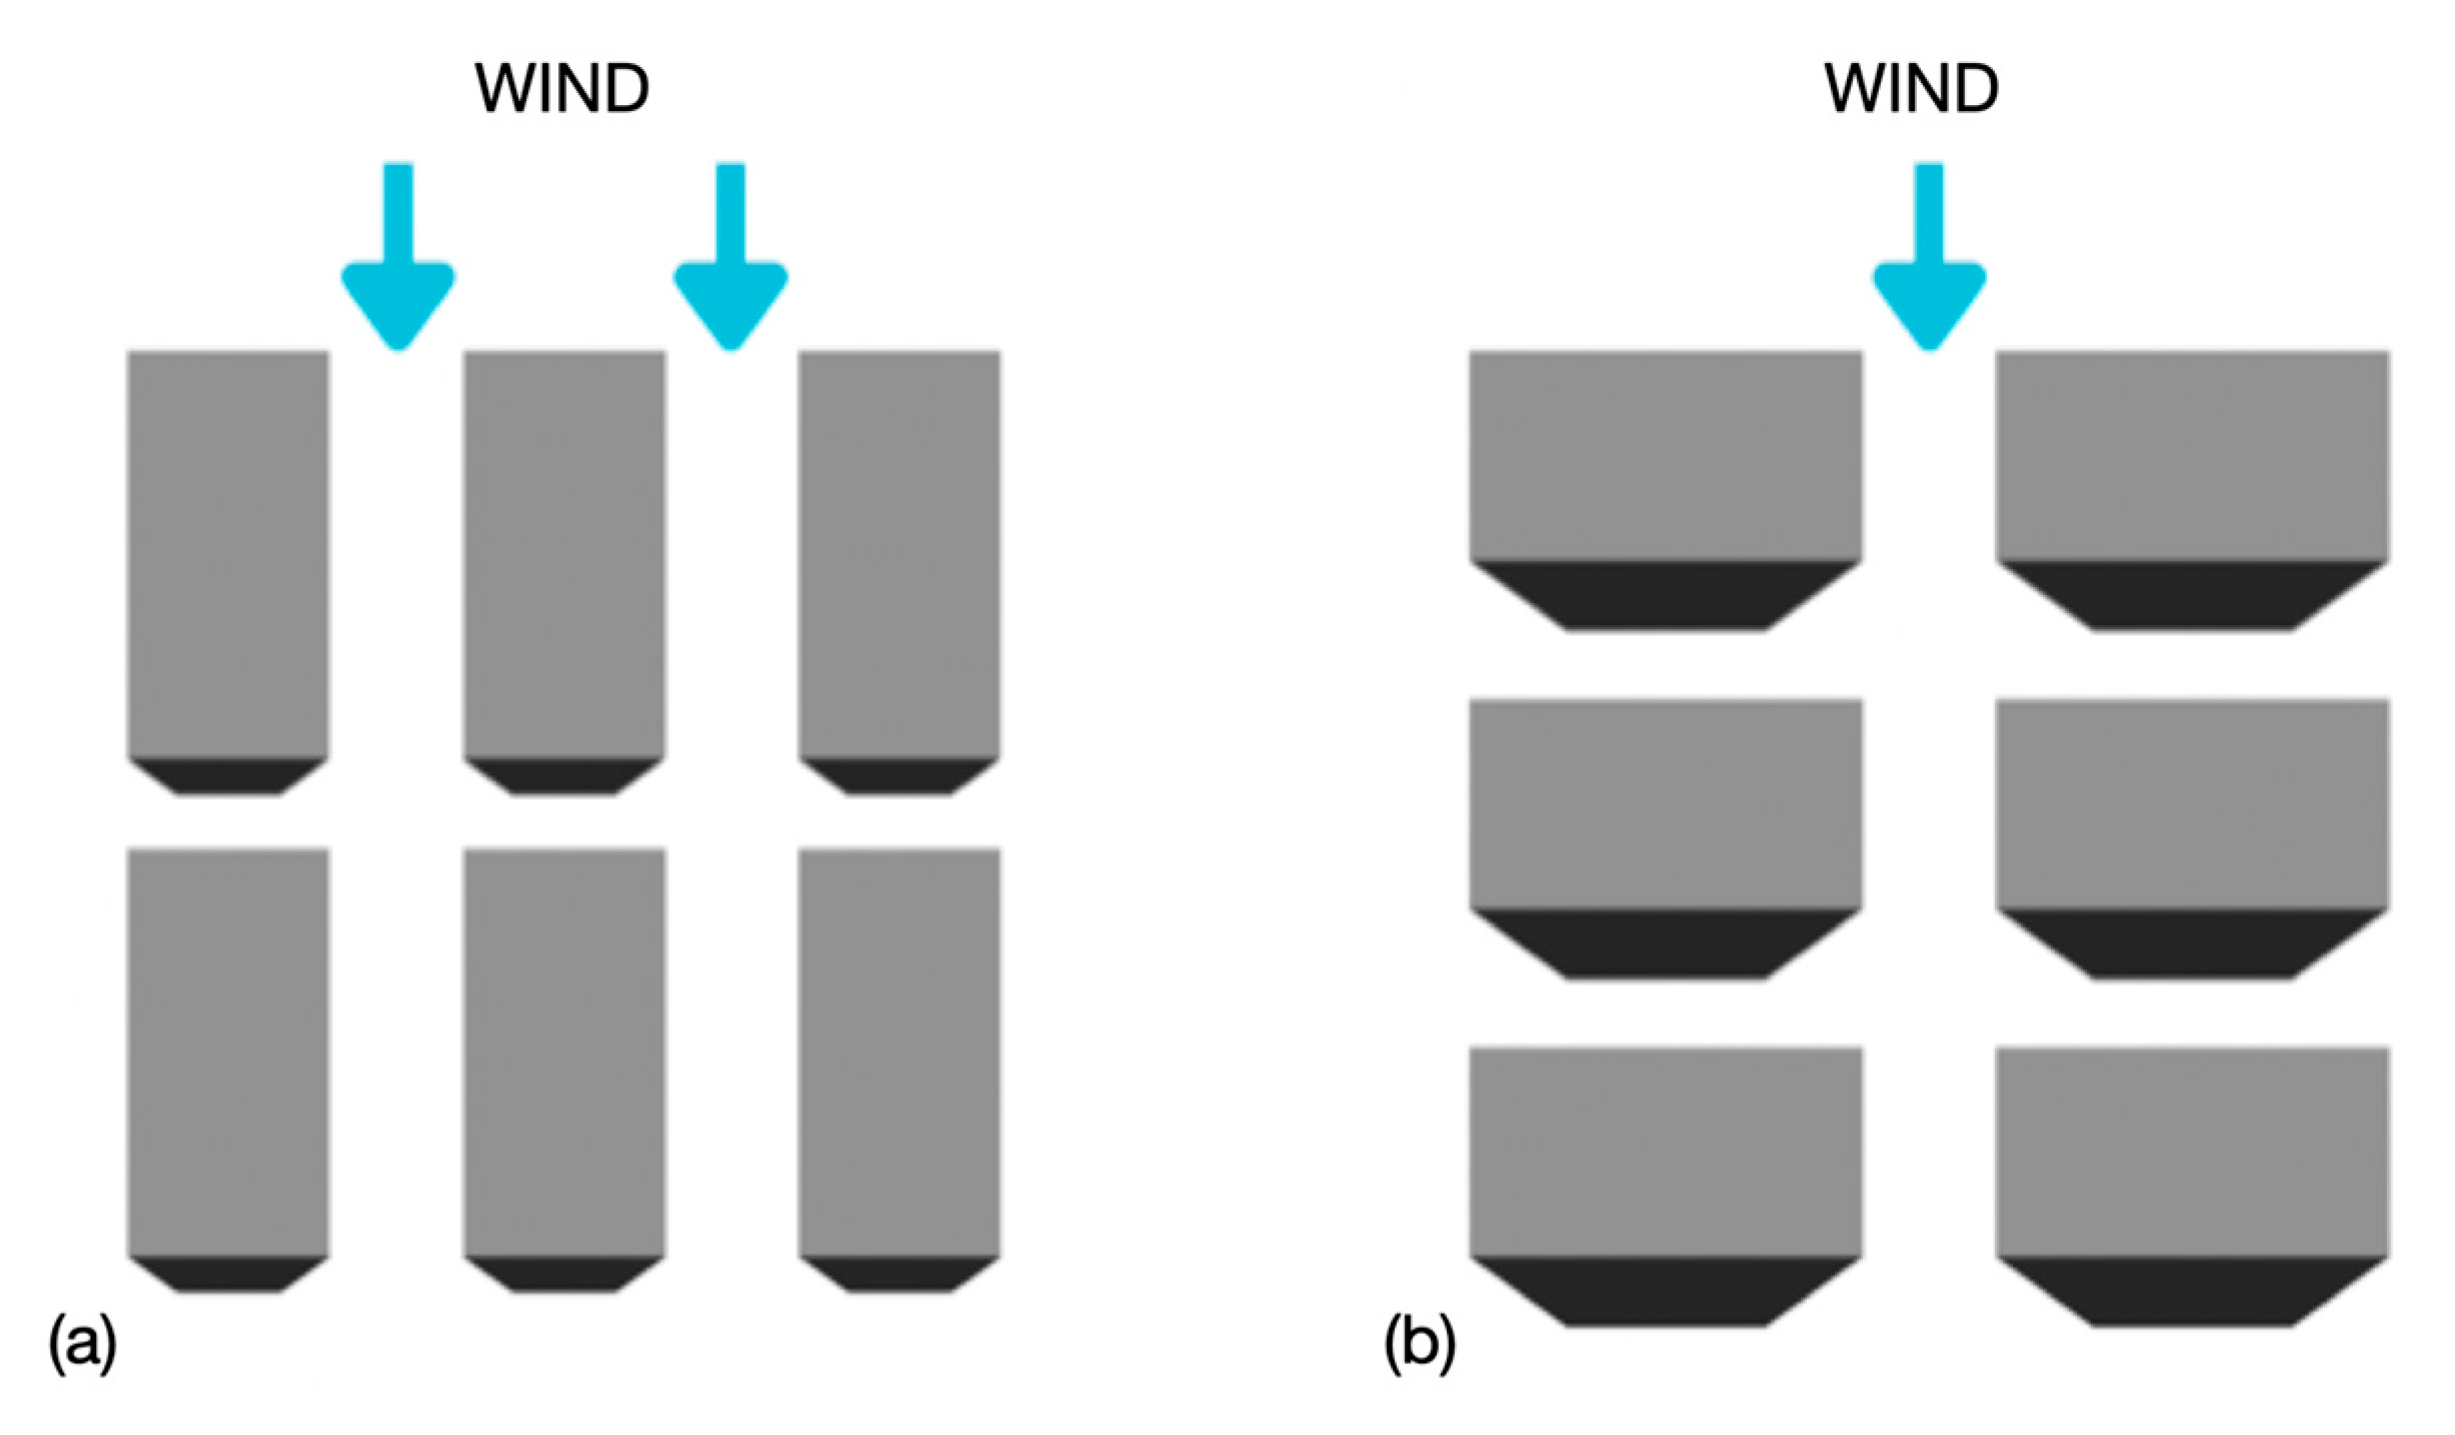
Figure 1. Orienting street grids according to prevailing winds (blue arrow). The street grid with the main streets aligned longitudinally creates a smaller stagnant air zone, as shown in dark gray (a), compared with that with the main streets aligned transversely (b).
Modelling 06 00129 g001
Figure 2. As an example strategy, widening minor roads that connect major thoroughfares, which serve as primary air routes (solid blue lines), may contribute to establishing a hierarchy of airways (dash blue lines).
Modelling 06 00129 g002
Figure 3. Natural elements, such as parks, street trees, and widespread vegetation, can effectively reduce the UHI effect and improve natural ventilation, as can be seen for instance in the following examples: (a) Simpang Lima Semarang, (b) Widya Puraya Park in Semarang, and (c) Fort Canning Park in Singapore.
Modelling 06 00129 g003
Figure 4. The blue spaces can reduce localized temperatures and increase thermal comfort by evaporation cooling, which is further enhanced by wind movement. An example of this can be found in the Singapore Botanic Garden’s pond (a), Diponegoro University’s water reservoir (b), and Semarang City’s water fountain (ce).
Modelling 06 00129 g004
Figure 5. Building façades with high solar exposure may be effectively designed with Vertical Greening Systems (VGS) for reducing heat gain and improving microclimate, as can be seen in the Singapore School of Arts (a) and Widya Puraya Building in Semarang (b).
Modelling 06 00129 g005
Figure 6. The corridor created between buildings in an urban area (a) maximizes air permeability, as represented by the solid blue line (which represents wind flow), and increases thermal comfort. In contrast to a closed block of buildings (b), in which wind cannot flow through the buildings.
Modelling 06 00129 g006
Figure 7. The open space at the ground floor of the CapitaSpring, Singapore maximizes air permeability while offering pedestrians shade.
Modelling 06 00129 g007
Figure 8. Providing urban areas with solar-powered breeze shelters with ceiling fans in Marina Bay Sands, Singapore.
Modelling 06 00129 g008
Figure 9. The site was analyzed using the weather data from Jakarta using DesignBuilder software.
Modelling 06 00129 g009
Figure 10. Models used in this study: (a) house layout, (b) 3D model of house created using DesignBuilder software, (c) zoning for CFD simulation.
Modelling 06 00129 g010
Figure 11. A residential model area was used in this study: (a) 12 houses were viewed using DesignBuilder software, and (b) detailed road sizes were drawn for each house. Every house is separated by 8.50 m. There is a total of 8.50 m including 7.50 m for the street and 1 m for pedestrians.
Modelling 06 00129 g011
Figure 12. A residential area with a 12-house (green color) grid distribution. A total of 170 cells are in X, 222 cells are in Y, and 10 cells are in Z (grey color).
Modelling 06 00129 g012
Figure 13. Simulation results of wind velocity based on CFD. Wind velocity was shown in gradation color in the legend. A high wind velocity was found at points 1, 2, 3, 4, 5, 14, and 23 on the road toward the southeast (3.17 m/s) before decreasing toward the northeast (2.38 m/s).
Modelling 06 00129 g013
Figure 14. The wind pressure and velocity from a CFD simulation: (a) viewed from the west, and (b) seen from the east. The north side (front) of the building has a wind velocity of approximately 4 m/s. The legend displayed wind velocity and wind pressure in gradation colors. The arrow indicated the direction of the wind.
Modelling 06 00129 g014
Figure 15. The following pictures show (a) the boundaries of the existing location, and (b) the site of the KAK boundaries and three mandatory existing buildings on the Universitas Diponegoro Pleburan Campus in the colors green (the twin towers) and blue (Imam Barjo Auditorium).
Modelling 06 00129 g015
Figure 16. A wind rose (a) shows the distribution of wind speed and direction over a specified period at a specific point (30 degrees). Easterly wind (a) as the most prominent wind in the vicinity of the masterplan. As shown in (b), wind velocity was also used as input data in the simulation software. Average wind speeds are indicated by grey lines, while peak wind speeds are indicated by blue lines.
Modelling 06 00129 g016
Figure 17. (a) Side view of an urban ventilation strategy used in a university area. There is also a simplified high-rise building (b) and the Masterplan configuration (c), which has been marked in yellow as the main corridors and orange as the minor corridors.
Modelling 06 00129 g017
Figure 18. Simulation of the existing masterplan configuration in top and isometric views, with wind vortices displayed at heights of 1 m (a), 2 m (b), and 3 m (c).
Modelling 06 00129 g018
Figure 19. As shown in (a) the current masterplan and (b) a redesign of the masterplan based on a list of strategies for urban ventilation corridors, wind speeds were increased. Color degradation indicated a difference in wind velocity.
Modelling 06 00129 g019
Figure 20. Design of the area and simulation of the configuration with urban ventilation design strategies, with wind vortices displayed at heights of 1 m (a), 2 m (b), and 3 m (c).
Modelling 06 00129 g020
Table 1. Four points were located across the model to record wind speed (at ground level) in both the baseline and proposed scenario.
PointBaseline DesignRevised Design
14.57.3
23.87
32.35.5
43.68.1
Average3.65.2
Disclaimer/Publisher’s Note: The statements, opinions and data contained in all publications are solely those of the individual author(s) and contributor(s) and not of MDPI and/or the editor(s). MDPI and/or the editor(s) disclaim responsibility for any injury to people or property resulting from any ideas, methods, instructions or products referred to in the content.