Abstract
Graphite nodularity is a key indicator for evaluating the microstructure quality of ductile iron and plays a crucial role in ensuring product quality and enhancing manufacturing efficiency. Existing research often only focuses on a single type of feature and fails to utilize multi-source information in a coordinated manner. Single-feature methods are difficult to comprehensively capture microstructures, which limits the accuracy and robustness of the model. This study proposes a hybrid estimation model for the graphite nodularity of ductile cast iron based on multi-source feature extraction. A comprehensive feature engineering pipeline was established, incorporating geometric, color, and texture features extracted via Hue-Saturation-Value color space (HSV) histograms, gray level co-occurrence matrix (GLCM), Local Binary Pattern (LBP), and multi-scale Gabor filters. Dimensionality reduction was performed using Principal Component Analysis (PCA) to mitigate redundancy. An improved watershed algorithm combined with intelligent filtering was used for accurate particle segmentation. Several machine learning algorithms, including Support Vector Regression (SVR), Multi-Layer Perceptron (MLP), Random Forest (RF), Gradient Boosting Regressor (GBR), eXtreme Gradient Boosting (XGBoost) and Categorical Boosting (CatBoost), are applied to estimate graphite nodularity based on geometric features (GFs) and feature extraction. Experimental results demonstrate that the CatBoost model trained on fused features achieves high estimation accuracy and stability for geometric parameters, with R-squared (R2) exceeding 0.98. Furthermore, introducing geometric features into the fusion set enhances model generalization and suppresses overfitting. This framework offers an efficient and robust approach for intelligent analysis of metallographic images and provides valuable support for automated quality assessment in casting production.
1. Introduction
Ductile cast iron, a type of engineering material combining high strength, excellent ductility, and good castability, is widely applied in numerous industrial sectors such as automotive, machinery, metallurgy, pipeline transport, rail transit, and energy equipment [,,]. Studies on ductile iron microstructures have demonstrated that changes in graphite form and distribution can substantially alter fatigue and fracture performance, making graphite morphology a decisive microstructural parameter for engineering applications [,]. According to international and industrial standards (e.g., ISO/TR 945-2 [], ASTM A247-16a [], GB/T 9441-2021 []), the importance of graphite form has been clearly established, further emphasizing that graphite morphology and derived indices such as the graphite nodularity serve as the principal descriptors used in quality control and acceptance criteria for cast irons []. In line with these standards, a roundness value of 0.6 is commonly adopted as the threshold to distinguish well-spheroidized graphite particles from irregular or vermicular forms, since particles with roundness below this level exhibit non-ideal morphologies that significantly degrade mechanical performance, whereas those above 0.6 contribute positively to ductility and toughness []. In contrast to the matrix phases, such as ferrite and pearlite, whose volume fractions and mechanical properties can typically be adjusted after solidification through alloying and heat treatment, the morphology of graphite is primarily determined during solidification and is therefore much more difficult to correct once casting is completed []. Moreover, the occurrence of vermicular or chunky graphite frequently leads to crack initiation and results in a marked reduction in both fatigue strength and toughness []. Therefore, the graphite nodularity, calculated as the proportion of spheroidal graphite particles relative to the total number of graphite particles, is widely recognized as a key parameter for evaluating the quality of ductile iron microstructures and correlating them with mechanical properties [,,]. This makes image-based quantitative analysis of graphite nodularity essential for effective quality control [].
Traditionally, graphite nodularity evaluation has primarily relied on visual inspection and conventional metallographic techniques []. While straightforward and intuitive, this method is highly subjective, with low efficiency and poor repeatability, making it difficult to meet modern manufacturing demands for precision and automation [,]. In recent years, automated analysis of metallographic structures has become a growing research focus. With the development of image processing technologies, machine learning, and artificial intelligence, an increasing number of studies have begun to apply image recognition methods for metallographic analysis [,,,,,]. Common approaches, such as GLCM [], LBP [], and Gabor filters [], have made significant progress in the segmentation and identification of graphite morphology in ductile cast iron. At the same time, deep learning methods have demonstrated outstanding performance in classification and detection [,,]. Durmaz et al. proposed and validated a deep learning-based method for semantic segmentation and quality control of complex microstructures in steel. By training the U-Net architecture, they achieved automated identification and segmentation of lath martensite and bainite phases []. Thomas et al. applied GNNs to microstructural representations for the estimation of material fatigue performance []. Johannes et al. employed Mask R-CNN to automatically segment the fracture surfaces of ductile cast iron and measure initial crack sizes, thereby enabling the quantitative analysis of fracture behavior []. Wilk-Kołodziejczyk et al. developed a defect detection model for ductile cast iron based on CT images, enabling the identification of graphite precipitates and casting defects []. Schmies et al. used deep neural networks for the automated and quantitative analysis of fracture mechanisms in SEM images of various materials [,]. M. Bárcena et al. employed CNNs to classify ductile cast iron alloys, utilizing architectures such as MobileNet to enhance classification accuracy []. However, their studies largely rely on the large, well-annotated datasets, which are costly and time-consuming to obtain in real-world industrial scenarios [,]. In addition, the interpretability of deep learning models is often limited, and they are prone to overfitting, which reduces their robustness and generalization capability when applied to microstructures with varying conditions [].
Existing studies tend to focus on single types of features, such as geometric or texture features alone, without leveraging multi-source information in a coordinated manner []. Given the complex morphological variations in graphite particles, which exhibit different spatial and textural characteristics at different scales, single-feature approaches struggle to comprehensively capture the microstructure, limiting model accuracy and robustness. Thus, the establishment of a multi-source feature representation framework combined with an efficient machine learning model has emerged as a promising solution.
This study establishes a novel multi-source feature fusion framework based on the CatBoost algorithm to accurately estimate the graphite nodularity of ductile cast iron. First, a multi-source feature extraction framework is adopted, in which geometric, color, and texture features are integrated to overcome the limitations of single-feature approaches. Second, an improved watershed algorithm combined with an intelligent filtering strategy is employed to achieve efficient particle segmentation and enhance the accuracy of image recognition. Compared with conventional single-feature methods, the proposed approach provides a more comprehensive characterization of graphite particle morphology, thereby improving both the accuracy and robustness of the estimative model.
2. Materials and Methods
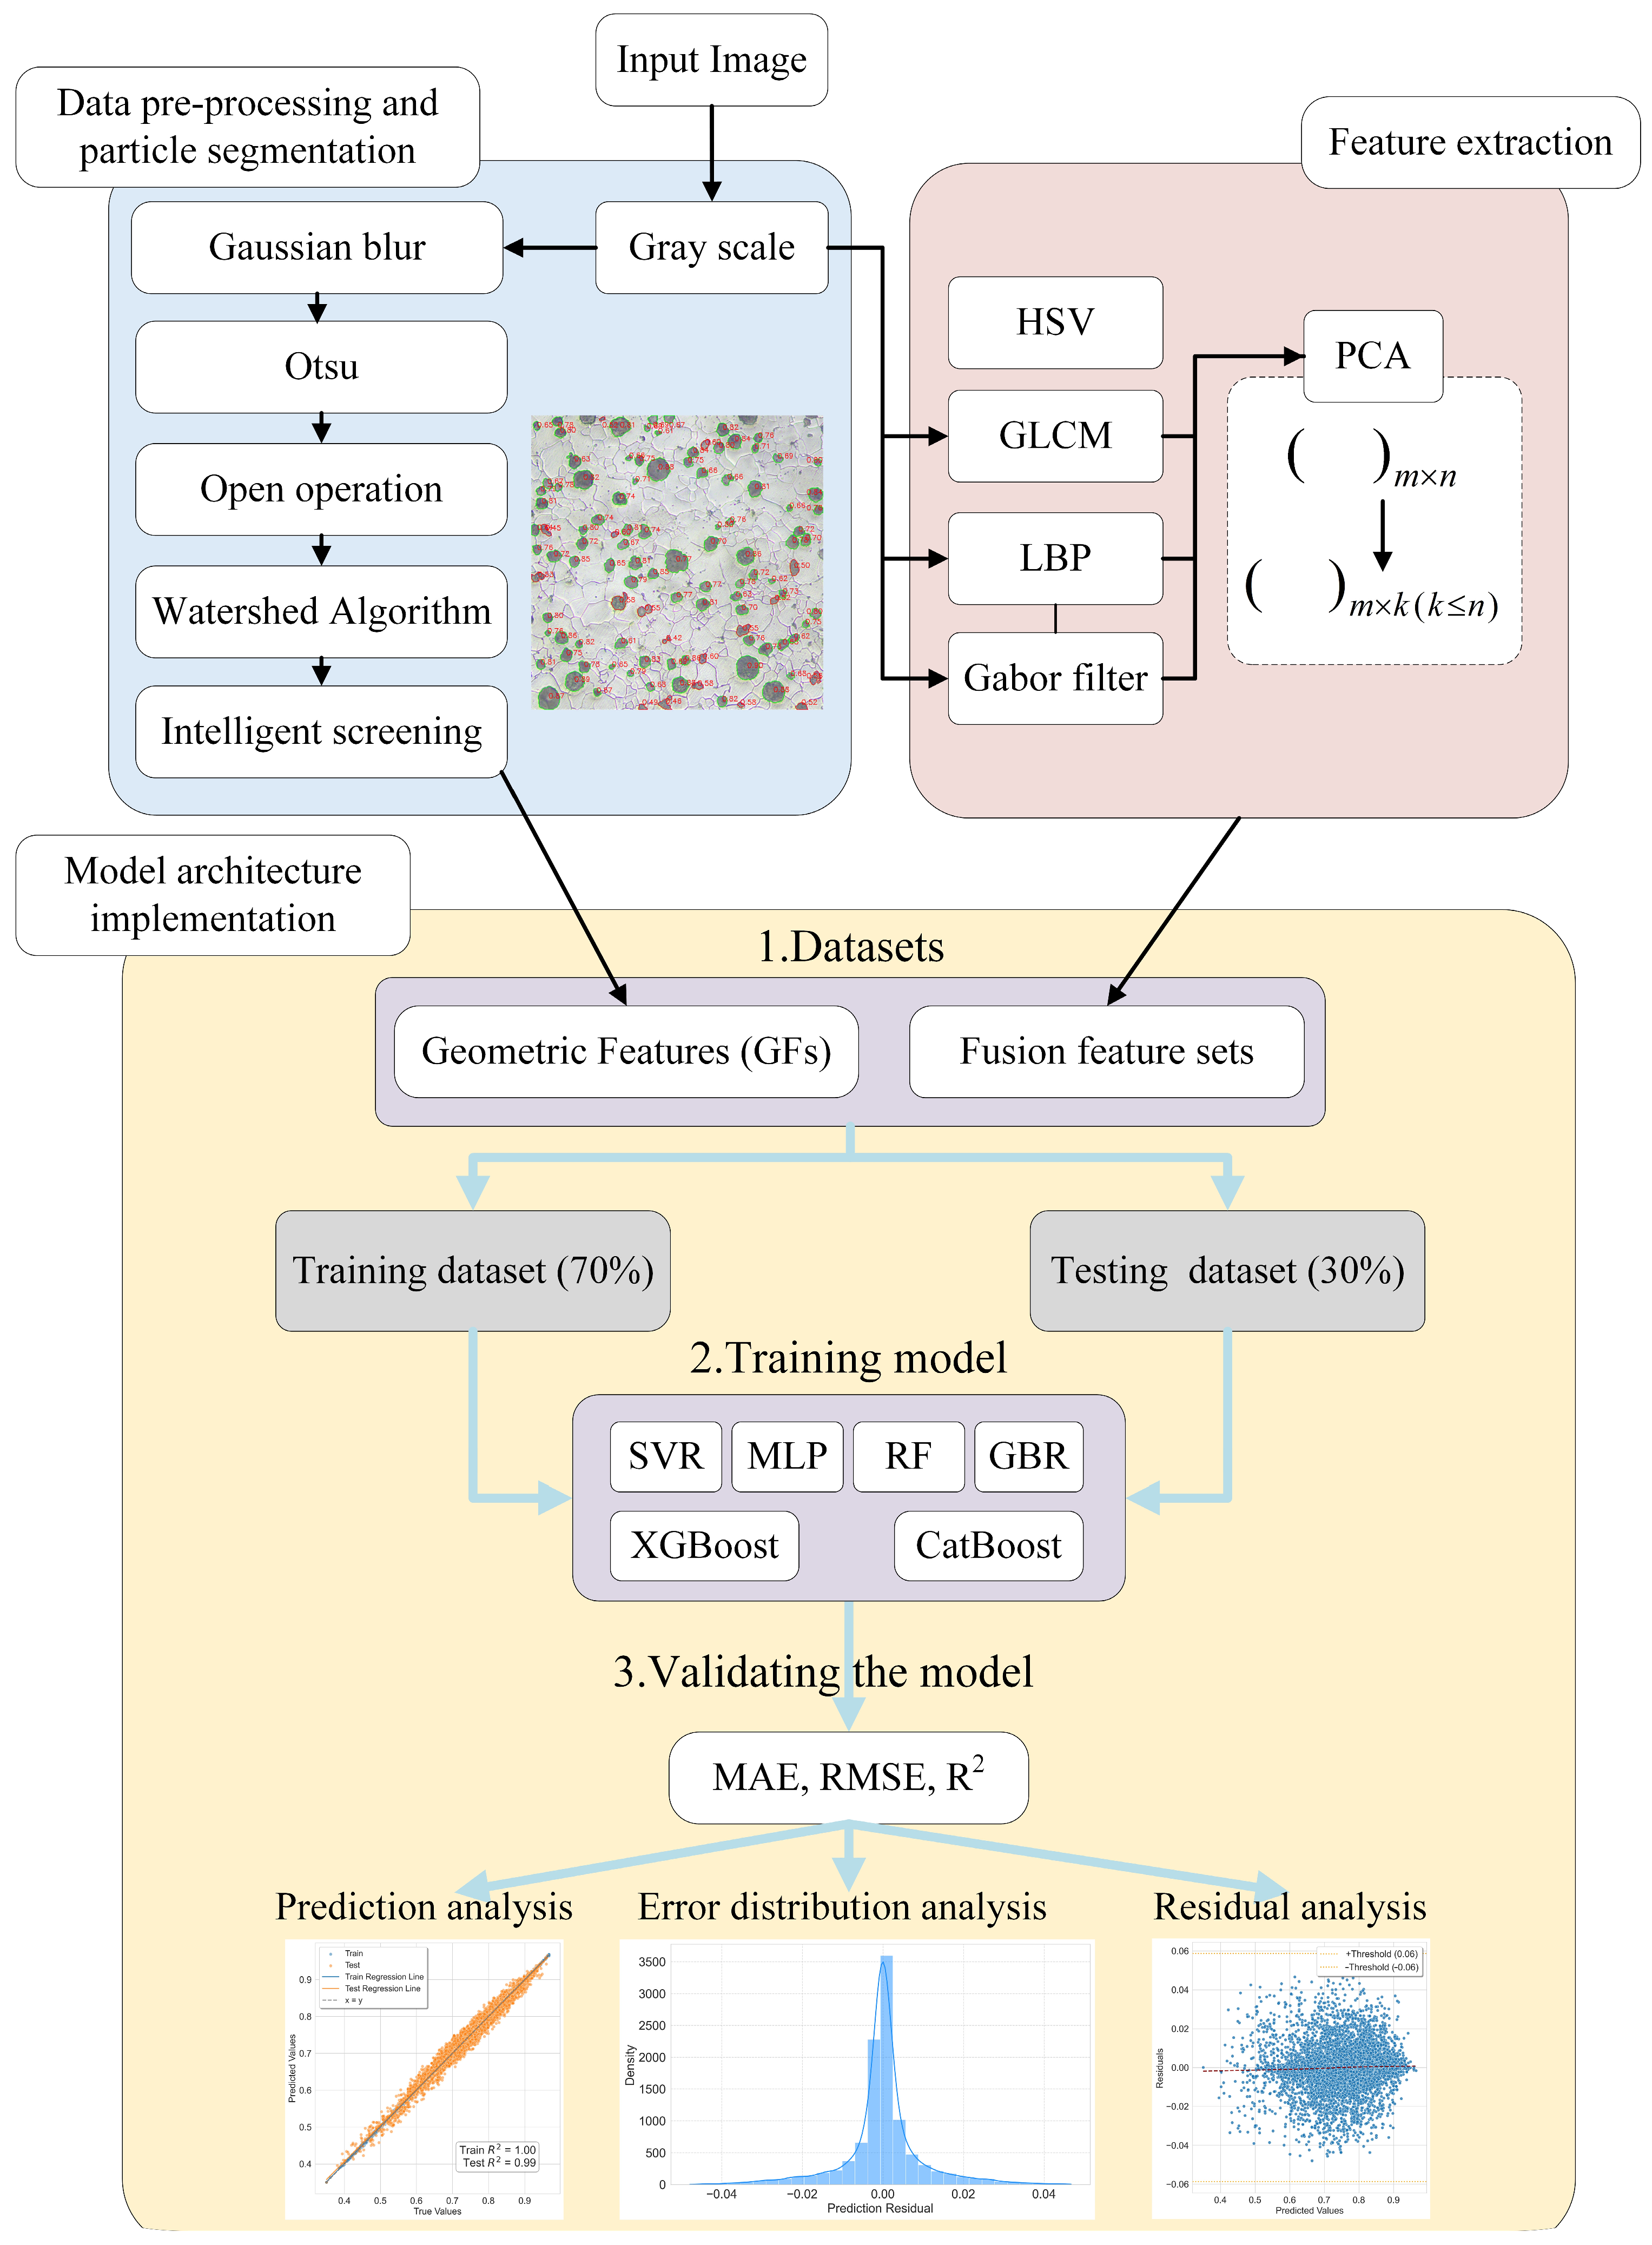
Our methodology is divided into three core stages. The first stage focuses on image preprocessing and particle segmentation: grayscale conversion, Gaussian filtering for noise reduction, and adaptive thresholding via Otsu’s method are applied to create a binarized image. Morphological opening operations are used to remove minor noise artifacts, and a watershed algorithm based on distance transformation addresses particle adhesion. An intelligent filtering mechanism is also integrated to exclude edge-cut particles, effectively accounting for the dense distribution commonly seen in ductile iron images. The second stage involves feature extraction. Through contour analysis, nine types of GFs are extracted, such as Feret diameter and particle count, with some computed via convex hull methods. To deepen feature representation, HSV color space transformation is used to quantify chromatic attributes of graphite particles. Additionally, GLCM is used to capture texture uniformity, LBP to describe local contrast in micro-textures, and multi-scale Gabor filters to extract orientation-sensitive frequency features. These features effectively represent interfacial properties between graphite and the metallic matrix. To mitigate the high dimensionality of the fused feature set, PCA is employed for dimensionality reduction. The third stage entails model development and evaluation. The dimension-reduced feature vectors are used as inputs to six regression models to learn nonlinear mappings to geometric features. A 10-fold cross-validation strategy is applied during training, with the dataset split into training and test sets. Estimation accuracy is assessed through quantitative metrics and regression plots comparing estimated and actual values to validate model generalizability. Ultimately, a structure estimation model based on multi-source feature fusion is established. The overall architecture of the GFs fusion estimation model is illustrated in Figure 1.

Figure 1.
Schematic diagram of the overall architecture of the GFs fusion feature estimation model.
All experiments were conducted using Python 3.9 as the main programming environment. The OpenCV (version 4.8.1) library was employed for image preprocessing and feature extraction, while NumPy (version 1.23.5), SciPy (version 1.10.1), and Matplotlib (version 3.7.1) were used for numerical computation and data visualization. Machine learning models were implemented with scikit-learn (version 1.4.2), and deep learning frameworks such as TensorFlow 2.0 and Keras (version 3.4.1) were used for network training and evaluation. All computations were performed on a workstation running Windows 10 (64-bit), equipped with an Intel Core i5 CPU, 16 GB RAM, and an NVIDIA RTX 2080Ti GPU, ensuring stable and reproducible performance.
2.1. Image Pre-Processing
In this study, a total of 12 ductile iron samples from four different batches produced by three manufacturers were used. The samples were ground, polished, and then etched in 5% nital for 10 s prior to microscopic observation and image acquisition. The original ductile iron images were obtained in PNG format with a resolution of 3840 × 2160 pixels. After cropping, a total of 35,071 images were obtained. During data processing, data augmentation techniques were applied, including random rotation and adjustments to brightness, contrast, and color temperature for each image.
2.2. Graphite Particle Extraction
The original metallographic images were first converted to grayscale and smoothed using a Gaussian filter to reduce imaging noise. Adaptive thresholding based on Otsu’s method was then applied to obtain a binary image, followed by morphological opening to remove small noise and voids. Distance transform was performed on the binary image, and local maxima were detected. Marker-based watershed segmentation was subsequently applied to separate individual particles and extract their contours.
To avoid bias from particles truncated at image boundaries, a filtering method based on contour–edge contact area was implemented. Let the image dimensions be , and the binary mask of the contour region be . After erosion, the mask becomes , and the edge region mask is defined as:
The contact area between the contour and the image boundary is calculated as:
To ensure adaptability to different resolutions or magnification levels, a dynamic threshold is applied. Particles are excluded only if . This adaptive design reduces the need for manual tuning and ensures consistent filtering across varied imaging conditions.
After particle segmentation and edge-contact filtering, each valid graphite particle was represented by its contour, which served as the basis for geometric feature extraction. All geometric features were derived using contour and ellipse operations implemented in OpenCV, in combination with distance calculations performed in SciPy. For each valid particle, the roundness was calculated, from which the overall graphite nodularity was subsequently determined.
The roundness and graphite nodularity of graphite particles are calculated according to Equations (5) and (6).
2.3. Multi-Feature Extraction Methods
To comprehensively characterize the microstructural features of ductile cast iron images, four categories of methods were employed: HSV color, GLCM, LBP, and Gabor features.
First, color information was incorporated by converting the original images from the RGB space into the HSV space. Each RGB image is converted to HSV space, where normalized R, G, and B values are used to compute H, S, and V components via standard formulas. HSV histograms capture chromatic characteristics of graphite particles and are used as six-dimensional features.
Second, GLCM were computed with quantization levels , pixel distances , and orientations . From these configurations, six texture descriptors—contrast, dissimilarity, correlation, energy, homogeneity, and entropy—were extracted, resulting in a 480-dimensional feature set. While these descriptors provide a statistical quantification of spatial gray-level dependencies, their high dimensionality may cause redundancy and overfitting. Therefore, PCA was employed to retain the main informative components.
Third, LBP operators with parameter configurations were used to capture local micro-texture patterns. The corresponding histograms yielded a 54-dimensional feature vector. Since such high-dimensional histograms can increase computational complexity, dimensionality reduction was again performed to improve efficiency and robustness.
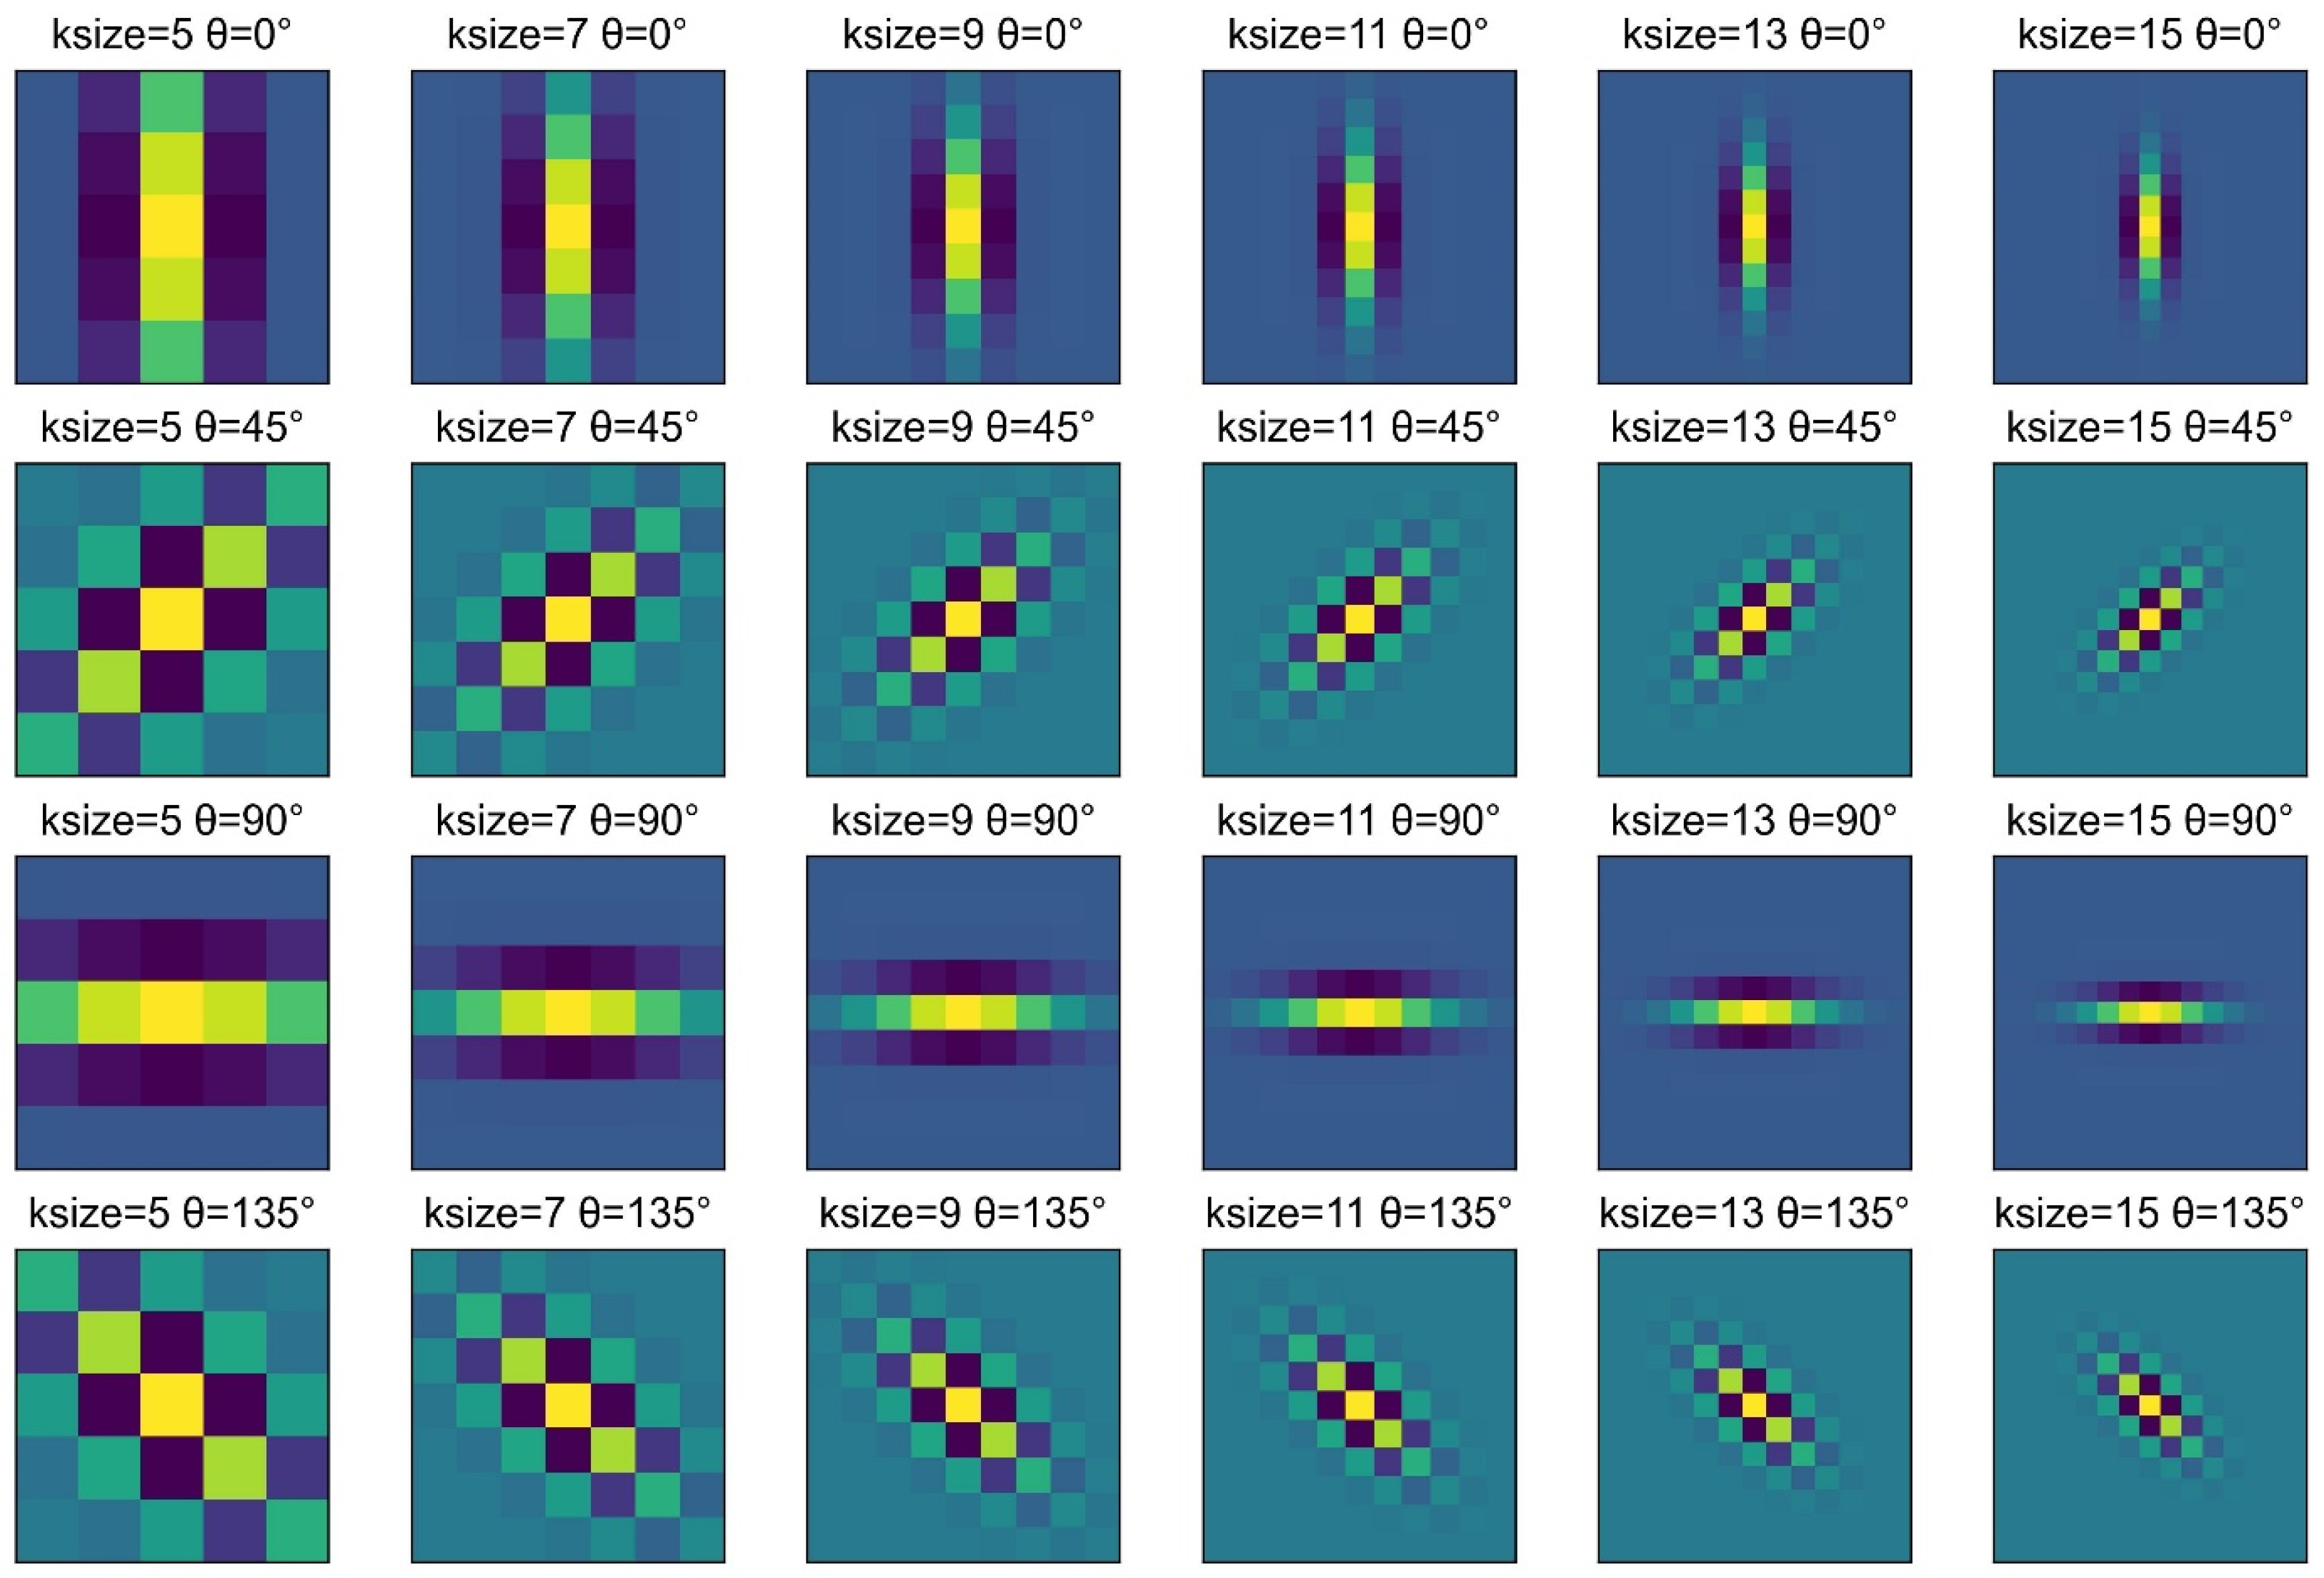
Finally, Gabor filters were applied at four orientations and six scales to capture multi-scale spatial-frequency information. For each filter response, five representative statistical descriptors—mean, variance, standard deviation, energy, and entropy—were computed, producing a 120-dimensional feature set per image. PCA was further employed to reduce redundancy and mitigate the risk of overfitting. As shown in Figure 2, Gabor filters are illustrated at multiple orientations and scales to represent different texture characteristics.

Figure 2.
Gabor filters in different orientations and sizes.
2.4. CatBoost Model
CatBoost is a machine learning model based on gradient boosting decision trees []. This model can achieve high accuracy and generalization ability, efficiently and effectively handling categorical features, gradient bias, and estimation shift problems, significantly reducing the probability of overfitting []. The objective function of the CatBoost model at each iteration is as follows:
where is the strong learner obtained from the previous iteration, is the loss function, and denotes the expectation operator. is the weak learner, defined as follows:
Here, denotes the estimation value of the region, represents the disconnected part corresponding to the tree leaf, is the indicator function, and is the sample size.
3. Results
3.1. Particles Division Results
The watershed algorithm effectively separates overlapping objects by simulating the expansion of water flow. By applying a distance transform to a binary image, the background and object regions are converted into a distance map, which facilitates the identification of clearer watershed markers. Using these distances, local maxima are detected to extract potential object centers, which serve as seed points for the watershed algorithm. This approach ensures better handling of touching or overlapping object regions. Figure 3 illustrates the visualization of each step involved in the image preprocessing process.

Figure 3.
Visualization of each preprocessing step: (a) original image; (b) grayscale transformation; (c) Gaussian blur; (d) Otsu thresholding; (e) morphological opening; (f) improved watershed algorithm.
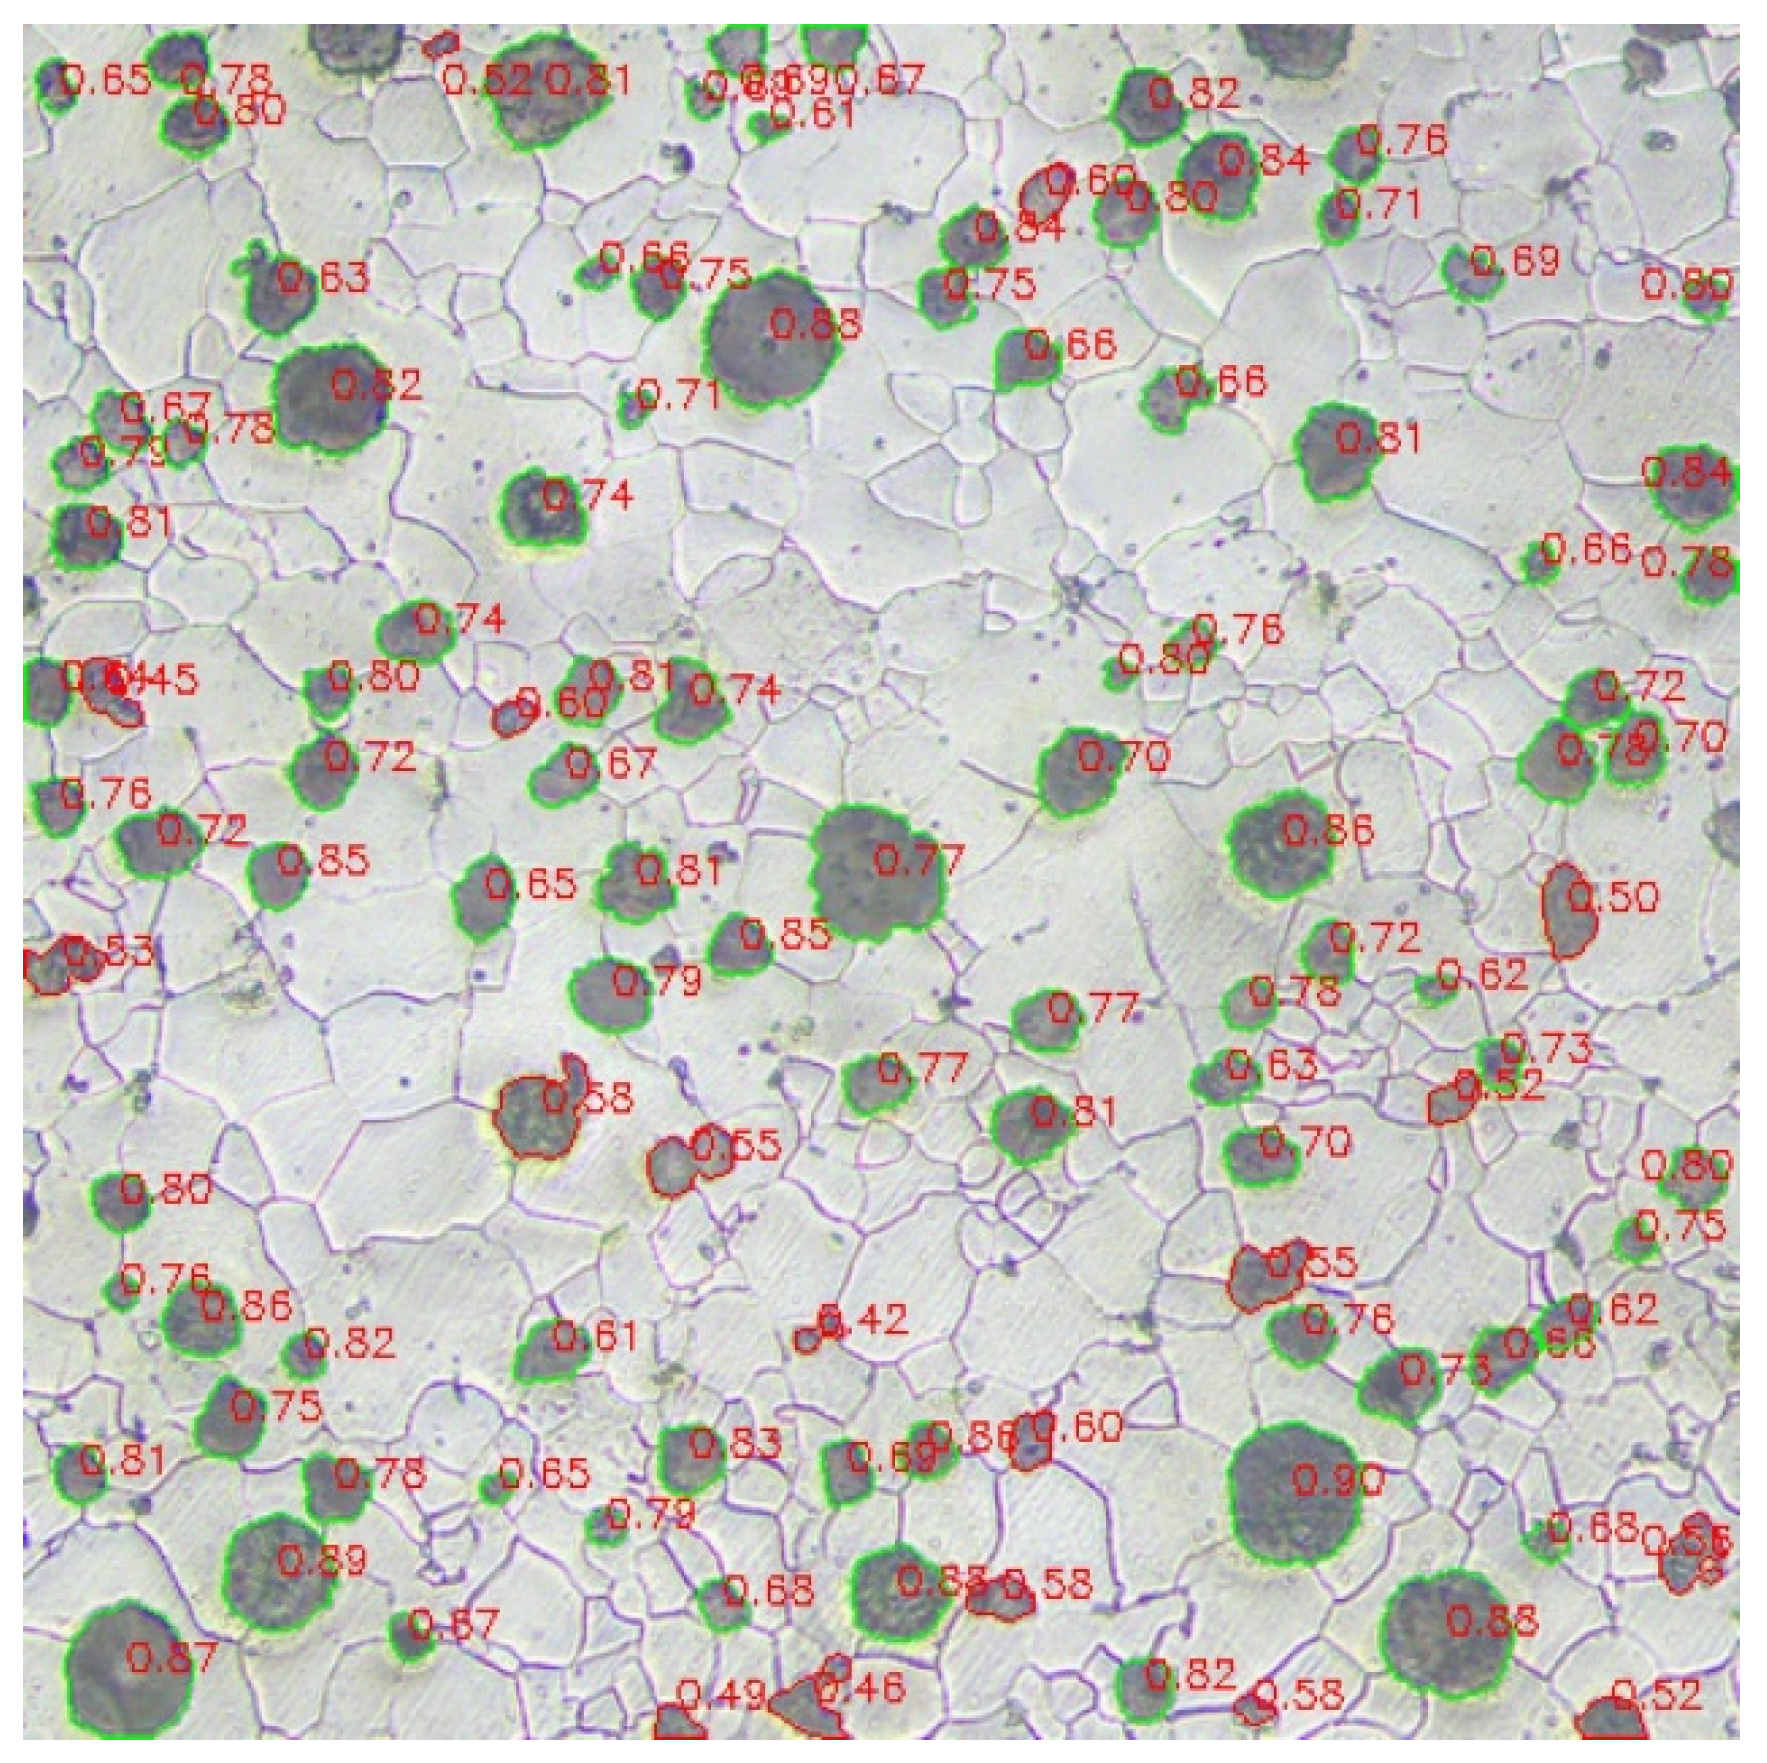
In the Graphite Particle Extraction results, particles that are overall cut off by the boundary are excluded, and the geometric information of the remaining valid particles is extracted. Feature parameters for each particle are then calculated. After extracting the particle features, particles are classified as qualified or not based on a roundness threshold of 0.6. Particles meeting the criteria are included in the qualified particle pool, and the average values of each feature are obtained for subsequent statistical analysis, such as total particle count, qualified particle count, graphite nodularity, average area, average Feret diameter, average roundness, average short-to-long axis ratio, average perimeter, and average nearest centroid distance—nine feature parameters in total. The segmentation results are shown in Figure 4, where the numbers represent the roundness of individual particles. The description of the extracted geometric feature dataset is presented in Table 1.

Figure 4.
Analysis results of graphite particle roundness in ductile iron: particles with green contours have a roundness greater than 0.6, while those with red contours have a roundness less than 0.6.

Table 1.
Description of geometrical feature parameters.
3.2. PCA Results
To optimize the comprehensiveness and robustness of feature representation, firstly, the texture information based on GLCM, the microstructure information of LBP, and the multi-scale directional responses of Gabor filters were each reduced to 18 dimensions via PCA, eliminating redundant information while retaining over 95% of the feature contribution. Subsequently, the three types of dimensionally reduced texture features were concatenated horizontally with 6-dimensional statistical histogram features from the HSV color space to construct a fused feature set with a total dimension of 60.
3.3. Comparative Analysis of GFs Estimation Results
The constructed fused feature set was used as input variables to estimate geometric feature parameters using six different machine learning models: SVR, MLP, RF, GBR, XGBoost, and CatBoost. The dataset was split into 70% training set and 30% test set, and model training employed a 10-fold cross-validation strategy. Table 2 presents the estimation evaluation results of the nine geometric features by each model. The results show that Random Forest, XGBoost, and CatBoost models all achieve determination coefficients of up to 0.9 for the geometric features, indicating a strong correlation between the fused feature set and these geometric features. Among them, CatBoost is the model with the highest estimation accuracy and the smallest error.

Table 2.
Estimation results of different geometric feature parameters under different models.
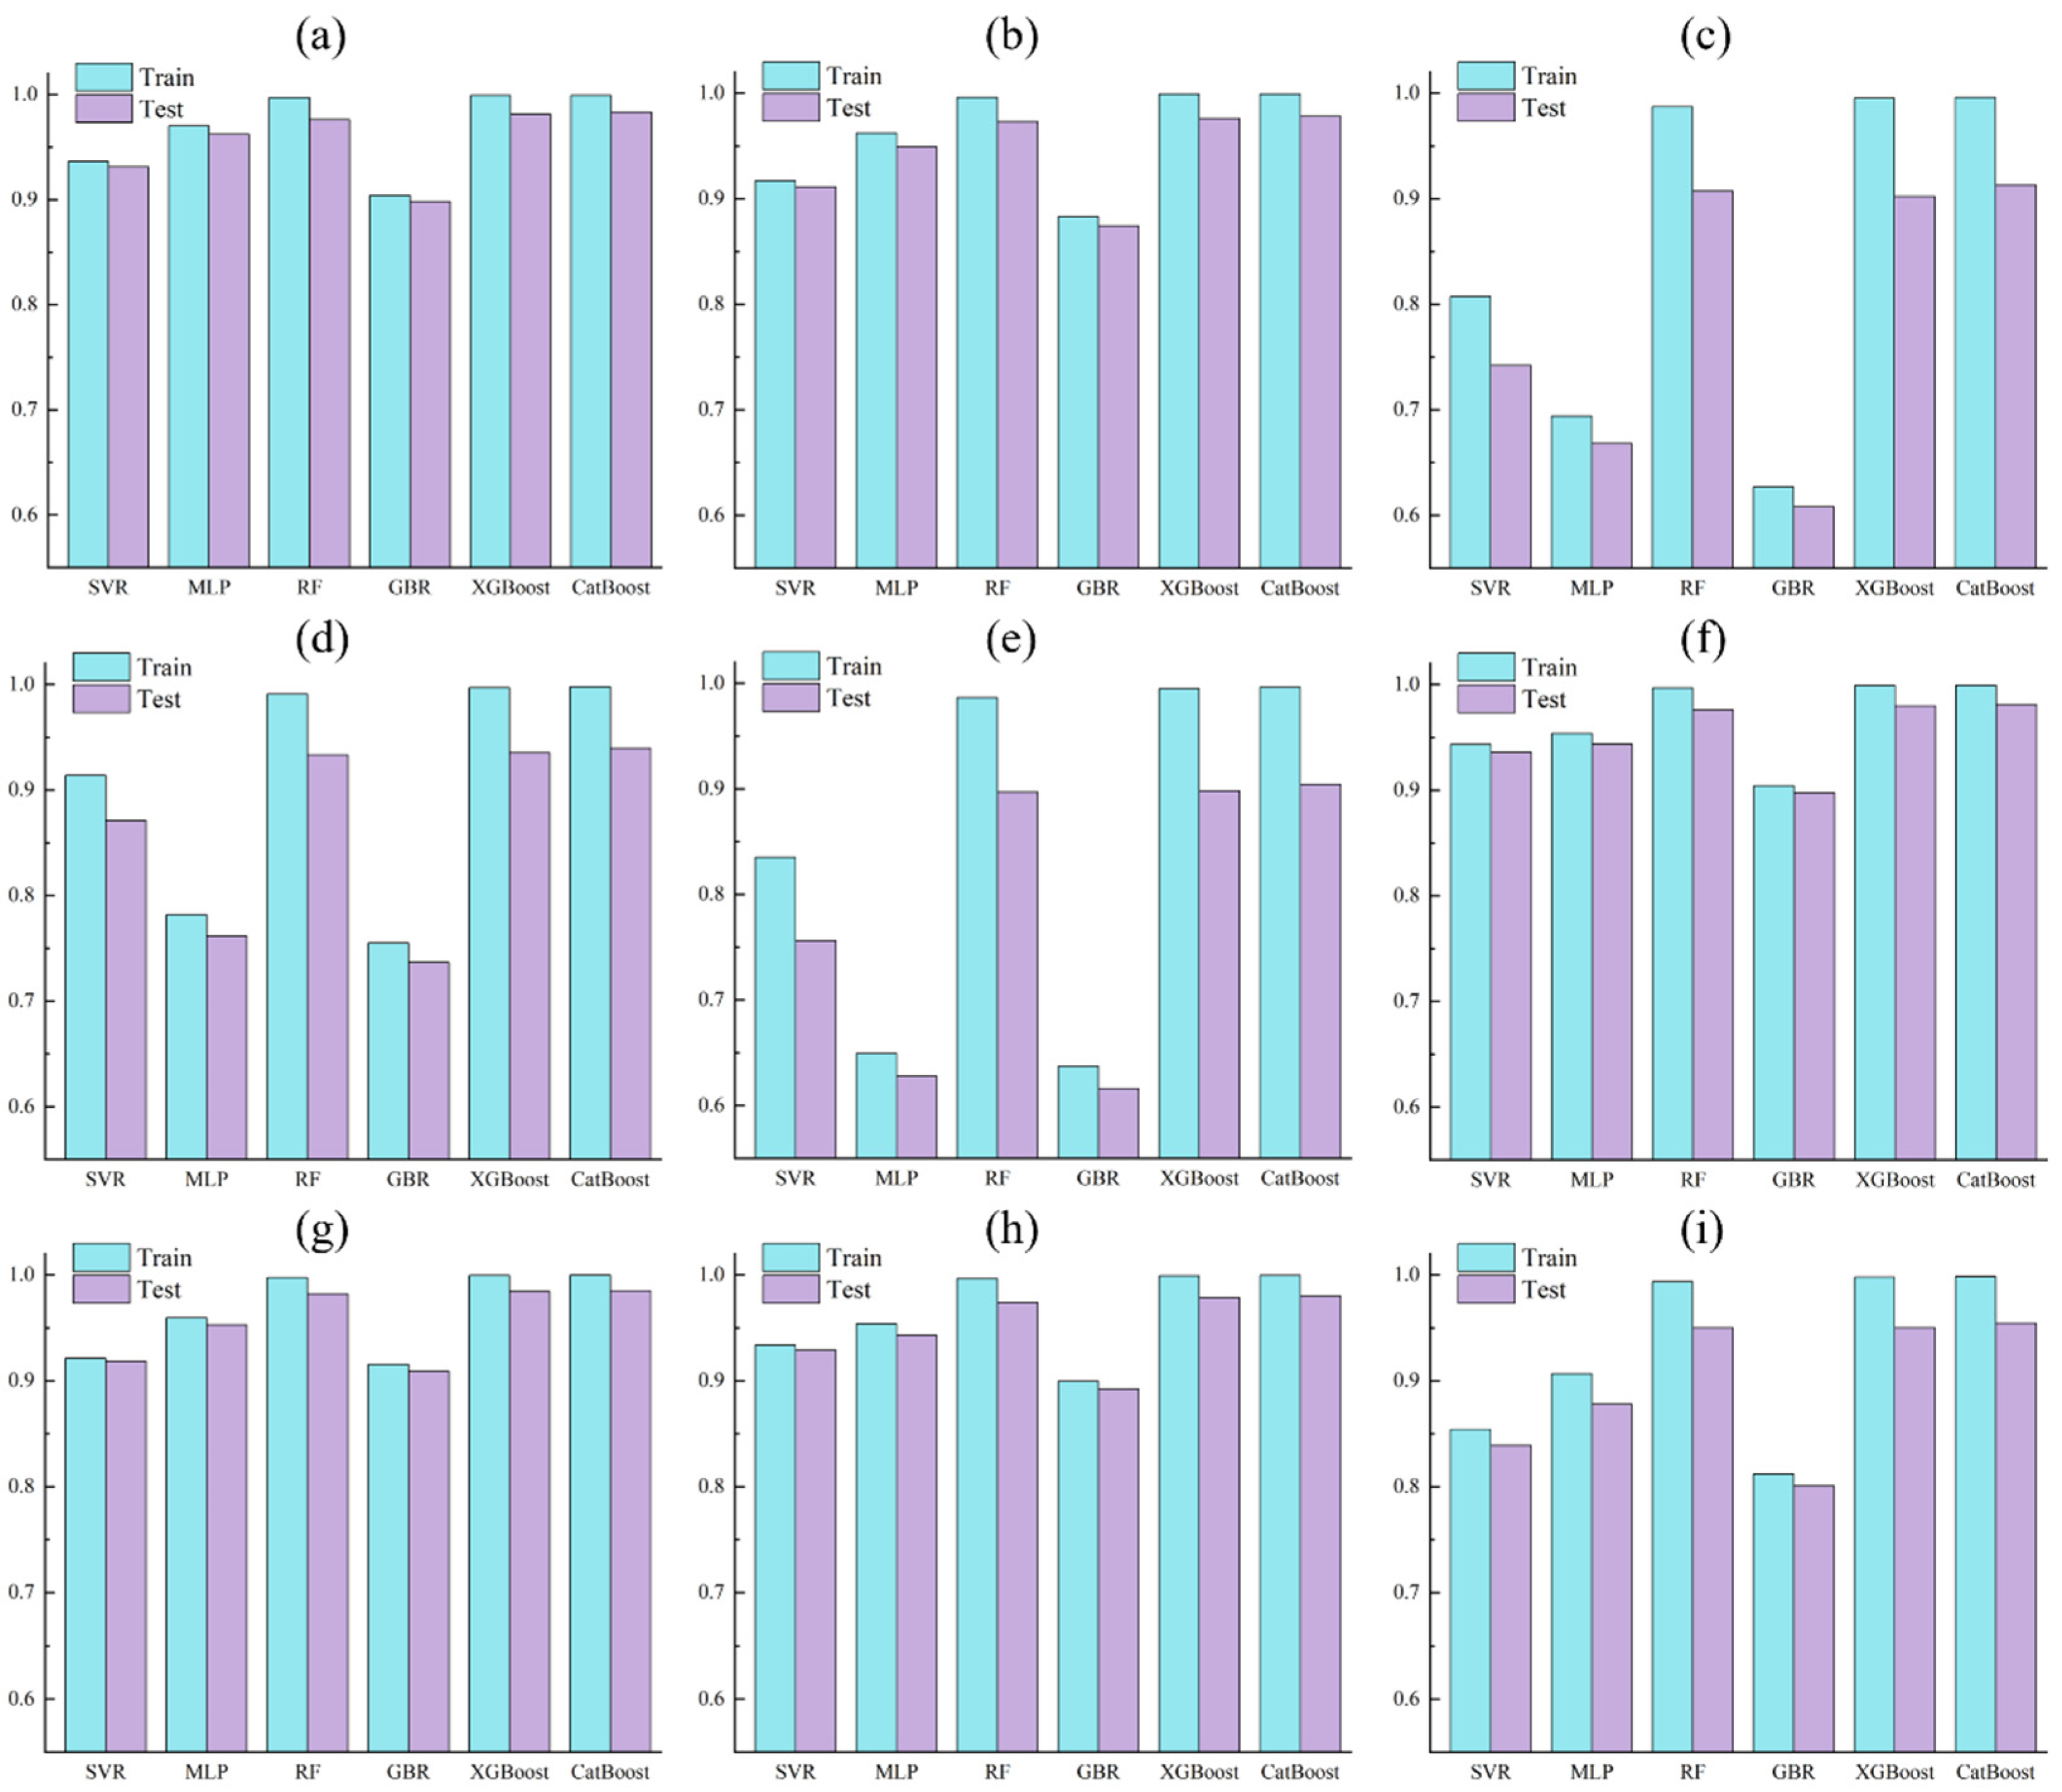
Figure 5 shows the estimation accuracy of geometric features by various models. In subplots (c)–(e), when estimating the three geometric features graphite_nodularity, avg_roundness, and avg_ratio, slight overfitting is observed in the RF, XGBoost, and CatBoost models. This indicates that the data distribution does not fully represent the real scenario, and there are a small number of outliers in the training set.

Figure 5.
R2 values of each feature under different models: (a) total_particles; (b) qualified_particles; (c) graphite_nodularity; (d) avg_roundness; (e) avg_ratio; (f) avg_feret; (g) avg_area; (h) avg_perimeter; (i) avg_distance.
3.4. Comparative Analysis of GFs Model Estimation Results
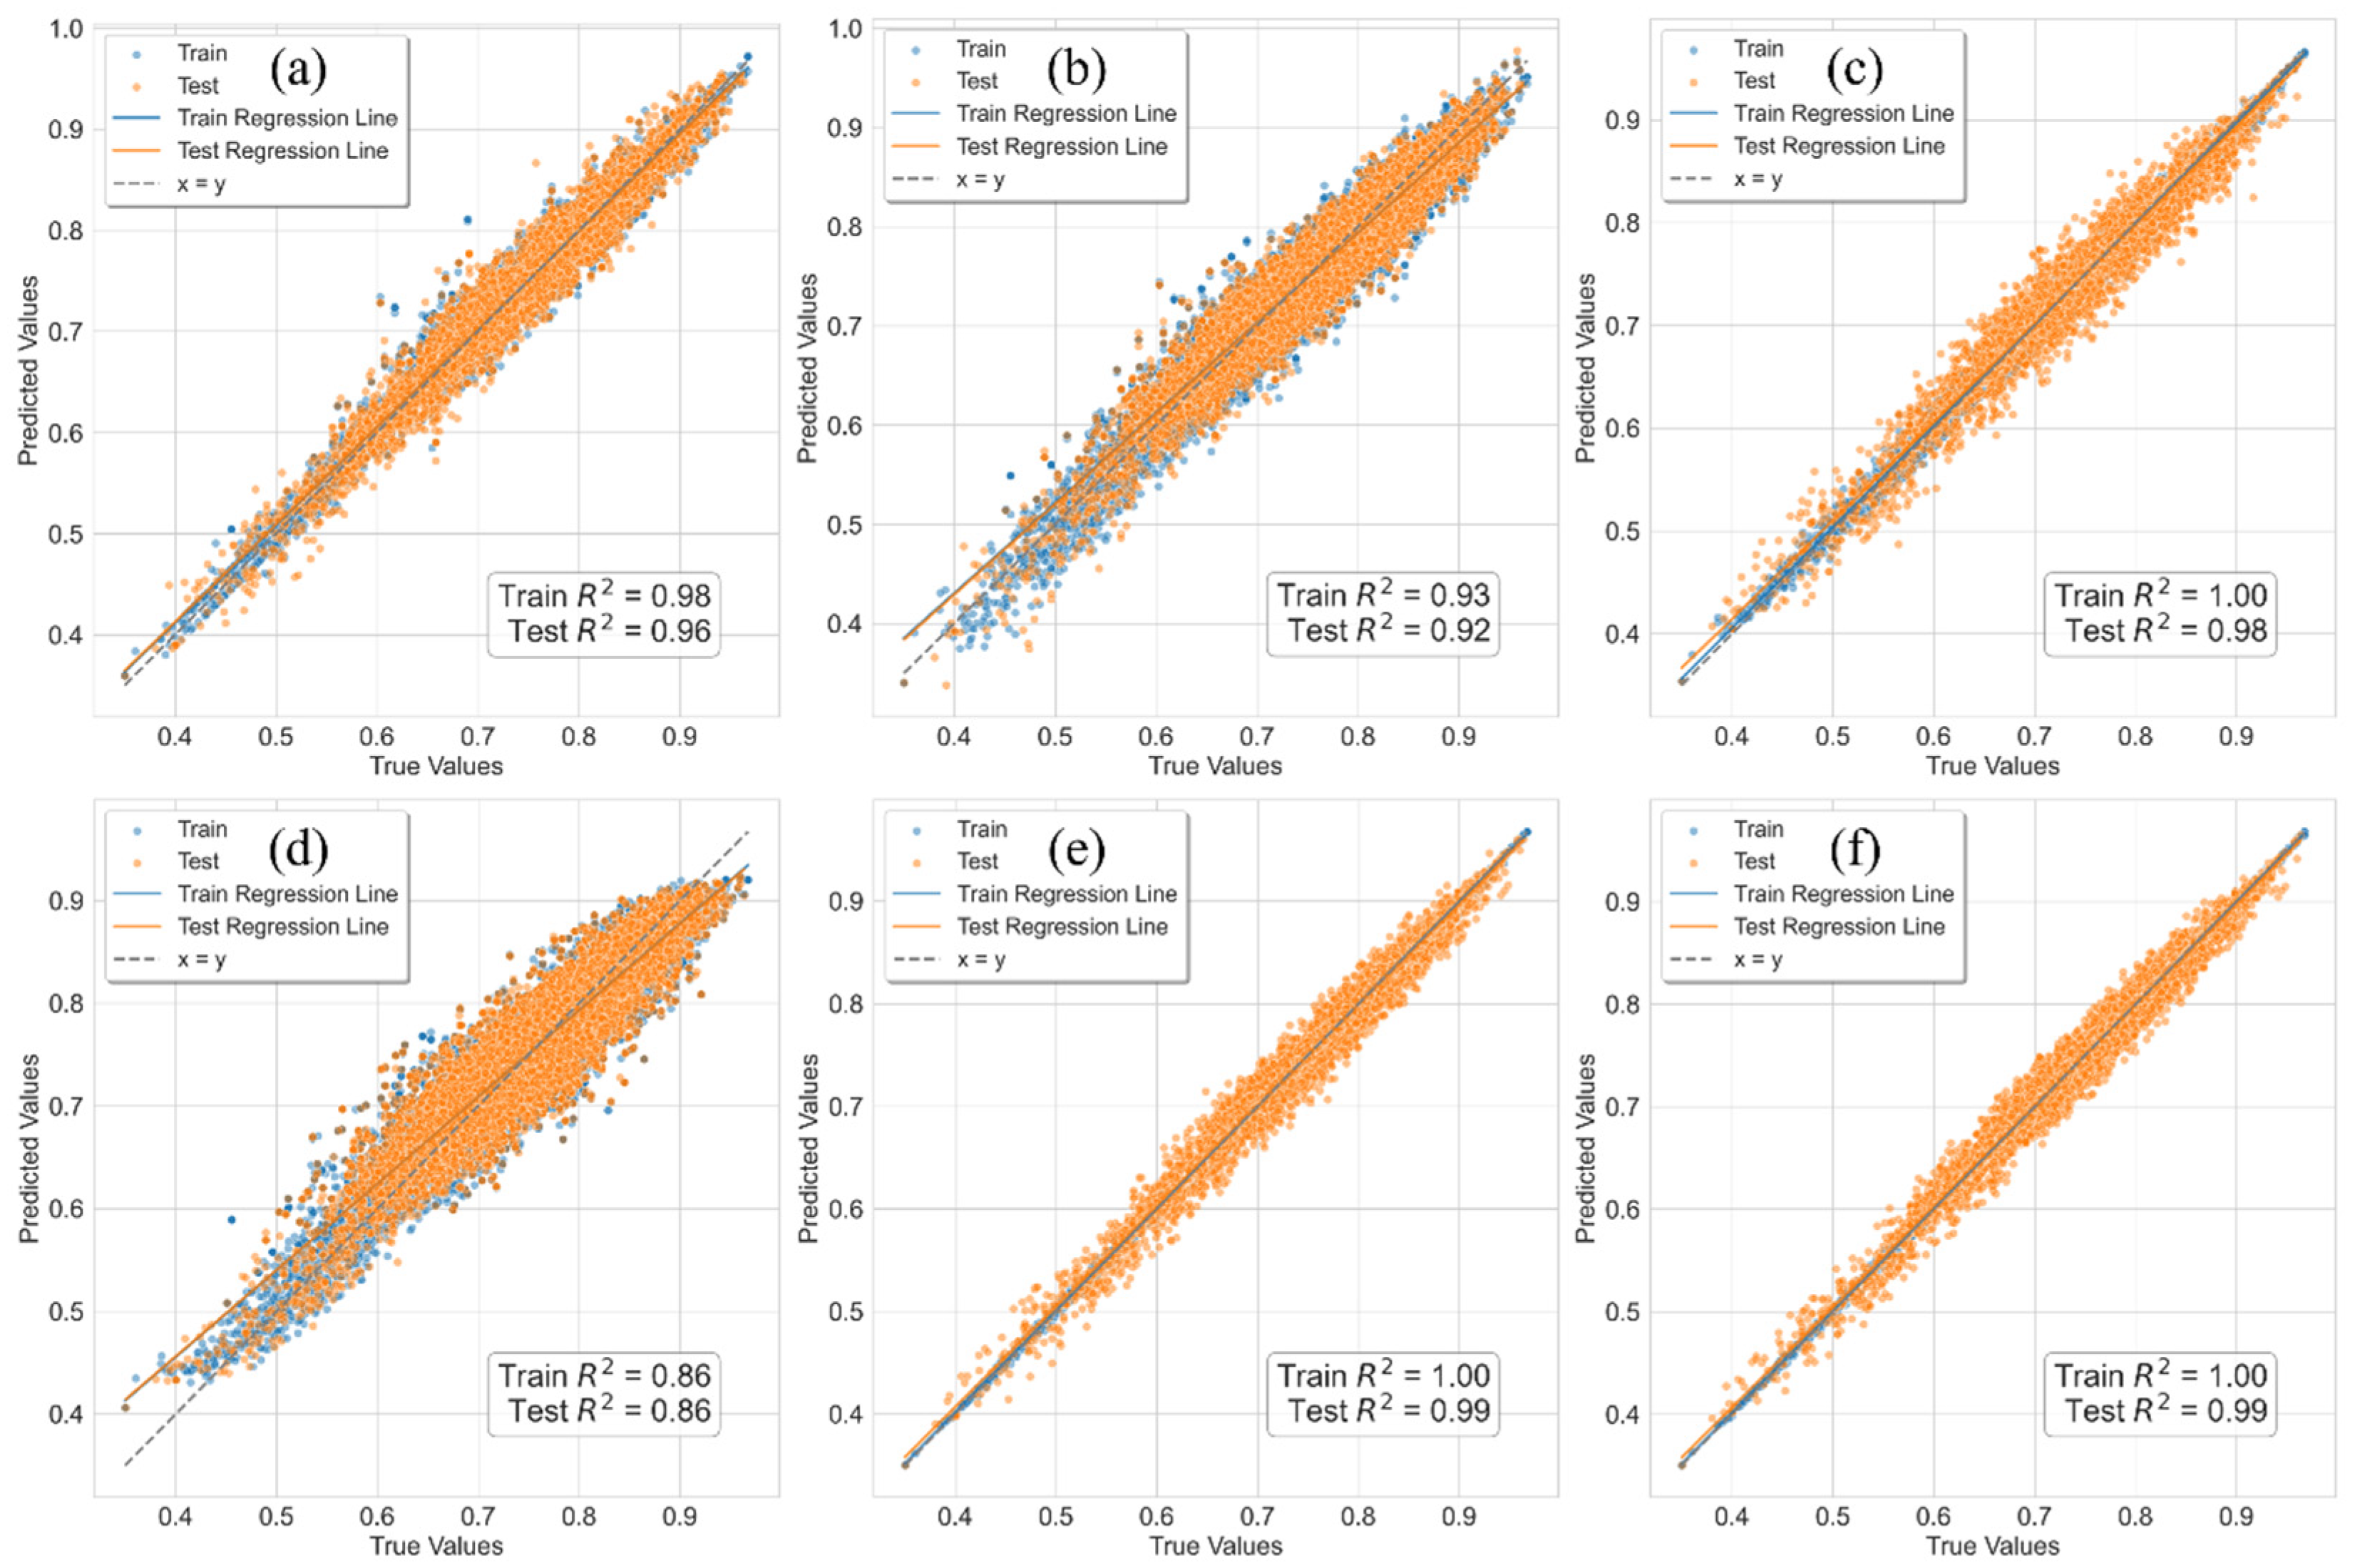
To comprehensively capture the complex relationship between geometric features and the fused dataset of ductile iron images, geometric features were incorporated into the fused feature dataset. Models trained on the dataset including geometric features are denoted with the prefix “GFs-” and used to estimate the graphite nodularity. Figure 6 presents the estimation accuracy of graphite nodularity by six different machine learning models—SVR, MLP, RF, GBR, XGBoost, and CatBoost—using the constructed GFs dataset. The results indicate that the GFs-XGBoost and GFs-CatBoost models achieved nearly identical R2 values of 0.98, with the GFs-CatBoost model performing the best. The GFs-SVR, GFs-MLP, and GFs-GBR models performed slightly worse. Table 3 shows the estimation results of graphite_nodularity for each model. Compared with the CatBoost model without geometric features, the GFs-CatBoost model reduced the MAE by 0.9%, RMSE by 1.6%, and increased R2 by 8.3%, effectively addressing the slight overfitting issue and improving the model’s reliability.

Figure 6.
Estimation results of graphite_nodularity on different models. (a) GFs-SVR; (b) GFs-MLP; (c) GFs-RF; (d) GFs-GBR; (e) GFs-XGBoost; (f) GFs-CatBoost.

Table 3.
graphite_nodularity estimation results in different models.
The final parameters of the CatBoost model obtained through grid search are shown in Table 4.

Table 4.
CatBoost parameter settings.
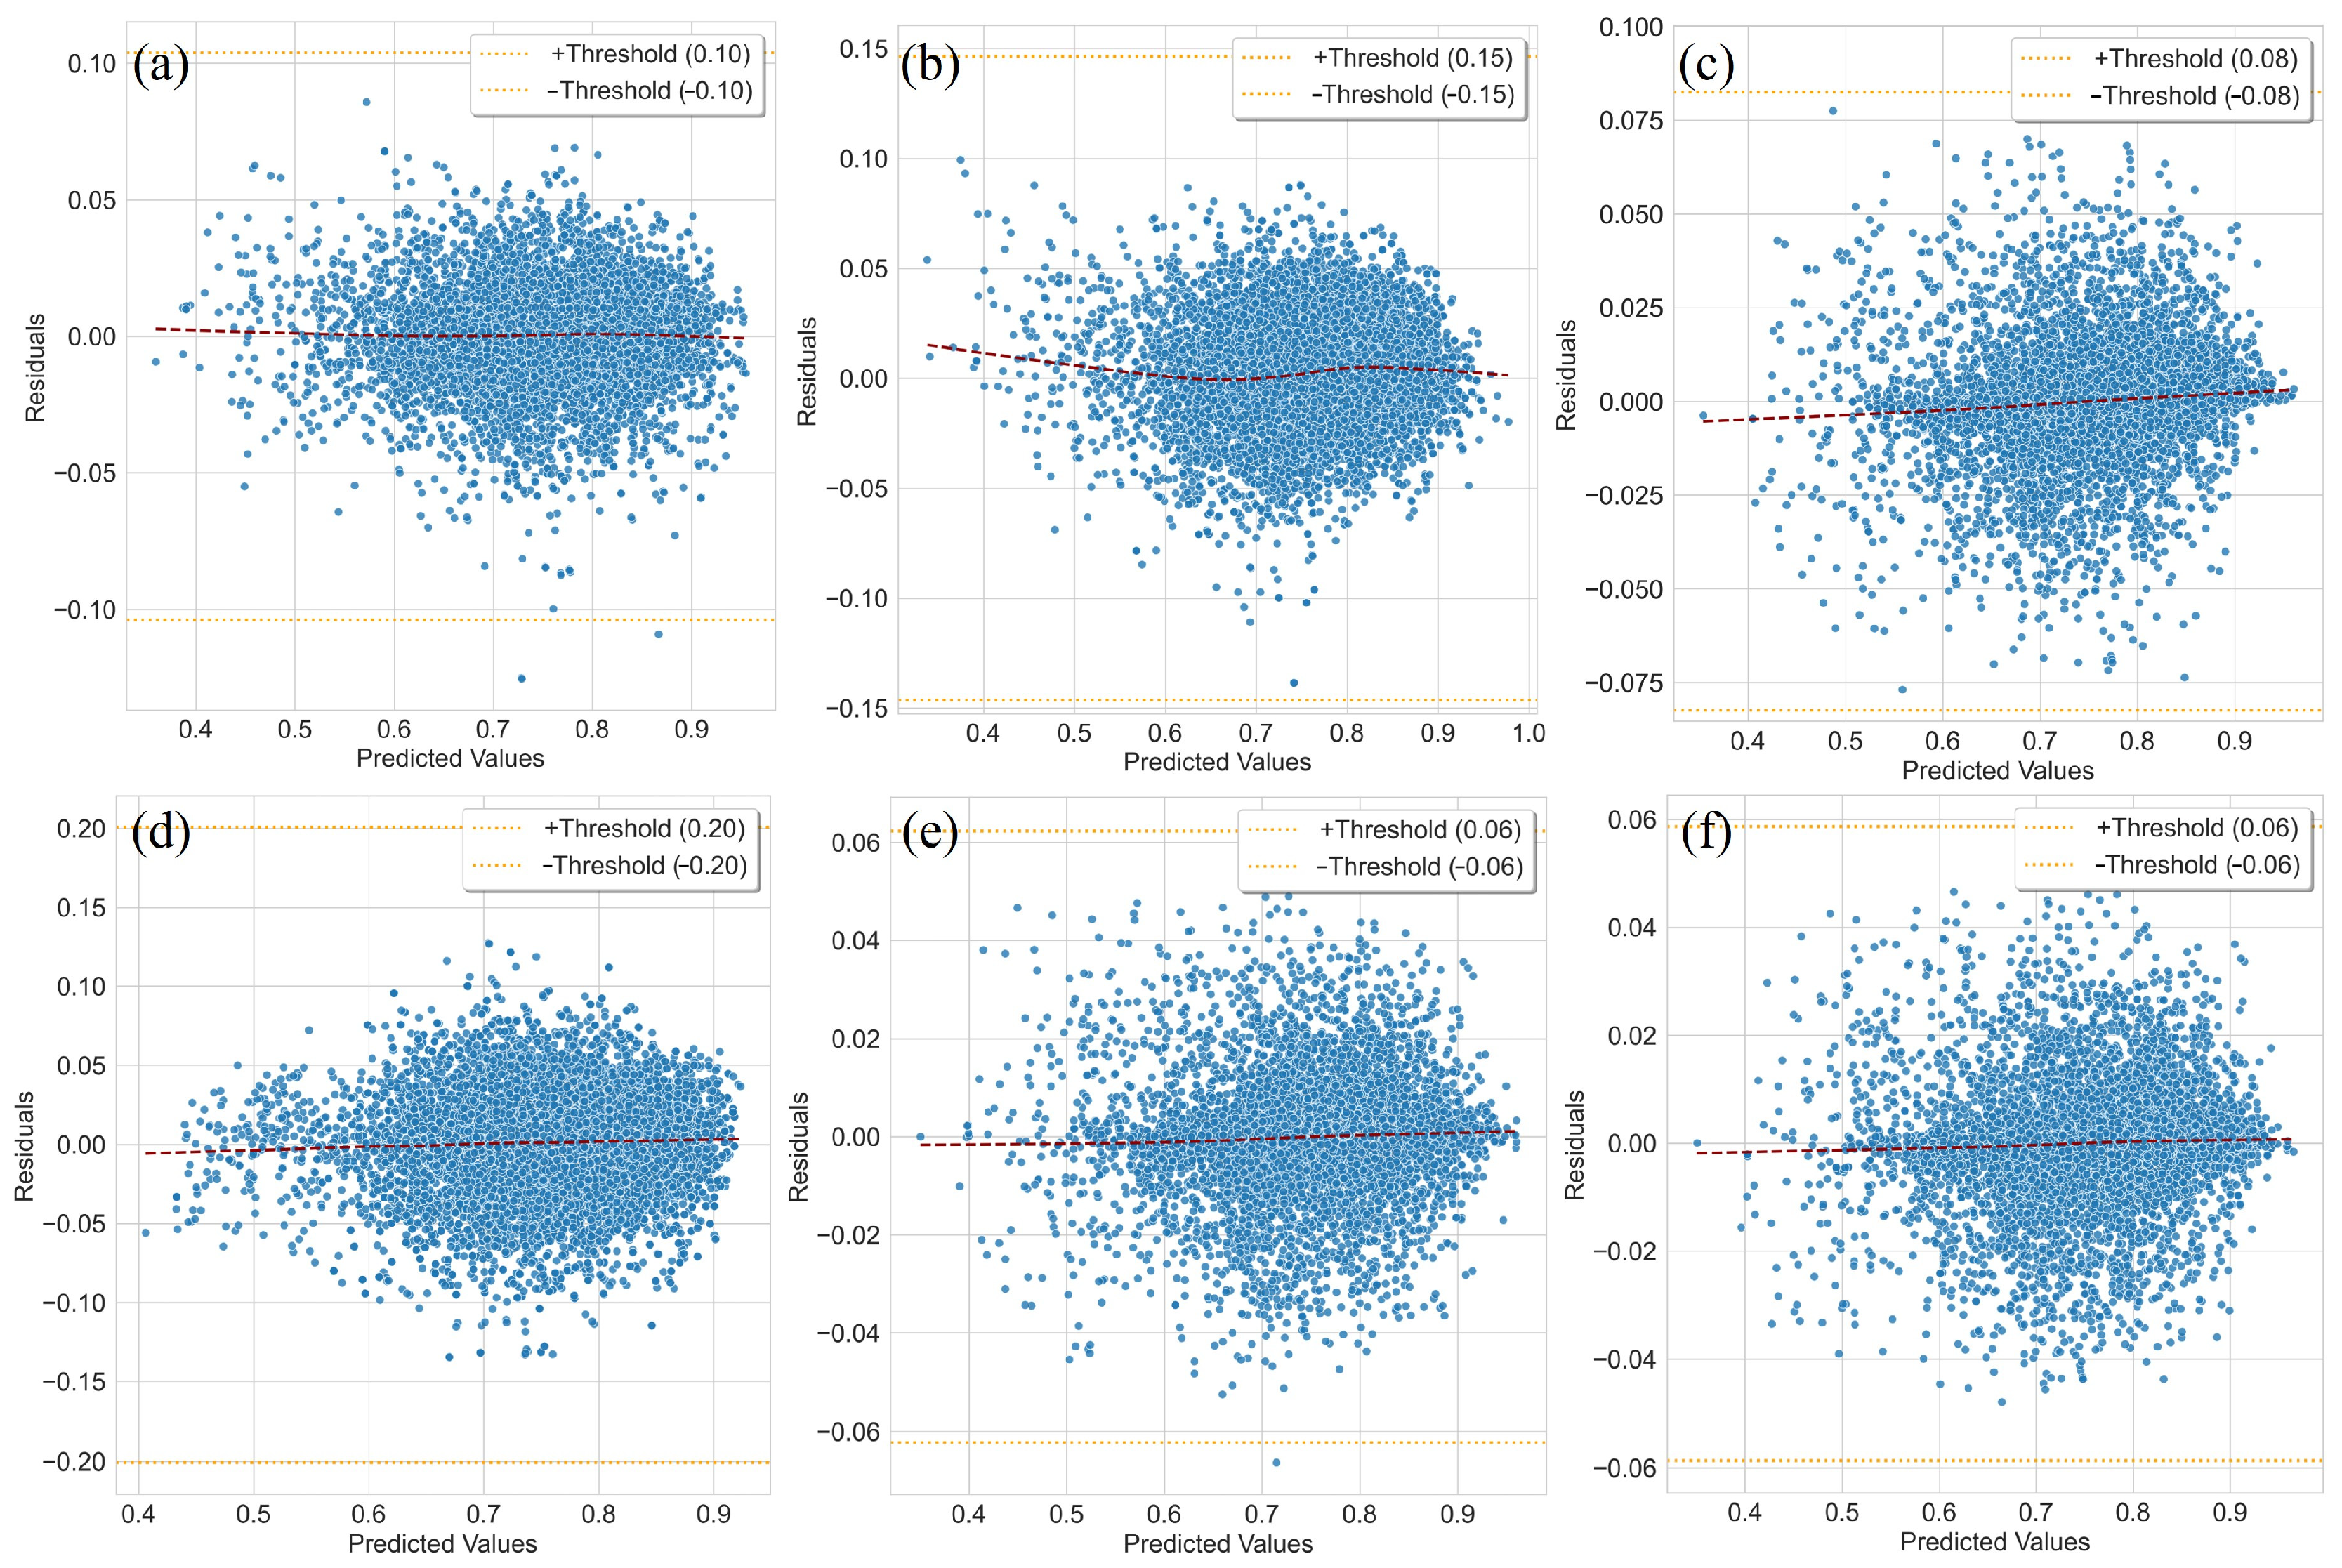
Figure 7 and Figure 8 illustrate the residual distributions of various models. The estimation residuals of the GFs-CatBoost model are concentrated within the range of [−0.05, 0.05]. Similarly, the residuals of the GFs-XGBoost model are also mainly distributed within [−0.05, 0.05], although there are individual residuals exceeding the threshold of 0.06. The peak densities of the residual histograms for both GFs-XGBoost and GFs-CatBoost models exceed 3500, indicating that the estimation errors for the vast majority of samples are minimal, with estimated values closely matching the true values. The residual distributions exhibit a unimodal and symmetric shape without significant skewness or outliers, suggesting that the errors follow a random noise pattern and the models do not exhibit systematic overestimation or underestimation. Further observation shows that the locally weighted regression curves almost coincide with the zero-residual line (y = 0), indicating that residuals do not display increasing, decreasing, or fluctuating trends with changes in estimated values, thereby validating the homoscedasticity and global consistency of the models. This distribution characteristic demonstrates that the models maintain stable fitting ability across the entire data domain, unaffected by noise or nonlinear relationships in specific regions. Overall, the models possess high accuracy and robustness, effectively supporting estimation tasks in practical scenarios.

Figure 7.
Residual analysis of GFs fusion feature datasets on different models. (a) GFs-SVR; (b) GFs-MLP; (c) GFs-RF; (d) GFs-GBR; (e) GFs-XGBoost; (f) GFs-CatBoost.

Figure 8.
Histograms of the estimated residual distribution of GFs fusion feature datasets on different models. (a) GFs-SVR; (b) GFs-MLP; (c) GFs-RF; (d) GFs-GBR; (e) GFs-XGBoost; (f) GFs-CatBoost.
4. Conclusions
This study proposes an innovative image processing and feature fusion framework for the analysis of ductile iron microstructure images. The main conclusions are as follows:
- (1)
- The improved watershed segmentation method effectively addresses the over-segmentation issues of traditional algorithms when dealing with complex graphite morphologies. Combined with GFs extracted by the intelligent screening algorithm, it can accurately characterize the geometric parameters of graphite particles.
- (2)
- The multimodal feature fusion strategy significantly enhances feature representation capability; however, the CatBoost model trained solely on the fused features exhibits overfitting when estimating geometric features, resulting in considerable errors between the training and test sets.
- (3)
- By reintegrating the GFs back into the fused feature set, the model achieves a feature self-enhancement mechanism: the geometric features serve as prior knowledge to guide the model’s focus on intrinsic morphological patterns, completely eliminating CatBoost’s overfitting problem and significantly improving both estimation accuracy (R2 ≈ 0.98) and robustness.
The method proposed in this study provides an efficient and reliable technical pathway for the quantitative analysis of material microstructures. The core innovations of this study can be summarized in two aspects. First, a multi-source feature extraction framework is proposed, which integrates geometric, color, and texture features to overcome the limitations of single-feature approaches commonly employed in previous studies. Second, an improved watershed algorithm is combined with an intelligent filtering strategy to enable more accurate particle segmentation, particularly in cases involving overlapping or irregular graphite morphologies. This framework demonstrates strong generalizability and scalability, making it applicable to microstructural image analysis of other metallic materials. It is expected to facilitate the intelligent upgrading of industrial quality inspection and material development, providing robust theoretical support for related fields.
It should be noted that this study did not explicitly investigate the influence of the cast iron matrix on the recognition of graphite spheres. Since different matrix phases may alter the local contrast and texture of metallographic images, they could potentially affect feature extraction and recognition accuracy. Future work will extend the proposed framework to systematically evaluate the effect of matrix microstructure on graphite nodularity quantification.
Author Contributions
Writing–original draft, Y.Y.; review & editing, Y.Y.; visualization, Y.Y.; data curation, Y.Y.; Supervision, Y.Y., Y.L., Y.H., Z.P. and Z.L.; Funding acquisition, Y.L.; Formal analysis, Y.L.; All authors have read and agreed to the published version of the manuscript.
Funding
This work was financially supported by Natural Science Foundation of Shanghai [20ZR1422200].
Data Availability Statement
The raw data supporting the conclusions of this article will be made available by the authors on request.
Conflicts of Interest
The authors declared no potential conflicts of interest with respect to the research, authorship, and/or publication of this article.
References
- Liu, J.H.; Yan, J.S.; Zhao, X.B.; Fu, B.G.; Xue, H.T.; Zhang, G.X.; Yang, P.H. Precipitation and evolution of nodular graphite during solidification process of ductile iron. China Foundry 2020, 17, 260–271. [Google Scholar] [CrossRef]
- Hsu, C.H.; Lin, K.T. A study on microstructure and toughness of copper alloyed and austempered ductile irons. Mater. Sci. Eng. A 2011, 528, 5706–5712. [Google Scholar] [CrossRef]
- Ricotta, M. Simple expressions to estimate the Manson–Coffin curves of ductile cast irons. Int. J. Fatigue 2015, 78, 38–45. [Google Scholar] [CrossRef]
- Wróbel, T.; Studnicki, A.; Stawarz, M.; Baron, C.; Jezierski, J.; Bartocha, D.; Dojka, R.; Opiela, J.; Lisiecki, A. Improving the Abrasion Resistance of Nodular Cast Iron Castings by Remelting Their Surfaces by Laser Beam. Materials 2024, 17, 2095. [Google Scholar] [CrossRef] [PubMed]
- Katuku, K. Regime features of austempered ductile iron cutting. J. Manuf. Process. 2022, 83, 374–386. [Google Scholar] [CrossRef]
- EN ISO 945-1; Microstructure of Cast Irons—Part 1: Graphite Classification by Visual Analysis. ISO: Geneva, Switzerland, 2017.
- ASTM A247–16a; Standard Test Method for Evaluating the Microstructure of Graphite in Iron Castings. ASTM International: West Conshohocken, PA, USA, 2016. Available online: www.astm.org (accessed on 1 April 2016).
- SAC/TC 54; Metallographic Examination of Ductile Iron: GB/T 9441-2021. Standards Press of China: Beijing, China, 2021.
- Anca, D.-E.; Stan, I.; Riposan, I.; Stan, S. Graphite Compactness Degree and Nodularity of High-Si Ductile Iron Produced via Permanent Mold versus Sand Mold Casting. Materials 2022, 15, 2712. [Google Scholar] [CrossRef]
- Germain, L.; Sertucha, J.; Hazotte, A.; Lacaze, J. Classification of graphite particles in metallographic images of cast irons–Quantitative image analysis versus deep learning. Mater. Charact. 2024, 217, 114333. [Google Scholar] [CrossRef]
- Song, L.; Zhang, H.; Zhang, J.; Guo, H. Prediction of heavy-section ductile iron fracture toughness based on machine learning. Sci. Rep. 2024, 14, 4681. [Google Scholar] [CrossRef]
- Pedro, D.; Dommarco, R. Rolling contact fatigue resistance of Carbidic Austempered Ductile Iron (CADI). Wear 2019, 418–419, 94–101. [Google Scholar] [CrossRef]
- Zhang, H.; Sun, S.; Liu, C.; Zhu, Y.; Liu, Q.; Wang, Y.; Wang, J.; Wang, M. Effect of Annealing Process on Properties of Ferritic Ductile Iron for Subway. Sci. Adv. Mater. 2018, 10, 1658–1663. [Google Scholar] [CrossRef]
- Wu, W.-H.; Lee, J.-C.; Wang, Y.-M. A Study of Defect Detection Techniques for Metallographic Images. Sensors 2020, 20, 5593. [Google Scholar] [CrossRef]
- Friess, J.; Sonntag, U.; Steller, I.; Bührig-Polaczek, A. From Individual Graphite Assignment to an Improved Digital Image Analysis of Ductile Iron. Int. J. Met. 2020, 14, 1090–1104. [Google Scholar] [CrossRef]
- Tchórz, A.; Korona, K.; Krzak, I.; Bitka, A.; Książek, M.; Jaśkowiec, K.; Małysza, M.; Głowacki, M.; Wilk-Kołodziejczyk, D. Development of a CT Image Analysis Model for Cast Iron Products Based on Artificial Intelligence Methods. Materials 2022, 15, 8254. [Google Scholar] [CrossRef] [PubMed]
- Mucllari, E.; Cao, Y.; Ye, Q.; Zhang, Y. Modeling imaged welding process dynamic behaviors using Generative Adversarial Network (GAN) for a new foundation to monitor weld penetration using deep learning. J. Manuf. Process. 2024, 124, 187–195. [Google Scholar] [CrossRef]
- Lu, Y.; Wang, Y.; Pan, L. A feature-based physics-constrained active dictionary learning scheme for image-based additive manufacturing process monitoring. J. Manuf. Process. 2023, 103, 261–273. [Google Scholar] [CrossRef]
- Rossi, A.; Moretti, M.; Senin, N. Layer inspection via digital imaging and machine learning for in-process monitoring of fused filament fabrication. J. Manuf. Process. 2021, 70, 438–451. [Google Scholar] [CrossRef]
- Jiang, R.; Xiao, R.; Chen, S. Prediction of penetration based on infrared thermal and visual images during pulsed GTAW process. J. Manuf. Process. 2021, 69, 261–272. [Google Scholar] [CrossRef]
- Zhang, W.; Wang, L.; Liu, Y.; Wang, R.; Li, D. Laser spheroidization combined with coaxial powder feeding: A novel strategy for preparing spherical powders for additive manufacturing. J. Manuf. Process. 2025, 137, 82–99. [Google Scholar] [CrossRef]
- Ruelas-Santoyo, E.A.; Ríos-Lira, A.J.; Pantoja-Pacheco, Y.V.; Jiménez-García, J.A.; Hernández-González, S.; Cruz-Domínguez, O. Recognition of Intergranular Corrosion in AISI 304 Stainless Steel by Integrating a Multilayer Perceptron Artificial Neural Network and Metallographic Image Processing. Appl. Sci. 2024, 14, 5077. [Google Scholar] [CrossRef]
- Naik, D.L.; Kiran, R. Identification and characterization of fracture in metals using machine learning based texture recognition algorithms. Eng. Fract. Mech. 2019, 219, 106618. [Google Scholar] [CrossRef]
- Jing, X.-Y.; Chang, H.; Li, S.; Yao, Y.-F.; Liu, Q.; Bian, L.-S.; Man, J.-Y.; Wang, C. Face recognition based on a Gabor-2DFisherface approach with selecting 2D Gabor principal components and discriminant vectors. In Proceedings of the 2009 Third International Conference on Genetic and Evolutionary Computing, Guilin, China, 14–17 October 2009; IEEE: New York, NY, USA, 2009; pp. 565–568. [Google Scholar] [CrossRef]
- Azimi, S.M.; Britz, D.; Engstler, M.; Fritz, M.; Mücklich, F. Advanced Steel Microstructural Classification by Deep Learning Methods. Sci. Rep. 2018, 8, 2128. [Google Scholar] [CrossRef]
- Velichko, A. Quantitative 3D Characterization of Graphite Morphologies in Cast Iron Using FIB Microstructure Tomography. Doctoral Thesis, Saarland University, Saarbrücken, Germany, 2008. [Google Scholar] [CrossRef]
- Krizhevsky, A.; Sutskever, I.; Hinton, G.E. Imagenet classification with deep convolutional neural networks. Adv. Neural Inf. Process. Syst. 2017, 60, 84–90. [Google Scholar] [CrossRef]
- Durmaz, A.R.; Müller, M.; Lei, B.; Thomas, A.; Britz, D.; Holm, E.A.; Eberl, C.; Mücklich, F.; Gumbsch, P. A deep learning approach for complex microstructure inference. Nat. Commun. 2021, 12, 6272. [Google Scholar] [CrossRef] [PubMed]
- Thomas, A.; Durmaz, A.R.; Alam, M.; Gumbsch, P.; Sack, H.; Eberl, C. Author Correction: Materials fatigue prediction using graph neural networks on microstructure representations. Sci. Rep. 2023, 13, 13598. [Google Scholar] [CrossRef] [PubMed]
- Johannes, R.; Johannes, T.; Sebastian, M. Deep learning based initial crack size measurements utilizing macroscale fracture surface segmentation. Eng. Fract. Mech. 2023, 293, 109686. [Google Scholar] [CrossRef]
- Wilk-Kołodziejczyk, D.; Nowotny, A.; Krzak, I.; Tchórz, A.; Jaśkowiec, K.; Małysza, M.; Bitka, A.; Głowacki, M.; Książek, M.; Marcjan, Ł. Development of a model for detection and analysis of inclusions in tomographic images of iron castings using decision trees. Sci. Rep. 2025, 15, 1880. [Google Scholar] [CrossRef]
- Schmies, L.; Botsch, B.; Le, Q.-H.; Yarysh, A.; Sonntag, U.; Hemmleb, M.; Bettge, D. Classification of fracture characteristics and fracture mechanisms using deep learning and topography data. Pract. Metallogr. 2023, 60, 76–92. [Google Scholar] [CrossRef]
- Schmies, L.; Hemmleb, M.; Bettge, D. Relevant input data for crack feature segmentation with deep learning on SEM imagery and topography data. Eng. Fail. Anal. 2024, 156, 107814. [Google Scholar] [CrossRef]
- Bárcena, M.; Iglesias, L.L.; Ferreño, D.; Carrascal, I. Classification of Cast Iron Alloys through Convolutional Neural Networks Applied on Optical Microscopy Images. Steel Res. Int. 2024, 95, 2400120. [Google Scholar] [CrossRef]
- Zheng, X.; Zhang, X.; Chen, T.; Watanabe, I. Deep learning in mechanical metamaterials: From prediction and generation to inverse design. Adv. Mater. 2023, 35, 2302530. [Google Scholar] [CrossRef]
- Choudhary, K.; DeCost, B.; Chen, C.; Jain, A.; Tavazza, F.; Cohn, R.; Park, C.W.; Choudhary, A.; Agrawal, A.; Billinge, S.J.L.; et al. Recent advances and applications of deep learning methods in materials science. Npj Comput. Mater. 2022, 8, 59. [Google Scholar] [CrossRef]
- Ying, X. An Overview of Overfitting and its Solutions. J. Phys. Conf. Ser. 2019, 1168, 022022. [Google Scholar] [CrossRef]
- Kanopoulos, N.; Vasanthavada, N.; Baker, R.L. Design of an image edge detection filter using the Sobel operator. IEEE J. Solid-State Circuits 1988, 23, 358–367. [Google Scholar] [CrossRef]
- Hancock, J.T.; Khoshgoftaar, T.M. CatBoost for big data: An interdisciplinary review. J. Big Data 2020, 7, 94. [Google Scholar] [CrossRef]
- Prasshanth, C.V.; Sugumaran, V. Tire wear monitoring using feature fusion and CatBoost classifier. Artif. Intell. Rev. 2024, 57, 337. [Google Scholar] [CrossRef]
Disclaimer/Publisher’s Note: The statements, opinions and data contained in all publications are solely those of the individual author(s) and contributor(s) and not of MDPI and/or the editor(s). MDPI and/or the editor(s) disclaim responsibility for any injury to people or property resulting from any ideas, methods, instructions or products referred to in the content. |
© 2025 by the authors. Licensee MDPI, Basel, Switzerland. This article is an open access article distributed under the terms and conditions of the Creative Commons Attribution (CC BY) license (https://creativecommons.org/licenses/by/4.0/).