Article

The Mechanism of Casing Perforation Erosion Under Fracturing-Fluid Flow: An FSI and Strength Criteria Study

1
School of Petroleum and Engineering, China University of Petroleum (East China), Qingdao 266580, China
2
Sinopec North China Company, Zhengzhou 450000, China
*
Author to whom correspondence should be addressed.
Modelling 2025, 6(4), 121; https://doi.org/10.3390/modelling6040121
Submission received: 18 August 2025 / Revised: 28 September 2025 / Accepted: 1 October 2025 / Published: 4 October 2025

Abstract

High-pressure, high-volume fracturing in unconventional reservoirs often induces perforation erosion damage, endangering operational safety. This paper employs fluid–solid coupling theory to analyze the flow characteristics of fracturing fluid inside the casing during fracturing. Combined with strength theory, the stress distribution and variation law are investigated, revealing the mechanical mechanism of casing perforation erosion damage. The results indicate that the structural discontinuity at the entrance of the perforation tunnel causes an increase in fracturing-fluid velocity, and this is where the most severe erosion happens. The stress around the perforation is symmetrically distributed along the perforation axis. The casing inner wall experiences a combined tensile–compressive stress state, while non-perforated regions are under pure tensile stress, with the maximum amplitudes occurring in the 90° and 270° directions. Although the tensile and compressive stress do not exceed the material’s allowable stress, the shear stress exceeds the allowable shear stress, indicating that shear stress failure is likely to initiate at the perforation, inducing erosion. Moreover, under the impact of fracturing fluid, the contact forces at the first and second interfaces of the casing are unevenly distributed, reducing cement bonding capability and compromising casing integrity. The findings provide a theoretical basis for optimizing casing selection.

1. Introduction

Multi-stage hydraulic fracturing technology, as a common method, enables the segmented stimulation of unconventional reservoirs through plug-and-perf operations [1,2]. Each cluster of perforations distributed along the horizontal wellbore is isolated and treated as an independent fracturing stage. After one stage has been completed, a drillable bridge plug is set to isolate the treated stage, and then the subsequent perforation sections of the wellbore are fractured one by one [3,4,5]. Usually, after the completion of single-segment perforation, the high-pressure and high-volume fracturing fluid is pumped from the surface. The fluid travels down the casing, exits through the perforation hole, and enters the formation. During the process, the proppant transported by the fluid fills the fractures to maintain their conductivity [6,7]. However, field monitoring has revealed that injecting the high-pressure and high-volume fracturing fluid into the formation through the perforation hole will cause serious erosion of the hole, which endangers the construction safety and fracturing effect. This is one of the technical problems that restricts the safety and efficiency of unconventional reservoir development [8,9,10].
Current research on perforation erosion caused by fracturing fluid primarily focuses on experimental and numerical simulation. From an experimental perspective, the industry mainly measures the erosion of casing perforations through indoor devices or downhole television technology. Wu et al. [11] used a large-scale erosion test system and revealed that the erosion process has two characteristic stages: roundness deterioration and wellbore diameter expansion, and the evolution law is affected by working condition parameters. Zhang [12] confirmed, through a single-hole erosion experiment, that the proppant concentration and flow rate are positively correlated with the perforation erosion rate. Lv et al. [13] conducted experiments on a full-scale perforation erosion simulation platform, and found that an increase in the proppant content synchronously intensifies the expansion of the perforation inner diameter and the pumping pressure drop. Cramer et al. [14] innovatively applied downhole video imaging technology to obtain the real perforation morphology of casings under field working conditions.
From the perspective of numerical simulation, computational fluid dynamics (CFD) combined with discrete element method (DEM) particle flow is an effective method of simulating perforation erosion. Yuan et al. [15] and Liu et al. [16] used the CFD-DPM (Discrete Phase Model) coupling model to quantify the contribution weights of proppant particle diameter, proppant concentration, fracturing-fluid viscosity, and injection rate to the erosion rate. Kebert et al. [6] used CFD to simulate the flow of fracturing fluid in the casing, described the movement of proppant with the DPM, and analyzed the effects of proppant diameter, concentration, and fracturing-fluid viscosity on the erosion rate. Shi et al. [17] analyzed the effects of fracturing-fluid rate and proppant concentration on the perforation erosion amount and casing wall thickness near the perforation based on the Fluent-DDPM (Dense Discrete Phase Model) coupling model, which agreed well with field-measured erosion results. Wang et al. [18], based on Fluent-Rocky DEM co-simulation, reconstructed the dynamic process of spatial erosion and perforation diameter expansion, and established a friction attenuation prediction equation.
To sum up, most previous studies have focused on quantifying the relationship between engineering parameters and perforation erosion rate or erosion amount [6,19], without exploring the mechanical mechanism of casing erosion failure. In fact, the flow of fracturing fluid in the casing during the fracturing process is a typical fluid–solid coupling problem [20]. That is, the flow of fracturing fluid will inevitably cause changes in the stress state and displacement of the casing, which may further cause the stress intensity to reach the yield strength of the casing and induce failure and damage [21]. The difficulty in, and focus of, research on the above issues lie in how to accurately simulate the proppant (as a solid phase) during large-scale volume fracturing. Currently available simulation methods include the DPM [22], DDPM [23], and DEM [18]. Among them, the DPM ignores the interaction between particles and is only applicable to small-scale systems (particle concentration less than 10%), making it unsuitable for meeting the simulation needs of dense phases in large-scale volume fracturing. Although the DEM model can analyze particle contact mechanics and quantify mechanical behaviors such as friction, adhesion, and collision between particles, it faces enormous computation time when used for simulating large-scale volume fracturing systems. The DDPM integrates the advantages of the DPM and DEM, considers the interaction between the discrete phase and particles, and has significant accuracy advantages in complex system simulation [24,25,26].
Therefore, this paper employs the DDPM in combination with computational fluid dynamics to investigate the flow characteristics of high-velocity fracturing fluid. Combined with strength theory, the change law of casing stress under the action of perforation erosion is studied, and the mechanical mechanism of casing erosion damage is revealed. The findings can provide valuable guidance for optimizing fracturing operation parameters.

2. Methodology

2.1. Governing Equation of Fluid

Considering the hydrodynamic action of the proppant within the fracturing fluid, the following governing equations are established:
α f ρ f / t + α f ρ f u f = 0
α f ρ f u f / t + α f ρ f u f = α f p f + τ + α f ρ f g + S f
where ρ f is the fluid density, kg/m3; u f is the fluid velocity, m/s; P f is the fluid pressure, Pa; α f is the fluid volume fraction; t is time, s; g is gravitational acceleration, m/s2; τ is the fluid stress–strain tensor; and S f is the source term for particle–fluid momentum exchange.
The flow of the high-velocity fluid medium carrying the proppant is turbulent. This paper employs the RNG k-ε model as the fluid constitutive model:
( ρ f k f ) / t + ρ f k f u f , i / x i = 1.39 μ eff   k f / x j / x j + G k + ρ f ε f
( ρ f ε f ) / t + ρ f ε f u f , i / x i = 1.39 μ eff   ε f / x j / x j + 1.42 G k / k f 1.68 ρ f ε f 2 / k f
where k f is the turbulent kinetic energy, m2/s2; ε f is the turbulent dissipation rate; G k is the turbulent kinetic energy, kg/(m·s3); and μ e f f is the turbulent viscosity, Pa·s.

2.2. Discrete-Phase Transport Model

The volume of fracturing fluid exhibits a multiplicative increase compared to that in shale gas fracturing. Consequently, the proppant’s motion can no longer be adequately described by the DPM, and requires the use of the DDPM. The velocity field and volume fraction of the discrete phase are directly solved using the Lagrange method. The governing equations are as follows:
d u p d t = F D u p u f τ s ρ p + g ρ p ρ f ρ p P ρ p
τ s = α p μ p μ p + μ p T + α p λ p 2 3 μ p μ p I p p I
where u p is the proppant velocity, m/s; ρ p is the proppant density, kg/m3; I is the unit stress tensor; α p is the proppant volume fraction; μ p is the shear viscosity of the proppant, Pa·s; and λ p is the bulk viscosity of the proppant, Pa·s.

2.3. Erosion Model

This study employs the Oka erosion model to calculate the erosion of the casing by the liquid–solid two-phase flow. The erosion rate is calculated as follows:
E = E 90 V V ref   k 2 d g d ref   k 3 f ( γ ) f ( γ ) = ( sin γ ) n 1 [ 1 + H V ( 1 sin γ ) ] n 2
where E 90 is the erosion rate at a normal impact angle (90°), kg/(m2·s); V is the particle impact velocity, m/s; V r e f and d r e f are the reference particle velocity and diameter, m/s; γ is the particle impact angle, rad; H v is the Vickers hardness of the casing material, GPa; and k 2 = 2.3 H V 0.038 , k 3 = 0.19 , n 1 = 0.71 H V 0.14 , and n 2 = 2.4 H V 0.94 .

2.4. Governing Equation of Solid

The mechanical response of the casing–cement–formation assembly induced by pressure variations in the fracturing-fluid flow can be expressed as follows:
M s r ¨ + C s r ˙ + K s r + σ s = 0
where M s , C s , and K s are the mass, damping, and stiffness matrices, respectively;  r is the solid displacement; and σ s is the stress acting on the casing.

2.5. Fluid–Structure Interaction (FSI) Coupled Governing Equations

The casing inner wall and perforations constitute the fluid–structure coupling interface. This interface must satisfy displacement compatibility and load transfer equilibrium conditions:
τ f n f = τ s n s d f = d s
where τ and d are the stress and displacement vectors at the fluid–solid coupling interface, and the subscript f and s denote fluid and solid, respectively.

3. Fluid–Structure Coupling Numerical Model

3.1. Numerical Model

In this paper, with the fracturing construction of a shale well (Figure 1 shows the measured erosion topography of underground TV) [15], the evolution law of perforation hole erosion under the conditions of large displacement and a high sand content is analyzed.
The constructed models included both fluid and structural domains. The Φ139.7 × 10.54 mm TP140V casing for filed application was selected to establish the fluid dynamic model (shown in Figure 2). The total length of the calculated domain was 3.5 m, with the perforated section being 1.5 m long. The perforation density was 16 holes per meter, and perforation was conducted at a 60° angle, creating a branch of holes 10 mm in diameter. To ensure the full development of the flow, flow stabilization zones, with a length of 1 m, were set up both upstream and downstream of the perforation cluster, in order to effectively eliminate boundary effects. The geometric parameters strictly correspond to the actual working conditions: the inner diameter of the casing was 118.62 mm, and the perforation depth was 800 mm.
The fluid-domain simulation was set up as follows: the fracturing fluid was injected vertically into the wellbore and flowed out through the perforations. The inlet boundary was set as a velocity inlet, and the outlet boundary as a pressure outlet. A pressure-based steady-state solver was used for the solution process, combined with the Phase Coupled SIMPLE algorithm to handle velocity–pressure coupling. The no-slip boundary condition was applied to the walls. The mechanical behavior of the particle phase was characterized by the Gidaspow drag model. The initial particle velocity field was consistent with the fluid, injected via a surface injection method. The fluid domain was meshed using polyhedral elements via Fluent Meshing. Five layers of progressive mesh (the growth rate was 1.2) were applied at the inlet/outlet and walls. The perforation transition zone was locally refined to 0.1 mm, so as to accurately resolve near-wall viscous sublayer flow and enhance erosion prediction accuracy.
The numerical model for the solid domain consisted of the casing, cement sheath, and formation assembly. To eliminate boundary effects, the formation dimensions were set to 2 m × 2 m × 3.5 m, more than 10 times the casing diameter. Initially, the casing was centralized and the cement sheath geometry was intact. A friction contact algorithm was employed to accurately characterize the interaction between the formation, cement sheath, and casing. The dimensions and material parameters of each model component were strictly set according to field data, as shown in Table 1.
Based on the downhole stress data from the perforated region, boundary conditions were set for the formation–cement–casing assembly. The internal casing pressure during fracturing was 80.00 MPa. According to the logging data, the maximum horizontal, minimum horizontal, and vertical in situ stresses were 61.07 MPa, 53.66 MPa, and 64.82 MPa, respectively, along with a pore pressure of 8.00 MPa. Consequently, the effective stresses were 53.07 MPa, 45.66 MPa, and 56.82 MPa, respectively. Thus, the initial stress state of the casing was simulated using in situ stress-balancing technology. The casing inner wall and perforation walls were defined as FSI surfaces for fluid load transfer. Structural meshing was performed using Ansys Workbench’s adaptive technology (shown in Figure 3), with a maximum element size of 2 mm and a minimum element size of 0.1 mm. The resulting formation–cement–casing model had 74,335,748 nodes and 47,032,054 elements, guaranteeing the accuracy of simulation.
Given that the casing is constrained by the cement during fracturing and exhibits quasi-static characteristics, the one-way FSI strategy was adopted: the fluid-domain pressure field was solved in Fluent. Fluid pressure loads were then mapped to the Static Structural module via System Coupling, obtaining the structural response of the formation–cement–casing assembly. The fluid field was calculated as a first priority, to ensure temporal consistency in load transfer.

3.2. Verification

In order to validate the model’s reliability, physical data from the water–sand flow experiment by Qu et al. [27] were selected for comparison (the experimental device is shown in Figure 4). The experimental conditions were as follows: (1) the flow medium was clear water, the fluid velocity was 2.7 m/s, and the viscosity was 0.001 Pa·s; (2) the sand concentration was 2% and the sand particle diameter was 0.633 mm; and (3) the pipe diameter was 50 mm and the pipes were uniformly arranged with 6 × Φ12 mm holes, a 60° phase angle, and a hole spacing of 60 mm.
As shown in Figure 5, the numerical model reproduced the transport characteristics of the proppant that were observed in the experiment. Overall, the numerical model successfully captured the key characteristics of proppant transport and the general trend of spatial distribution observed in the experiment. While some discrepancies were evident under specific conditions, the model demonstrated reasonable agreement with the measured data in terms of transport efficiency [28].

4. Results

4.1. Flow Field Characteristics in the Perforated Section

Figure 6 shows a contour plot of the fluid velocity distribution near the perforation holes. The results indicate that the fluid velocity at the entrance of the perforation hole is 323.0 m/s, which is significant higher than that of regions far away from the hole. This velocity gradient is reflected by the dense distribution of contours near the hole, while there is a relatively sparse distribution in the region distant from the hole. The reason is that the flow cross-section suddenly shrinks at the entrance of the perforation hole, which causes a fluid acceleration effect and leads to a steep increase in flow velocity near the hole.

4.2. Erosion of the Perforation Hole

Figure 7 shows the erosion rate contour near the jet-eroded hole. It can be seen that the most severely eroded region is located near the perforation hole, particularly at the hole entrance, with a maximum erosion rate of 2.26 × 10⁻⁵ kg/(m2·s). This phenomenon stems from the discontinuity of the geometric structure of the hole, which induces an increase in fluid velocity. As the high-velocity fluid jets through the hole into the formation, it violently scours the hole entrance, leading to severe erosion. This reduces the pressure difference across the hole, and affects the migration of the proppant.
Comparing with the field-measured perforation erosion morphology image, it can be seen that the perforation entrance suffers severe erosion damage, thinning the hole wall and enlarging the diameter. The numerical results agree well with the field results, and are consistent with many references [14,27], which strongly corroborates the validity of our simulation.

4.3. Von Mises Stress Analysis of the Casing

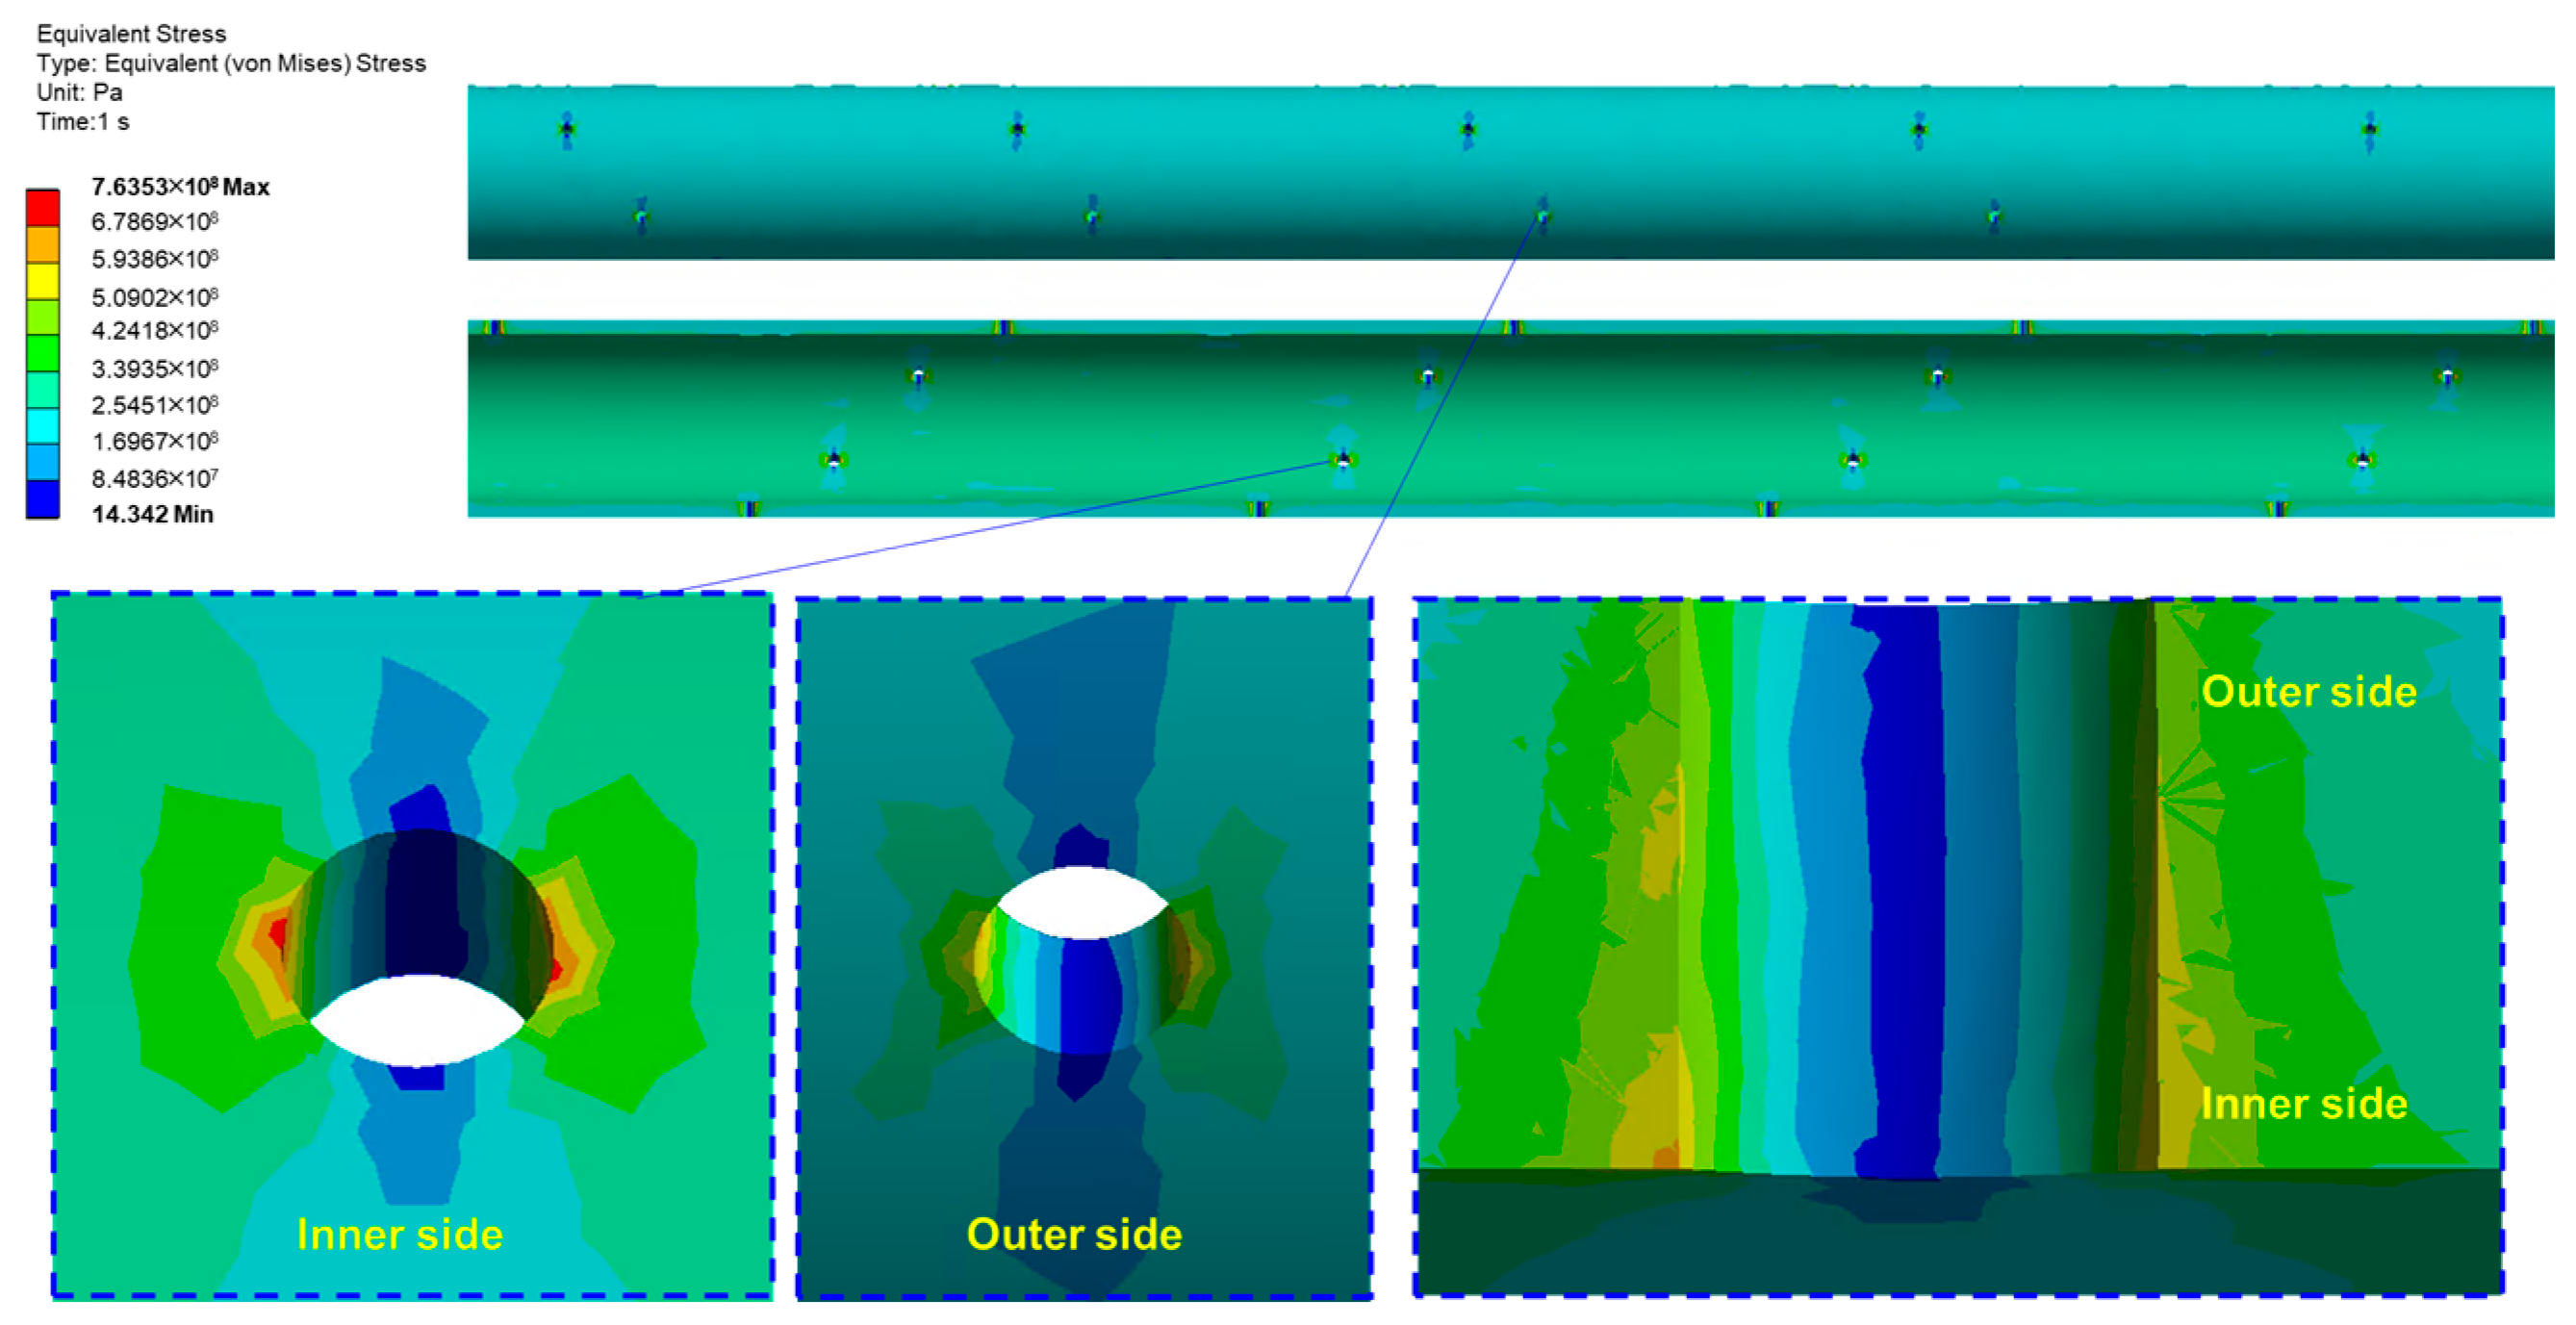
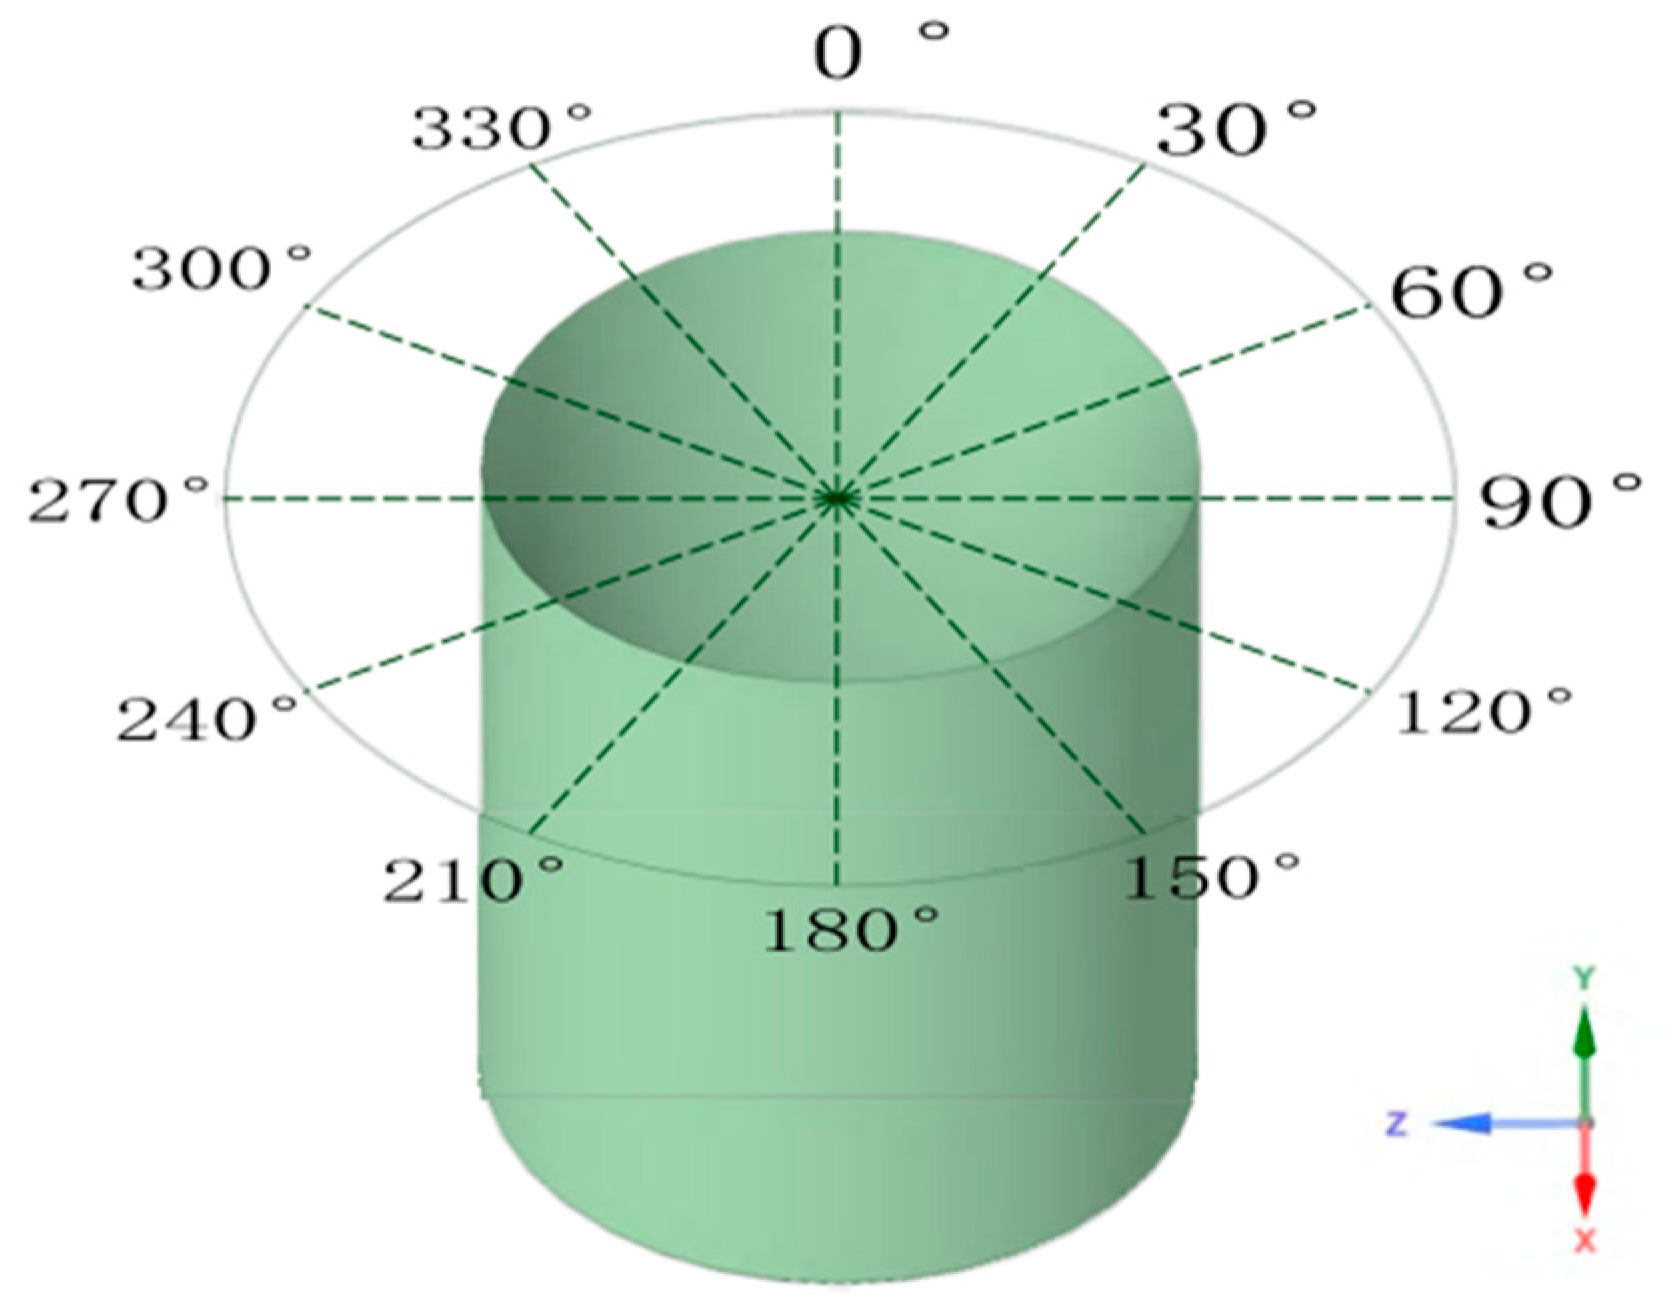
The Von Mises yield criterion states that under certain deformation conditions, a point in a material begins to enter the plastic state when the equivalent stress at that point reaches a specific value. This stress comprehensively considers the three principal stresses of the material, enabling it to quickly and accurately reflect the material’s stress state. It is generally used to evaluate fatigue and failure. The von Mises stress distribution of the casing under fracturing-fluid action is shown in Figure 8. It can be seen that the stress is relatively uniform along the casing axis, but stress concentration occurs at the perforation holes (according to the outside of the casing, in the directions of 90° and 270°, as shown in Figure 8 and Figure 9). Meanwhile, along the direction of the wall thickness, the stress of the inner wall is significantly higher than that of the outer wall, and the stress amplitude is gradually reduced along the hole axis.
The above results demonstrate that under the action of fracturing fluid, the maximum stress of the casing occurs at 90° and 270° in relation to the perforation holes (on the inner side of the casing), where the peak stress and significant stress concentration effects are present (shown in Figure 10). These high-stress areas also coincide with the severe erosion zones. Therefore, the stress concentration effects can reflect the severity of casing erosion.

4.4. The Maximum Principal Stress and Shear Stress of the Casing

Although von Mises stress is helpful for quickly locating high-stress risk areas in engineering design, its scalar nature cannot distinguish whether the casing is under tensile or compressive stress, or whether the stress state is dominated by principal stress or shear stress, making it insufficient to meet the needs of refined structural stress analysis. Therefore, this section introduces maximum principal stress and maximum shear stress as evaluation indicators for the stress distribution over the casing wall, providing more comprehensive criteria for studying casing stress distribution.
As shown in Figure 11, significant principal stress concentration occurs at the 90° and 270° azimuths relative to the perforation axis on the casing inner-wall region. The spatial distribution pattern of the principal stress is highly consistent with that of the equivalent stress. The inner wall of the perforation is in a combined tensile–compressive stress state, while non-perforated regions are under pure tensile stress. The maximum tensile stress in the casing is 742.32 MPa, less than the material tensile strength of 1050.00 MPa. The maximum compressive stress is 50.73 MPa (here, we define the principal stress in tension as positive and the principal stress in compression as negative), less than the material compressive strength of 862.00 MPa. These results confirm that tensile/compressive failure does not occur in the casing under the current operating conditions.
Figure 12 and Figure 13 show the contour plot of shear stress distribution and the shear stress distribution curve at the perforation under erosion, respectively. It can be seen that shear stress concentration occurs near the perforations, with the maximum shear stress (325.18 MPa) located at the perforation hole. Considering that the shear strength of TP140V casing is 332.17 MPa and the safety factor is 1.25, the allowable shear stress is 265.74 MPa. This means the shear stress experienced by the casing exceeds the allowable shear stress. Therefore, shear stress failure will occur in the casing under the current operating conditions.
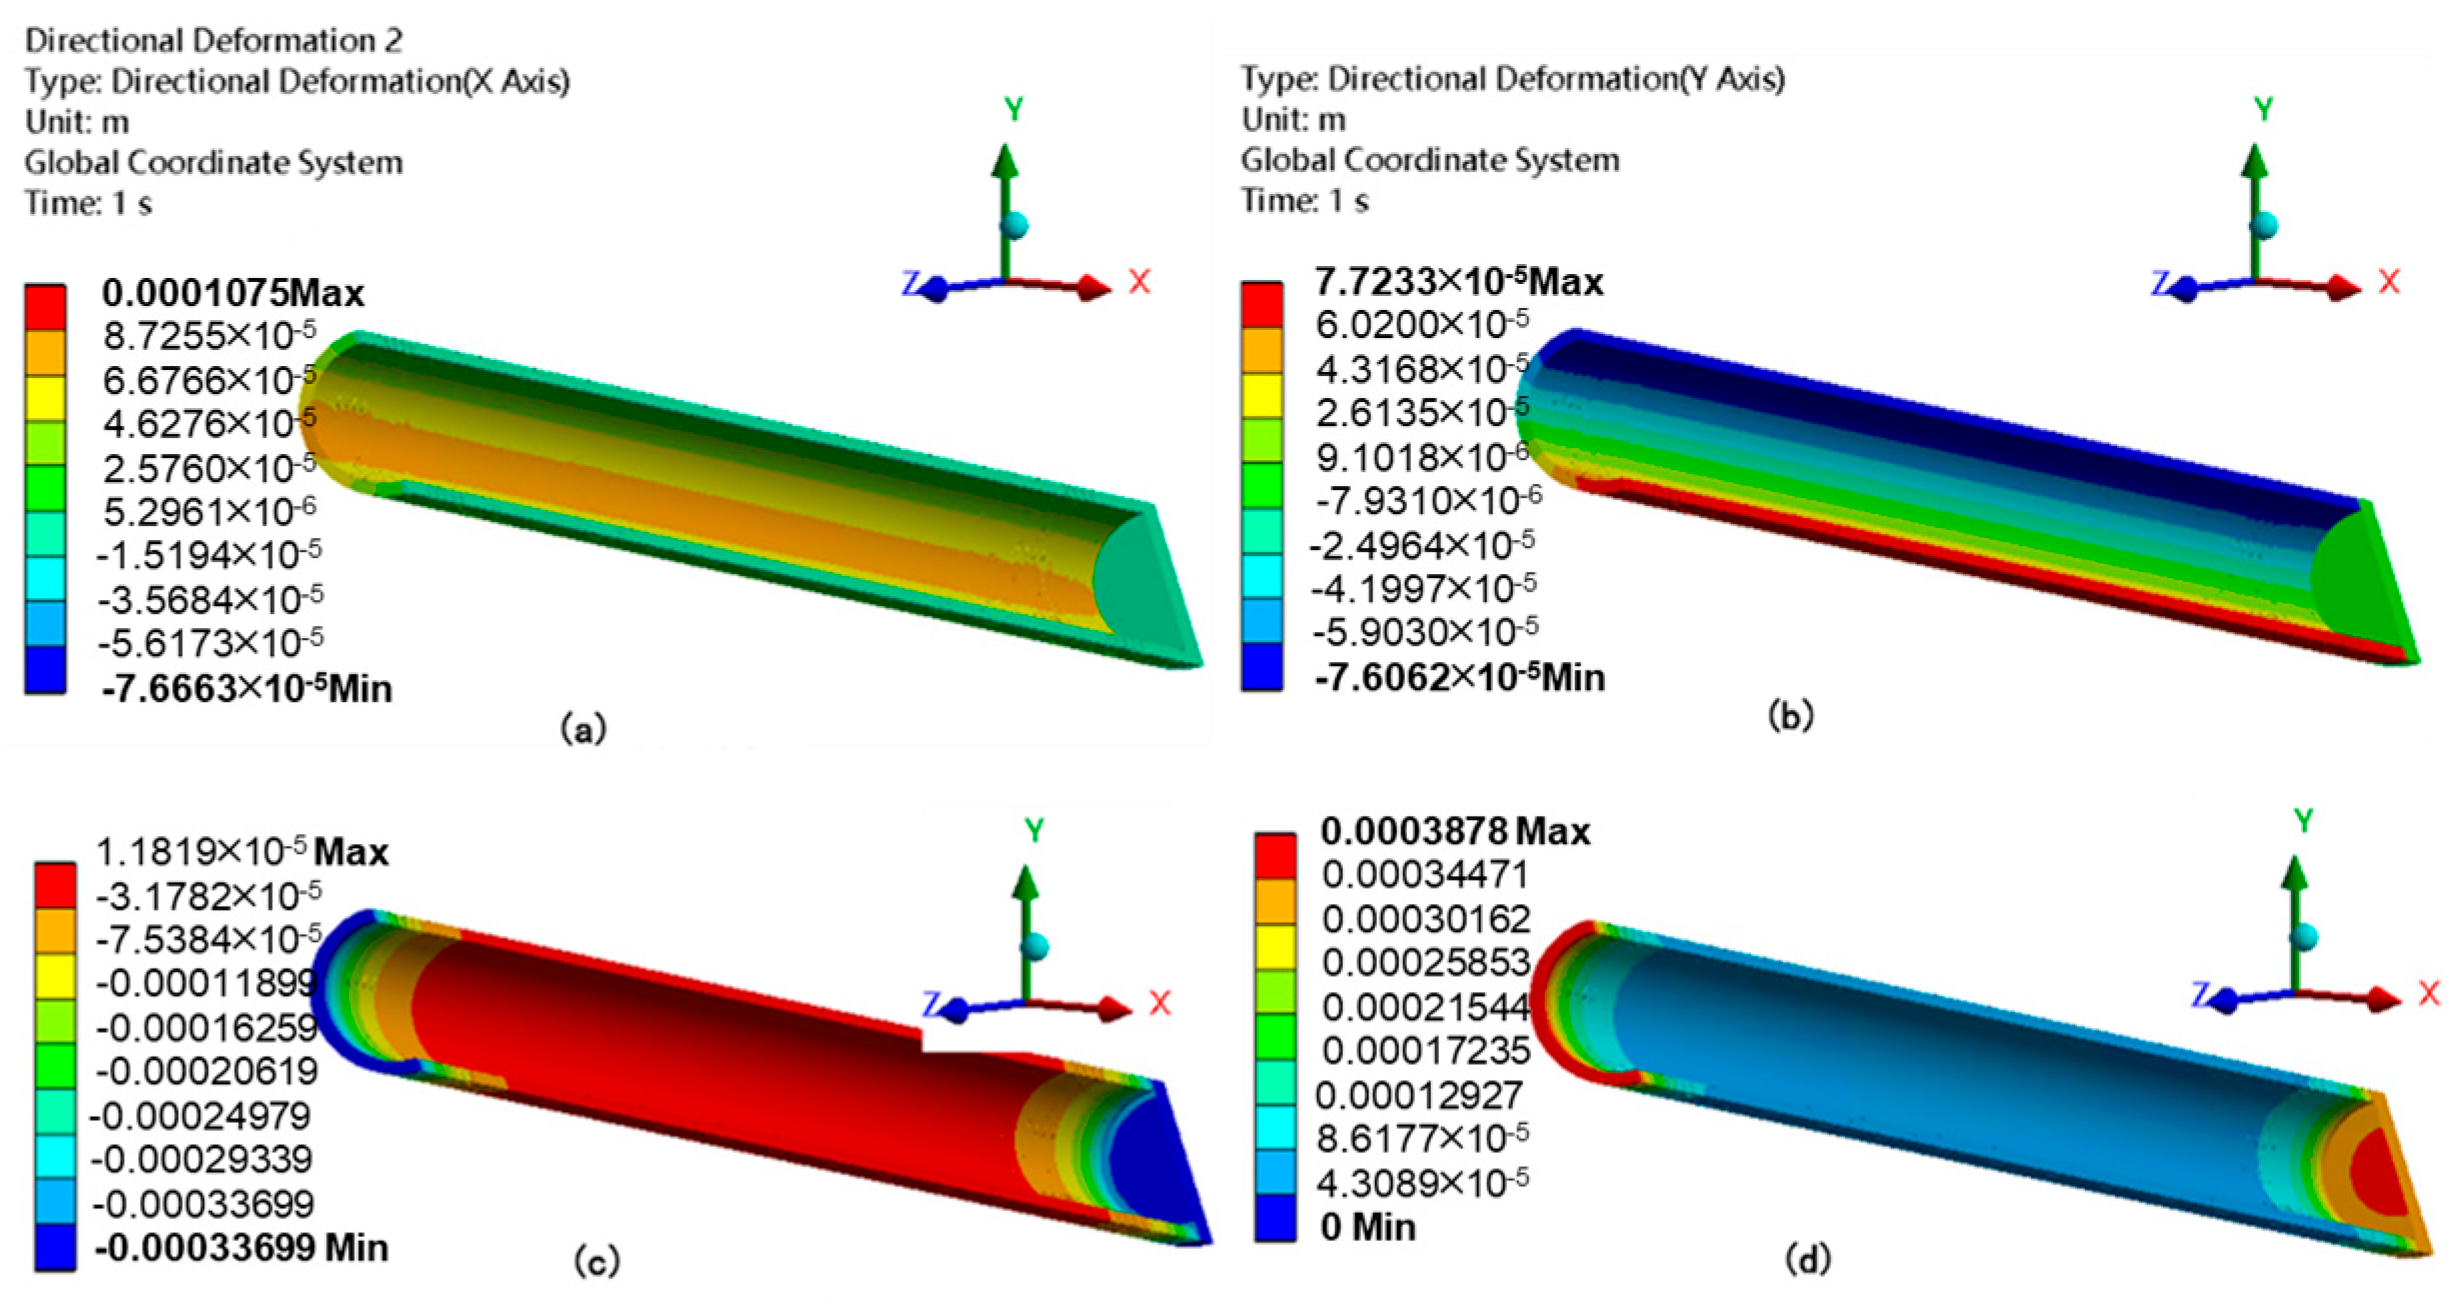
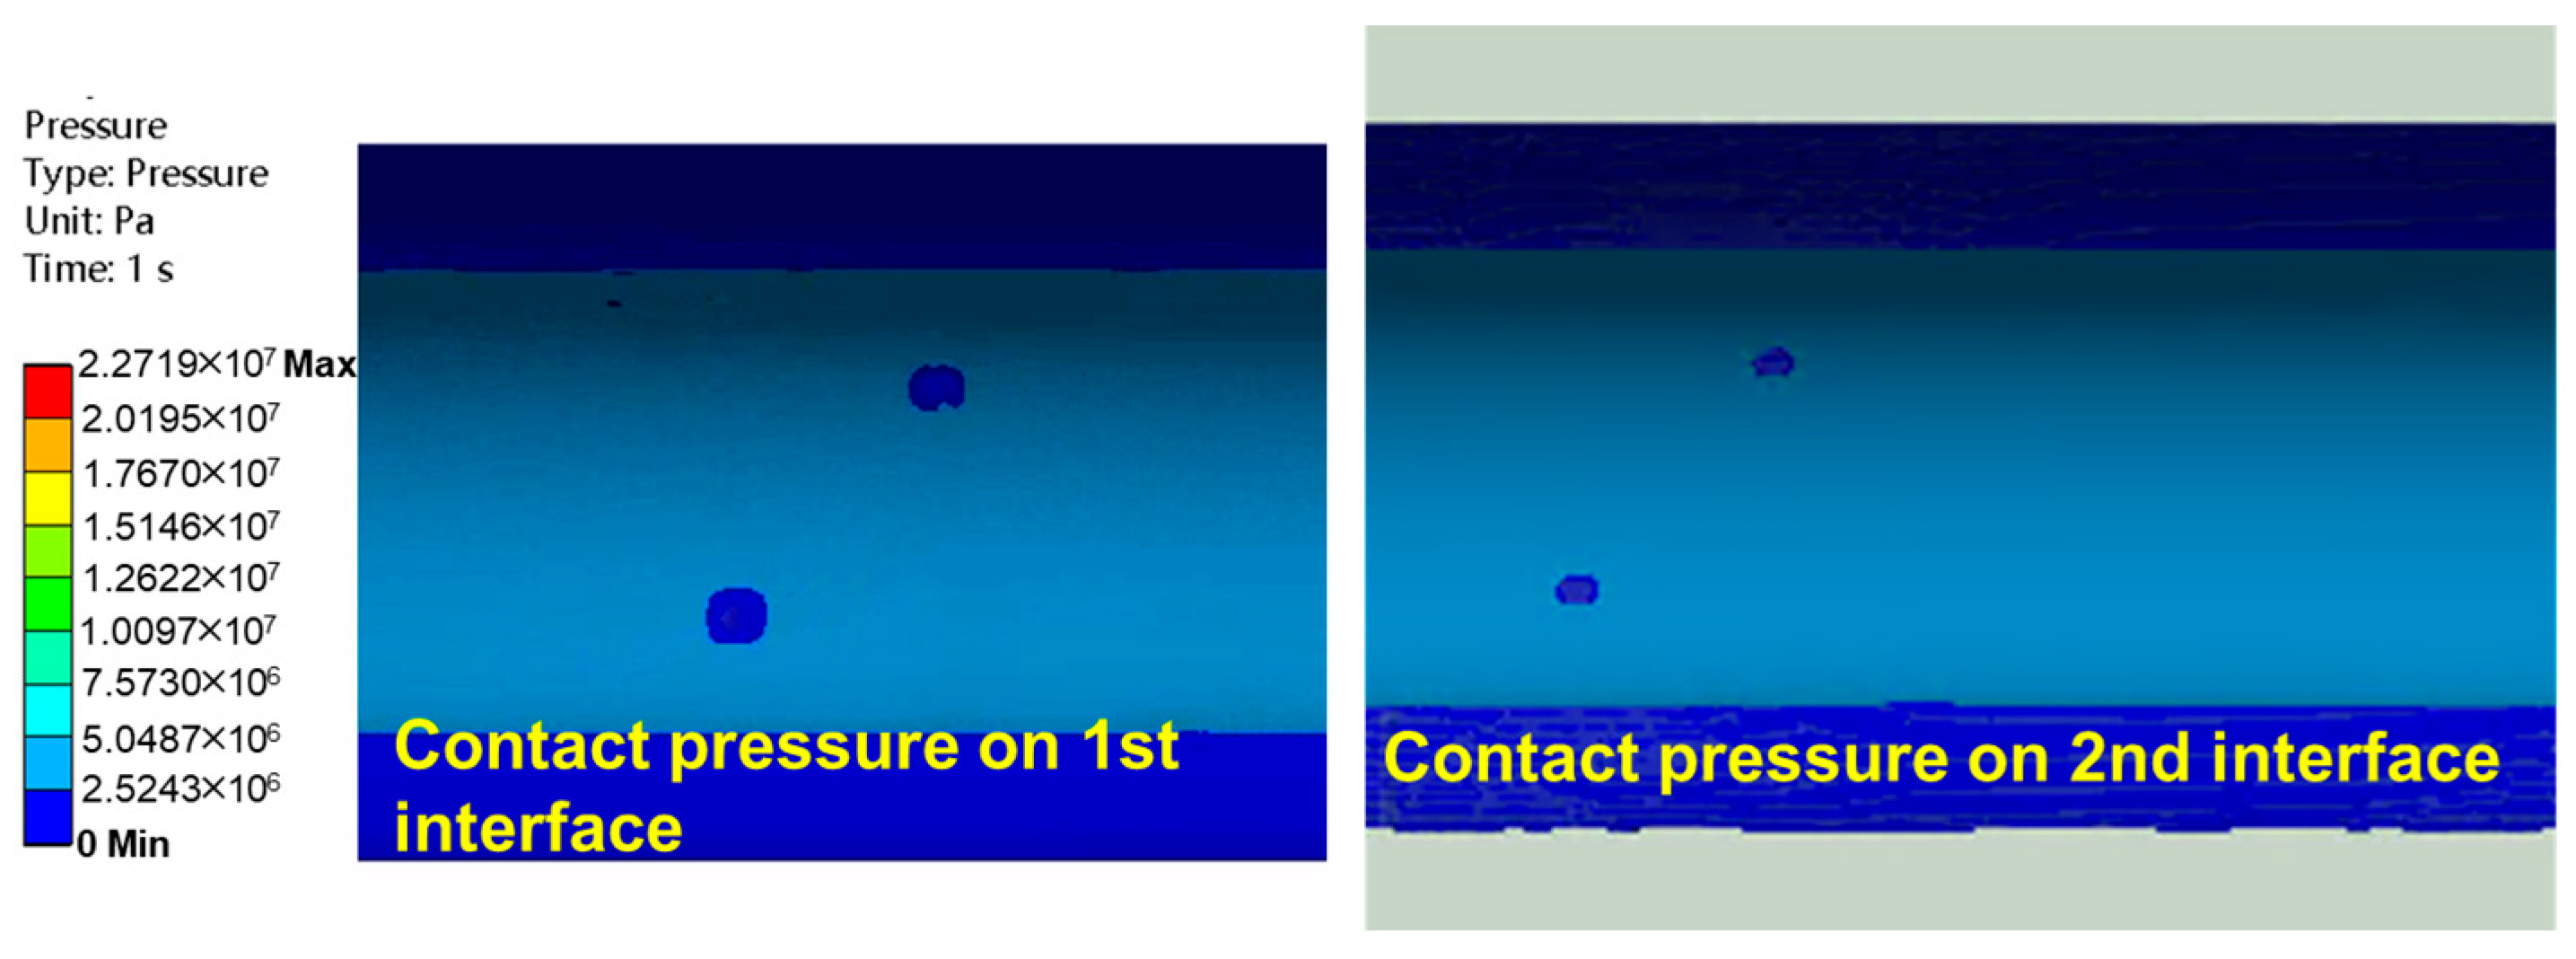
The casing deformation under the action of fracturing fluid is shown in Figure 14. It can be seen that the maximum deformation of the casing is 0.11 mm in the x-direction, 0.078 mm in the y-direction, and 0.38 mm in the z-direction. The maximum deformation is 0.39 mm. This indicates that, without considering formation defects or formation slipping, the maximum casing deformation is 0.39 mm, with the largest deformations occurring at the toe and heel ends. This occurs because the plug, after isolating the cluster bottom, blocks fluid flow to the well bottom, creating a “plugging” effect at its upper end face. The impact force generated by the fracturing fluid on the plug causes axial deformation of the casing. Furthermore, influenced by the throttling and pressure drop effects at the perforations, the contact force distribution between the casing and cement (named as the first interface) and between the cement and formation (named as the second interface) becomes uneven, with the amplitudes significantly reduced compared to at unperforated locations, shown in Figure 15. This indicates a decline in bonding capability at the first and second interfaces, reducing the casing integrity.

5. Conclusions

Based on fluid–structure interaction simulation theory, considering the high flow velocity and high sand ratio conditions in practical engineering applications, this paper studied the stress variation law of a casing under the action of fracturing fluid, and revealed the mechanical mechanism of casing perforation erosion damage. The relevant conclusions of the study are as follows:
(1)
During fracturing, the flow cross-section suddenly shrinks at the entrance of the perforation hole, which contributes to an increase in the fracturing fluid’s velocity up to 323.0 m/s at the hole entrance. This acceleration causes the most severe erosion, with a maximum erosion rate of 2.26 × 10⁻⁵ kg/(m2·s). The numerical simulation results are consistent with field fracturing tests, showing wall thinning and diameter enlargement at the perforation entrance.
(2)
The von Mises stress around the perforation hole is symmetrically distributed along the hole axis. The maximum von Mises stress occurs at the 90° and 270° positions on the inner wall, reaching nearly 750 MPa, which remains below the material yield strength. However, the maximum shear stress reaches 325.18 MPa, exceeding the allowable shear stress of 265.74 MPa (considering a safety factor of 1.25), indicating that shear failure is the primary mechanism initiating erosion damage at the perforation.
(3)
Under the impact of fracturing fluid, the casing experiences deformations of 0.11 mm (x-direction), 0.078 mm (y-direction), and 0.38 mm (z-direction), with a total maximum deformation of 0.39 mm. The contact pressure at the first and second interfaces decreases significantly in perforated regions (e.g., from nearly 15 MPa in non-perforated areas to <5 MPa near perforations), indicating a reduction in cement bonding capacity and a potential risk to casing integrity.

Author Contributions

Conceptualization, H.Z. and C.W.; methodology, H.Z.; software, H.Z.; validation, H.Z. and C.W.; formal analysis, H.Z.; investigation, H.Z.; resources, H.Z.; data curation, C.W.; writing—original draft preparation, H.Z.; writing—review and editing, H.Z.; visualization, H.Z.; supervision, C.W.; project administration, C.W.; funding acquisition, C.W. All authors have read and agreed to the published version of the manuscript.

Funding

This research was funded by the National Natural Science Foundation of China (No. 52288101, No. 52074329).

Data Availability Statement

Data will be made available upon request.

Conflicts of Interest

Author Hui Zhang was employed by the Sinopec North China Company. The remaining authors declare that the research was conducted in the absence of any commercial or financial relationships that could be construed as a potential conflict of interest.

Abbreviations

The following abbreviations are used in this manuscript:
CFDComputational Fluid Dynamics
DPMDiscrete Phase Model
DDPMDense Discrete Phase Model
FSIFluid–Structure Interaction

References

  1. Hu, Q.H.; Cheng, W.; Wang, Z.C.; Shi, Y.Z.; Jia, G.L. Transportation and sealing pattern of the temporary plugging ball at the spiral perforation in the horizontal well section. Pet. Sci. 2024, 21, 3288–3298. [Google Scholar] [CrossRef]
  2. Sinkov, K.; Weng, X.; Kresse, O. Modeling of Proppant Distribution During Fracturing of Multiple Perforation Clusters in Horizontal Wells. In Proceedings of the SPE Hydraulic Fracturing Technology Conference and Exhibition, Virtual, 4–6 May 2021. [Google Scholar] [CrossRef]
  3. Ibrahim, A.F.; Assem, A.; Johnston, T.; Sinky, M.; Adams, M. Comprehensive Workflow for Predicting Multistage Hydraulic Fracturing Well Performance: Analysis of Parent Well Depletion, Fracturing Stage Evaluation, and Post-Fracturing Assessment. In Proceedings of the SPE/AAPG/SEG Unconventional Resources Technology Conference, Houston, TX, USA, 17–19 June 2024. [Google Scholar] [CrossRef]
  4. Li, Q.; Li, Q.C.; Wang, F.L.; Ning, X.; Wang, Y.L.; Bai, B.J. Settling behavior and mechanism analysis of kaolinite as a fracture proppant of hydrocarbon reservoirs in CO2 fracturing fluid. Colloids Surf. A 2025, 724, 137463. [Google Scholar] [CrossRef]
  5. Li, Q. Reservoir Science: A Multi-Coupling Communication Platform to Promote Energy Transformation, Climate Change and Environmental Protection. Reserv. Sci. 2025, 1, 1–2. [Google Scholar] [CrossRef]
  6. Kebert, B.A.; Miskimins, J.L.; Soehner, G.; Hunter, W. Computational Fluid Dynamics Modeling of Pseudotransient Perforation Erosion in a Limited-Entry Completion Cluster. SPE Prod. Oper. 2023, 38, 243–257. [Google Scholar] [CrossRef]
  7. Zhou, L.; Xiong, X.; Li, Y.; Liu, H.; Ding, R. Revolutionary breakthroughs and key theories and technologies in deep coalbed methane development. Nat. Gas Ind. B 2025, 45, 17–30. [Google Scholar] [CrossRef]
  8. He, F.; Dong, Z. Development potential of deep coalbed methane: A case study in the Daniudi gas field, Ordos Basin. Oil Gas Geol. 2022, 43, 277–285. [Google Scholar]
  9. Li, Y. Exploration practices of and recent production breakthroughs in deep middle-rank coalbed methane in the Daniudi gas field, Ordos Basin. Oil Gas Geol. 2024, 45, 1555–1566. [Google Scholar] [CrossRef]
  10. Liu, K.; Wang, Y.; Gao, D.; Li, X.; Zhang, Y. Effects of Hydraulic Fracturing on Horizontal Wellbore for Shale Gas. Acta Pet. Sin. 2016, 37, 406–414. [Google Scholar] [CrossRef]
  11. Wu, B.; Zhang, S.; Li, J.; Pan, Y.; Zeng, D.; Yu, H.; Zhu, H. Simulation of the erosion of casing and perforation under staged sand fracturing conditions in horizontal sections. J. Hydrodyn. 2022, 34, 725–743. [Google Scholar] [CrossRef]
  12. Zhang, F. Prediction of Perforation Erosion During Multi-Cluster Hydraulic Fracturing in Horizontal Wells. Master’s Thesis, Xi’an Shiyou University, Xi’an, China, 2023. [Google Scholar]
  13. Lv, Z.; Zhang, Y.; Shi, S.; Xi, Y.; Dong, J. Downhole behavior characteristics of horizontal well volume fracturing in high-speed erosioncasing. Pet. Drill. Tech. 2024, 52, 86–96. [Google Scholar] [CrossRef]
  14. Cramer, D.; Friehauf, K.; Roberts, G.; Whittaker, J. Integrating Distributed Acoustic Sensing, Treatment-Pressure Analysis, and Video-Based Perforation Imaging To Evaluate Limited-Entry-Treatment Effectiveness. SPE Prod. Oper. 2020, 35, 0730–0755. [Google Scholar] [CrossRef]
  15. Yuan, P.; Zhang, H.; Huang, X.; Han, J.; Zhou, Q.; Alberto, M.; Bao, J. Study of proppant erosion in multistage hydraulic fracturing using computational fluid dynamics modeling. In Proceedings of the SPE Middle East Oil and Gas Show and Conference, Manama, Kingdom of Bahrain, 6–9 March 2017. [Google Scholar] [CrossRef]
  16. Liu, Y.; Qin, L.; Wang, Z.; Dou, Y. Numerical Simulation of Perforation Hole Erosion during Cased Hole Fracturing. Chin. Pet. Mach. 2015, 43, 66–69. [Google Scholar]
  17. Shi, S.Z.; Zhang, S.S.; Cheng, N.; Tian, G.; Zeng, D.Z.; Yu, H.Y.; Wang, X.; Zhang, X. Erosion characteristics and simulation charts of sand fracturing casing perforation. Pet. Sci. 2023, 20, 3638–3653. [Google Scholar] [CrossRef]
  18. Wang, Z.; Yang, G.; Weng, D.; Gao, Y.; Li, S. Dynamic Evolution of Perforation Erosion During Sand Fracturing Based on CFD-DEM Simulation. J. Eng. Thermophys. 2024, 45, 1031–1037. Available online: https://jeth.magtechjournal.com/EN/Y2024/V45/I4/1031#2 (accessed on 30 September 2025).
  19. Sakaida, S.; Hamanaka, Y.; Zhu, D.; Hill, A.D.; Kerr, E.; Estrada, E.; Scofield, R.; Johnson, A. Evaluation of Fluid Distribution and Perforation Erosion in Multistage Fracture Treatment. SPE J. 2024, 29, 5316–5331. [Google Scholar] [CrossRef]
  20. Aune, V.; Valsamos, G.; Casadei, F. Coupled Simulations of Extreme Fluid-Structure Dynamics. In Proceedings of the 10th edition of the International Conference on Computational Methods for Coupled Problems in Science and Engineering, Chania, Crete, Greece, 5–7 June 2023. [Google Scholar] [CrossRef]
  21. Nadda, R.; Prakash, R.; Bhusan, D.D.; Donnelly, R.F. Incorporating fluid-structure interactions for modelling of pyramidal hollow microneedles for transdermal drug delivery. J. Drug Deliv. Sci. Technol. 2025, 114, 107561. [Google Scholar] [CrossRef]
  22. Budiman, O.; Alajmei, S.; Bahri, A.; Aljawad, M.S.; Miskimins, J. A Review of Proppant Transport and Distribution in Slickwater Fracturing. Arab. J. Sci. Eng. 2025, 50, 5303–5322. [Google Scholar] [CrossRef]
  23. Segantine, E.; Souza, T.; Ribeiro, D.; Nascimento, A. Computational Fluid Dynamics modeling applied to drilling and cleaning operations: A science mapping analysis. ChemRxiv 2024. [Google Scholar] [CrossRef]
  24. Hojjati, S.; Pouraria, H.; Jeon, S. Numerical Modeling of Erosion in Dense Slurry Flows. In Proceedings of the 15th ISRM Congress, Salzburg, Austria, 10–13 October 2023. [Google Scholar]
  25. Huang, J.; Marteen, K.; Hao, Y.; Settgast, R.R.; White, J.A. A Continuum Model for Simulating Proppant Transport and Fluid Flow in Hydraulic Fractures. In Proceedings of the 55th U.S. Rock Mechanics/Geomechanics Symposium, Virtual, 18–25 June 2021. [Google Scholar]
  26. Chochua, G.G.; Parsi, M.; Zhang, Y.; Zhang, J.; Sedrez, T.A.; Karimi, S.; Darihaki, F.; Edwards, J.; Arabnejad, H.; Agrawal, M.; et al. A Review of Various Guidelines for Predicting Solid Particle Erosion Using Computational Fluid Dynamics Codes. In Proceedings of the CORROSION 2020, Physical Event Cancelled, 14–18 June 2020. [Google Scholar]
  27. Roberts, G.; Whittaker, J.; McDonald, J.; Paxson, T. Proppant Distribution Observations from 20,000+ Perforation Erosion Measurements. In Proceedings of the SPE Hydraulic Fracturing Technology Conference and Exhibition, The Woodlands, TX, USA, 4–6 February 2020. [Google Scholar] [CrossRef]
  28. Qu, H.; Chen, X.; Liu, X. Particle-fluid flow and distribution in a horizontal pipe with side holes using experiment and numerical simulation. Powder Technol. 2023, 417, 118245. [Google Scholar] [CrossRef]
Figure 1. Downhole television-measured erosion morphology of casing perforations [15].
Modelling 06 00121 g001
Figure 2. Schematic diagram of CFD model and mesh generation.
Modelling 06 00121 g002
Figure 3. Schematic diagram of formation–cement–casing assembly and mesh generation.
Modelling 06 00121 g003
Figure 4. Schematic diagram of experimental setup of Qu et al. [28].
Modelling 06 00121 g004
Figure 5. Comparison of numerical results with experimental results from Qu et al. [28]: (a) comparison of proppant transport; (b) comparison of proppant transport efficiency.
Modelling 06 00121 g005
Figure 6. Fluid velocity contour near perforation holes: (a) velocity streak, (b) velocity contour (Zoomed-in view of the red box in Figure 6a).
Modelling 06 00121 g006
Figure 7. (a) Perforation erosion rate contour and (b) field test perforation erosion morphology [16].
Modelling 06 00121 g007
Figure 8. A contour plot of the stress distribution of the casing.
Modelling 06 00121 g008
Figure 9. Hole angle identification (both 90° and 270° are located along the casing axis, and 90° points towards the toe direction).
Modelling 06 00121 g009
Figure 10. Comparison of maximum stress on inner and outer walls of casing hole.
Modelling 06 00121 g010
Figure 11. Casing principal stress distribution contour.
Modelling 06 00121 g011
Figure 12. Shear stress distribution contour.
Modelling 06 00121 g012
Figure 13. Shear stress distribution curve.
Modelling 06 00121 g013
Figure 14. Casing displacement contour: deformation in the (a) x-, (b) y-, and (c) z-directions, and (d) the total deformation.
Modelling 06 00121 g014
Figure 15. Contour plot of contact pressure on 1st and 2nd interfaces.
Modelling 06 00121 g015
Table 1. Model dimensions and material parameters.
TypeDensity
(kg/m3)
Elastic Modulus (GPa)Poisson’s
Ratio
Yield Strength (MPa)Tensile Strength (MPa)Shear Strength (MPa)
Casing78002100.30862.001050.00332.17
Cement19005.000.1145.004.89--
Formation18005.200.22------
Disclaimer/Publisher’s Note: The statements, opinions and data contained in all publications are solely those of the individual author(s) and contributor(s) and not of MDPI and/or the editor(s). MDPI and/or the editor(s) disclaim responsibility for any injury to people or property resulting from any ideas, methods, instructions or products referred to in the content.