Article

Investigation of Aerodynamic Pressure Characteristics Inside and Outside a Metro Train Traversing a Tunnel in High-Altitude Regions

1
School of Thermal Engineering, Shandong Jianzhu University, Jinan 250101, China
2
Centre for Building, Construction & Tropical Architecture (BuCTA), Faculty of Built Environment, Universiti Malaya, Kuala Lumpur 50603, Malaysia
*
Authors to whom correspondence should be addressed.
Modelling 2025, 6(4), 113; https://doi.org/10.3390/modelling6040113
Submission received: 24 August 2025 / Revised: 19 September 2025 / Accepted: 23 September 2025 / Published: 24 September 2025
(This article belongs to the Special Issue Recent Advances in Computational Fluid Mechanics)

Abstract

The numerical method was employed to analyze the transient pressure characteristics of a metro train passing through a tunnel in high-altitude regions. The transient pressure evolution inside and outside the train under varying ambient pressures is analyzed and compared. The findings indicate that while ambient pressure minimally impacts the waveform of the exterior transient pressure, it significantly influences the peak value. Specifically, as ambient pressure rises, the maximum transient pressure (P-max) and the peak-to-peak transient pressure (ΔP) on the train’s exterior surface increase linearly, whereas the minimum transient pressure (P-min) decreases linearly. Moreover, this study analyzed pressure changes within the metro train under varying ambient pressures to assess their impact on passengers’ ear comfort. The trend of pressure peak reduction and delay inside the metro train with a certain degree of airtightness remains well aligned for different ambient pressures. In areas of high altitude with low atmospheric pressure, the requirements for the tightness performance of the train are lower.

1. Introduction

The metro system, known for its large capacity, high speed, safety, punctuality, environmental benefits, energy efficiency, and optimized land use [1], has emerged as an effective solution to urban land shortages and traffic congestion [2]. The advancement of metro systems has led to their implementation in numerous Chinese cities, including high-altitude locations like Kunming (80.82 kPa), Lanzhou (84.32 kPa), and Guiyang (88.78 kPa) [3]. As the altitude increases, the air becomes thinner and atmospheric pressure decreases. The impact of low ambient pressure on aerodynamic pressure is not yet clear and should not be ignored.
The evolution of aerodynamic pressure induced by trains is closely linked to their speed. Current urban metro systems typically operate at speeds below 100 km/h, with a blocking rate of approximately 0.5 [2]. The increasing demand for rapid transportation is driving the continuous rise in the maximum operating speed of metro trains. For instance, the maximum operating speed of Chengdu’s Line 17 and Line 18 has reached 140 km/h [4]. High-speed blunt-headed metro trains in tunnels with significant blockage ratios generate intense pressure waves, potentially causing tinnitus, earaches, and other discomforts for passengers [5]. It is essential to comprehend the aerodynamic impact of a metro train traversing a tunnel at different ambient pressures and its effects on human comfort.
Trains traversing tunnels encounter various aerodynamic challenges, including complex slipstreams [6,7,8], piston wind [9,10,11], aerodynamic drag [12,13], pressure waves [14,15,16], micro-pressure waves at tunnel exits [17,18], and passenger discomfort [19,20]. These effects have been extensively documented in research on high-speed railway train/tunnel systems [21,22,23]. Extensive research has investigated the aerodynamic impacts and contributing variables of trains traversing tunnels utilizing theoretical analysis, moving-model experiments, field measurements, and numerical simulations. Key factors affecting the aerodynamics are train length and coupling method [24,25], nose length [26], tunnel portal geometry [27,28], cross-section [29,30], crosswind at the entrance [31,32], localized high temperatures [33], and ambient wind speed [34]. These studies enhance our understanding of aerodynamic issues in train/tunnel systems and advance the development of aerodynamic pressure. At the same time, it also provides a solid theoretical and methodological foundation for the aerodynamic research of the metro system.
Compared with the high-speed rail system, on the one hand, the larger blockage ratio of the metro system and the blunt-headed design of the train will cause more serious aerodynamic effects [35,36]. On the other hand, an increased number of doors in metro train carriages adversely affects the airtightness [35]. These features of the metro system could exacerbate passenger discomfort. The advancement of metro systems and increased train speeds in recent years have highlighted aerodynamic issues associated with metro trains. Huang et al. [37] found circular tunnel cross-sections yield lower pressure peaks due to smaller perimeters, making them ideal for engineering applications. Yang et al. [2] investigated the aerodynamic characteristics of subway trains traveling at various speeds in a tunnel between two platforms. Research indicates that the aerodynamic behavior within metro tunnels varies significantly during train acceleration and deceleration phases. Furthermore, the piston wind induced by train movement represents a potentially utilizable high-grade energy resource. Zeng et al. [38] and Zhou et al. [4] analyzed the impact of transient pressure generated by subway trains on the platform screen doors (PSD) of subway stations. The peak pressure (including positive and negative pressure) acting on the platform screen door is proportional to the square of the train speed. Xiong et al. [5] identified portals, shafts, and speed as key factors influencing rapid pressure changes inside and outside subway trains. Field measurement data were used to assess how pressure changes affect passengers’ ear comfort. Evaluating passenger ear comfort based on internal pressure changes at various time scales should account for the effects of tunnel portals, ventilation shafts, and metro train operation direction. Li et al. [39] employed numerical simulation methods to investigate pressure fluctuations both inside and outside trains during transit through tunnels and stations, subsequently analyzing passenger comfort levels under various operational conditions. Xiong et al. [40] investigated the effect of tunnel length on pressure variations within the tunnel and trains, establishing a theoretical model for the most unfavorable tunnel length based on internal pressure changes at the train’s head and tail.
The aerodynamic challenges at high altitudes characterized by low environmental pressure have recently garnered some scholarly attention. Liu et al. [41] employed a three-dimensional compressible unsteady turbulence model to investigate the effects of high altitude and temperature on pressure waves generated by high-speed trains operating in long tunnels. The results indicate that as altitude increases, the pressure waveforms on the tunnel and train surfaces, as well as the pressure differential across the train, remain consistent when trains cross and meet within tunnels, while the peak value decreases linearly. Liu et al. [35] investigated the effects of pressure waves generated by subway trains traversing tunnels under varying environmental pressures at high altitudes on the dynamic pressure exerted on tunnel walls. The effect of environmental pressure on pressure waveforms is minimal, yet it significantly affects the peak pressure values. The pressure increment resulting from the initial compression wave and friction effects exhibits a linear relationship with increasing environmental pressure. However, they failed to account for the pressure variations within the train at high-altitude and their subsequent effects on passenger comfort.
In summary, numerous studies on the aerodynamic effects of high-speed railways have prompted scholars to investigate similar effects in metro systems. However, the research on the effect of a low-pressure ambient on train-induced aerodynamics in high-altitude areas is still insufficient. This study investigates the transient pressure characteristics inside and outside metro trains as they pass through tunnels, focusing on the effects of varying ambient pressures on aerodynamic issues. Using the validated numerical simulation method, the transient pressure evolution on the train exterior surface under varying ambient pressure conditions was investigated. Then, the evolution of the interior pressure of the train was obtained by converting the exterior pressure change through the definition formula of the sealing indexes. The comfort of passengers’ ears was evaluated by transient changes in the interior pressure. The research findings will function as a reference for designing metro operations and enhancing passenger comfort in high-altitude regions.

2. Numerical Simulation

2.1. Geometry Model

Figure 1 illustrates the metro train and tunnel model utilized in this study. A standard A-type metro train, consisting of six cars, measures 137 m in length, 3.8 m in height, and 3.0 m in width, with a maximum cross-sectional area of about 9.78 square meters. Figure 1b illustrates a typical tunnel measuring 1000 m in length, with a height of 5 m and a width of 5.6 m, resulting in a cross-sectional area of approximately 23.18 square meters. Figure 1a illustrates the arrangement of measuring points on the train surface. Eight measuring points, labeled TR1 to TR8 from front to rear, are installed on the train surface, with TR1 at the front and TR8 at the rear. The measuring points TR2–TR7 are located at the center of the side door of the train. As both the train and tunnel are symmetrical, measurement points are installed on one side of the train surface.

2.2. Numerical Domain and Boundary Conditions

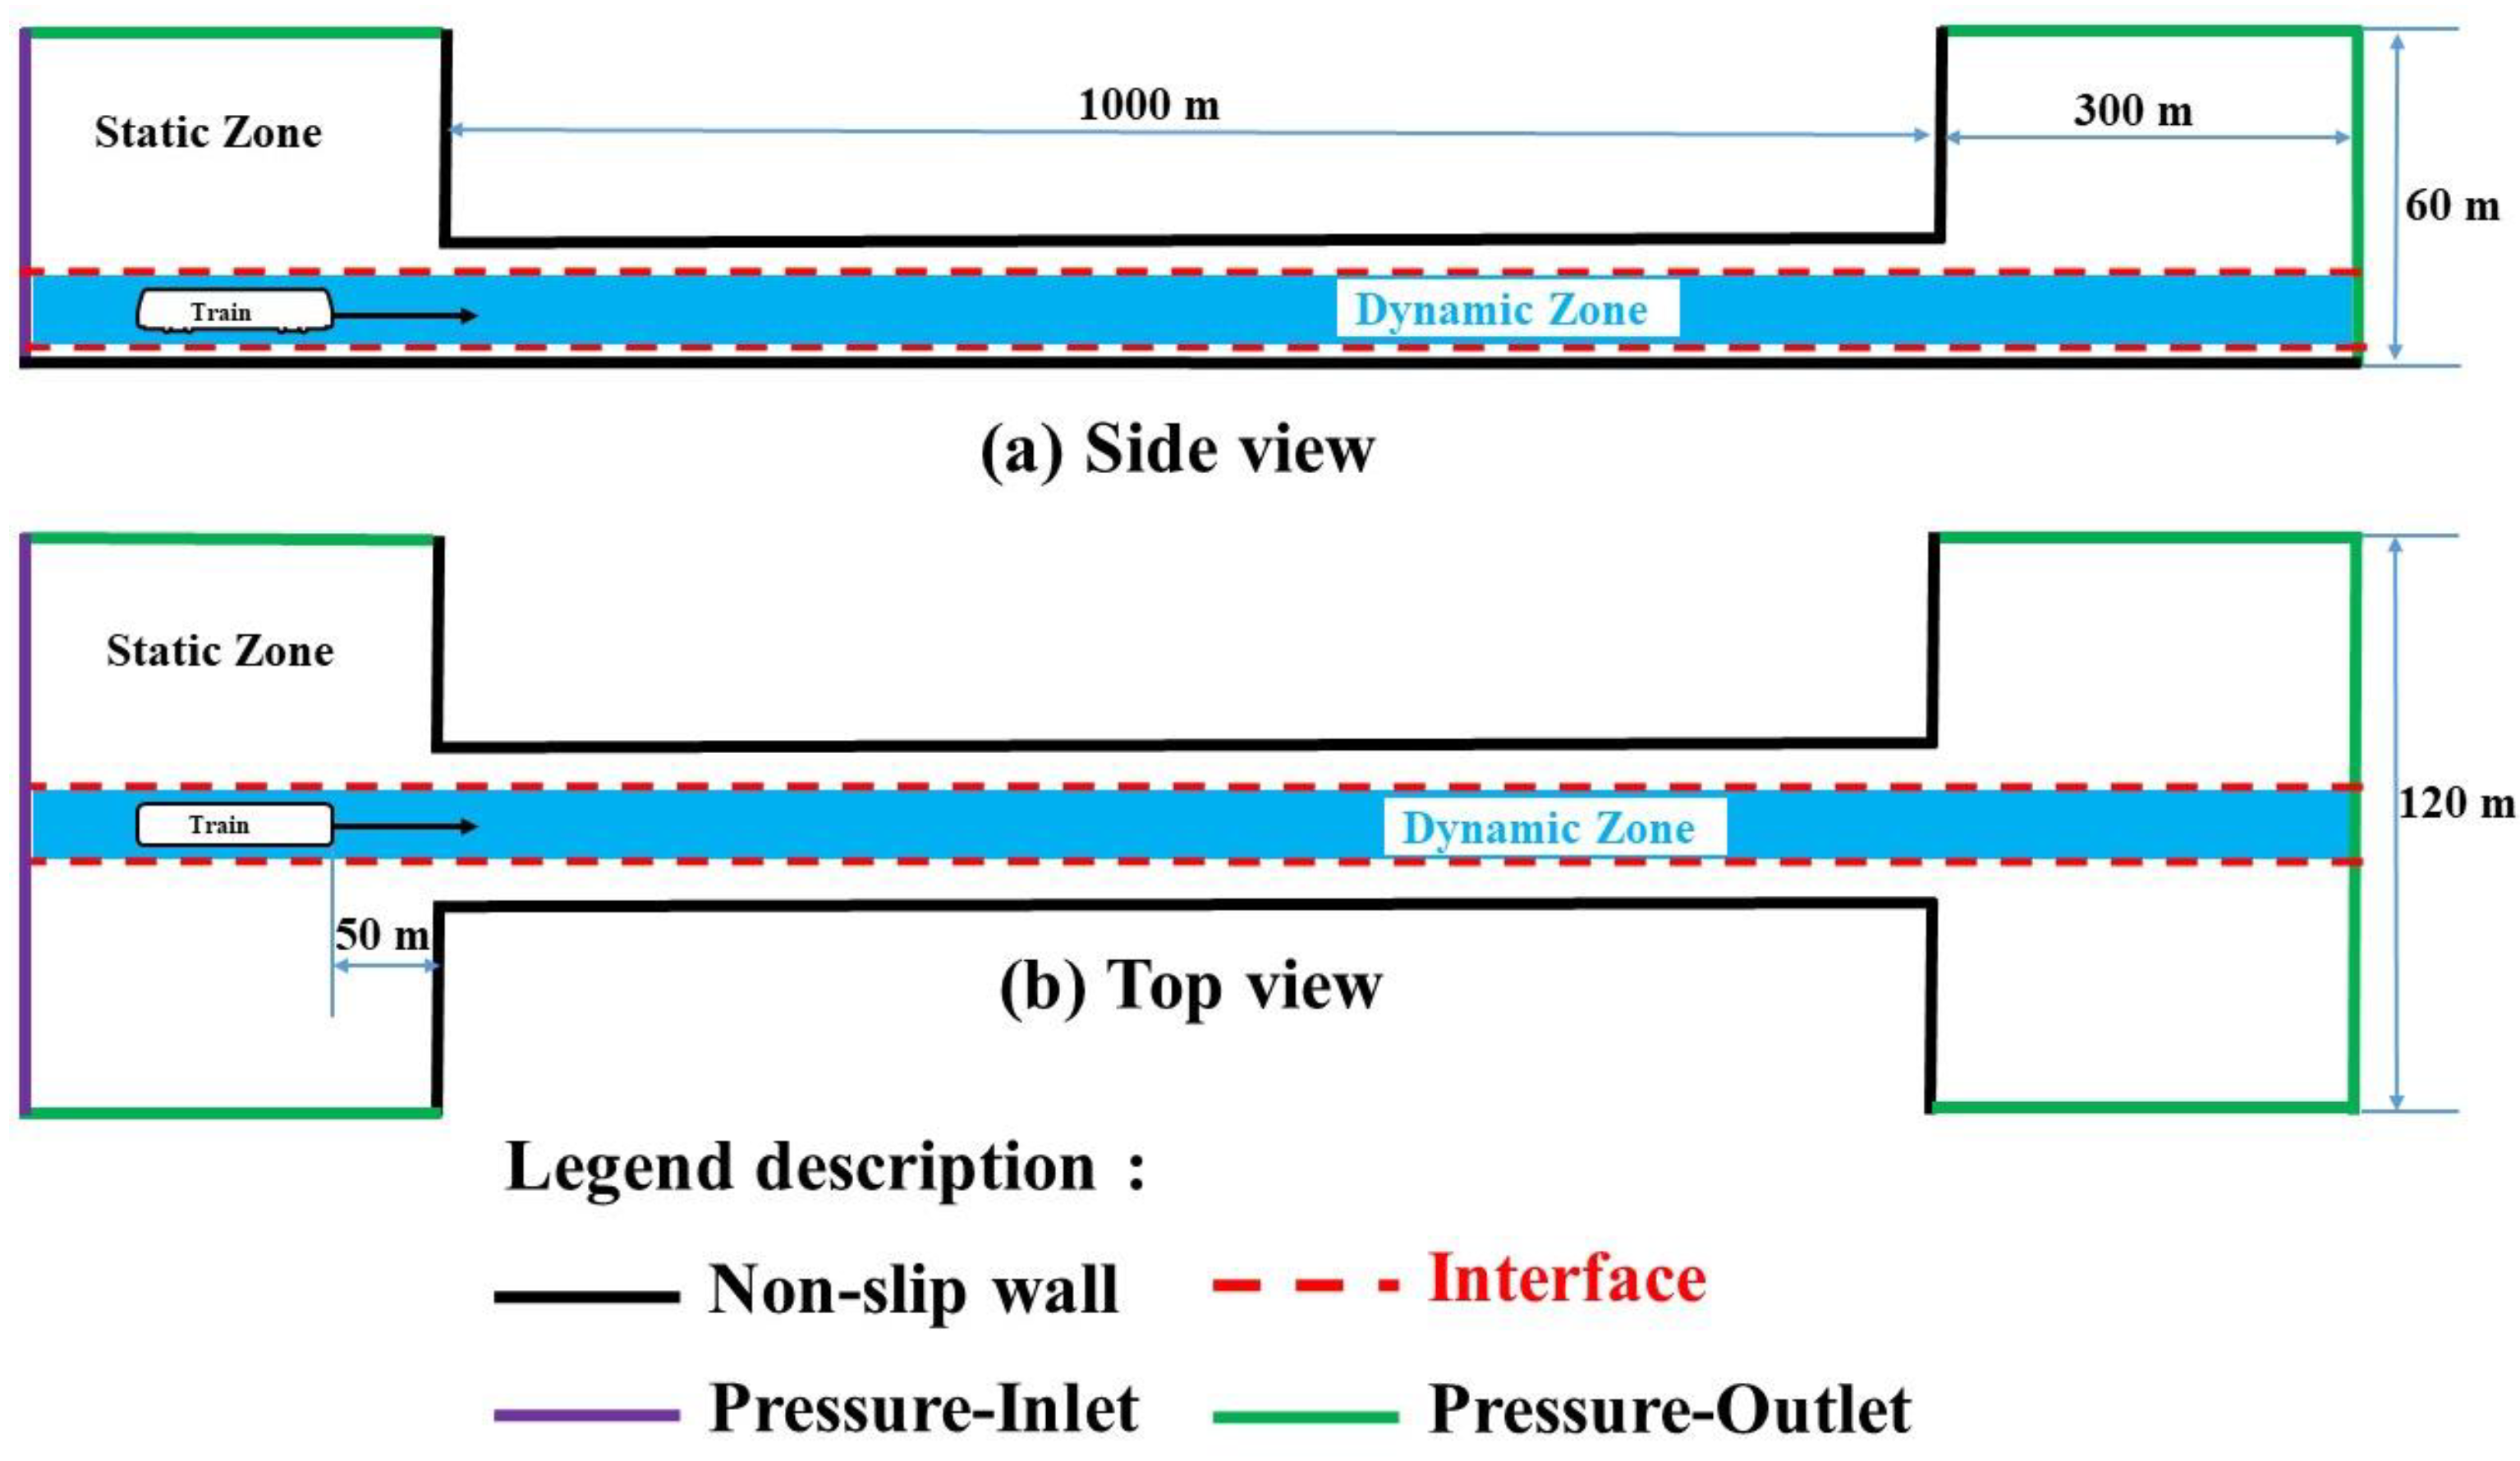
Figure 2 illustrates the computational domain along with the boundary conditions utilized in this study. The entire computational domain contains two regions connected by an “Interface”, namely, dynamic and static regions [42]. The dynamic region encompasses the train and its surrounding air (as indicated by the blue filled area in Figure 2), while the remaining area is considered static. The computational domain division strategy employed in this study has been effectively utilized in previous research, yielding positive outcomes [43,44,45]. The layering dynamic mesh technique simulates the train body’s relative motion to the ground [46]. Detailed boundary conditions settings are given in Figure 2. The surface of the metro train adopts a non-slip wall, which is initially located 50 m away from the tunnel entrance. The metro train speed is capped at 100 km/h (27.778 m/s), as per the Chinese National Standard GB 50157-2013: Code for design of metro [47]. The simulation used a physical time step of 0.005 s, with 50 iterations per step to ensure stability. The CFL number used in the simulation is the default value. At 50 iteration steps, the residual of each turbulence equation is at least 10−3 at each time step, and the residual of the energy equation reaches 10−6. To investigate the effects of train-induced transient pressure, five low ambient pressures ranging from 50 kPa to 90 kPa at 10 kPa intervals, along with normal atmospheric pressure (control group, 101 kPa), were selected. It should be noted that although ambient temperatures may vary at different altitudes, it is acceptable to maintain an ambient temperature of 300 K based on control variable considerations [48].

2.3. Numerical Mesh

Various meshing algorithms were employed to discretize the train and tunnel regions, enhancing mesh distribution. A tetrahedral mesh was used to discretize the area around the metro train’s body, accommodating its bogies and other complex components [37]. The remaining domain is divided into hexahedral meshes. To prevent mesh-related influences on numerical simulation outcomes, three mesh configurations—coarse, medium, and fine—are created based on the mesh density of the train surface and tunnel section. The grid cells number 2.55, 3.65, and 4.35 million, respectively. Figure 3 illustrates the pressure-time history at monitoring point TR1, which was chosen for comparison. The findings indicate that the medium and fine grid curves closely align, whereas the coarse grid results significantly deviate. Therefore, the medium grid was adopted in the current work. In the tunnel area, the hexahedral grid measures 1 m in the x-direction and up to 0.2 m in the y- and z-directions. The train surface grid has a maximum size of 0.1 m. The y+ value on the surface of the train exceeds 30. Together, these grid cells total over 3.65 million elements, as illustrated in Figure 4.

2.4. Solver Settings

The 3D compressible URANS (unsteady Reynolds-averaged Navier–Stokes) method [6,49,50], employing the RNG k–ε turbulence model, is extensively applied for simulating trains in tunnels. This research utilized ANSYS Fluent V. 17.2 for computational fluid dynamics (CFD) analysis. Previous research [2,26,42,51] has demonstrated that the RNG k–ε turbulence model used in this study reliably and accurately addresses tunnel aerodynamic effects. Further details regarding the numerical simulation solver settings are presented in Table 1 and our previous research [35].

3. Results and Discussion

3.1. Method Validation

3.1.1. Overview of Experimental Studies in the Literature

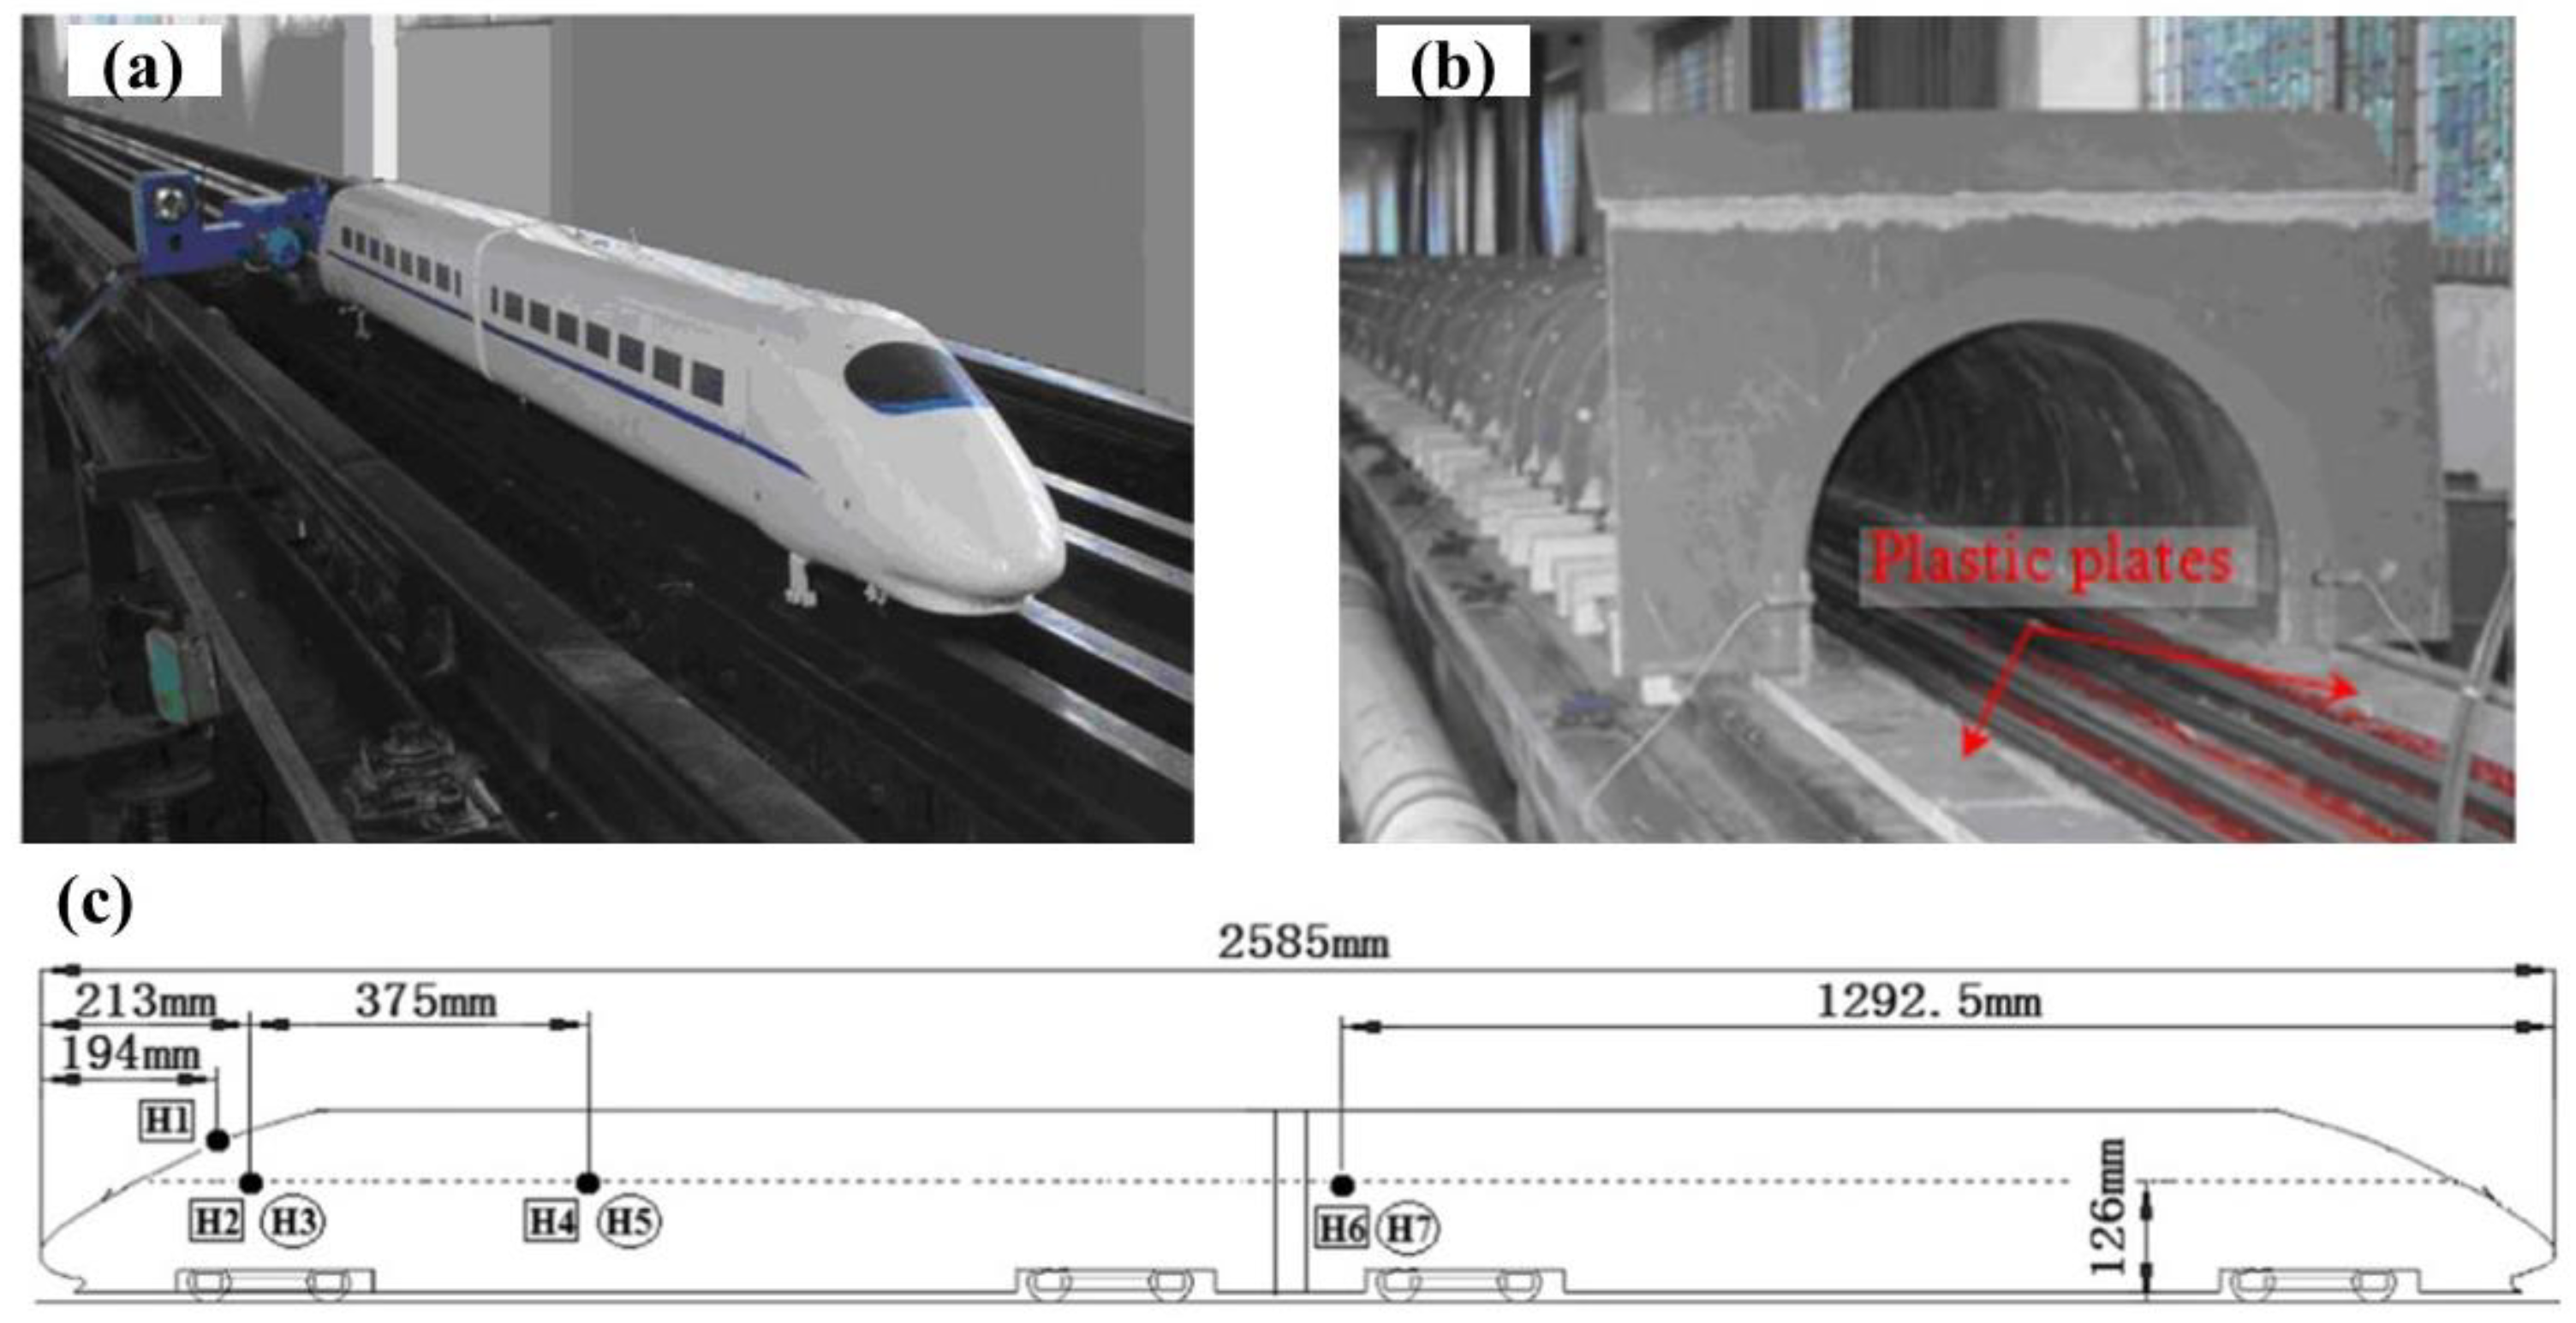
The moving model experimental data from Zhang et al. [27] are selected to validate the accuracy of the current numerical simulation method. The aerodynamic characteristics of the inclined tunnel entrance’s impact on the train tunnel system were investigated utilizing a 1:20 scaled physical model. In this study, numerical simulation techniques were employed to replicate the experimental analysis of the end wall tunnel entrance configuration (Figure 5b). Figure 5 illustrates the model train and tunnel layout, along with the train surface measurement points used in the experiment. Measuring points H3, H5, and H7 are positioned on the train’s side adjacent to the tunnel surface. Table 2 provides the detailed dimensions of the model. Further information is available in their original reports [27].

3.1.2. Numerical Simulation vs. Experimental Results

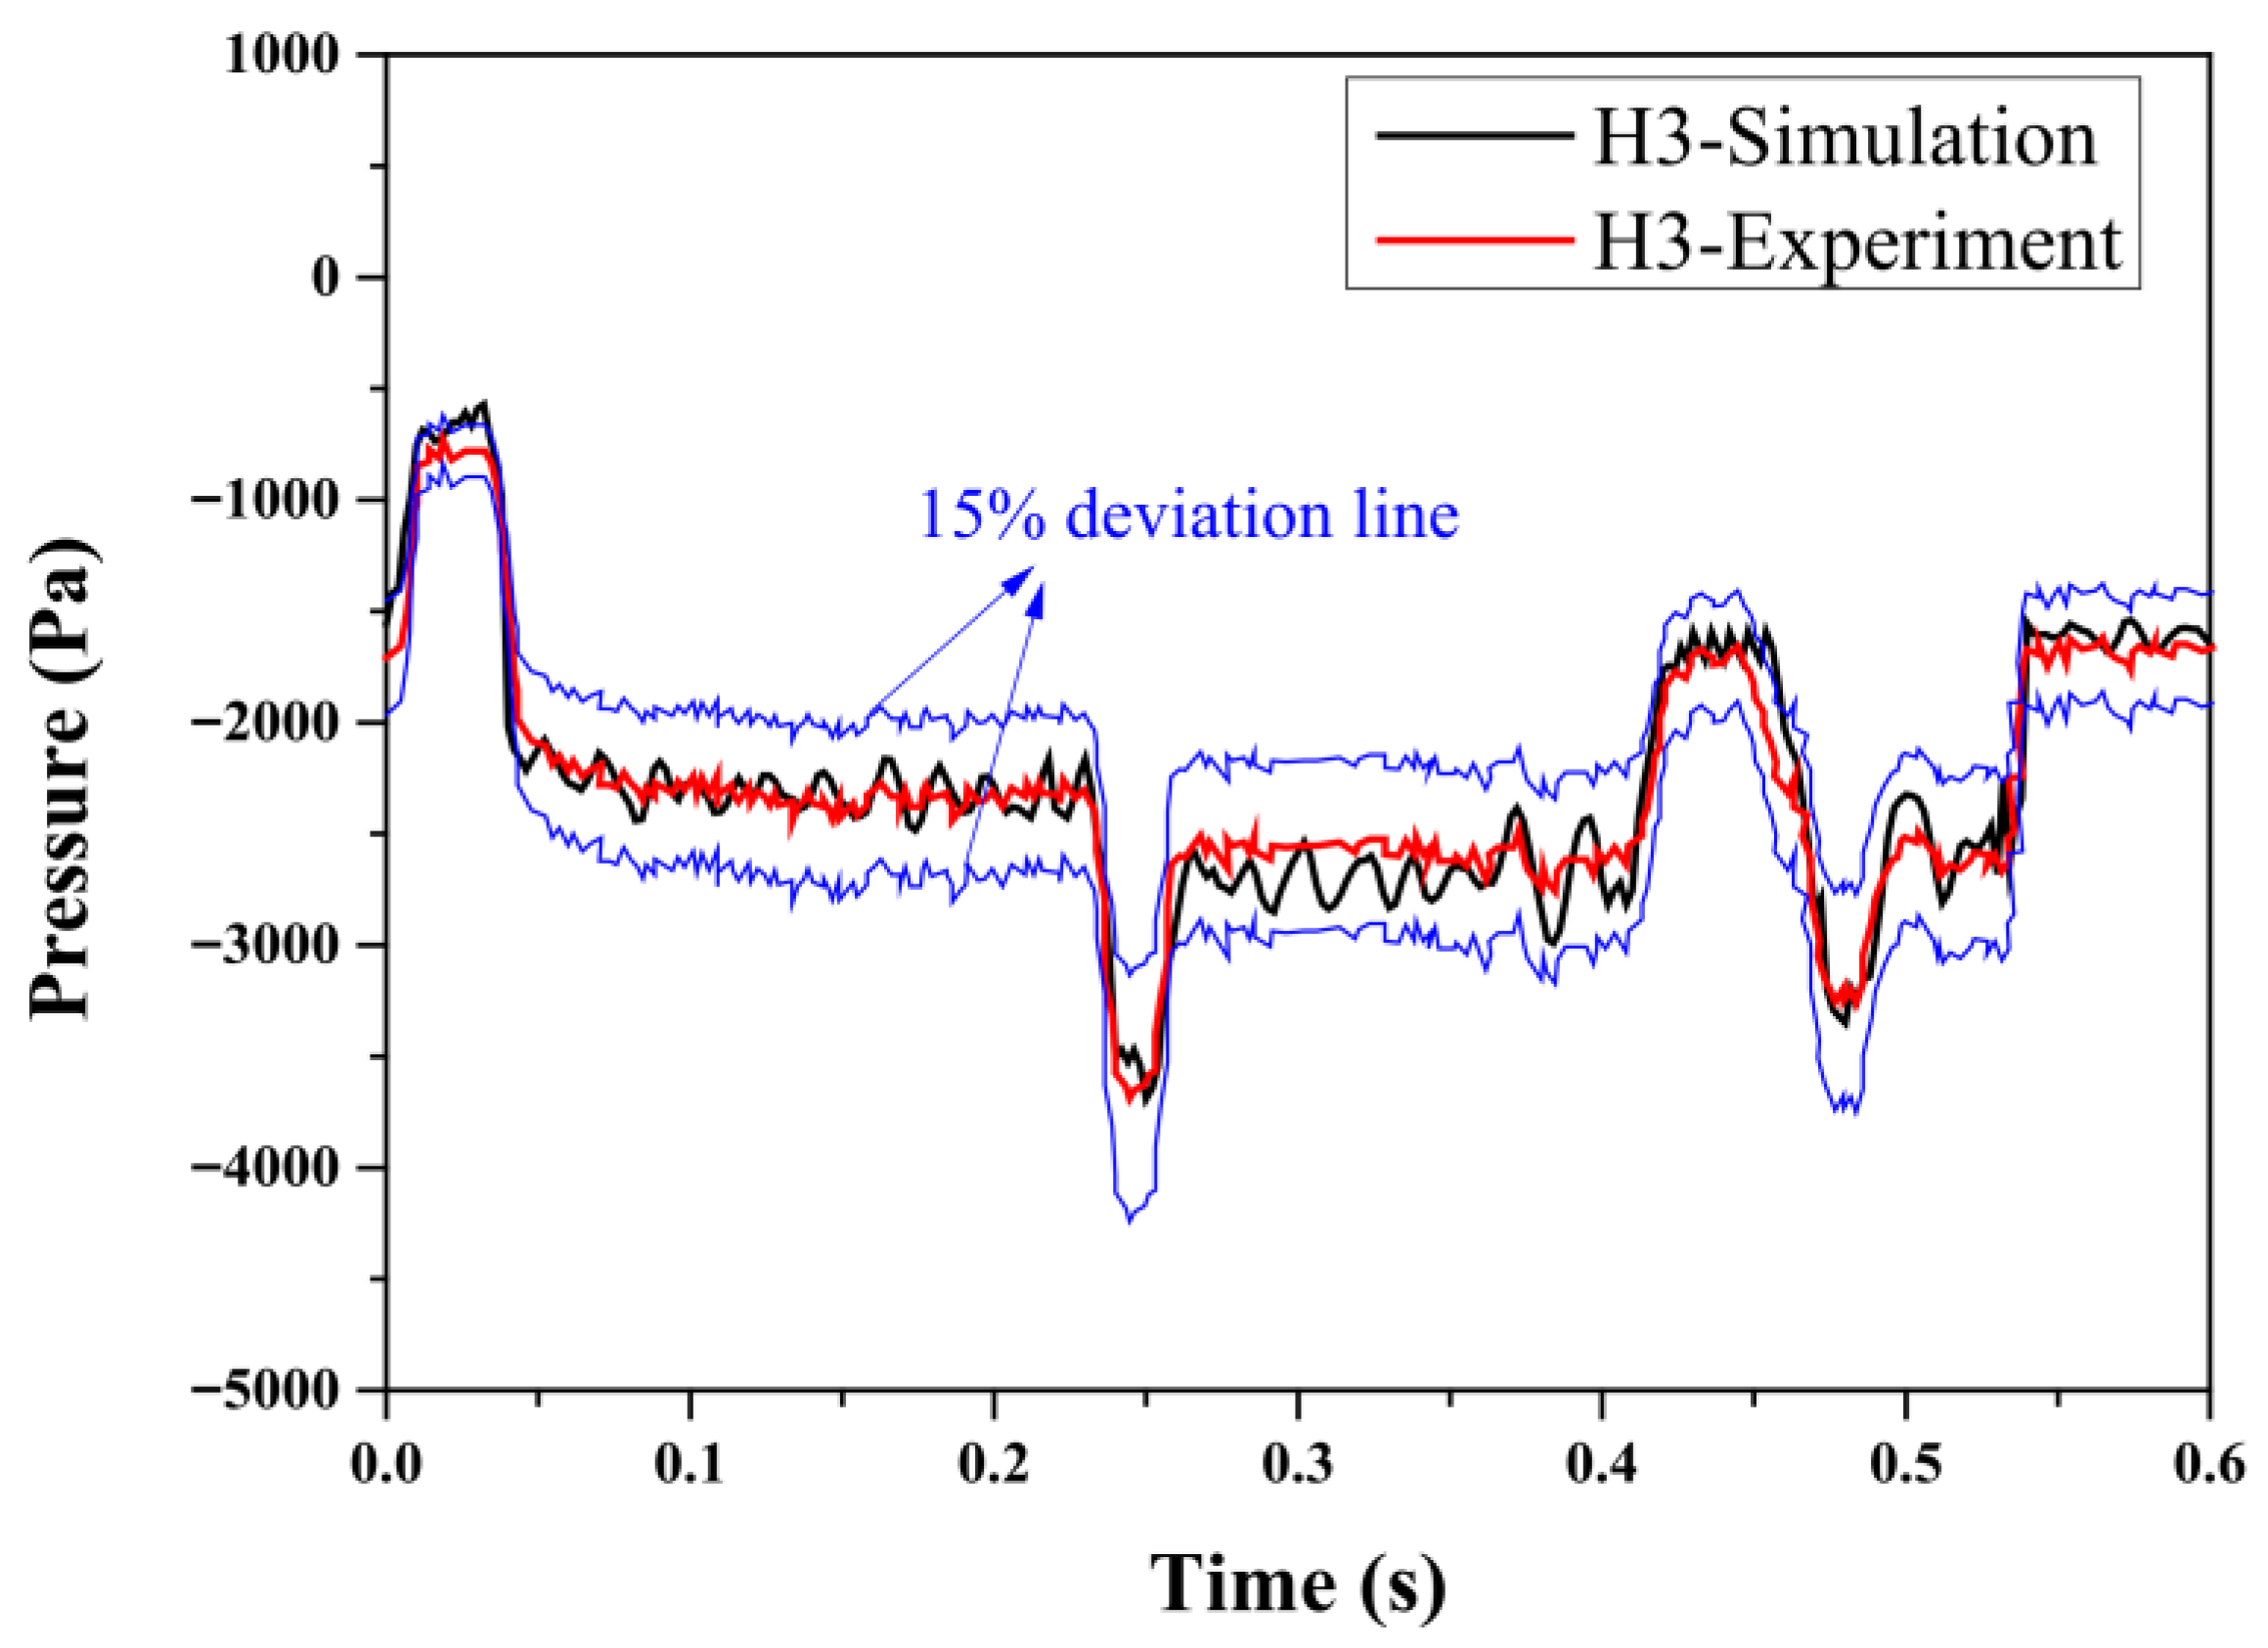
As illustrated in Figure 6, the transient pressure curves at monitoring point H3 obtained from simulations exhibited a strong correlation with experimental measurements, with deviations within 15%. This finding demonstrates that the numerical methodology employed in the current study demonstrates adequate validity, and the transient pressure evolution obtained exhibits acceptable fidelity. It is important to note that the validation process utilizes experimental results obtained under standard atmospheric pressure conditions. The primary objective of this verification is to demonstrate the accuracy and viability of the numerical simulation methodology, which has yielded favorable outcomes under normal atmospheric pressure. Based on these findings, it can be reasonably postulated that the numerical simulation approach remains applicable under reduced environmental pressure conditions. Nevertheless, once experimental data under low-pressure environments become available, the reliability of this numerical simulation methodology should be further validated.

3.2. Transient Pressure Distribution

3.2.1. Exterior Pressure of the Train

As a metro train enters or exits a tunnel, a compression wave is produced by the train’s nose, while an expansion wave is generated at its rear [52]. These pressure waves, comprising both compression and expansion waves, propagate through the tunnel at the speed of sound. As compression and expansion waves near the tunnel portal, they reflect as expansion and compression waves, respectively, and continue to propagate within the tunnel. Pressure waves propagating through the tunnel dynamically alter the pressure on the train’s external surface.
Figure 7 shows the exterior pressure evolution of the train under different ambient pressures. The pressure change trend remains consistent across various ambient pressures. Under a specific ambient pressure (101 kPa as an example), the transient pressure variations at various measurement points on the train surface exhibit similar trends. The pressure change at the train’s head, as measured by TR1, is significant, with a maximum value of 1898 Pa and a minimum of −140 Pa. In contrast, the pressure fluctuations at positions other than TR1 demonstrate both reduced trends and smaller amplitudes. Similar results were obtained under other ambient pressures. Further analysis indicates that altering the ambient pressure results in similar pressure waveforms at the same position, including the timing of wave peaks and valleys. The primary reason is that the pressure wave’s propagation speed corresponds to the speed of sound (c), which depends on the air’s adiabatic index ( κ ), gas constant ( R ), and temperature ( T ), and can be calculated using the appropriate Equation (1) [35]:
c = d p / d ρ = κ R T
In the present study, the ambient temperature remains constant across varying ambient pressures, resulting in the propagation velocity of acoustic waves (the speed at which pressure waves travel) remaining unchanged. The pressure fluctuations observed at the monitoring point are determined by the combined effects of compression and expansion wave propagation, along with the superposition of the train’s movement. When the train operates at a constant velocity, the pressure waveform maintains consistency at identical measurement locations, irrespective of fluctuations in ambient pressure conditions.
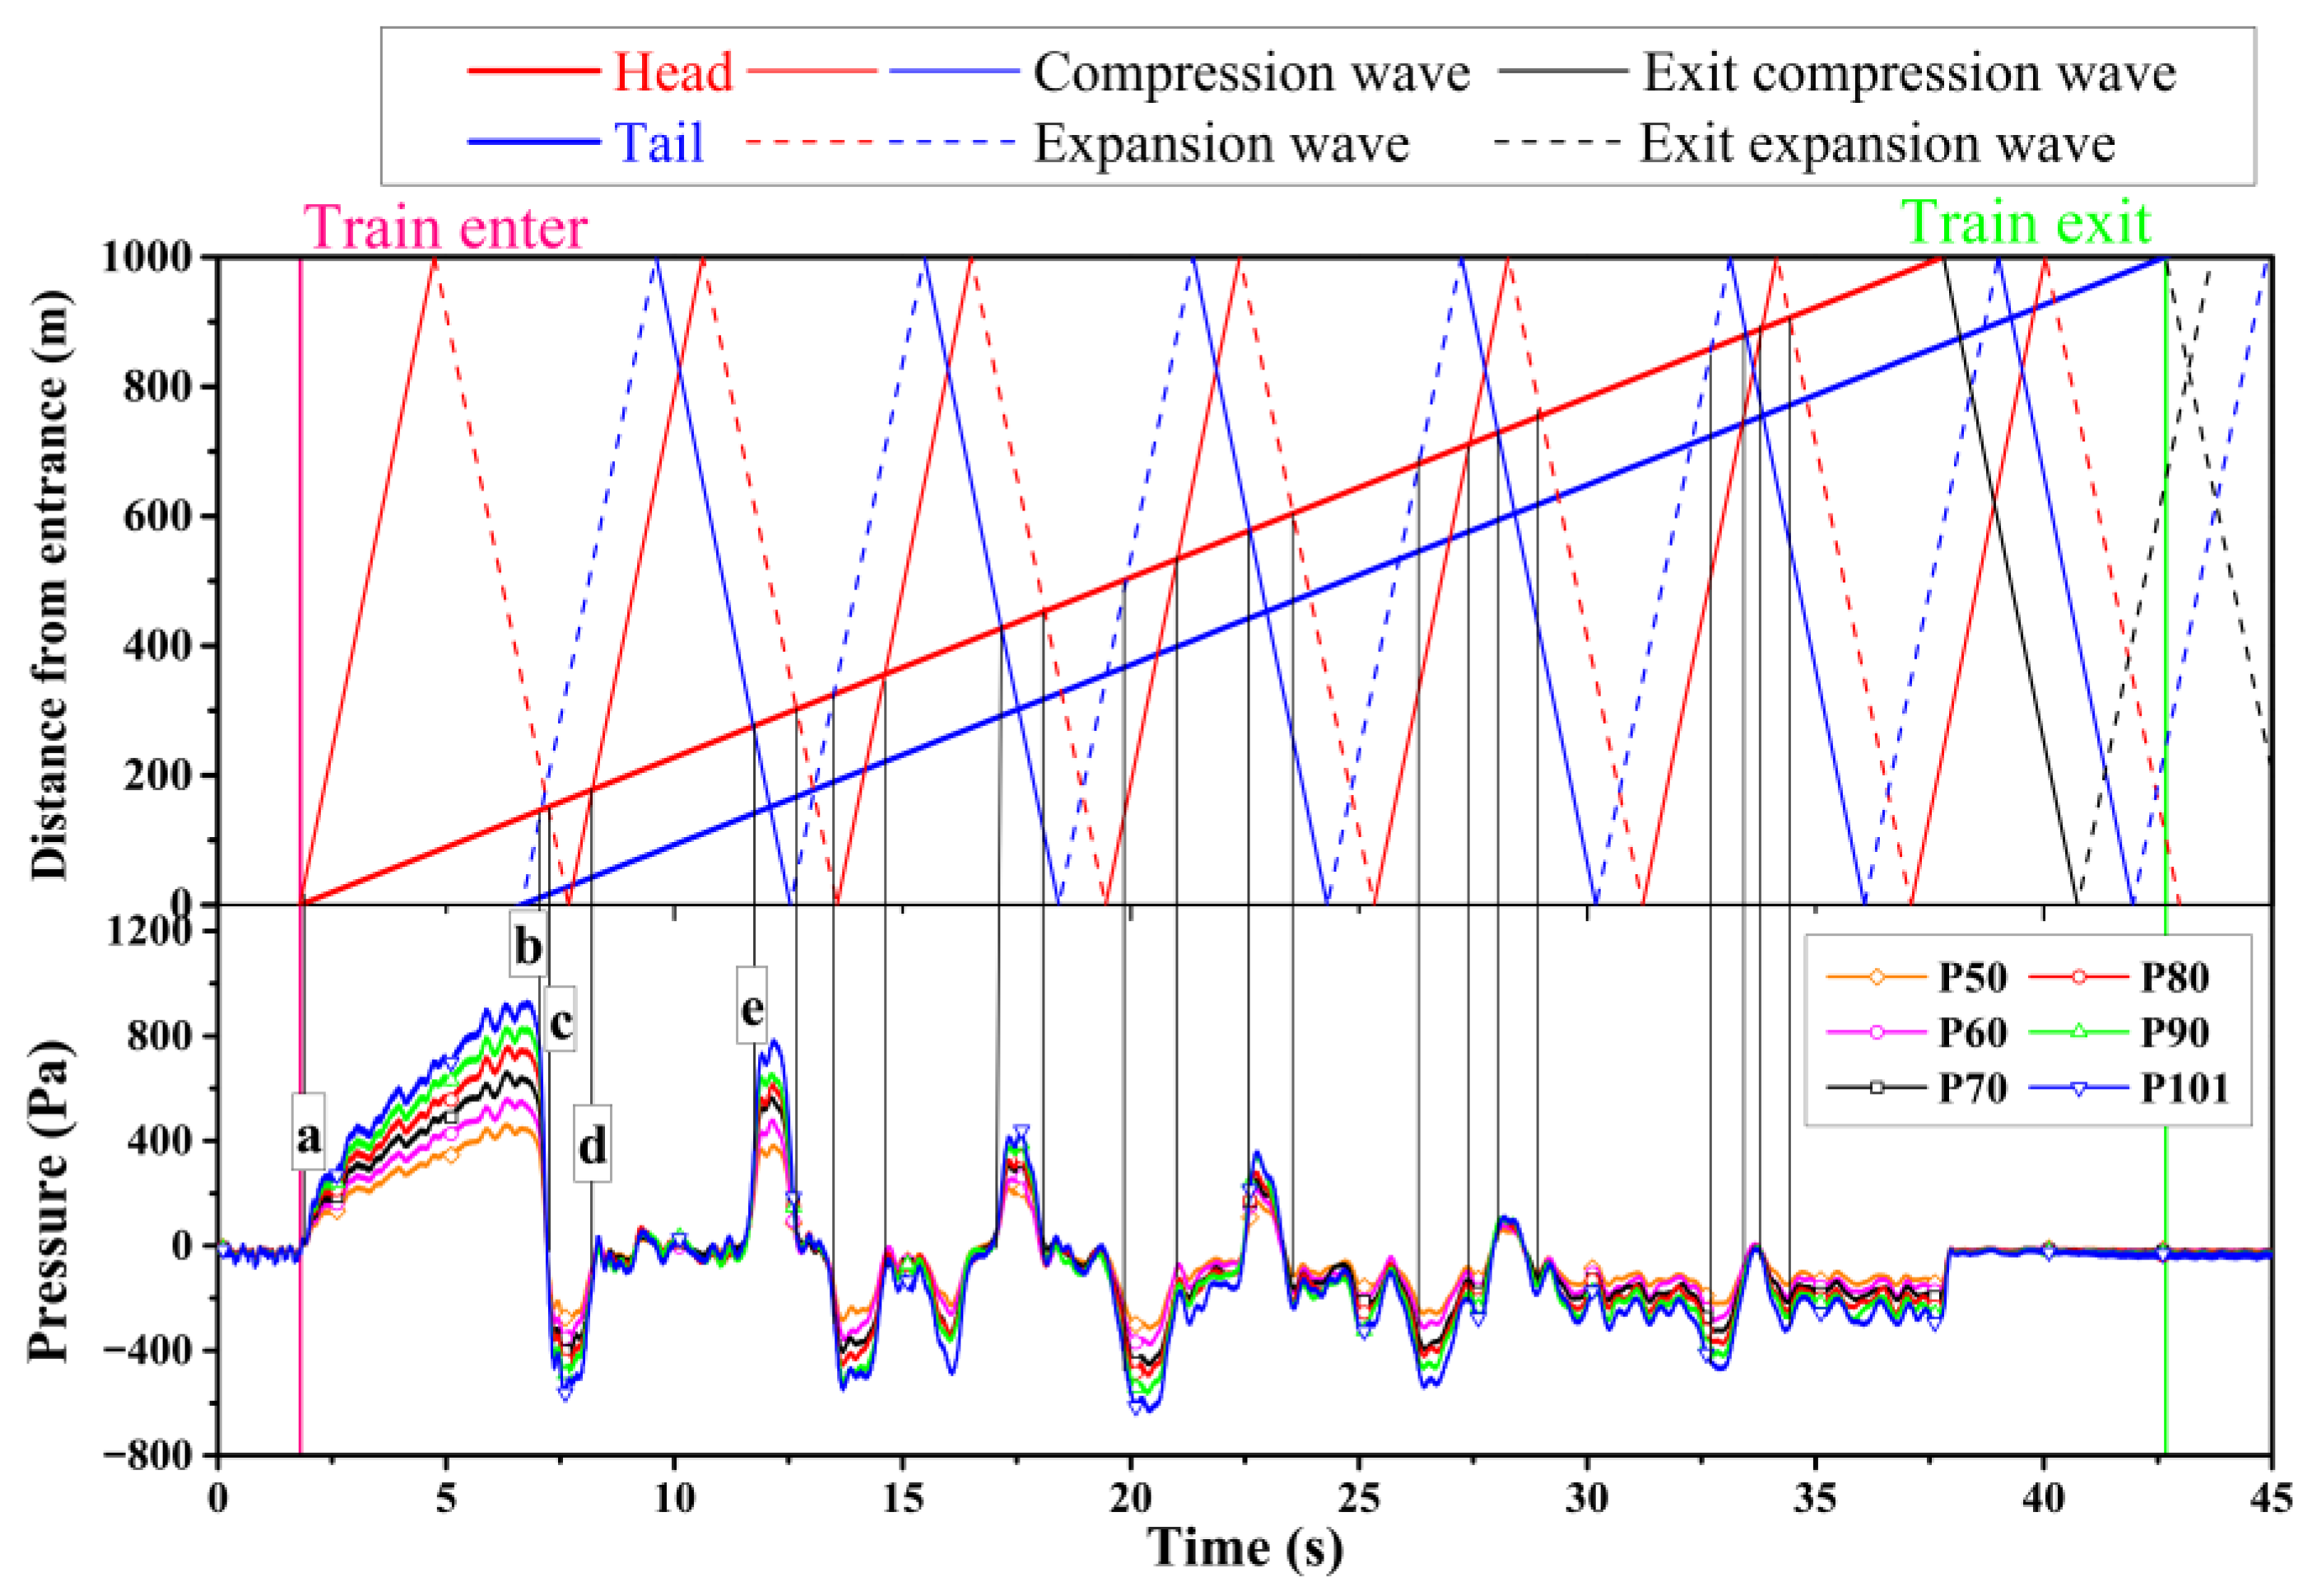
To elucidate the mechanism behind pressure evolution, Figure 8 illustrates the transient pressure history at measuring point TR2, located externally on the train at the full cross-sectional position just behind the nose, alongside wave propagation under varying ambient pressures. When compression or expansion waves propagate to the measurement point, they cause sudden changes in dynamic pressure. Specifically, transient pressure increases when compression waves reach monitoring points (a, d, and e), while it decreases when expansion waves reach measurement points (b and c). The continuous propagation and reflection of pressure waves within the tunnel, combined with the train’s movement, generate regular peaks and valleys on the train’s surface.
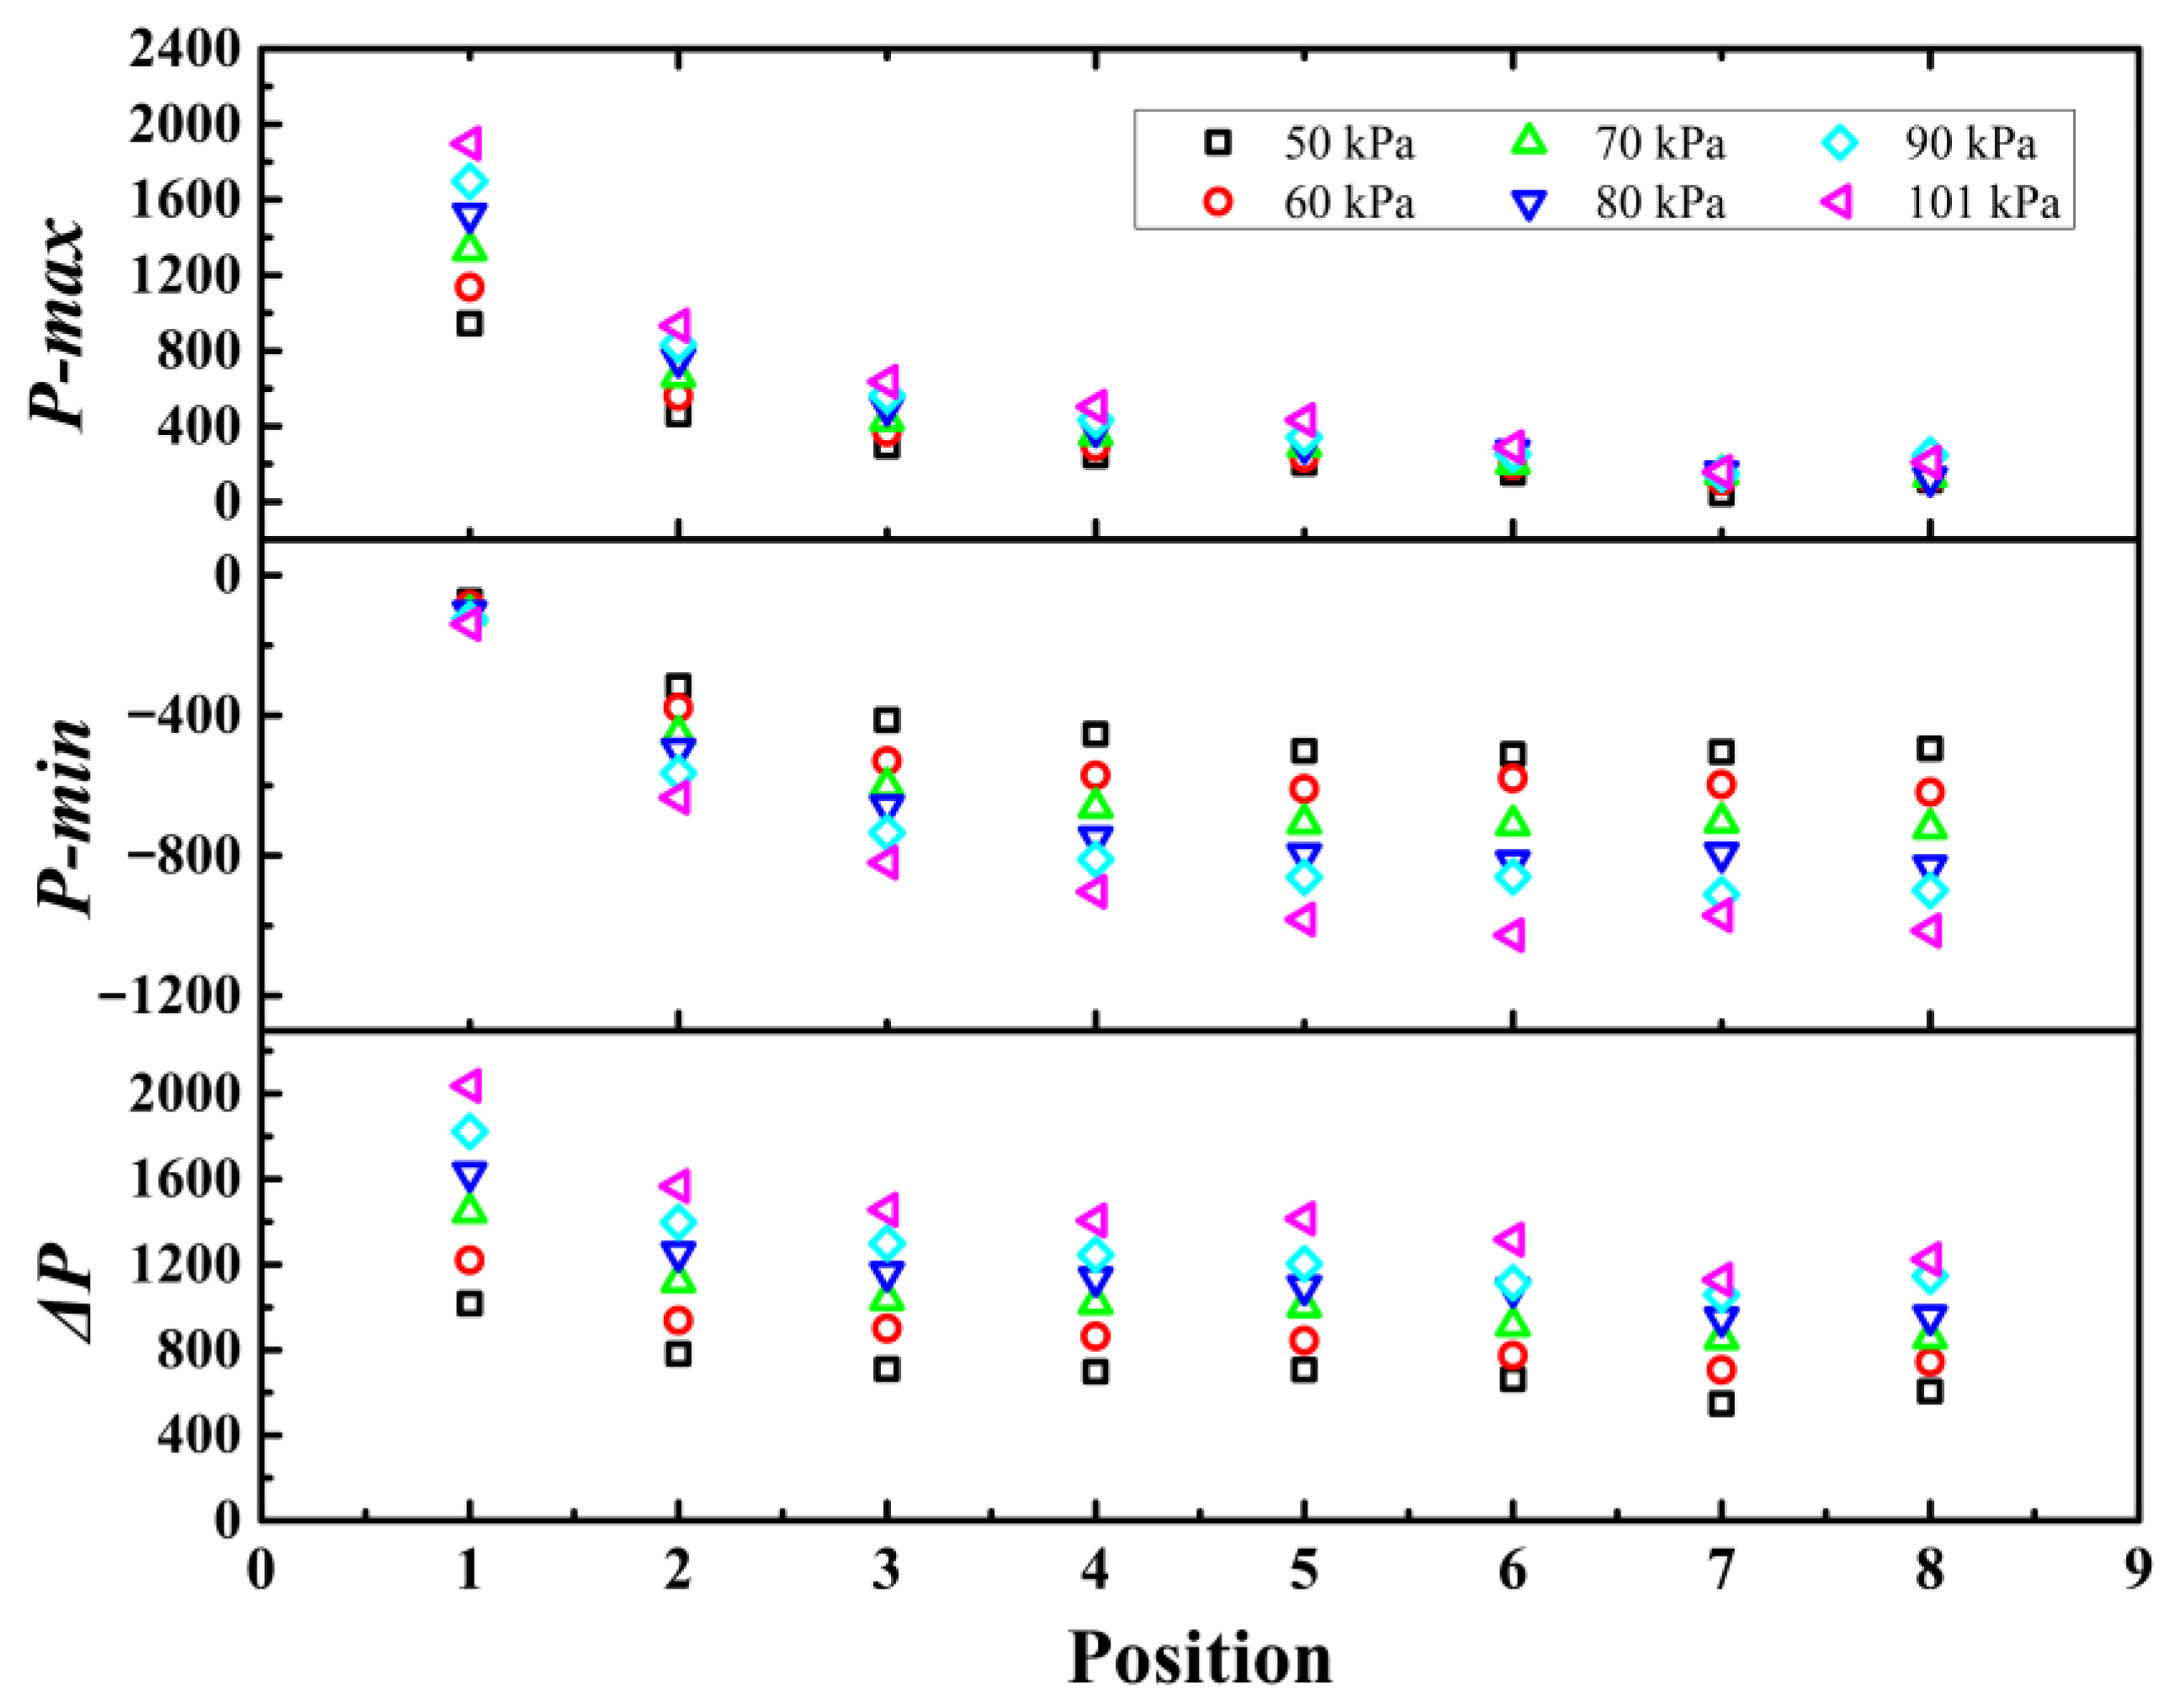
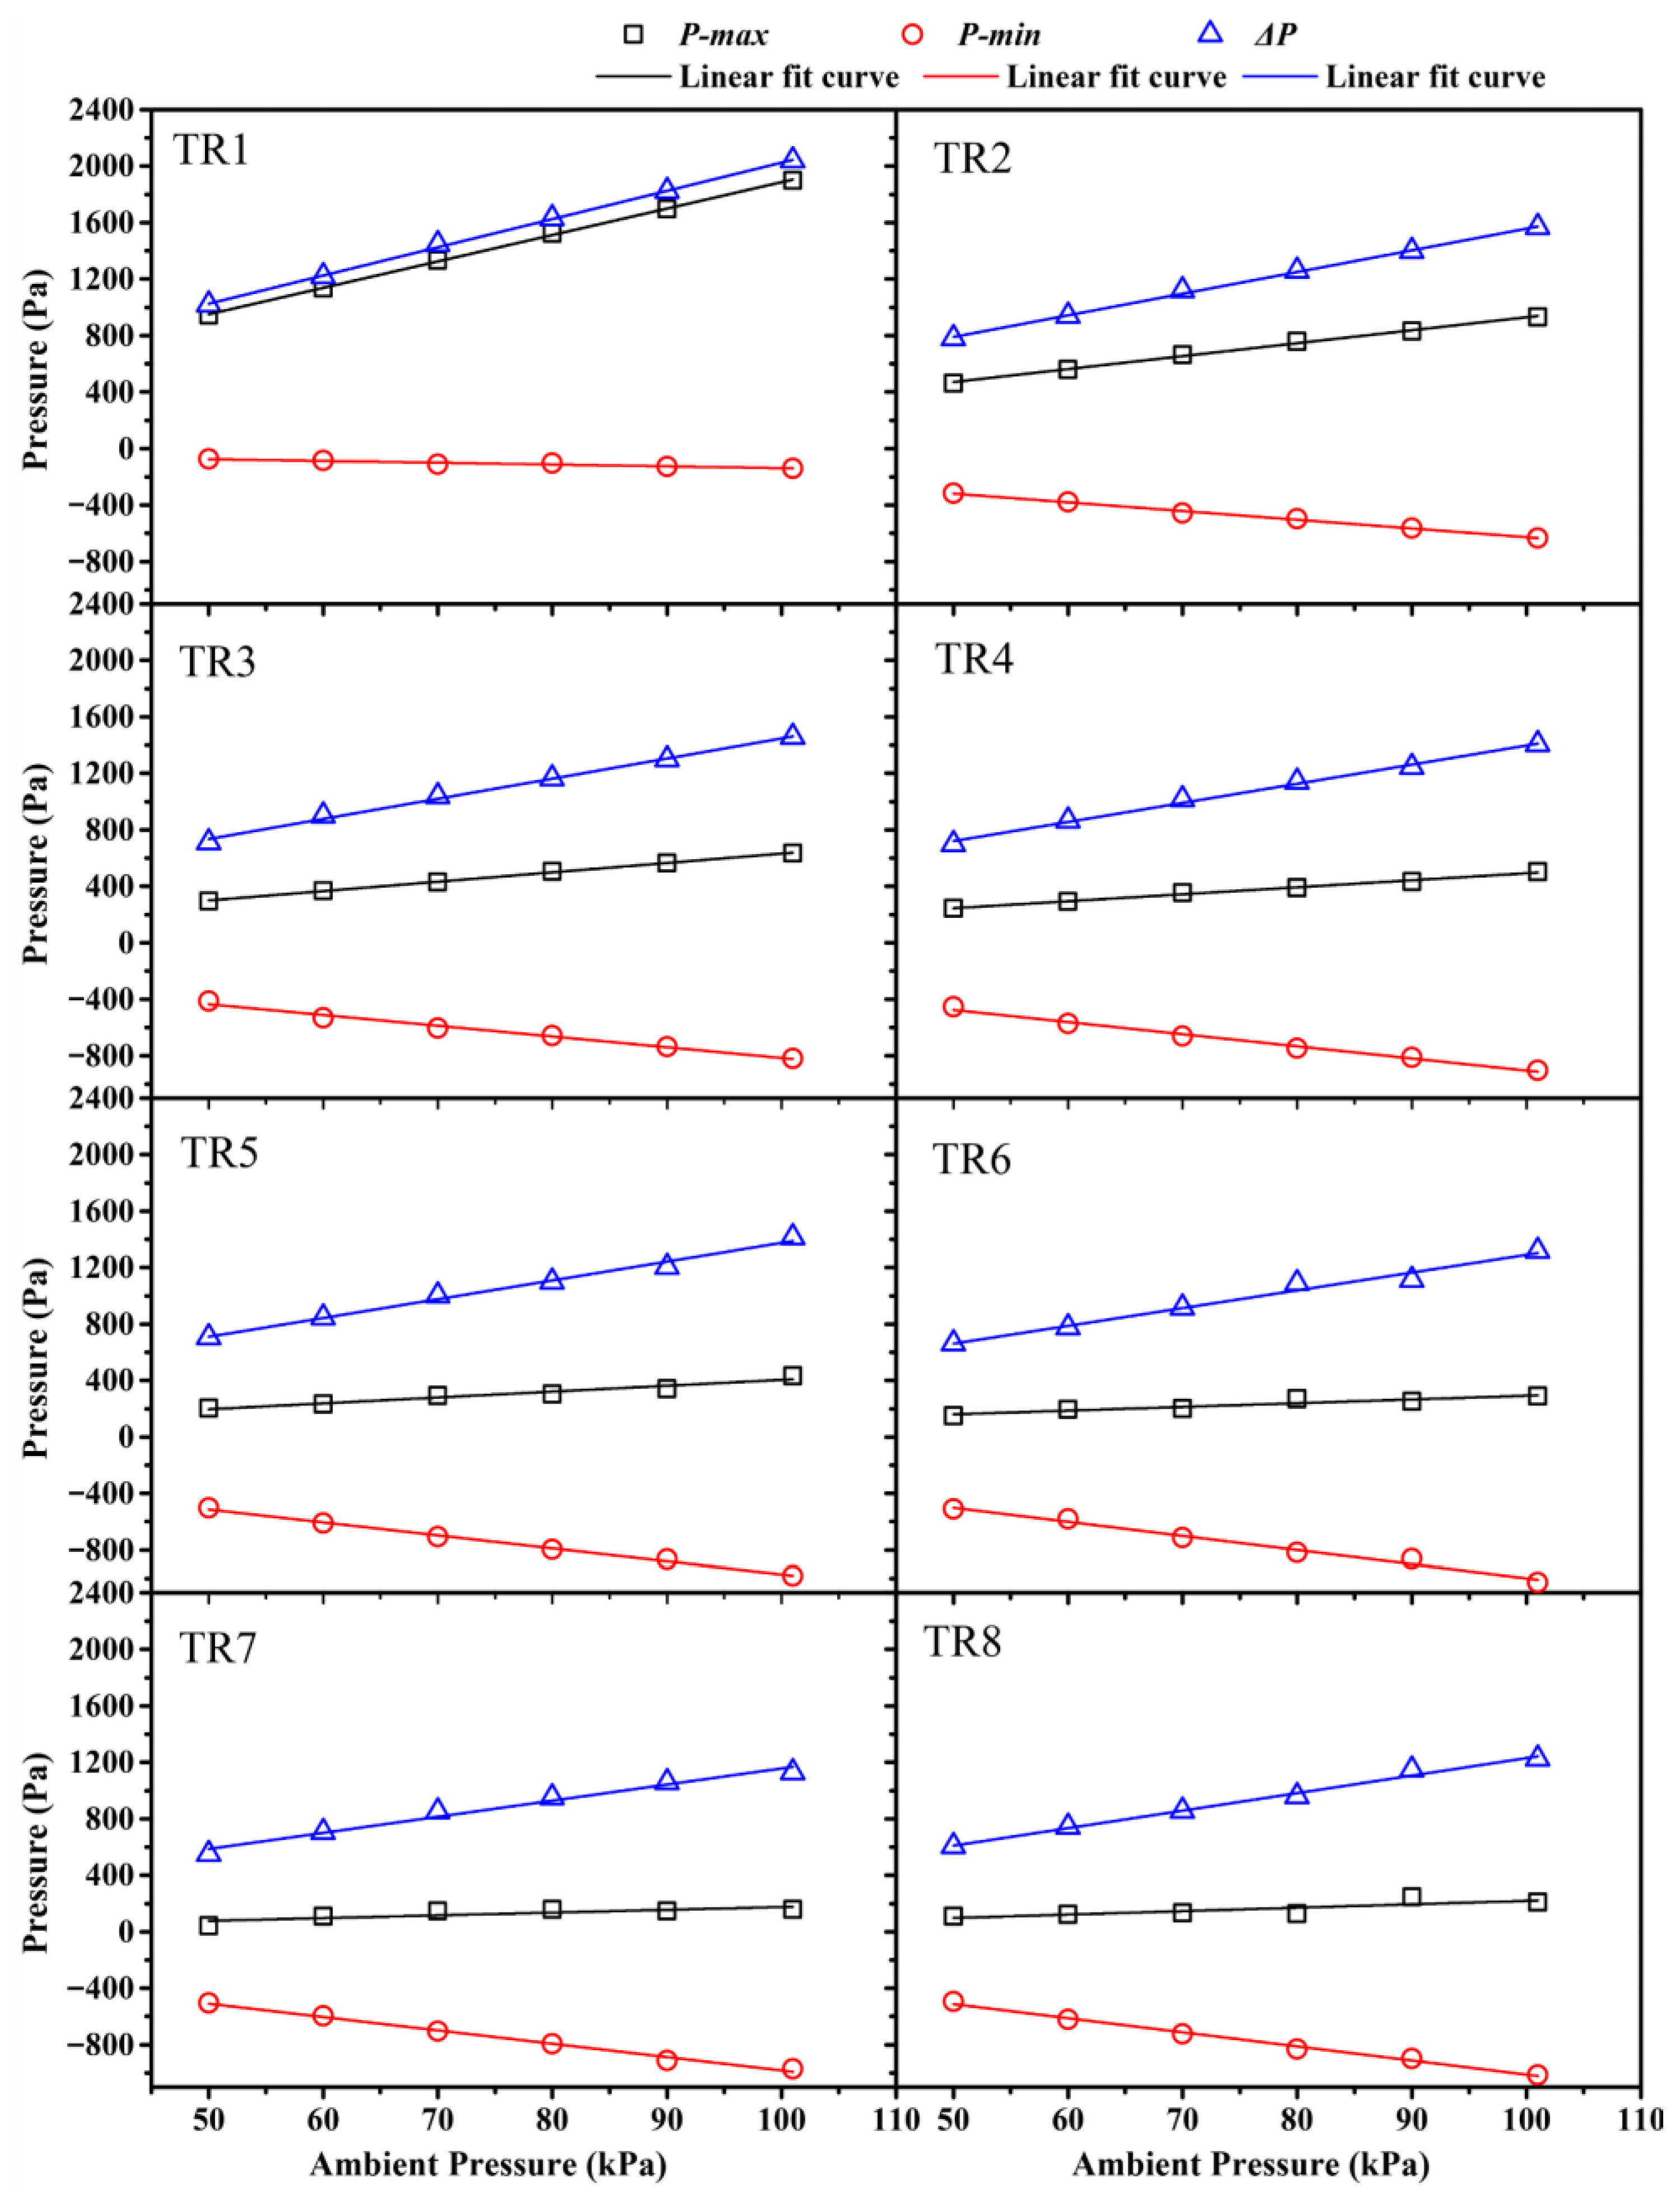
Figure 8 indicates that while ambient pressure minimally impacts the pressure waveform, it significantly influences the pressure wave’s peak value. At standard atmospheric pressure (101 kPa), TR2 records a peak pressure of 933 Pa. As ambient pressure decreases to 90, 80, 70, 60, and 50 kPa, the corresponding values reduce to 833, 760, 663, 560, and 464 Pa, respectively. For clarity in subsequent discussions, P-max, P-min, and ΔP, respectively, represent the maximum, minimum, and peak-to-peak values of the external transient pressure on the train. Figure 9 illustrates the distribution of these three values at measurement points under different ambient pressures. P-max decreases monotonically as the measurement point moves from the head to the tail of the metro. Due to the complexity of pressure wave propagation, P-min and ΔP distributions are more complex than P-max. Generally, there is good consistency in the variation in peak pressure at the same measurement points under different ambient pressures. To analyze the impact of ambient pressure on these peak pressures, Figure 10 plots the variation in peak pressure with ambient pressure at different measuring points. The findings indicate that at each measurement point, both P-max and ΔP exhibit a linear increase with rising ambient pressure, whereas P-min shows a linear decrease. This may be because as altitude increases, air density decreases, thereby reducing pressure waves, piston effects, friction effects, and pressure drops generated when trains pass through [41].

3.2.2. Interior Pressure of the Train

Passenger comfort is significantly affected by the train’s internal pressure. Exceeding pressure fluctuation limits can cause passenger discomfort, including earaches, vomiting, or permanent eardrum damage [5]. The pressure inside the vehicle is usually obtained by the following differential calculation method. The sealing index ( τ ) is determined by the pressure difference between the train’s interior and exterior ( Δ P i e ), along with the internal pressure gradient ( d P / d t ), and can be expressed by Equation (2) [53].
τ = Δ P i e d P / d t
Assume the Δ P i e starts at an initial value Δ P 1 and changes to a new value Δ P 2 after time t. Then, Equation (2) can be rewritten as Equation (3) [54]:
τ = t l n ( Δ P 1 / Δ P 2 )
Based on Equations (2) and (3), Liu et al. [54] derive the calculation method Equation (4) for estimating the pressure inside the vehicle and verifying it with a full-scale experiment [55].
P i = P i n 1 + P e × Δ t / τ / 1 + Δ t / τ
where P i represents the current interior pressure, P i n 1 denotes the previous step’s interior pressure, indicating the interaction between interior and exterior pressures, P e   signifies the current exterior pressure, Δ t is the time interval.
The TR1 measurement point is selected for calculating the train’s internal pressure due to its higher pressure readings compared to other measurement points, as depicted in Figure 9. The Standard for Design of Metro Express [56] mandates a minimum vehicle dynamic sealing index of 3 s and a cab sealing index of 5 s. This study examines pressure changes within the train using sealing indexes ranging from 1 to 6 s. Based on Equation (4), the train interior pressure for various sealing indexes was determined using the external surface pressure data from the simulation, as illustrated in Figure 11. The sealing index significantly affects the train’s interior pressure changes. A higher sealing index leads to less pressure variation within the train, causing longer delays in pressure peaks and smoother fluctuations. The trend of pressure peak reduction and delay inside the train remains well aligned for different ambient pressures.
The pressure variation within the vehicle will be utilized to assess passenger ear comfort. Passenger ear comfort in pressure-changing environments is assessed using two methods [5]: (1) evaluating the amplitude and rate of pressure change, and (2) assessing pressure changes over time. Different countries and regions have varying pressure comfort standards, and the relevant reference values for changes in vehicle interior pressure are listed in Table 3.
Based on the train’s operating speed of 100 km/h, Figure 12 illustrates the variations in maximum interior pressure at different time scales as a metro train traverses the tunnel. Δ P m a x / 1   s , Δ P m a x / 1.7   s , and Δ P m a x / 3   s denote the peak pressure variations occurring within 1 s, 1.7 s, and 3 s, respectively. Under the ambient pressure of 50–101 kPa, when the train is not sealed ( τ = 0 ), the pressure variations in the train do not meet the requirements, regardless of which standard is adopted. As the sealing index rises, the internal train pressure progressively aligns with the code requirements until τ 3 , full compliance is achieved. The internal train pressure is influenced by both the exterior pressure and the sealing index, making ambient pressure a significant factor. With a constant sealing index, train pressure variations escalate as ambient pressure rises. Taking the Δ P m a x / 1   s as an example, when τ = 2 , the ambient pressure is less than or equal to 80 kPa to meet the standard requirements, and the others are not. As the ambient pressure increases, the requirements for the tightness performance of the train are higher.

4. Conclusions

This study employs the dynamic mesh CFD method to investigate the transient pressure characteristics caused by a metro train passing through a tunnel in high-altitude regions. The numerical approach was validated against existing small-scale experimental data. Subsequently, the transient pressure evolution both externally and internally on the train under varying ambient pressure conditions was thoroughly analyzed and compared. The principal findings of this research can be summarized as follows:
(1)
The impact of ambient pressure on train-induced transient pressure characteristics is significant, affecting both the external and internal pressure evolution of the train.
(2)
Ambient pressure significantly affects the transient peak value of the train’s exterior pressure. P-max and ΔP exhibit a linear increase, whereas P-min shows a linear decrease, all in response to rising ambient pressure.
(3)
The trend of pressure peak reduction and delay inside the metro train with a certain degree of airtightness remains well aligned for different ambient pressures. As the ambient pressure increases, the requirements for the sealing performance of the train become more stringent.

Author Contributions

Conceptualization, F.W. and S.Z.; Methodology, F.W. and S.Z.; Software, T.L. and H.C.; Validation, X.H. and T.L.; Investigation, C.C. and X.H.; Writing—original draft, F.W. and H.C.; Writing—review and editing, F.W., C.C., L.X. and S.Z.; Supervision, L.X. and S.Z. All authors have read and agreed to the published version of the manuscript.

Funding

This study received funding from the Science and Technology Support Plan for Youth Innovation of Colleges and Universities in Shandong Province, China (Grant No. 2023KJ122), and the Leading Researcher Studio Fund of Jinan (Grant No. 202333050). Shengzhong Zhao was supported By Young Talent of Lifting Engineering for Science and Technology in Shandong, China (Grant No. SDAST2024QTA077).

Data Availability Statement

Data are contained within this article.

Acknowledgments

The authors thank the reviewers for their great help with the article during the review process.

Conflicts of Interest

The authors declare no conflicts of interest.

Nomenclature

cThe speed of sound (m/s)
κ The air’s adiabatic index
R The gas constant (J/(kg·K))
T Temperature (K)
P-maxThe maximum values of the external transient pressure on the train (Pa)
P-minThe maximum values of the external transient pressure on the train (Pa)
ΔPPeak-to-peak values of the external transient pressure on the train (Pa)
τ The sealing index (s)
Δ P i e The pressure difference between the train’s interior and exterior (Pa)
P i The current interior pressure (Pa)
P i n 1 The previous step’s interior pressure (Pa)
P e The current exterior pressure (Pa)
Δ t The time interval (s)
Δ P m a x / 1   s The peak pressure variations occurring within 1 s (Pa)
Δ P m a x / 1.7   s The peak pressure variations occurring within 1 s (Pa)
Δ P m a x / 3   s The peak pressure variations occurring within 3 s (Pa)

References

  1. Wang, F.; Weng, M.; Han, J.; Obadi, I.; Liu, F. Effect of metro train on the critical driving force for preventing smoke back-layering in tunnel fires. Fire Mater. 2021, 46, 927–942. [Google Scholar] [CrossRef]
  2. Yang, X.; Shou, A.; Zhang, R.; Quan, J.; Li, X.; Niu, J. Numerical study on transient aerodynamic behaviors in a subway tunnel caused by a metro train running between adjacent platforms. Tunn. Undergr. Space Technol. 2021, 117, 104152. [Google Scholar] [CrossRef]
  3. GB50736-2012; Design Code for Heating Ventilation and Air Conditioning of Civil Buildings. China Architecture and Building Press: Beijing, China, 2012.
  4. Zhou, Y.; Wang, H.; Bi, H.; Wang, J. Experimental and numerical study of aerodynamic pressures on platform screen doors at the overtaking station of a high-speed subway. Build. Environ. 2021, 191, 107582. [Google Scholar] [CrossRef]
  5. Xiong, X.; Zhu, L.; Zhang, J.; Li, A.; Li, X.; Tang, M. Field measurements of the interior and exterior aerodynamic pressure induced by a metro train passing through a tunnel. Sustain. Cities Soc. 2020, 53, 101928. [Google Scholar] [CrossRef]
  6. Li, W.; Liu, T.; Chen, Z.; Guo, Z.; Huo, X. Comparative study on the unsteady slipstream induced by a single train and two trains passing each other in a tunnel. J. Wind. Eng. Ind. Aerodyn. 2020, 198, 104095. [Google Scholar] [CrossRef]
  7. Li, W.; Liu, T.; Martinez-Vazquez, P.; Chen, Z.; Huo, X.; Guo, Z. Influence of blockage ratio on slipstreams in a high-speed railway tunnel. Tunn. Undergr. Space Technol. 2021, 115, 104055. [Google Scholar] [CrossRef]
  8. Zampieri, A.; Rocchi, D.; Schito, P.; Somaschini, C. Numerical-experimental analysis of the slipstream produced by a high speed train. J. Wind. Eng. Ind. Aerodyn. 2020, 196, 104022. [Google Scholar] [CrossRef]
  9. Wang, F.; Liu, F.; Han, J.; Jin, H.; Weng, M.; Zeng, Z. Study on the train-induced unsteady airflow in a metro tunnel with multi-trains. Tunn. Undergr. Space Technol. 2020, 106, 103565. [Google Scholar] [CrossRef]
  10. Wang, F.; He, X.; Xu, L.; Zhao, S.; Weng, M. Train-Induced Unsteady Airflow in a Metro Tunnel with a Ventilation Shaft. Appl. Sci. 2024, 14, 9177. [Google Scholar] [CrossRef]
  11. Zarnaghsh, A.; Abouali, O.; Emdad, H.; Ahmadi, G. A numerical study of the train-induced unsteady airflow in a tunnel and its effects on the performance of jet fans. J. Wind. Eng. Ind. Aerodyn. 2019, 187, 1–14. [Google Scholar] [CrossRef]
  12. Li, Z.-W.; Yang, M.-Z.; Huang, S.; Liang, X. A new method to measure the aerodynamic drag of high-speed trains passing through tunnels. J. Wind. Eng. Ind. Aerodyn. 2017, 171, 110–120. [Google Scholar] [CrossRef]
  13. Liu, Z.; Chen, G.; Zhou, D.; Wang, Z.; Guo, Z. Numerical investigation of the pressure and friction resistance of a high-speed subway train based on an overset mesh method. Proc. Inst. Mech. Eng. Part F J. Rail Rapid Transit 2020, 235, 598–615. [Google Scholar] [CrossRef]
  14. Izadi, T.; Abouali, O.; Mehrabian, M.A.; Salmanzadeh, M. Investigation of the effects of different parameters on the generated pressure waves inside the tunnels. SN Appl. Sci. 2020, 2, 1406. [Google Scholar] [CrossRef]
  15. Mei, Y. A Generalized Numerical Simulation Method for Pressure Waves Generated by High-Speed Trains Passing through Tunnels. Adv. Struct. Eng. 2013, 16, 1427–1436. [Google Scholar] [CrossRef]
  16. Wang, H.; Lei, B.; Bi, H.; Yu, T. Wavefront evolution of compression waves propagating in high speed railway tunnels. J. Sound Vib. 2018, 431, 105–121. [Google Scholar] [CrossRef]
  17. Zhang, G.; Kim, T.H.; Kim, D.H.; Kim, H.D. Prediction of micro-pressure waves generated at the exit of a model train tunnel. J. Wind. Eng. Ind. Aerodyn. 2018, 183, 127–139. [Google Scholar] [CrossRef]
  18. Miyachi, T.; Fukuda, T. Model experiments on area optimization of multiple openings of tunnel hoods to reduce micro-pressure waves. Tunn. Undergr. Space Technol. 2021, 115, 103996. [Google Scholar] [CrossRef]
  19. Raghunathan, R.S.; Kim, H.D.; Setoguchi, T. Aerodynamics of high-speed railway train. Prog. Aerosp. Sci. 2002, 38, 469–514. [Google Scholar] [CrossRef]
  20. Han, J.; Kwon, S.-B.; Chun, C. Indoor environment and passengers’ comfort in subway stations in Seoul. Build. Environ. 2016, 104, 221–231. [Google Scholar] [CrossRef]
  21. Niu, J.; Sui, Y.; Yu, Q.; Cao, X.; Yuan, Y. Aerodynamics of railway train/tunnel system: A review of recent research. Energy Built Environ. 2020, 1, 351–375. [Google Scholar] [CrossRef]
  22. Baker, C.J. A review of train aerodynamics Part 1—Fundamentals. Aeronaut. J. 2014, 118, 201–228. [Google Scholar] [CrossRef]
  23. Baker, C.J. A review of train aerodynamics Part 2—Applications. Aeronaut. J. 2014, 118, 345–382. [Google Scholar] [CrossRef]
  24. Guo, Z.; Liu, T.; Yu, M.; Chen, Z.; Li, W.; Huo, X.; Liu, H. Numerical study for the aerodynamic performance of double unit train under crosswind. J. Wind. Eng. Ind. Aerodyn. 2019, 191, 203–214. [Google Scholar] [CrossRef]
  25. Niu, J.; Zhou, D.; Liu, F.; Yuan, Y. Effect of train length on fluctuating aerodynamic pressure wave in tunnels and method for determining the amplitude of pressure wave on trains. Tunn. Undergr. Space Technol. 2018, 80, 277–289. [Google Scholar] [CrossRef]
  26. Niu, J.; Wang, Y.; Zhang, L.; Yuan, Y. Numerical analysis of aerodynamic characteristics of high-speed train with different train nose lengths. Int. J. Heat Mass Transf. 2018, 127, 188–199. [Google Scholar] [CrossRef]
  27. Zhang, L.; Yang, M.-Z.; Liang, X.-F.; Zhang, J. Oblique tunnel portal effects on train and tunnel aerodynamics based on moving model tests. J. Wind. Eng. Ind. Aerodyn. 2017, 167, 128–139. [Google Scholar] [CrossRef]
  28. Zhang, L.; Liu, H.; Stoll, N.; Thurow, K. Influence of tunnel aerodynamic effects by slope of equal-transect ring oblique tunnel portal. J. Wind. Eng. Ind. Aerodyn. 2017, 169, 106–116. [Google Scholar] [CrossRef]
  29. Wang, T.; Wu, F.; Yang, M.; Ji, P.; Qian, B. Reduction of pressure transients of high-speed train passing through a tunnel by cross-section increase. J. Wind. Eng. Ind. Aerodyn. 2018, 183, 235–242. [Google Scholar] [CrossRef]
  30. Li, W.; Liu, T.; Huo, X.; Chen, Z.; Guo, Z.; Li, L. Influence of the enlarged portal length on pressure waves in railway tunnels with cross-section expansion. J. Wind. Eng. Ind. Aerodyn. 2019, 190, 10–22. [Google Scholar] [CrossRef]
  31. Yang, W.; Deng, E.; Lei, M.; Zhang, P.; Yin, R. Flow structure and aerodynamic behavior evolution during train entering tunnel with entrance in crosswind. J. Wind. Eng. Ind. Aerodyn. 2018, 175, 229–243. [Google Scholar] [CrossRef]
  32. Wang, L.; Luo, J.; Li, F.; Guo, D.; Gao, L.; Wang, D. Aerodynamic performance and flow evolution of a high-speed train exiting a tunnel with crosswinds. J. Wind. Eng. Ind. Aerodyn. 2021, 218, 104786. [Google Scholar] [CrossRef]
  33. Wang, J.; Wang, T.; Yang, M.; Qian, B.; Wang, K. Effect of localized high temperature on the aerodynamic performance of a high-speed train passing through a tunnel. J. Wind. Eng. Ind. Aerodyn. 2020, 208, 104444. [Google Scholar] [CrossRef]
  34. Zhou, X.-S.; Liu, T.-H.; Chen, Z.-W.; Zou, X.; Liu, D.-R. Effect of ambient wind on pressure wave generated by high-speed train entering a tunnel. J. Cent. South Univ. 2017, 24, 1465–1475. [Google Scholar] [CrossRef]
  35. Liu, F.; Wang, F.; Han, J.; Zhao, S.; Weng, M. Effects of ambient pressure on aerodynamic pressures induced by passing metro trains in tunnels. Tunn. Undergr. Space Technol. 2022, 126, 104540. [Google Scholar] [CrossRef]
  36. Wang, F.; Weng, M.; Xiong, K.; Han, J.; Obadi, I.; Liu, F. Study on aerodynamic pressures caused by double-train tracking operation in a metro tunnel. Tunn. Undergr. Space Technol. 2022, 123, 104434. [Google Scholar] [CrossRef]
  37. Huang, S.; Che, Z.-X.; Li, Z.-W.; Jiang, Y.-N.; Wang, Z.-G. Influence of tunnel cross-sectional shape on surface pressure change induced by passing metro trains. Tunn. Undergr. Space Technol. 2020, 106, 103611. [Google Scholar] [CrossRef]
  38. Zeng, L.; Wang, H.; Li, L.; Guo, W.; Yi, F. Experimental study of train-induced pressure acting on the platform screen doors in subway station. Tunn. Undergr. Space Technol. 2021, 117, 104150. [Google Scholar] [CrossRef]
  39. Li, C.; Liu, M.; Chang, R.; Wang, X.; Liu, W.; Zhang, H. Air pressure and comfort study of the high-speed train passing through the subway station. Sustain. Cities Soc. 2022, 81, 103881. [Google Scholar] [CrossRef]
  40. Xiong, K.; Weng, M.; Liu, F. Theoretical study on the most unfavorable tunnel length (MUTL) based on the interior pressure variations of high-speed subway trains. Tunn. Undergr. Space Technol. 2024, 148, 105774. [Google Scholar] [CrossRef]
  41. Liu, L.; Jing, L.; Li, T.; Wang, K. Effects of high geotemperature and high altitude on the pressure wave of high-speed trains running in a long tunnel. J. Zhejiang Univ.-Sci. A 2024, 25, 953–969. [Google Scholar] [CrossRef]
  42. Deng, E.; Yang, W.; Lei, M.; Zhu, Z.; Zhang, P. Aerodynamic loads and traffic safety of high-speed trains when passing through two windproof facilities under crosswind: A comparative study. Eng. Struct. 2019, 188, 320–339. [Google Scholar] [CrossRef]
  43. Deng, E.; Yang, W.; He, X.; Ye, Y.; Zhu, Z.; Wang, A. Transient aerodynamic performance of high-speed trains when passing through an infrastructure consisting of tunnel–bridge–tunnel under crosswind. Tunn. Undergr. Space Technol. 2020, 102, 103440. [Google Scholar] [CrossRef]
  44. Liu, T.-H.; Jiang, Z.-H.; Li, W.-H.; Guo, Z.-J.; Chen, X.-D.; Chen, Z.-W.; Krajnovic, S. Differences in aerodynamic effects when trains with different marshalling forms and lengths enter a tunnel. Tunn. Undergr. Space Technol. 2019, 84, 70–81. [Google Scholar] [CrossRef]
  45. Niu, J.-Q.; Zhou, D.; Liang, X.-F.; Liu, S.; Liu, T.-H. Numerical simulation of the Reynolds number effect on the aerodynamic pressure in tunnels. J. Wind. Eng. Ind. Aerodyn. 2018, 173, 187–198. [Google Scholar] [CrossRef]
  46. Yang, W.; Deng, E.; Lei, M.; Zhu, Z.; Zhang, P. Transient aerodynamic performance of high-speed trains when passing through two windproof facilities under crosswinds: A comparative study. Eng. Struct. 2019, 188, 729–744. [Google Scholar] [CrossRef]
  47. GB50157-2013; Code for Design of Metro. China Architecture and Building Press: Beijing, China, 2013.
  48. Ji, J.; Wang, Z.; Ding, L.; Yu, L.; Gao, Z.; Wan, H. Effects of ambient pressure on smoke movement and temperature distribution in inclined tunnel fires. Int. J. Therm. Sci. 2019, 145, 106006. [Google Scholar] [CrossRef]
  49. Lu, Y.; Wang, T.; Yang, M.; Qian, B. The influence of reduced cross-section on pressure transients from high-speed trains intersecting in a tunnel. J. Wind. Eng. Ind. Aerodyn. 2020, 201, 104161. [Google Scholar] [CrossRef]
  50. Rabani, M.; Faghih, A.K. Numerical analysis of airflow around a passenger train entering the tunnel. Tunn. Undergr. Space Technol. 2015, 45, 203–213. [Google Scholar] [CrossRef]
  51. Cross, D.; Hughes, B.; Ingham, D.; Ma, L. A validated numerical investigation of the effects of high blockage ratio and train and tunnel length upon underground railway aerodynamics. J. Wind. Eng. Ind. Aerodyn. 2015, 146, 195–206. [Google Scholar] [CrossRef]
  52. Iida, M.; Tanaka, Y.; Kikuchi, K.; Fukuda, T. Pressure Waves Radiated Directly from Tunnel Portals at Train Entry or Exit. Q. Rep. RTRI 2001, 42, 83–88. [Google Scholar] [CrossRef][Green Version]
  53. The International Union of Railways (UIC). Determination of Railway Tunnel Crosssectional Areas on the Basis of Aerodynamic Considerations; Code UIC 779-11; Railway Technical Publications: Paris, France, 2005. [Google Scholar][Green Version]
  54. Liu, T.; Chen, M.; Chen, X.; Geng, S.; Jiang, Z.; Krajnović, S. Field test measurement of the dynamic tightness performance of high-speed trains and study on its influencing factors. Measurement 2019, 138, 602–613. [Google Scholar] [CrossRef]
  55. Chen, X.; Liu, T.; Xia, Y.; Li, W.; Guo, Z.; Jiang, Z.; Li, M. The evolution of airtight performance for a high-speed train during its long-term service. Measurement 2021, 177, 109319. [Google Scholar] [CrossRef]
  56. CJJ/T298-2019; Standard for Design of Metro Express. Ministry of Housing and Urban-Rural Development of the People’s Republic of China: Beijing, China, 2019.
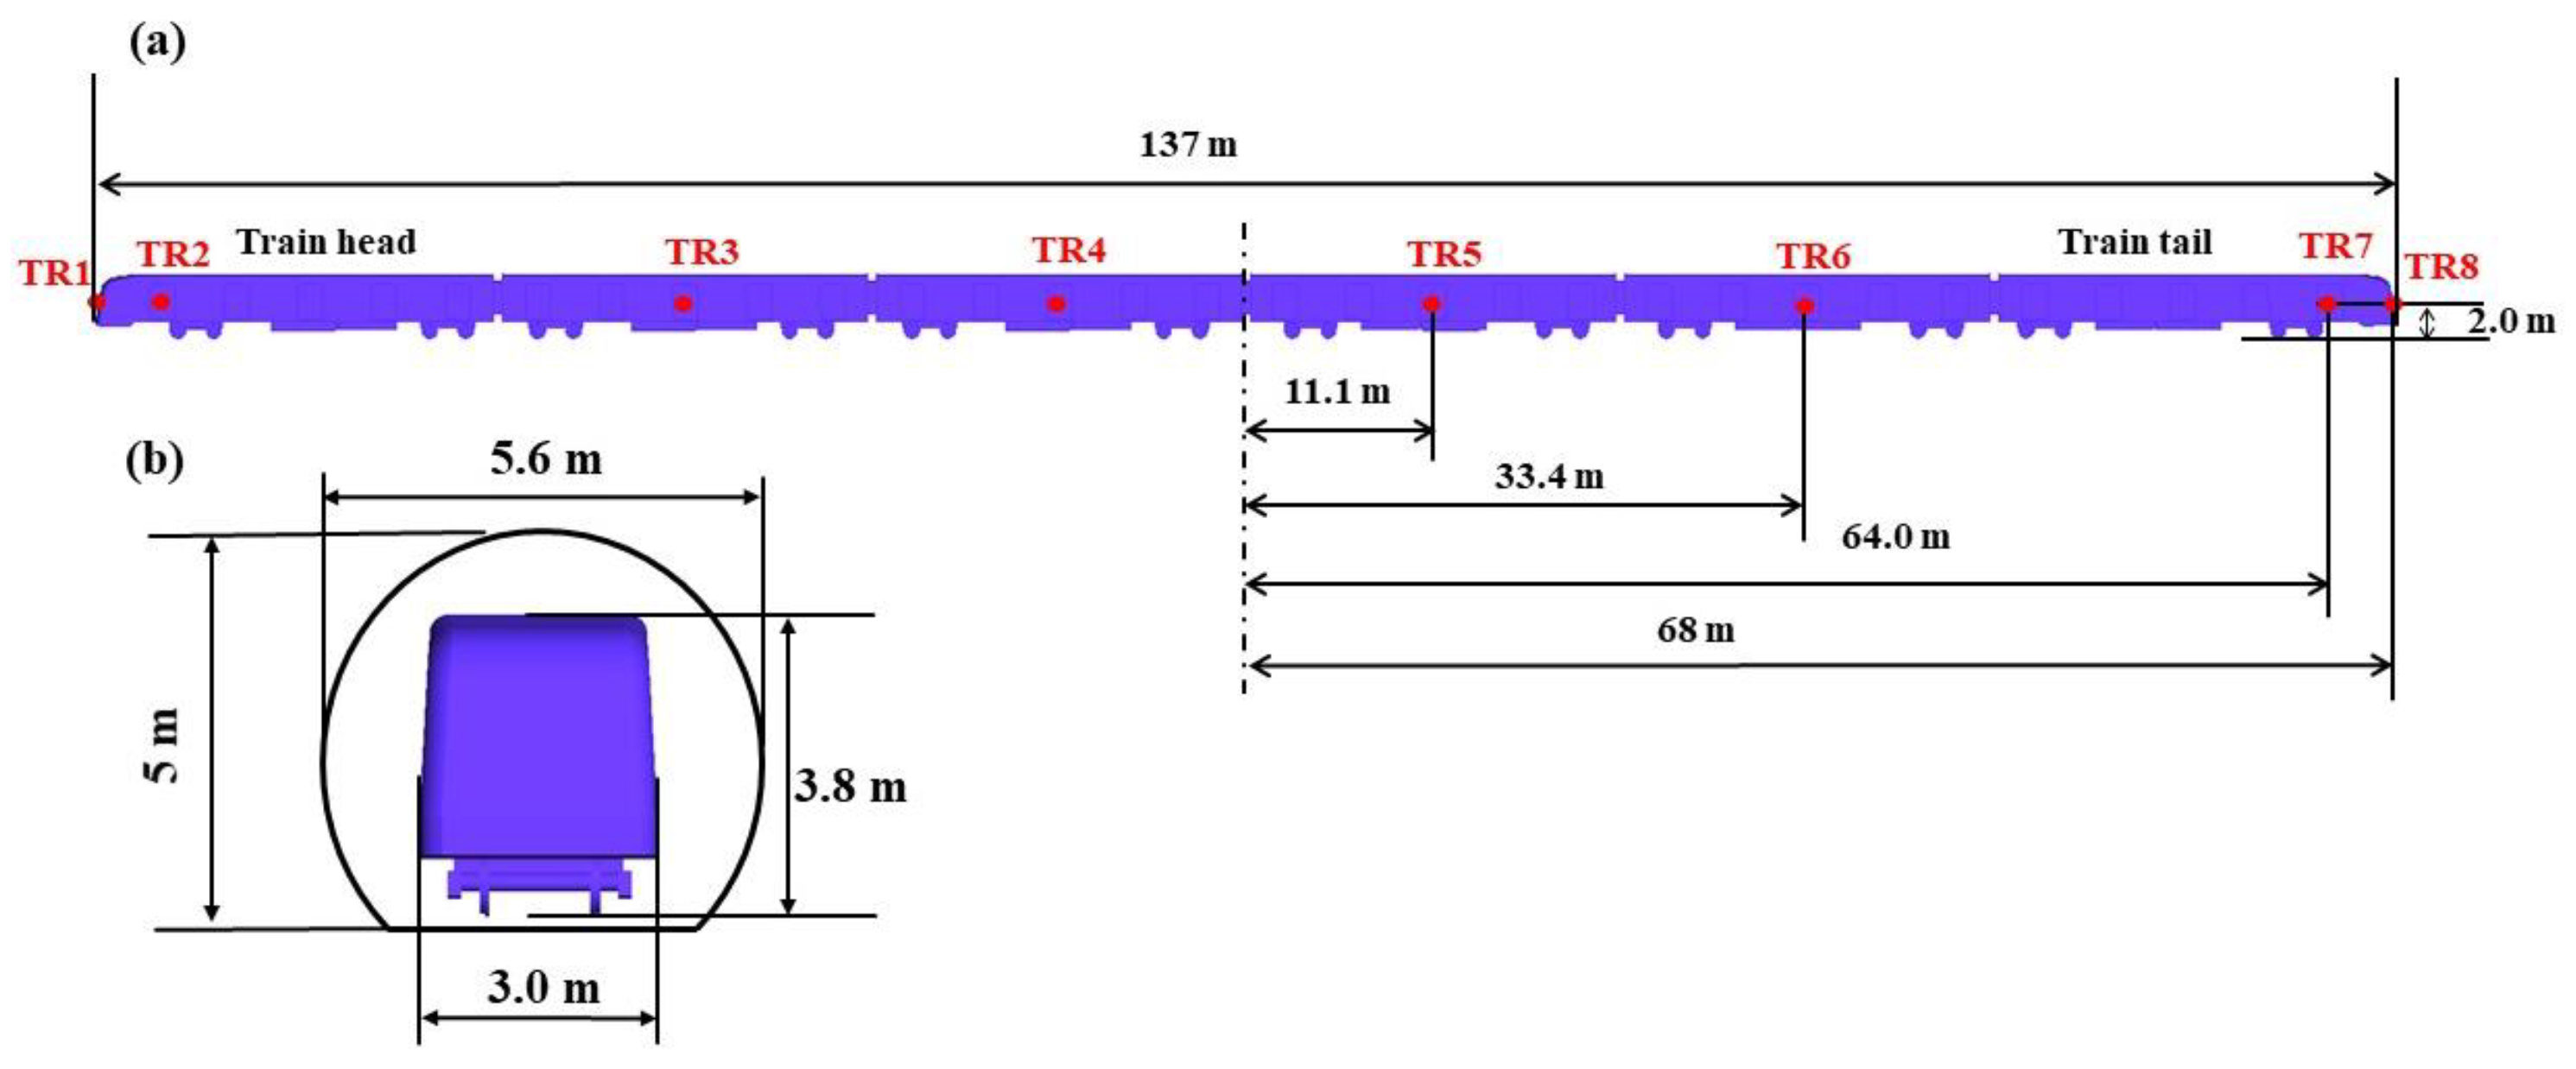
Figure 1. Physical model and measuring point layout; (a) front view; (b) side view.
Modelling 06 00113 g001
Figure 2. Computational domain dimensions and boundary conditions. (a) Side view (b) Top view.
Modelling 06 00113 g002
Figure 3. Pressure-time history of the monitoring point at TR1 under different mesh systems.
Modelling 06 00113 g003
Figure 4. Mesh used in simulations.
Modelling 06 00113 g004
Figure 5. Zhang et al. [27] utilized the model train and tunnel in their study; (a) model train; (b) model tunnel; (c) layout of measurement points.
Modelling 06 00113 g005
Figure 6. Comparison of transient pressure between numerical simulation and moving model test.
Modelling 06 00113 g006
Figure 7. Exterior pressure evolution of the train under different ambient pressures.
Modelling 06 00113 g007
Figure 8. Transient pressure evolution on train surface (TR2) and wave propagation process under different ambient pressures.
Modelling 06 00113 g008
Figure 9. Pressure maxima at various train surface measurement locations.
Modelling 06 00113 g009
Figure 10. Variation in peak pressure with ambient pressure at different measurement points.
Modelling 06 00113 g010
Figure 11. Train interior pressure at different sealing indexes.
Modelling 06 00113 g011
Figure 12. Maximum interior pressure changes under different time scales.
Modelling 06 00113 g012
Table 1. Configuration of the simulation solver.
ParametersSolver Setting
AlgorithmSemi-Implicit Method for Pressure-Linked Equations
Turbulent modelRNG k-ε model
Convection termsSecond-order upwind scheme
Diffusion termsSecond-order upwind scheme
GradientGreen-Gauss cell-based
Time discretizationImplicit scheme
Table 2. The dimensions of the model.
Model TunnelModel Train
Length (m)Distance Between
Track (m)
Cross-Sectional Area (m2)Width (m)Height (m)Speed (km/h)Cross-Sectional Area (m2)
500.250.24870.1630.2073500.03108
Table 3. Reference values for changes in interior vehicle pressure are documented in sources [5,47,56].
CountriesStandardsInstructions
Japan P m a x < 1   k P a
Δ P m a x / 1   s < 200   P a
Suitable for enclosed carriages can be relaxed up to 300 Pa/s
America Δ P m a x / 1.7   s < 700   P a
Δ P m a x / 1   s < 410   P a
Suitable for the subway
Britain Δ P m a x / 3   s < 3   k P a
Δ P m a x / 4   s < 4   k P a
Suitable for 225 km/h non-enclosed carriages
Germany P m a x < 1   k P a
Δ P m a x / 1   s < 300 400   P a
Higher than the original standard of 200 Pa/s
China Δ P m a x / 1   s < 415   P a When Δ P m a x 0.7   k P a
Suitable for the subway ( V T 100   k m / h )
China Δ P m a x / 3   s < 700   P a Suitable for the metro express
( 100   k m / h V T 120   k m / h )
Disclaimer/Publisher’s Note: The statements, opinions and data contained in all publications are solely those of the individual author(s) and contributor(s) and not of MDPI and/or the editor(s). MDPI and/or the editor(s) disclaim responsibility for any injury to people or property resulting from any ideas, methods, instructions or products referred to in the content.