Article

Numerical Analysis of Fatigue Crack Propagation of Deck-Rib Welded Joint in Orthotropic Steel Decks

College of Civil and Transportation Engineering, Hohai University, Nanjing 210098, China
*
Author to whom correspondence should be addressed.
Modelling 2025, 6(3), 83; https://doi.org/10.3390/modelling6030083
Submission received: 7 July 2025 / Revised: 11 August 2025 / Accepted: 12 August 2025 / Published: 18 August 2025

Abstract

This study conducts numerical analysis of fatigue crack propagation in deck-rib welded joints of orthotropic steel decks (OSDs) using linear elastic fracture mechanics. The stress intensity factor for central surface cracks under constant range bending stress is calculated, and single and multi-crack propagation are simulated by a numerical integration method. The research results show that deck geometry critically influences crack propagation behavior. Wider decks accelerate propagation of cracks after the crack depth exceeds half the deck thickness, thicker decks exhibit linearly faster propagation rates yet retain larger residual section to bear loads, and increased weld penetration reduces fatigue life. Initial defects rapidly converge to a preferred propagation path, stabilizing near a f / c f 0.1 ( a f is the failure crack depth and c f is the half surface crack length) regardless of initial aspect ratio. For multi-crack scenarios, defect density dominates merging, doubling density increases final cracks by 45%. Merged cracks adhere closely to the single-crack path, while total section loss escalates with defect density and deck thickness but remains stress range independent. The identified convergence preferred propagation path enables depth estimation from surface-length measurements during real bridge inspections.

1. Introduction

Orthotropic steel decks (OSDs) are widely used in long-span bridges due to their excellent mechanical properties and construction efficiency [1]. However, its complex welding structure leads to fatigue problems, especially under the repeated action of vehicle loads, and fatigue cracks are prone to occur at the welded joints [2]. Fatigue damage accounts for over 60% of the total damage of steel bridges, and 80% to 90% of steel structure failures are related to fatigue damage [3]. The merge and rapid propagation characteristics of fatigue cracks may lead to disastrous consequences. Among the fatigue-sensitive details of OSDs, the deck-rib welded joint is one of the main fatigue-damaged areas [4]. After the crack penetrates, it will lead to local fracture, damage to the pavement layer and structural water seepage corrosion, seriously threatening the safety of the bridge [5].
Experimental studies on fatigue crack propagation in deck-rib welded joints have typically relied on post-fracture crack surface analysis [6] or beach mark [7] to track crack propagation at specific load cycles. However, these experimental methods are limited to the analysis of individual parameters for comparative analysis of crack morphology and propagation behavior [8]. In addition, numerical simulation has emerged as a primary method for investigating fatigue crack propagation in welded joints [9]. Existing numerical studies have focused on single-crack propagation [10], analyzing crack morphology and fatigue life under controllable experimental factors. The crack simulation and fatigue life analysis of welded joints carried out based on numerical simulation have been verified to be effective [11]. Further consideration of the initiation and propagation of multi-scale fatigue cracks in OSDs under the coupling effect enables the analysis of single crack propagation to gradually approach the crack propagation state in real experiments [12]. However, in real bridges, the length of deck-rib welded joints, often exceeding 3 m [13], frequently exhibit multiple crack initiation sites, leading to the simultaneous propagation of multiple cracks [14]. Such multi-crack interactions exacerbate fatigue damage, accelerating failure and reducing the fatigue life of welded joints compared to single-crack scenarios [15]. Current multi-crack analyses primarily consider parameters such as crack size and inter-crack spacing [16]. However, the random distribution of initial defects in actual bridge weld seams, encompassing variations in defect quantity, position, and morphology [17]. Moreover, existing fatigue failure criteria, such as those based on stress range [18], crack length [19], or critical crack depth [20], are predominantly tailored to single-crack scenarios. These criteria lack a robust physical connection to multi-crack interaction mechanisms and are difficult to apply in real bridges, where detailed crack data are rarely available. This gap hinders accurate failure assessment and reliable prediction of fatigue life in OSDs welded joints.
To address these challenges, this study uses linear elastic fracture mechanics (LEFM) to investigate fatigue crack propagation in deck-rib welded joints. The stress intensity factor (SIF) for central surface cracks under constant-range bending stress is determined, and numerical integration simulates both single- and multi-crack propagation. The influence of deck geometry (width, thickness, and weld penetration), initial defect characteristics, and stress range on crack growth behavior is systematically examined. For single-crack propagation, the study evaluates crack growth rates and shape evolution. For multi-crack scenarios, a probabilistic approach uses Latin Hypercube Sampling to account for the random distribution of initial defect quantities, positions, and sizes. Crack merging criteria model interactions, enabling statistical analysis of crack number, length, and shape evolution. The findings aim to establish a preferred crack propagation path, facilitating practical depth estimation based on surface measurements during bridge inspections and providing a robust framework for fatigue life prediction in OSDs.

2. Methods

2.1. Calculation of Stress Intensity Factor

The crack propagation analysis for deck-rib welded joints in OSDs employs linear elastic fracture mechanics principles. Within fracture mechanics, crack displacement modes are fundamentally categorized into three distinct types: tensile-opening K I (Mode I), in-plane sliding K I I (Mode II), and out-of-plane tearing K I I I (Mode III). Experimental observations confirm that fatigue cracks developing at deck-rib welded joints predominantly exhibit Mode I characteristics [21]. Therefore, the calculation method of the K I is considered. The generalized stress intensity factor solution for such defects follows the functional form expressed in Equation (1):
K I   =   Y σ π a
In the equation, Y is the correction coefficient, σ is generally described by the stress at the crack location assuming no crack exists, and a is the crack size. The range of the stress intensity factor is as follows:
K I   =   Y σ π a
Y σ = M f w k t m M k m M m σ m + k t b M k b M b σ b + k m 1 σ m
In the formula, M is the propagation correction coefficient, f w is the finite width correction coefficient, k t is the stress concentration coefficient caused by the discontinuity of the capillary structure, M k is the amplification coefficient caused by the crack located in the local stress concentration area such as the welded joint, σ m and σ b respectively represent the film stress and bending stress, k m is the stress amplification coefficient caused by the misalignment of the weld seam. For surface cracks in a finite plate, the crack shape is usually semi-elliptical, as shown in Figure 1.
f w =   s e c 0.5 π c a / t / 2 b
The influence of propagation correction and weld misalignment is not considered, M   =   1 , k t   =   1 . Under bending stress, σ m   =   0 :
K I   =   f w M k M b σ b π a
M k = m a x v z / t w , l
In the equation, z is the depth of the crack front, l is the adhesion length, as shown in Figure 1, when θ   =   π / 2 , z   =   a , and z   =   0.15   m m , the value of v and w are shown in Table 1 [22].
If 0 < a / c 1 , 0 < a / t < 1 , and 0 < c / b < 1 :
M b   =   H M m
H =   H 1 + H 2 H 1   sin q θ
q = 0.2 + a / c + 0.6   a / t
H 1 = 1 0.34 a / t 0.11   a / c a / t
H 2 = 1 + G 1 a / t + G 2   a / t 2
G 1 = 1.22 0.12   a / c
G 2 = 0.55 1.05   a / c 0.75 + 0.47   a / c 1.5
M m = M 1 + M 2   a / t 2 + M 3   a / t 4 g f θ / Q 0.5
Q = 1 + 1.464   a / c 1.65
M 1 = 1.13 0.09   a / c
M 2 = 0.54 + 0.89 / 0.2 + a / c
M 3 = 0.5 1 / 0.65 + a / c + 14   1 a / c 24
g = 1 + 0.1 + 0.35 a / t 2   1 sin θ 2
f θ = a / c 2 cos 2 θ + sin 2 θ 0.25
In the equation, a is the crack depth, c is the half-length of the crack, t is the deck thickness, θ is the angle between the radial line passing through any point on the crack front and the deck surface.

2.2. Single Crack Propagation Model

The crack propagation rate of the deck-rib welded joint in OSDs during the stable crack propagation stage is described by the Paris formula [23]:
d a d N   =   C K m
In the formula, the crack size is a , the cycle number is N , C and m are the basic parameters of the material’s fatigue crack propagation performance. The initial size of the crack a 0 , the final size of the crack a f , and the stress range σ are known. The propagation simulation process of single crack is shown in Figure 2.
For two-dimensional cracks, such as surface cracks in a finite plate, there are the following:
d a i d N i   =   d a ¯ d N i   =   C a   K a i ¯ m
d c i d N i = d c ¯ d N i = C c   K c i ¯ m
Dividing the two equations get the following:
a i c i   =   C a C c   K a i ¯ K c i ¯ m
C c = 0.9 m C a
a i c i = K a i ¯ 0.9 K c i ¯ m K a i 0.9 K c i m
The ratio C c   =   0.9 m C a follows BS7910 guidelines for steel welded joints [24]. To keep the number of cycles corresponding to the crack size increments selected in the depth and length directions synchronized, take a i   =   0.01 a i , c i   =   0.01 c i . If a i c i < K a i 0.9 K c i m , let c i   =   a i K a i 0.9 K c i m , otherwise, let a i   =   c i K a i 0.9 K c i m .

2.3. Multi-Crack Interaction Method

Before the plastic zones at the crack tips contact, the crack propagates independently. Cracks will rapidly merge and expand after contact [25]. For coplanar cracks, when s 0.5 m a x a 1 , a 2 , they can be re-characterized as equivalent cracks, a   =   m a x a 1 , a 2 , and c   =   c 1 + c 2 + s / 2 , as shown in Figure 3. Among them, a 1 / c 1 1 , a 2 / c 2 1 .
For multiple cracks, there are the following formulas:
a n i N i   =   d a d N n i ¯   =   C   K n i ¯ m
a m i N i = d a d N m i ¯ = C   K m i ¯ m
In the formula, the subscripts n and m represent the crack numbers. Dividing the two formulas:
a n i a m i   =   K n i ¯ K m i ¯ m K n i K m i m
Take a n i   =   0.01 a n i and c n i   =   0.01 c n i . Synchronize the number of cycles corresponding to the increment of each crack size:
a n i   =   m i n a n i K a n i m K a n i m
c n i = m i n c n i K c n i m K c n i m
The number of cycles corresponding to the increment of synchronous crack depth and length. If a n i c n i ¯ < K a n i 0.9 K c n i m ¯ , let c n i = a n i / K a n i 0.9 K c n i m ; otherwise, let a n i = c n i / K a n i 0.9 K c n i m .

2.4. Analysis Parameters

Referring to the design of the real steel bridges and fatigue test specimens, the model size for analysis was selected. For cracks that originate from the weld toe, the International Institute of Welding (IIW) suggests taking the initial depth of the crack a 0   =   0.1   m m , and the initial aspect ratio a 0 / c 0 can be taken as 0.1 to 1 [24]. For steel-welded joints in environments with temperatures below 100 °C, air, and other non-corrosive conditions, BS7910 recommends the material parameters C   =   5.21 × 10 13 and m   =   3.0 for fatigue crack propagation [26], threshold K t h   =   63 N / m m 3 / 2 , C c / C a 1 / m   =   0.9 . Taking the bolded value as the reference input, only a single parameter is changed each time. It should be noted that this study adopts the following assumptions: (1) Dominant Mode-I crack propagation, supported by experimental observations [21]; (2) Neglect of welding residual stresses and corrosion effects; (3) Material homogeneity under linear elastic conditions. These simplifications focus the analysis on geometric and defect-driven propagation mechanisms. As shown in Table 2.
For the random distribution and propagation of multiple cracks, if there are n initial defects per meter in the deck-rib welded joint, then the defect positions x in a single sampling are uniformly distributed along the length direction of the weld, and the defect rate n in multiple sampling follows a Poisson distribution. The initial depth a 0 and aspect ratio a 0 / a c of the crack follow exponential distribution and normal distribution, respectively. Take a 1 m-long weld as the standard segment. When calculating, the longitudinal weld seam can be regarded as a cycle of the standard segment. The final size of the crack is taken as a f   =   t or c f   =   s / 2 . Taking the bolded value as the reference input, only a single parameter is changed each time to study the crack propagation law. Latin hypercube sampling was adopted, and the number of selected samples was 10,000. As shown in Table 3.

3. Results and Discussions

3.1. Single Crack Propagation

3.1.1. Effect of Geometric Dimension

Considering the influence of the geometric dimensions of the component on crack propagation, analyses were carried out for the deck width b , deck thickness t , and welding penetration rate p .
The crack propagation rates for different deck widths b are shown in Figure 4a. When a < t / 2 , the curves nearly coincide, indicating that b has a relatively small influence on early crack propagation. However, after a > t / 2 , the influence of b becomes apparent. For b   =   150   m m , the crack does not penetrate the deck until it propagates across the entire width. For b   =   300 and 450     m m , the crack depth reaches the deck thickness, with only slight differences in fatigue life and c between them. Based on the fatigue test results of the deck-rib weld joints [26], the propagation of the fatigue cracks shows a stable initial stage, and then rapidly grows when the crack length reaches a length of 150 mm. This is similar to the results of the numerical simulation, which proves that the numerical simulation results can reflect the fatigue crack propagation law of the real deck-rib welded joint. Based on Figure 4a, the logarithm of the crack size was taken to obtain Figure 4b. Except during the initial and final stages of crack propagation, the crack size exhibits an approximately linear relationship with load cycles, indicating that crack size increases exponentially with the cycle. Furthermore, the crack propagation rate is characterized by the slope of the curve. For deck-rib welds in real bridges, where the width typically exceeds 3 m, the fatigue crack propagation rate at non-boundary positions shows minimal variation. Therefore, it is suggested that overly short deck widths should be avoided in experiments and simulations.
As shown in Figure 4c, the propagation rate increases with increasing deck thickness t . Under the same stress level, a smaller t results in a steeper stress gradient, a smaller material volume within the high-stress area, and consequently, slower crack propagation. Figure 4d shows that the propagation rate is approximately linearly related to t . The propagation rate has an approximately linear relationship with t . In the length direction, the increase in propagation rate with t is slightly greater than that in the depth direction.
As shown in Figure 4e, a higher penetration rate p corresponds to a faster crack propagation rate. This occurs because a deeper weld penetration depth leads to a greater stiffness discontinuity at the joint, resulting in enhanced local stress concentration at the weld toe and consequently a higher crack propagation rate. The propagation rate is approximately linearly related to p . The effect of increase in p is also slightly greater in the length direction than in the depth direction.
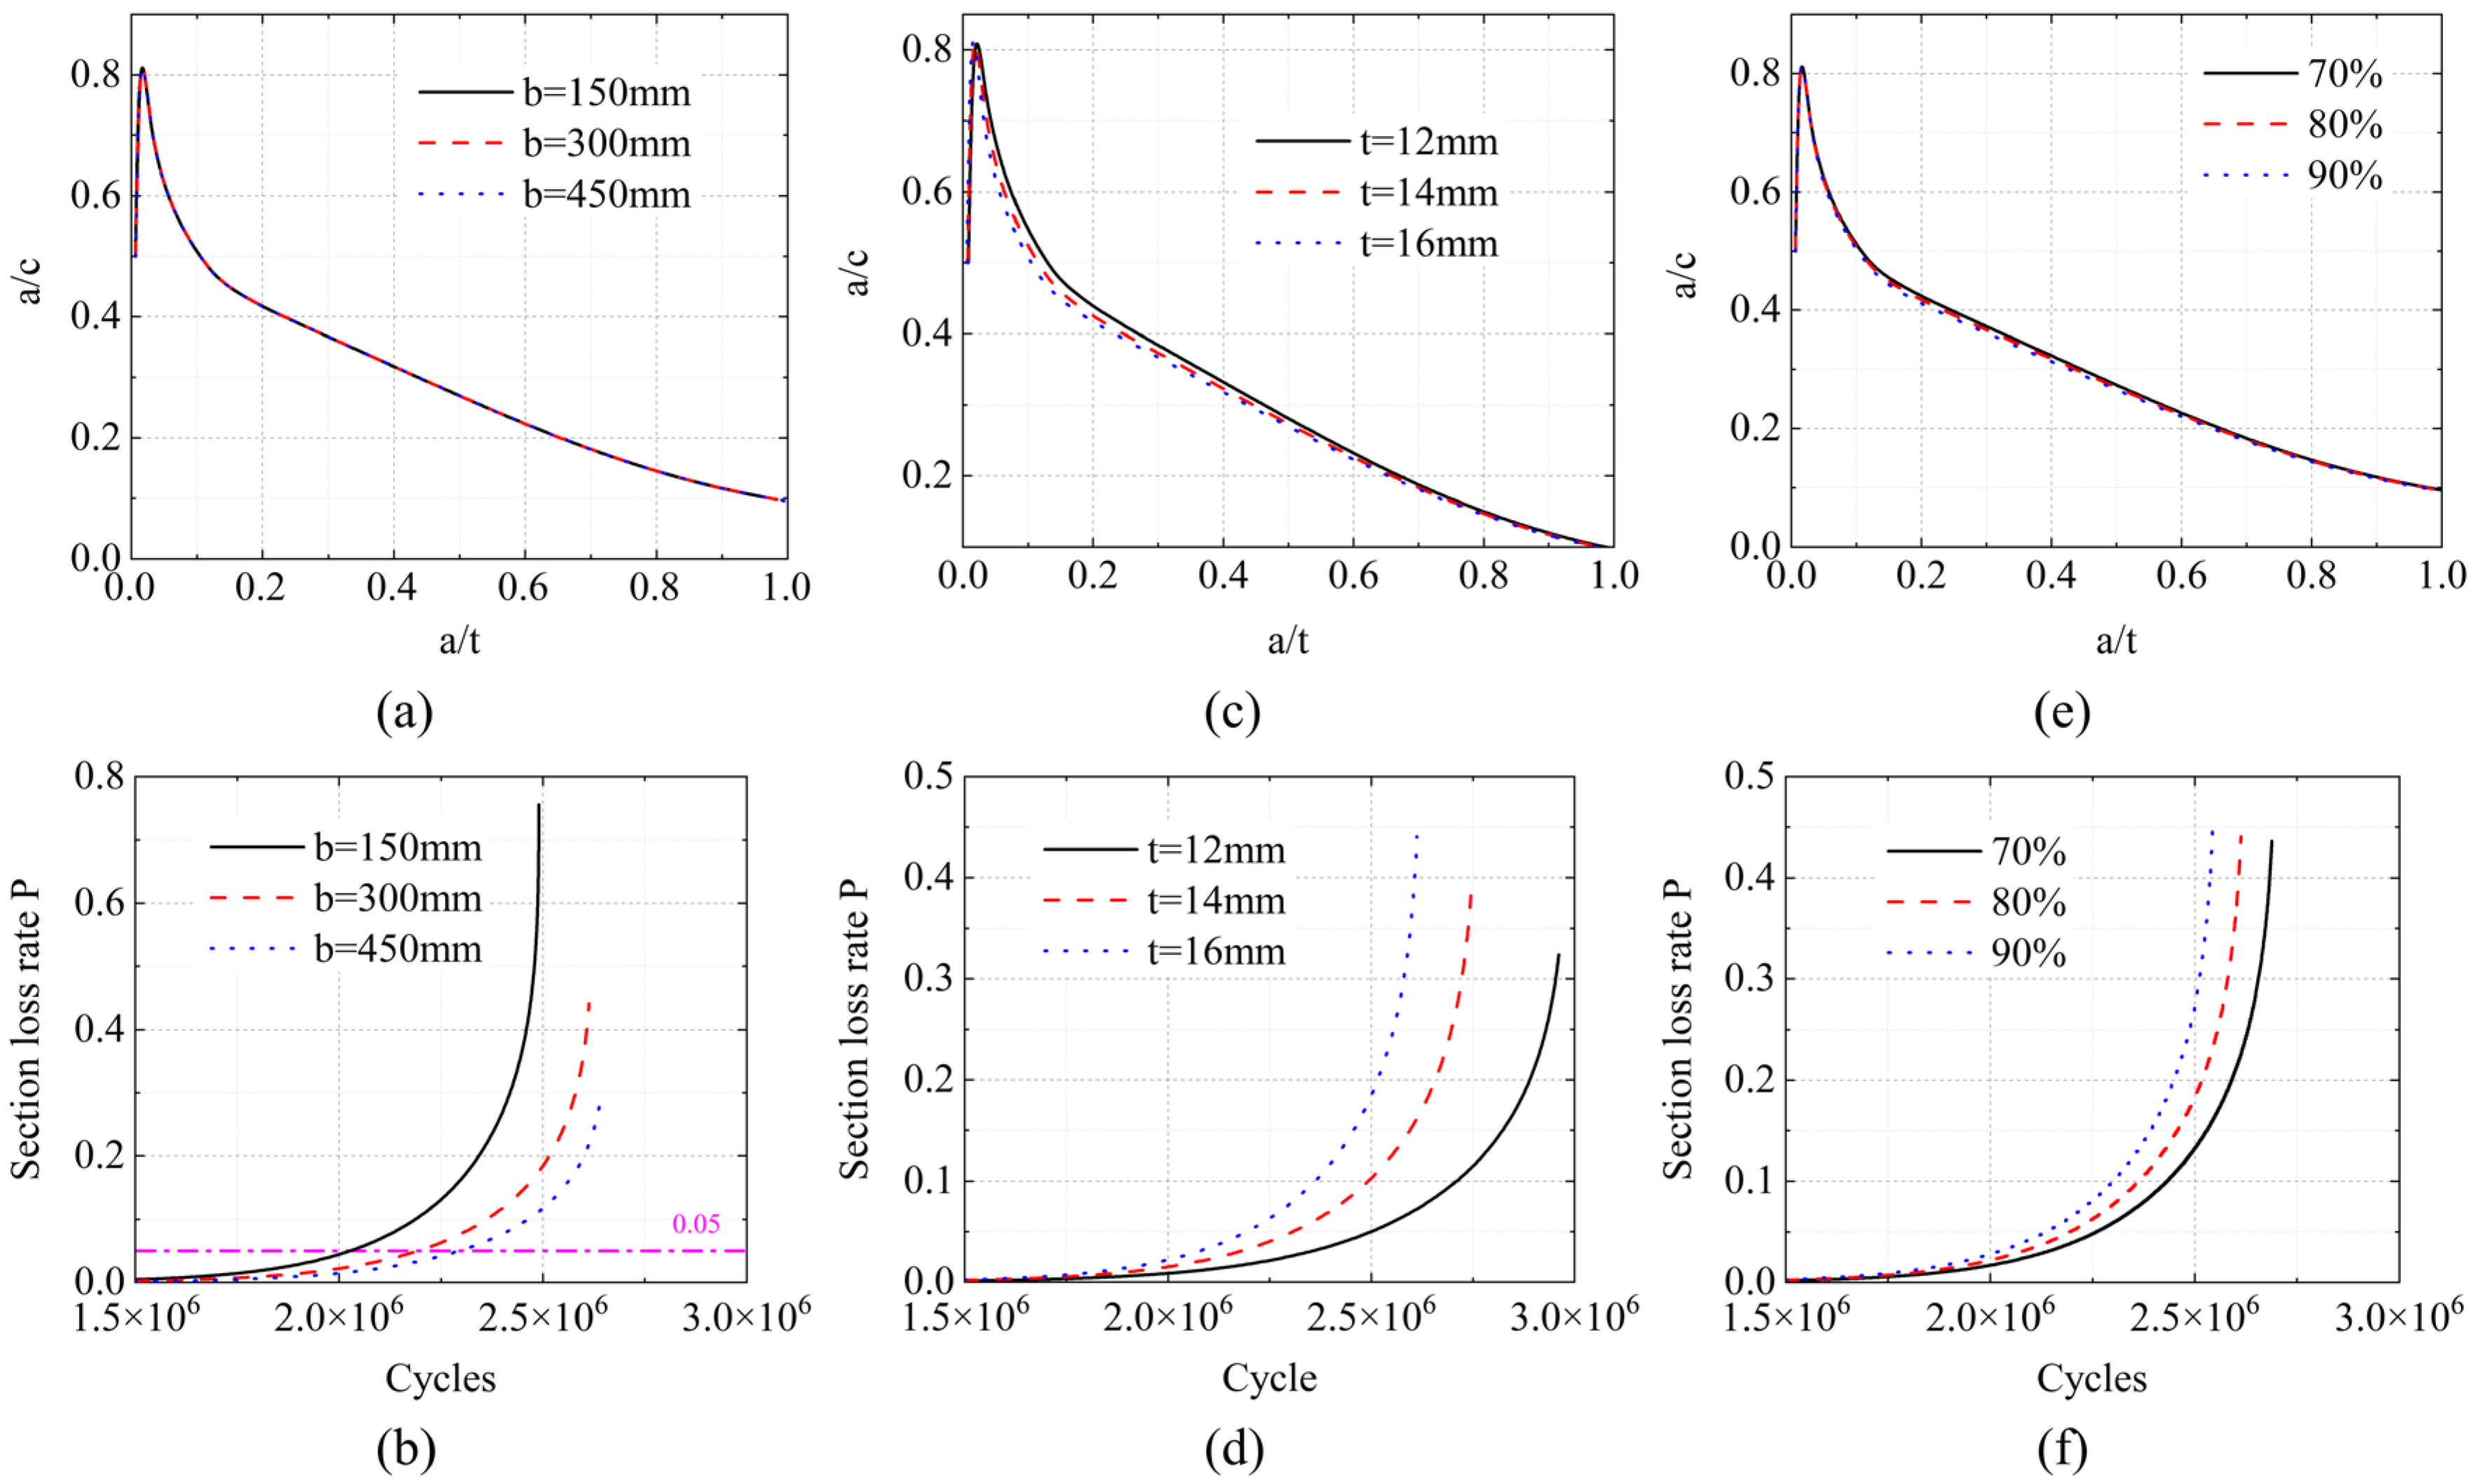
Figure 5a presents the variations in crack morphology for different deck widths b . Before a / t < 0.1 , the propagation aspect ratio a / c increases sharply. Subsequently, its rate of change slows. As b increases, the propagation speed of the crack in the length direction exceeds that in the depth direction. The correlation between the aspect ratio a / c and b is extremely small. Figure 5b presents the section loss rates for different b . Section loss is minimal during the early and middle stages of fatigue life. Taking b   =   150   m m as an example, even when 80% of the total fatigue life is reached, the section loss rate remains less than 0.05. In the later stage, the load-bearing cross-sectional area decreases rapidly. The closer the geometric ratio t / b is to the final aspect ratio a f / c f , the greater the final section loss rate will be.
Figure 5c presents the variation in the crack aspect ratio a / c under different deck thickness t . The influence of t on a / c is concentrated in the early crack propagation stage. This influence reverses after a / c reaches its peak value; subsequently, the effect of t gradually weakens during the middle and later stages. Figure 5d presents the section loss rates under different t . The section loss rate increases with increasing t , and this effect becomes more pronounced as the crack extends. For every 2 mm increase in t , the section loss rate P f increases by less than 0.06. However, the remaining load-bearing cross-sectional area of the thicker deck is still larger than that of the thinner deck. Consequently, in the presence of cracks, the working performance of the thicker deck remains superior.
Figure 5e presents the influence of penetration rate p on the crack aspect ratio a / c , which shows a significant correlation with a / c evolution. The differences in a / c under different p are relatively large during early-stage propagation. In the middle and later stages, a / c variations stabilize, and the influence gradually weakens. For every 10% increase in p , the maximum difference in a / c remains below 0.01. This indicates that the influence of p on a / c can be neglected. Figure 5f presents the influence of p on section loss rate. The section loss rate increases with higher p . For every 10% increase in p , the section loss rate increases by less than 0.005, and the fatigue life decreases by less than 3%.

3.1.2. Effect of Initial Defect

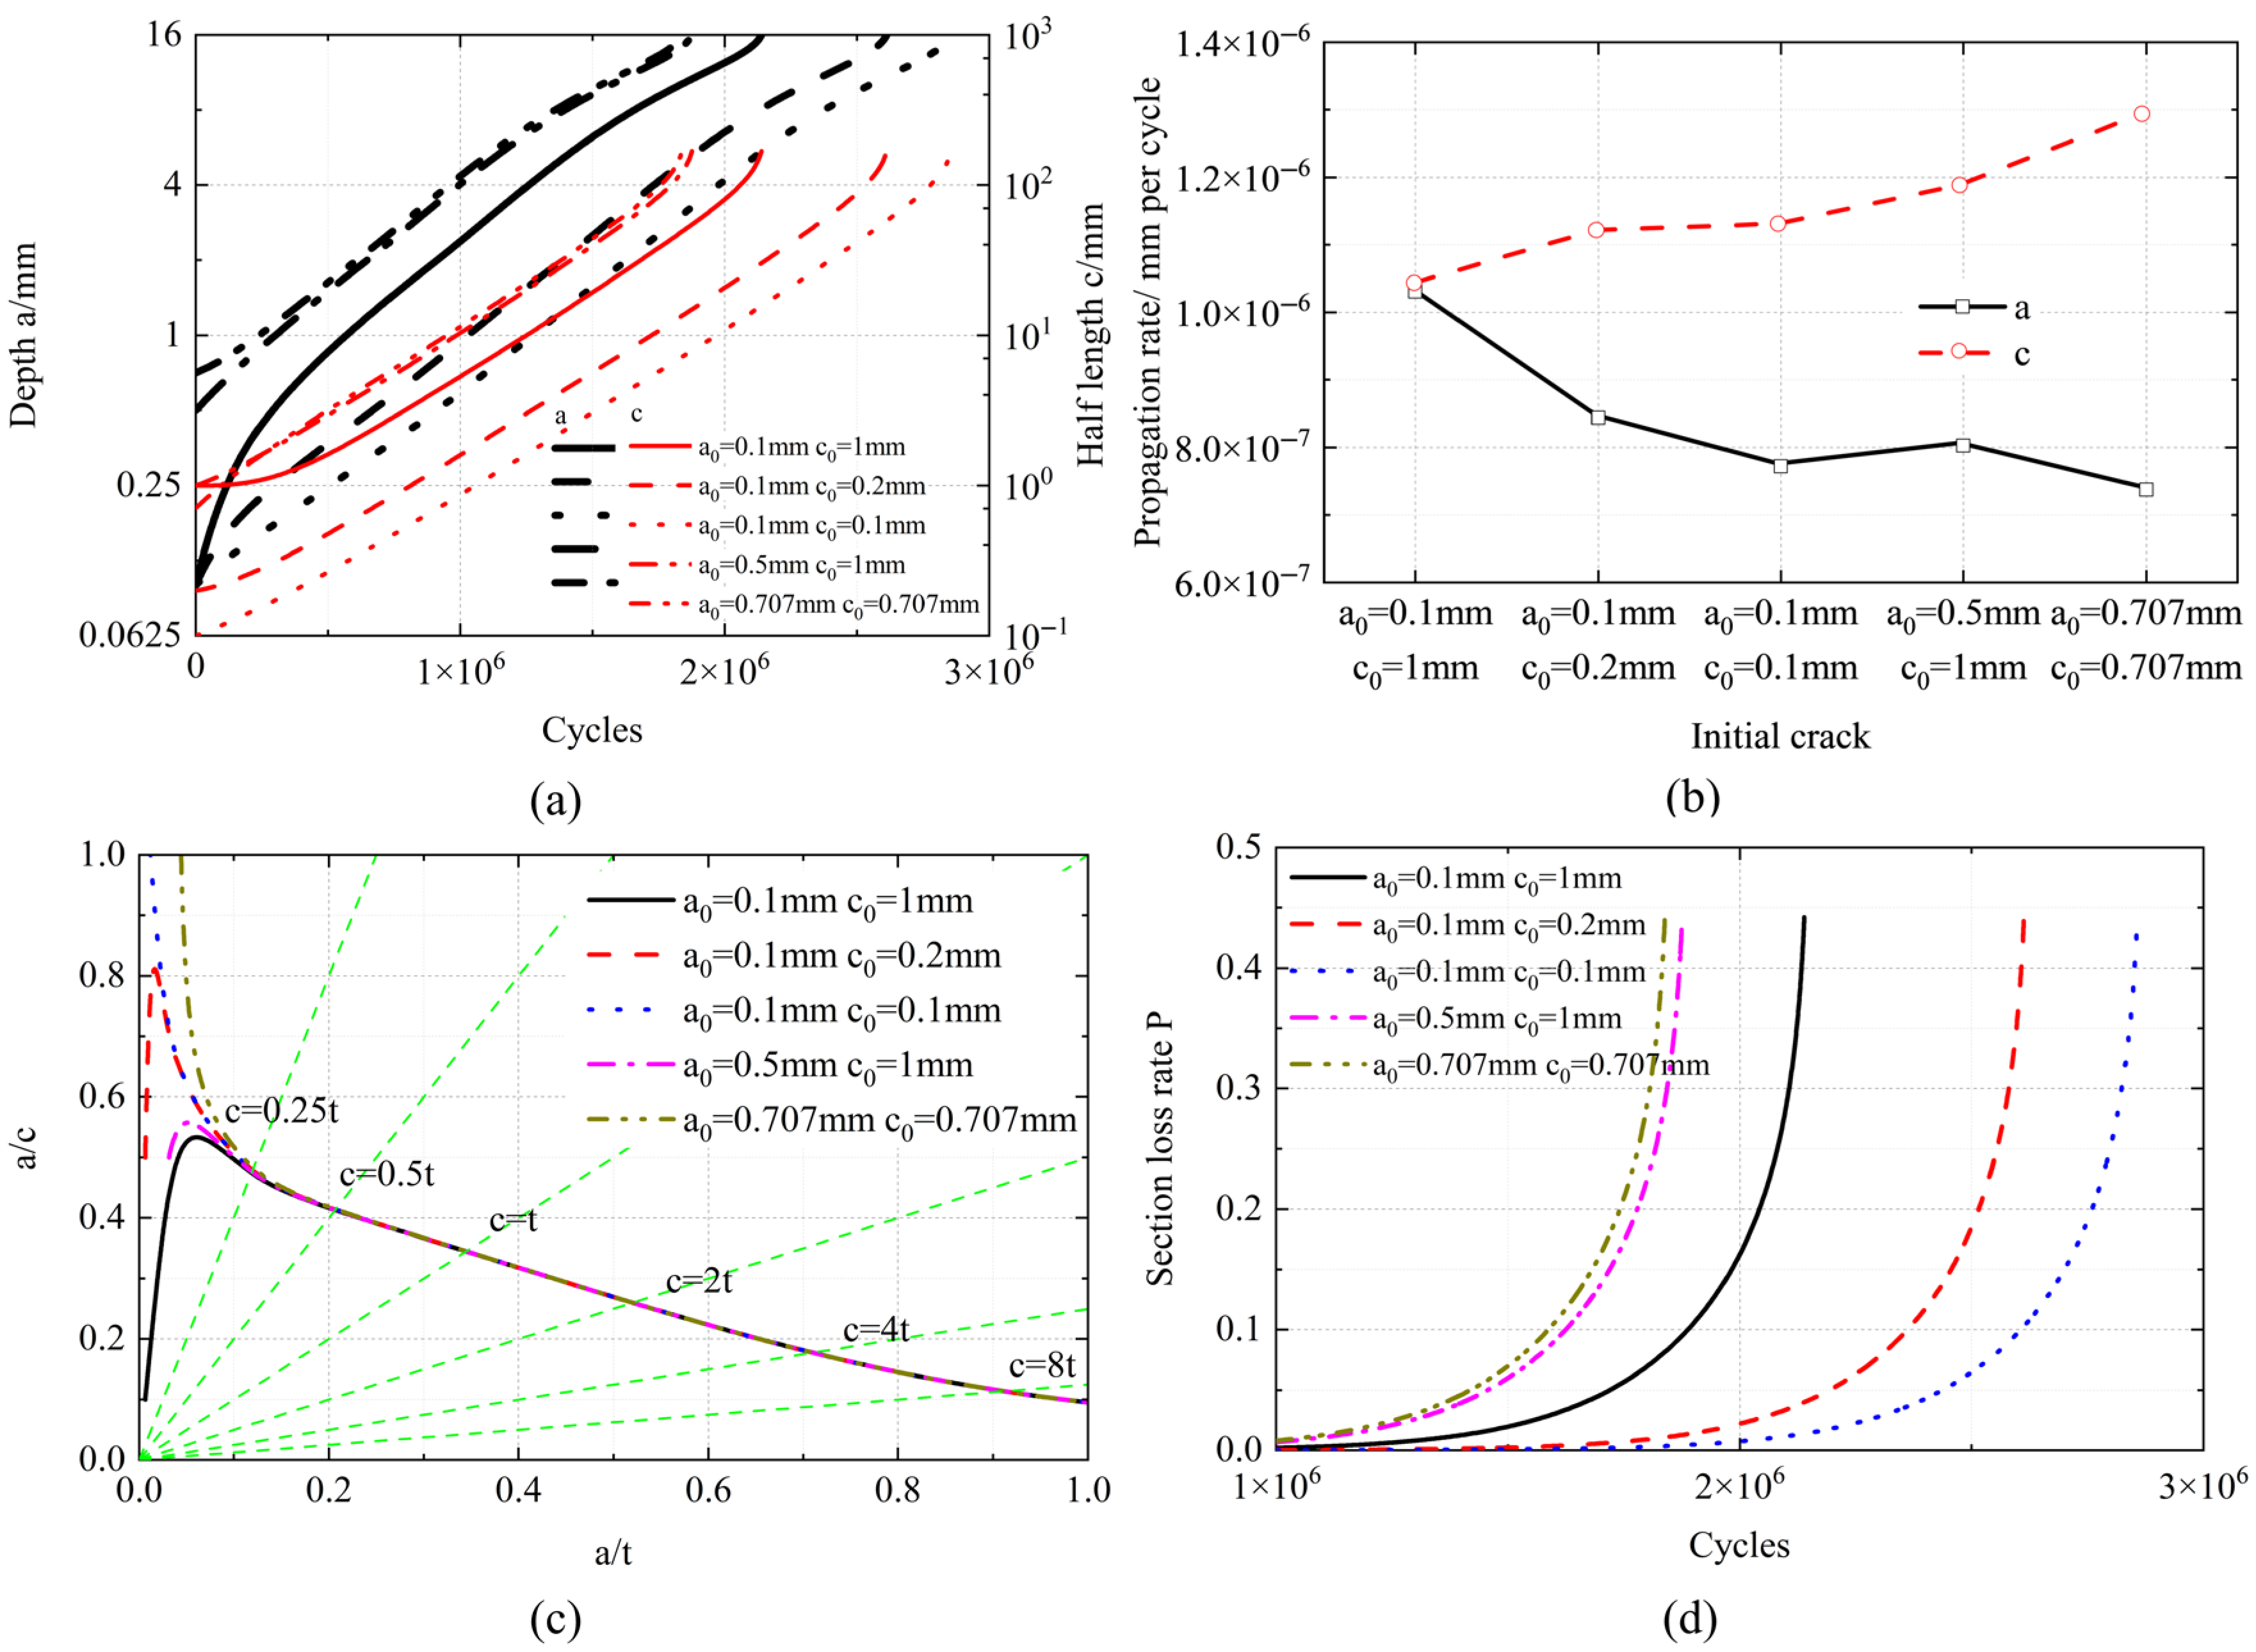
Consider the influence of the initial defect on crack propagation, as shown in Figure 6a. The middle parts of each curve are approximately parallel, and deviations occur at the beginning and end of the propagation. When a 0 / c 0   =   1 , the deviation is the smallest and the curve is close to linear. The smaller a 0 / c 0 is, the greater the deviation will be. The deviation of the depth direction curve is convex upwards, while the deviation of the length direction curve is concave downwards. When a 0 is the same, the longer the half-length, the shorter the fatigue life. When c 0 is the same, the deeper the depth, the shorter the fatigue life. When a 0 / c 0 is the same, the larger the size, the shorter the fatigue life. When the initial area of the crack is the same, the propagation curves in the depth and length directions are approximately coincident, and the fatigue lives are close.
The influence of the initial defect on the crack propagation rate is shown in Figure 6b. When a 0 or c 0 or the area is the same, the larger the aspect ratio, the smaller the propagation rate in the depth direction and the greater the propagation rate in the length direction. When a 0 / c 0 is the same, the larger the size, the smaller the propagation rate in the depth direction and the greater the propagation rate in the length direction. Overall, the larger the initial size of the crack, the shorter the fatigue life. When the initial area is the same, the fatigue life is also comparable. The larger a 0 / c 0 is, the smaller the propagation rate in the depth direction and the greater the propagation rate in the length direction.
Consider the influence of the initial defect on crack morphology, as shown in Figure 6c. In the early stage of crack propagation, a / c changes sharply. With the propagation of the crack, the difference of a / c gradually increases. When a / t reaches 0.1, a / c converges to approximately 0.5. In the middle and later stages of propagation, the development of different a 0 / c 0 tends to be consistent, and finally a f / c f is approximately 0.1. With the propagation of the crack, different initial shapes tend to develop into a preferred propagation path. a / c first changes rapidly to the vicinity of the preferred propagation path, and then continuously decreases along the curve. In the early stage of crack propagation, although their shapes vary greatly, smaller crack sizes are difficult to cause serious hazards. In the middle and later stages, if the crack length is measured, the current depth can be obtained by combining the preferred propagation path.
The section loss rates under different initial defects are shown in Figure 6d. The final section loss rates under each input differ by less than 0.002. The influence of initial defects is reflected in fatigue life. The larger the initial size, the shorter the fatigue life. When the initial area is the same, the fatigue life is comparable.

3.2. Multi-Crack Propagation

3.2.1. Quantity of Cracks

Figure 7a presents the variation in the number of cracks during the propagation process under different initial crack numbers n . The derivative of the crack merging rate is shown in Figure 7b. When n doubles, the final number of cracks increases by approximately 45%. The more defects there are within the unit length of the weld seam, the faster the cracks merge. The crack merging rate continued to increase in the early and middle stages, while the increase decreased in the later stage.
The changes in the number of cracks n and the crack merging rate during the propagation process under different deck thicknesses t are shown in Figure 7c,d. As t   thickness   increases , n decreases more rapidly and cracks merge more quickly; however, the influence of t on the final number of cracks is relatively slight.
The changes in the number of cracks n and the crack merging rate during the propagation process under different stress ranges σ are shown in Figure 7e,f. The larger σ , the faster n decreases and the faster the crack merges. Under the inputs of σ   =   100   M P a and σ   =   125   M P a , the differences are extremely small. The initial and final crack numbers differ by only approximately 1% and 0.1%, respectively. Approximately 98% of the initial defects develop into cracks. Under the input of σ   =   80   M P a , the number of cracks decreased significantly, and about 84% of the initial defects developed into cracks.

3.2.2. Length of Cracks

The average values, 2.5% quantiles and 97.5% quantiles of the relative length ratios of the maximum crack to all cracks, c m a x / b and c / b , are statistically analyzed, as shown in Figure 8a,b. For the maximum crack, the length ratio shows a positively skewed distribution. The slope of the curve keeps increasing. Compared with the depth direction, the crack expands faster in the length direction, and the discretization of c m a x / b becomes stronger. The more defects there are, the more cracks that expand and merge simultaneously, the larger the length ratio, and the faster they increase. For every 8 increases in n , the average value of the final c m a x / b increases by approximately 5%, the 97.5% percentile increases by approximately 6%, and the 2.5% percentile increases by less than 2%. Unlike the maximum crack, for all cracks, the length ratio is symmetrically distributed, the slope of the curve is relatively stable, and the length direction and the depth direction basically expand synchronously. For every 8 increases in n, the final average value of c / b increases by approximately 7%, the 97.5% percentile increases by approximately 3%, and the 2.5% percentile increases by approximately 11%.
As shown in Figure 8c,d, for the maximum crack, the thicker the deck thickness and the greater the length ratio, the faster it increases. For every 2 mm increase in t , the final average value of c m a x / b increases by approximately 18%, the 97.5% percentile increases by approximately 18%, and the 2.5% percentile increases by approximately 17%. For all cracks, the variation pattern is similar. The thicker the deck thickness and the greater the length ratio, the faster it increases. For every 2 mm increase in t , the final average value of c / b increases by approximately 8%, the 97.5% percentile increases by approximately 6%, and the 2.5% percentile increases by approximately 11%. It can be known from Figure 8a–d that the lower limit of the 95% tolerance interval on both sides of c m a x / b is more affected by the deck thickness, while the lower limit of the 95% tolerance interval on both sides of c / b is more affected by the number of defects.
As shown in Figure 8e,f, for the maximum crack, for every 25% increase in the stress range, the average value, 97.5% percentile, and 2.5% percentile of the final c m a x / b all increase by less than 0.4%. For all the cracks, for every 25% increase in the stress range, the average value, 97.5% percentile and 2.5% percentile of the final c / b increase by less than 0.8%. The relative propagation of cracks in the length direction and depth direction is almost unaffected by σ . Compared with σ   =   100   M P a and σ   =   125   M P a , the initial number of cracks under the input of σ   =   80   M P a decreased by approximately 14%, and the change in crack length was close. It can be seen that due to the low σ , the initial size of the non-extendable part of the initial defect is very small. Even if it develops under a higher σ , the proportion of this type of crack in the total length is extremely small and can be ignored.

3.2.3. Geometry of Cracks

The aspect ratio a / c of the maximum crack and the section loss rate P of all cracks were, respectively, calculated, as shown in Figure 9.
As shown in Figure 9a, the aspect ratio of the maximum crack presents a negatively skewed distribution. Before the depth ratio reaches approximately 0.1, the aspect ratio converges rapidly and tends to develop into the preferred propagation path as the crack propagation. After a / t > 0.1 , the difference between the 97.5% percentile and the mean does not exceed 0.03, and the upper limit of the bilateral 95% tolerance interval can be conservatively used as the preferred propagation path. The more defects there are, the more cracks will expand and merge simultaneously, resulting in a smaller aspect ratio; however, the impact will be small after the crack converges to the preferred propagation path. Under the reference input, the aspect ratio of the converged single crack differs from the average value of the multiple cracks by no more than 0.03, and from the upper limit of the 95% tolerance interval on both sides of the multiple cracks by no more than 0.001. The preferred propagation path of the largest crack among the multiple cracks can be regarded as the single crack. The aspect ratio of final crack with multiple cracks after propagation and merging is less than or equal to the preferred propagation path of the corresponding single crack and develops gradually towards it. The distribution law is similar to that of the maximum crack. As shown in Figure 9b, the area ratios of all cracks are approximately symmetrically distributed, and the sectional loss gradually accelerates as the cracks deepen. For every 8 increases in n , the average value of the final P increases by approximately 5%, the 97.5% quantile increases by approximately 3%, and the 2.5% quantile increases by approximately 6%.
As shown in Figure 9c, the thicker the deck thickness, the smaller the aspect ratio of the maximum crack. After a / t > 0.1 , for every 2 mm increase in t , the average value of a / c decreases by no more than 0.02, the 97.5% percentile decreases by no more than 0.03, and the 2.5% percentile decreases by no more than 0.03. Similarly to the case of a single crack, the influence of plate thickness is relatively small. As shown in Figure 9d, the greater the thickness of the deck, the larger the area ratio of all cracks and the faster they increase. For every 2 mm increase in t, the average value of the final ΣP increases by approximately 10%, the 97.5% percentile increases by approximately 8%, and the 2.5% percentile increases by approximately 14%. However, the remaining bearing section area of the thick deck is larger than that of the thin deck.
As shown in Figure 9d, similar to the case of a single crack, the aspect ratio and area ratio of the largest crack in multiple cracks are independent of σ . As shown in Figure 9e, similar to the length ratio, the area ratio of all cracks is almost unaffected by σ e. During the crack propagation, the initial defects where the stress intensity factor does not reach the threshold value account for a very small proportion in the total section loss and can be ignored.

4. Conclusions

This study employed linear elastic fracture mechanics and numerical integration to simulate fatigue crack propagation in deck-rib welded joints of OSDs, focusing on both single and multiple crack scenarios under constant-range bending stress. The following principal conclusions are drawn:
  • Deck widths below 300 mm produce non-representative crack growth patterns unsuitable for experimental validation. Wider decks accelerate propagation only after crack depth exceeds 50% of deck thickness. Increased deck thickness induces linearly faster propagation rates yet maintains larger residual load-bearing sections despite higher absolute section loss. Weld penetration depth linearly elevates propagation rates;
  • Initial aspect ratios converge rapidly to a stable propagation trajectory, attaining a / c 0.5 early in propagation and stabilizing at a f / c f 0.1 at failure. Larger and shallower initial defects reduce fatigue life by ≤15% but negligibly impact final section loss;
  • Defect density governs merging behavior: doubling n increases final crack count by 45%. Higher stress range and deck thickness accelerate merging rates by ≤18%, while Δ σ     80 MPa suppresses crack development. Maximum cracks strictly adhere to the single-crack propagation path. Total section loss escalates with defect density and deck thickness but remains stress range independent;
  • The preferred propagation path enables crack depth estimation from crack surface length measurements during inspections. Minimizing initial defects through stringent weld quality control is paramount to delay multi-crack coalescence and to extend fatigue life.

Author Contributions

Conceptualization, Z.F.; methodology, X.L.; software, C.Z.; validation, X.L.; formal analysis, H.G. and X.L.; investigation, H.G. and X.L.; resources, C.Z.; data curation, X.L.; writing—original draft preparation, X.L.; writing—review and editing, Z.F. and B.J.; visualization, X.L.; supervision, Z.F. and B.J.; project administration, Z.F. All authors have read and agreed to the published version of the manuscript.

Funding

This research received no external funding.

Data Availability Statement

Data is contained within the article.

Acknowledgments

The authors have reviewed and edited the output and take full responsibility for the content of this publication.

Conflicts of Interest

The authors declare no conflicts of interest.

References

  1. Cui, C.; Xu, Y.L.; Zhang, Q.H. Multiscale fatigue damage evolution in orthotropic steel deck of cable-stayed bridges. Eng. Struct. 2021, 237, 112144. [Google Scholar] [CrossRef]
  2. Deng, L.; Zou, S.; Wang, W.; Kong, X. Fatigue performance evaluation for composite OSD using UHPC under dynamic vehicle loading. Eng. Struct. 2021, 232, 111831. [Google Scholar] [CrossRef]
  3. Zhang, Q.H.; Bu, Y.Z.; Li, Q. Review on fatigue problems of orthotropic steel bridge deck. China J. Highw. Transp. 2017, 30, 14–30. [Google Scholar]
  4. Maljaars, J.; Bonet, E.; Pijpers, R.J.M. Fatigue resistance of the deck plate in steel orthotropic deck structures. Eng. Fract. Mech. 2018, 201, 214–228. [Google Scholar] [CrossRef]
  5. Di, J.; Ruan, X.; Zhou, X.; Wang, J.; Peng, X. Fatigue assessment of orthotropic steel bridge decks based on strain monitoring data. Eng. Struct. 2021, 228, 111437. [Google Scholar] [CrossRef]
  6. Li, X.; Fu, Z.; Ji, B.; Ji, B.; Sun, G. Fatigue failure and fracture morphology of deck-rib welded joint integrating mean stress effect. J. Constr. Steel Res. 2025, 226, 109246. [Google Scholar] [CrossRef]
  7. Wang, D.; Xiang, C.; Ma, Y.; Chen, A.; Wang, B. Experimental study on the root-deck fatigue crack on orthotropic steel decks. Mater. Des. 2021, 203, 109601. [Google Scholar] [CrossRef]
  8. Zhu, A.; Ouyang, S.; Chen, Y.; Sun, Y. Fatigue test and life evaluation of rib-to-deck connections in orthotropic steel bridge decks. J. Constr. Steel Res. 2022, 197, 107442. [Google Scholar] [CrossRef]
  9. Wang, Y.; Wang, Z.; Zheng, Y. Analysis of fatigue crack propagation of an orthotropic bridge deck based on the extended finite element method. Adv. Civ. Eng. 2019, 2019, 6319821. [Google Scholar] [CrossRef]
  10. Jiang, X.; Sun, K.; Qiang, X.; Li, D.; Zhang, Q. Xfem-based fatigue crack propagation analysis on key welded connections of orthotropic steel bridge deck. Int. J. Steel Struct. 2023, 23, 404–416. [Google Scholar] [CrossRef]
  11. Wang, Q.; Ji, B.; Li, C.; Fu, Z. Fatigue evaluation of deck-rib welds: Crack-propagation-life predictive model and parametric analysis. J. Constr. Steel Res. 2020, 173, 106248. [Google Scholar] [CrossRef]
  12. Tang, K.; Cui, C.; Liu, J.W.; Ma, Y.; Zhang, Q.H.; Lao, W.L. Multiscale and multifield coupled fatigue crack initiation and propagation of orthotropic steel decks. Thin-Walled Struct. 2024, 199, 111843. [Google Scholar] [CrossRef]
  13. Xiao, Z.G.; Yamada, K.; Inoue, J.; Yamaguchi, K. Fatigue cracks in longitudinal ribs of steel orthotropic deck. Int. J. Fatigue 2006, 28, 409–416. [Google Scholar] [CrossRef]
  14. Pang, B.Z.; Cui, C.; Zheng, Q.S.; Liu, K.W.; Zhang, Q.H. Multi-crack propagation analysis of double-side welded rib-to-deck joint in orthotropic steel decks. J. Constr. Steel Res. 2024, 218, 108731. [Google Scholar] [CrossRef]
  15. Lu, N.; Wang, H.; Luo, Y.; Liu, X.; Liu, Y. Merging behaviour and fatigue life evaluation of multi-cracks in welds of OSDs. J. Constr. Steel Res. 2025, 225, 109189. [Google Scholar] [CrossRef]
  16. Liu, J.; Liu, M.; Ma, S.; Tu, J. Study on in-plane double-crack propagation in the rib-to-deck welded toe of steel-bridge. J. Constr. Steel Res. 2023, 203, 107838. [Google Scholar] [CrossRef]
  17. Jiang, X.; Cao, D.; Qiang, X.; Xu, C. Study on fatigue performance of steel bridge welded joints considering initial defects. J. Constr. Steel Res. 2024, 212, 108309. [Google Scholar] [CrossRef]
  18. Yamada, K.; Ya, S. Plate bending fatigue tests for root crack of trough rib of orthotropic steel deck. J. Struct. Eng. 2008, 54, 675–684. [Google Scholar]
  19. Cheng, B.; Ye, X.; Cao, X.; Mbako, D.D.; Cao, Y. Experimental study on fatigue failure of rib-to-deck welded connections in orthotropic steel bridge decks. Int. J. Fatigue 2017, 103, 157–167. [Google Scholar] [CrossRef]
  20. Fu, Z.; Ji, B.; Zhang, C.; Wang, Q. Fatigue performance of roof and U-rib weld of orthotropic steel bridge deck with different penetration rates. J. Bridge Eng. 2017, 22, 04017016. [Google Scholar] [CrossRef]
  21. Zhang, Y.L.; Li, Y.S.; Zhang, D.Y. Fatigue life estimation of rib-to-deck joints in orthotropic steel decks. Adv. Mater. Res. 2010, 163, 410–416. [Google Scholar] [CrossRef]
  22. Hobbacher, A.F.; Baumgartner, J. Recommendations for Fatigue Design of Welded Joints and Components; Springer International Publishing: Cham, Switzerland, 2016. [Google Scholar]
  23. Igwemezie, V.; Mehmanparast, A.; Brennan, F. The influence of microstructure on the fatigue crack growth rate in marine steels in the Paris Region. Fatigue Fract. Eng. Mater. Struct. 2020, 43, 2416–2440. [Google Scholar] [CrossRef]
  24. BS 7910:2019; Guide to Methods for Assessing the Acceptability of Flaws in Metallic Structures. British Standards Institution: London, UK, 2019.
  25. Zhang, H.; Liu, H.; Kuai, H. Stress intensity factor analysis for multiple cracks in orthotropic steel decks rib-to-floorbeam weld details under vehicles loading. Eng. Fail. Anal. 2024, 164, 108705. [Google Scholar] [CrossRef]
  26. Li, X.; Fu, Z.; Ji, B.; Sun, G. Crack Growth and Fatigue Strength of Deck-Rib Welded Joints in Orthotropic Steel Decks Integrating Mean Stress Effect. Fatigue Fract. Eng. Mater. Struct. 2025, 48, 145–157. [Google Scholar] [CrossRef]
Figure 1. Fatigue crack in deck-rib welded joint.
Modelling 06 00083 g001
Figure 2. Propagation simulation process of fatigue crack.
Modelling 06 00083 g002
Figure 3. Multi-crack interaction criterion.
Modelling 06 00083 g003
Figure 4. The effect of geometric dimensions on crack propagation. (a) Crack propagation under different deck widths. (b) Crack propagation under different deck widths (logarithmic coordinate). (c) Crack propagation under different deck thicknesses. (d) Crack propagation rate under different deck thicknesses. (e) Crack propagation under different penetration rates. (f) Crack propagation rate under different penetration rates.
Modelling 06 00083 g004
Figure 5. The effect of component geometric dimensions on crack morphology. (a) Crack morphology under different component widths. (b) Section loss rate under different component widths. (c) Crack morphology under different deck thicknesses. (d) Section loss rate under different deck thicknesses. (e) Crack morphology under different penetration rates. (f) Section loss rate under different penetration rates.
Modelling 06 00083 g005
Figure 6. The effect of initial defect on crack propagation. (a) Crack propagation under different initial defect sizes. (b) Crack propagation rate under different initial defect sizes. (c) Crack morphology under different initial defect sizes. (d) Section loss rate under different initial defect sizes.
Modelling 06 00083 g006
Figure 7. Crack quantity change in multi-crack propagation. (a) Crack number under different crack quantities. (b) Crack merging rate under different crack quantities. (c) Crack number under different deck thicknesses. (d) Crack merging rate under different deck thicknesses. (e) Crack number under different stress ranges. (f) Crack merging rate under different stress ranges.
Modelling 06 00083 g007
Figure 8. Crack quantity change in multi-crack propagation. (a) Crack number under different crack quantities. (b) Crack merging rate under different crack quantities. (c) Crack number under different deck thicknesses. (d) Crack merging rate under different deck thicknesses. (e) Crack number under different stress ranges. (f) Crack merging rate under different deck thicknesss.
Modelling 06 00083 g008
Figure 9. Crack geometry change in multi-crack propagation. (a) Crack geometry under different crack quantities. (b) Section loss rate under different crack quantities. (c) Crack geometry under different deck thicknesses. (d) Section loss rate under different deck thicknesses. (e) Crack geometry under different stress ranges. (f) Section loss rate under different stress ranges.
Modelling 06 00083 g009
Table 1. Value of v and w .
l / t z / t v w
1 0.03   ( l / t ) 0.55 0.45   ( l / t ) 0.21 0.31
> 0.03   ( l / t ) 0.55 0.68 0.19   ( l / t ) 0.21
> 1 0.03 0.45 0.31
> 0.03 0.68 0.19
Table 2. Input parameters of single crack simulation.
Geometric dimensions b / m m 150300450
t / m m 121416
p 70%80%90%
Initial defect a 0 / m m 0.10.10.10.50.707
a 0 / c 0 0.10.510.51
c 0 / m m 10.20.110.707
Table 3. Input parameters of multi-crack simulation.
ParameterProbability Distribution μ S D Maximum ValueMinimum Value
Single sampling x / m m Uniform distribution500-10000
a 0 / m m Exponential distribution0.1-10.01
a 0 / c 0 Normal distribution0.50.1610.1
Multiple sampling n Poisson distribution16
24
32
---
t / m m Fixed value12
14
16
---
Δ σ / M P a Fixed value80
100
125
---
Disclaimer/Publisher’s Note: The statements, opinions and data contained in all publications are solely those of the individual author(s) and contributor(s) and not of MDPI and/or the editor(s). MDPI and/or the editor(s) disclaim responsibility for any injury to people or property resulting from any ideas, methods, instructions or products referred to in the content.