Article

REW-YOLO: A Lightweight Box Detection Method for Logistics

1
School of Mechanical and Electrical Engineering, China Jiliang University, Hangzhou 310018, China
2
School of Engineering, Hangzhou Normal University, Hangzhou 310018, China
3
Department of Zhejiang Machinery Industry Federation, Hangzhou 310018, China
*
Authors to whom correspondence should be addressed.
Modelling 2025, 6(3), 76; https://doi.org/10.3390/modelling6030076
Submission received: 23 June 2025 / Revised: 28 July 2025 / Accepted: 30 July 2025 / Published: 4 August 2025

Abstract

Inventory counting of logistics boxes in complex scenarios has always been a core task in intelligent logistics systems. To solve the problems of a high leakage rate and low computational efficiency caused by stacking, occlusion, and rotation in box detection against complex backgrounds in logistics environments, this paper proposes a lightweight, rotated object detection model: REW-YOLO (RepViT-Block YOLO with Efficient Local Attention and Wise-IoU). By integrating structural reparameterization techniques, the C2f-RVB module was designed to reduce computational redundancy in traditional convolutions. Additionally, the ELA-HSFPN multi-scale feature fusion network was constructed to enhance edge feature extraction for occluded boxes and improve detection accuracy in densely packed scenarios. A rotation angle regression branch and a dynamic Wise-IoU loss function were introduced to further refine localization and balance sample quality. Experimental results on the self-constructed BOX-data dataset demonstrate that the REW-YOLO achieves 90.2% mAP50 and 130.8 FPS, with a parameter count of only 2.18 M, surpassing YOLOv8n by 2.9% in accuracy while reducing computational cost by 28%. These improvements provide an efficient solution for automated box detection in logistics applications.

1. Introduction

The explosive growth of e-commerce has propelled the warehousing and logistics industry into the era of real-time inventory [1,2]. Owing to their lightweight structure, low cost, and excellent stackability, logistics boxes have become the most common storage units in these scenarios [3]. Their identification efficiency directly impacts the overall performance of the supply chain. The traditional manual inventory method in a modern high-level three-dimensional warehouse has difficulty meeting the actual demand for efficiency and accuracy. On the one hand, to count the inventory in a modern high-level three-dimensional warehouse, for example, where the height of the warehouse usually reaches 20–40 m, it is difficult to manually complete the task by checking through the items one by one; on the other hand, relying on stacker cranes to transport goods piece by piece to the visual position for manual identification not only takes a long time but also seriously affects operational efficiency. In contrast, vision-based automatic identification offers non-contact, high-efficiency, and other advantages, and it has gradually become the mainstream alternative means, widely used in high-standing warehouses, conveyor lines, automatic sorting, and other scenarios. However, in a real warehousing logistics environment, visual occlusion, spatial compression, fragmented light shadows, edge overlap, background interference, and other non-structural topological noise significantly exacerbate the uncertainty of box identification and inventory. Therefore, how to quickly and accurately detect and recognize these dense and stacked boxes has become one of the core technologies to ensure the real-time consistency of inventory data and to prevent wrong or missed pickup in application scenarios involving conveyor line transfer inventory and high-level warehouse inventory, which are also the main research goal of this paper.
To date, researchers have conducted extensive studies on object detection in the logistics industry [4,5]. Early on, traditional machine vision method made some progress, but they faced challenges such as poor durability, limited accuracy, and low real-time performance. These issues were particularly pronounced in complex environments, limiting their application in modern logistics systems. Recently, with rapid advances in convolutional neural networks (CNNs) and computer hardware, deep learning [6] has become a key technology for object detection and recognition. These algorithms generally fall into two categories. The first is two-stage detectors, such as Fast R-CNN [7] and Faster R-CNN [8], which are characterized by high detection accuracy but low speed. The second is single-stage detectors, which significantly improve detection speed and include models from the You Only Look Once (YOLO) series [9,10,11,12,13,14] and SSD [15]. These detectors have become the preferred choice for tasks requiring high real-time performance. In addition, lightweight networks like YOLOx [16] are notable representatives in this domain. Consequently, in recent years, an increasing number of logistics systems have adopted deep learning and artificial intelligence technologies to overcome the limitations of traditional vision methods. Yoon et al. [16] proposed a logistics box recognition method based on deep learning and RGB-D image processing, combining Mask R-CNN and Cycle GAN technologies. By using Cycle GAN to optimize the surface of the box, this method eliminates the influence of labels on feature extraction. It is particularly suited for the robotic de-stacking process, and it addresses the issue of degraded recognition quality caused by the disorderly arrangement of boxes and varying surface textures in complex working conditions. Gou et al. [17] employed a local surface segmentation algorithm to extract the skeleton of the stacked cardboard boxes and replace the foreground textures of the source dataset with the textures of the target dataset, enabling the rapid generation of labeled datasets and improving the model’s generalization ability in new logistics scenarios. Wu et al. [18] proposed an adaptive tessellation method to redesign the traditional Faster RCNN to solve the problems of large differences in the number of categories in the box dataset, the imbalance of categories and the consumption of hardware resources. Arpenti et al. [19] utilized RGB-D technology and a deep learning model YOLACT for box boundary detection, incorporating image segmentation techniques to extract box edges, which helped address the challenges caused by the diverse and complex box stacking methods. Ke et al. [20] proposed an improved Faster R-CNN model for parcel detection by introducing an edge detection branch and an object edge loss function, which effectively addressed the misdetection problem caused by occlusion between parcels. They also proposed a self-attention ROI alignment module to further enhance detection accuracy. Domenico et al. [21] compared various training strategies aimed at minimizing the number of images needed for model fitting, while ensuring the reliability and robustness of the model’s performance. After evaluating cardboard detection under different conditions, they identified a fine-tuning strategy based on a CNN model pre-trained for box detection as the optimal approach, achieving an over 85.0 median F1 score. Kim et al. [22] developed a system that uses the regression KNN algorithm to calculate the minimum Euclidean distance to detect the geometric point cloud of parcels, thereby improving detection accuracy and providing guidance for robots in unloading tasks.
The widespread use of object detection algorithms in intelligent logistics has made the conventional axis-aligned bounding box inadequate for precisely localizing objects with arbitrary orientations. The object detection method based on Rotated Bounding Boxes gradually became a focal point of research due to its ability to fit detection objects more compactly and accurately in arbitrary directions. For example, Zou et al. [23] found that ground targets such as airplanes and ships presented arbitrary rotational directions in high-resolution remote sensing images. Traditional IoU evaluation metrics exhibited discontinuous values when the angle changed drastically, leading to instability in rotating bounding box regression. Therefore, they proposed a probability distribution-based regression method for rotating angles, ProbIoU, by modeling the rotating box and the rotating frame as two-dimensional Gaussian distributions and constructing a differentiable regression loss function using the Hellinger distance, which significantly improved the fitting accuracy for objects with large angular changes. Zhao et al. [24] pointed out that narrow objects were prone to angular regression bias under different rotation angles in the task of object detection with arbitrary orientation, and that objects with large differences in aspect ratios did not perform consistently with a uniform sampling strategy. Therefore, they proposed the OASL method, which introduced an aspect ratio-aware adaptive sampling mechanism and an angular loss adjustment strategy. Thus, the regression difficulty of targets with different shapes was dynamically balanced, and the robustness of rotational regression under extreme shape targets was effectively improved. Zhu et al. [25] found that using a horizontal bounding box introduced ambiguities when fitting detected objects at certain angles together in remote sensing images. Therefore, they designed an enhanced FPN with angle-aware branching and a scale-adaptive fusion module to enhance the ability to capture rotational information through multi-level orientation guidance. Consequently, the accuracy of rotating frame detection in dense regions was improved.
The above methods have made different degrees of progress in box detection tasks such as box surface labeling, uneven number of categories, dataset generation, mutual shading of parcels, and diverse stacking methods, etc. However, many challenges, such as edge blurring and severe shaded boxes caused by dense stacking, remain in logistics box detection tasks. In addition, most of the current methods in the logistics field are still based on Horizontal Bounding Box (HBB), which has localization bias when dealing with scenarios in which a box has a rotation angle, affecting the actual detection accuracy. At the same time, the balance between lightweight models and high accuracy demand has not been fully resolved. In this paper, a lightweight rotating box detection model REW-YOLO is proposed. First, based on YOLOv8n, the C2f-RVB module is introduced, and the C2f module of YOLOv8 is replaced by RepViTBlock. Through structure reparameterization with depth separable convolution, the multi-branch structure is merged in the inference stage to reduce the computational overhead. Second, the ELA-HSFPN structure is designed by fusing an advanced feature fusion pyramid (HSFPN) and an efficient local attention mechanism (ELA), which enhances the model’s ability to extract local features and solves the problem of missed detection of dense box stacking placement.

2. Detection Model Based on Improved YOLOv8

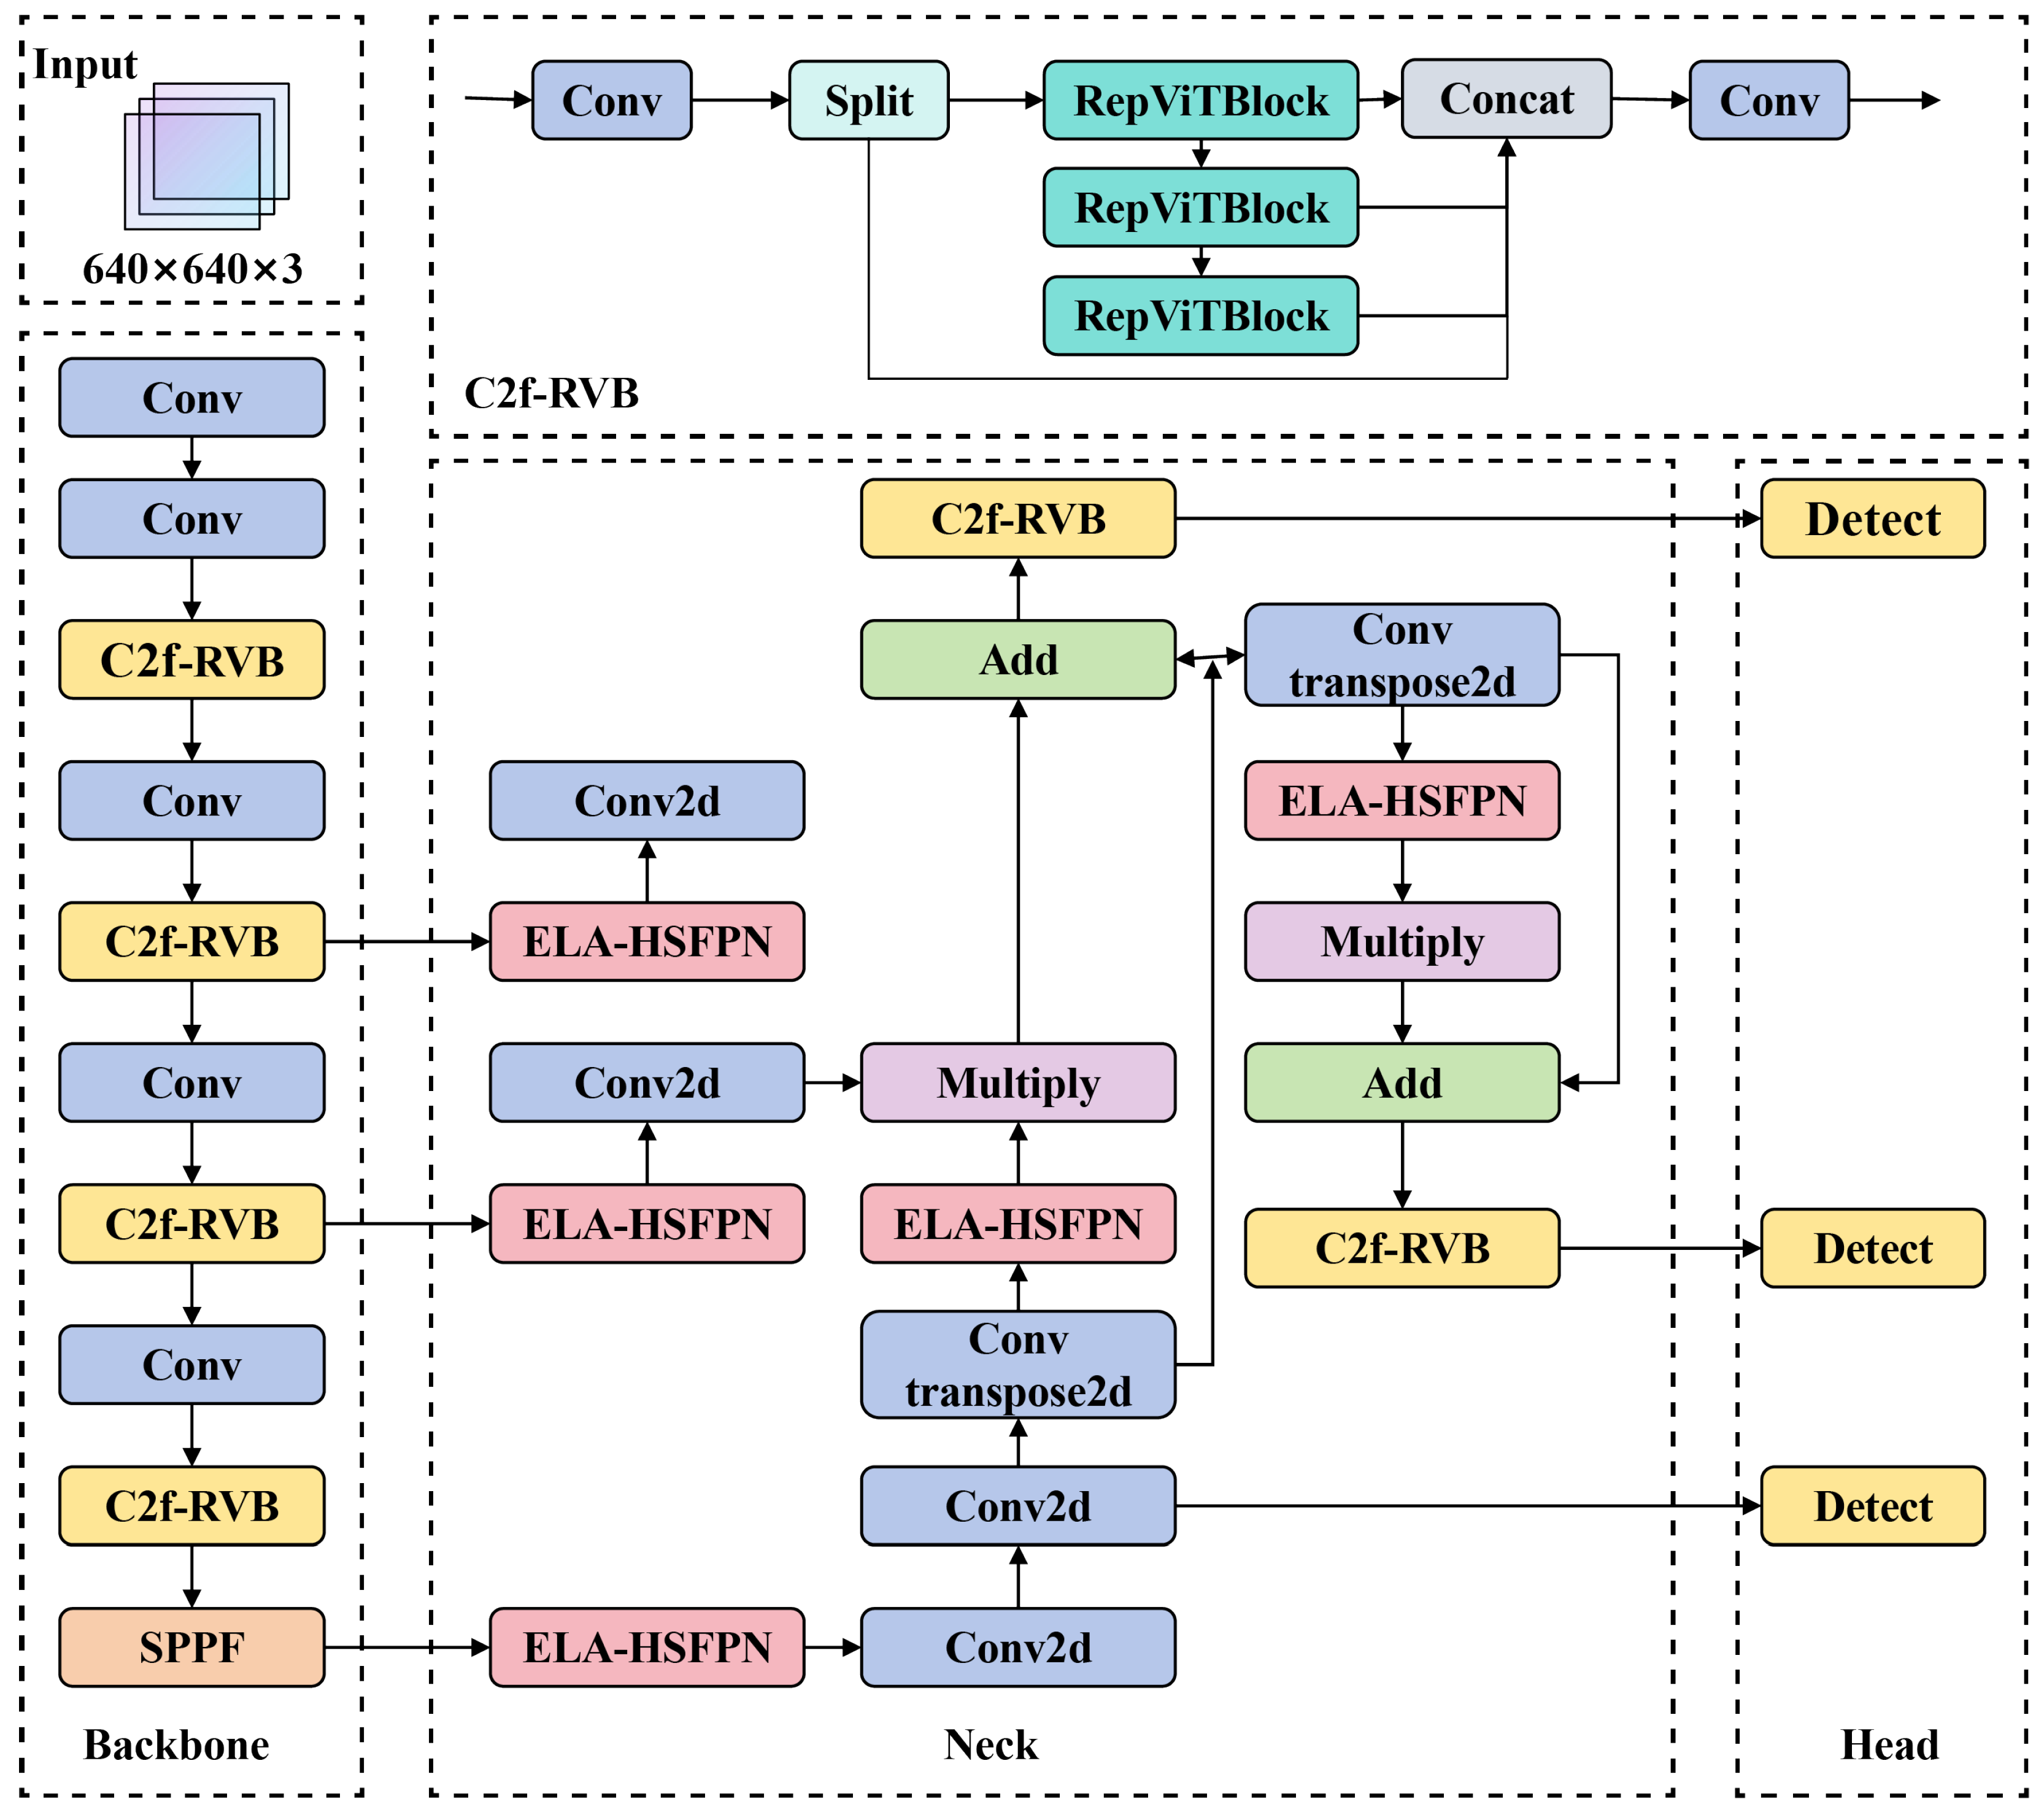
To improve the accuracy and robustness of box detection algorithms, this paper proposes an improved YOLOv8 model, REW-YOLO, as illustrated in Figure 1.
First, the RepViTBlock module is integrated into the YOLOv8 backbone, replacing certain traditional convolution operations to allow more efficient processing of global structural and semantic information. Secondly, the HSFPN is fused with the Enhanced Local Attention (ELA) mechanism to construct the ELA-HSFPN structure, which improves the model’s ability to extract both local target features and target features of different shapes and sizes. Thirdly, the rotational angle regression is introduced to enhance the model’s capability to handle the rotated or tilted targets while reducing background interference. Finally, the random occlusion simulation is conducted, and the bounding box regression loss function is optimized using WIoU v3 (Wise-IoU v3), mitigating the effects of low-quality samples and accelerating model convergence. These improvements significantly enhance the accuracy and robustness of the proposed REW-YOLO model, making it more suitable for box detection in complex logistics environments, particularly in occlusion scenarios.

2.1. C2f-RVB Block

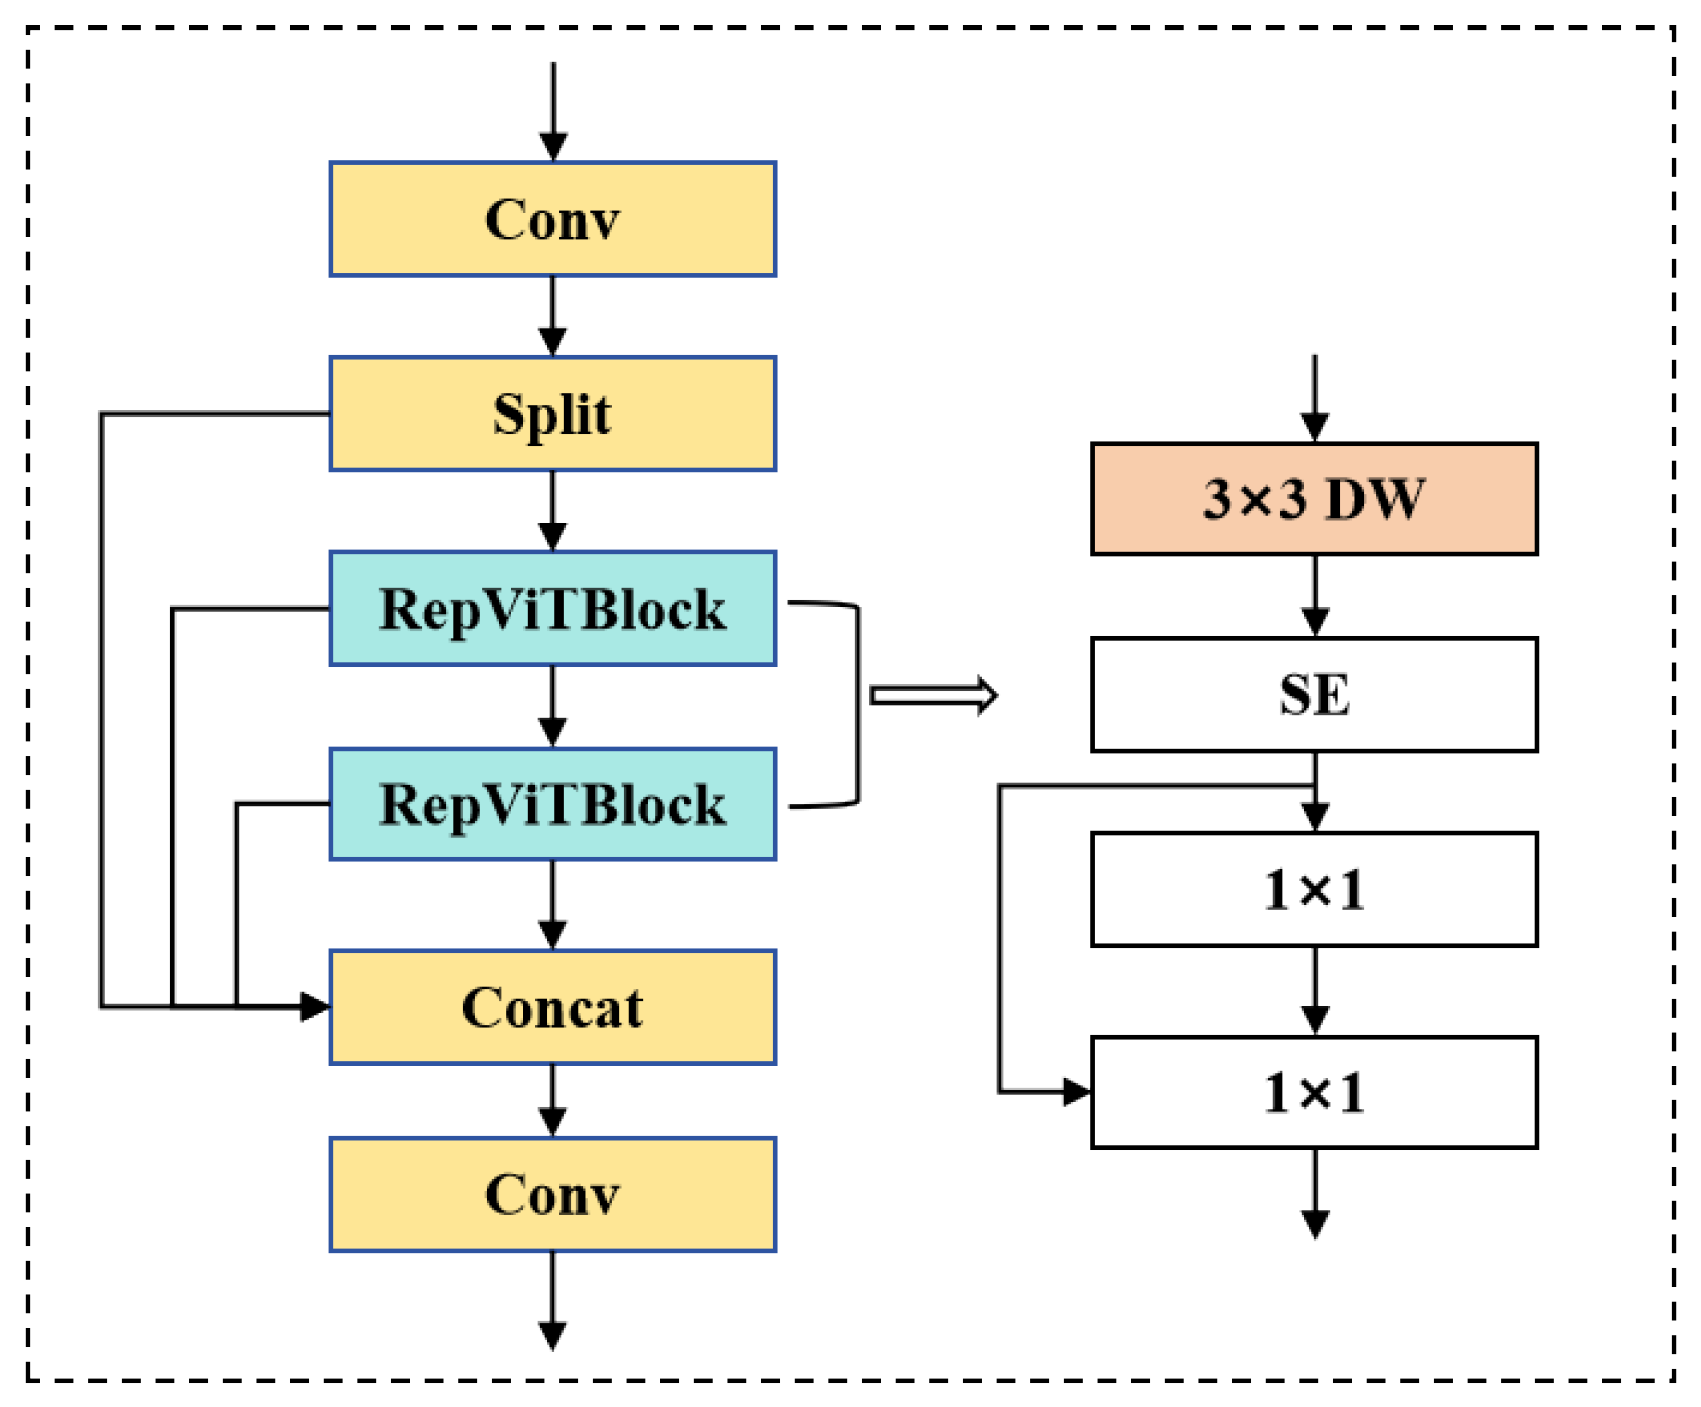
YOLOv8 redefines object detection as a bounding box regression problem, utilizing CNNs for efficient feature extraction and object classification. However, when applied directly to box detection in complex logistics environments, it faces a critical trade-off between computational cost and the need for model lightweighting. While its core module, C2f, improves feature reuse efficiency through cross-layer connections, the reliance on standard convolution operations leads to parameter inflation when stacked, making it difficult to meet the stringent requirements of mobile devices in terms of model size and computational latency. To enable deployment on resource-constrained mobile devices, inspired by Wang et al. [26], the original C2f module from YOLOv8 has been replaced by the RepViTBlock module as the redesigned C2f-RVB module. This module reduces computational complexity through structural re-parameterization, depthwise separable convolutions, and feedforward mechanisms while maintaining performance. The use of depthwise separable convolutions decreases both the number of parameters and the computational cost, making the model more suitable for mobile devices with limited computing resources.
The RepViT module combines the advantages of CNN and Transformer by incorporating 3 × 3 depthwise separable convolution, 1 × 1 convolution, structural reparameterization, and an SE layer. The 3 × 3 depthwise separable convolution captures local textures, while the 1 × 1 convolution adjusts channels and fuses features. During training, structural reparameterization enhances expressive capability through a multi-branch architecture, and during inference, it merges into a single branch to reduce computational cost. The SE layer highlights key features through channel attention, enhancing the model’s focus on important information. The specific design of the RepViTBlock module is shown in Figure 2.
In this case, the DWConv (Depthwise Separable Convolution) [27] process is shown in Figure 3. DWConv first performs spatial filtering on each input channel individually by depth convolution, and then utilizes point-by-point convolution to combine the features and adjust the channels by 1 × 1 convolution kernel to realize spatial filtering and feature combination on each input channel. This approach is well-suited for the requirements of a box detection model, as it achieves a significant reduction in computational complexity and parameter count without compromising model performance.

2.2. ELA Module

Attentional mechanisms are able to focus on important information and reduce distracting information according to task demands. The Efficient Local Attention (ELA) [28] mechanism aims to efficiently capture spatial attention without reducing the channel dimension. The mechanism is inspired by the Coordinate Attention (CA) [29] approach and addresses its limitations by using 1D convolution and group normalization (GN) [30] instead of 2D convolution and batch normalization (BN) [31]. The ELA mechanism captures feature vectors in both horizontal and vertical directions through strip pooling, maintains a narrow convolutional kernel shape to capture long-range dependencies, pays more attention to the box-local features, and prevents box-related target-independent regions from affecting label prediction, thus improving the accuracy of box target detection. The module of ELA is depicted in Figure 4.
Given an input feature map X R C × H × W , ELA first applies strip pooling along the horizontal and vertical directions to extract direction-sensitive global features. For the c-th channel, the pooling outputs in the horizontal and vertical directions are given by (1) and (2).
z c h ( h ) = 1 W 0 i < W x c ( h , i )
z c w ( w ) = 1 H 0 j < H x c ( j , w )
The location of the c-th channel of the input feature map is imperative for comprehension. The dimensions of the feature map are denoted by H and W, representing its height and width, respectively. The target height position is designated by h, while w signifies the target width position. The pooling step is essential for preserving the spatial location information and providing directional feature vectors z c h R H × C and z c w R W × C for subsequent local interactions. Subsequently, 1D convolution is applied to z c h and z c w , respectively, to capture the correlation of neighboring locations. The convolution results are processed by GroupNorm to enhance the model’s generalizability, and then passed through a Sigmoid function to generate directional attention weights, as follows:
y c h = σ G n ( F h ( z c h ) ) y c w = σ G n ( F w ( z c w ) )
where G n represents group normalization and σ is the Sigmoid function. The final output feature map is obtained by element-wise multiplication to integrate bidirectional attention:
Y = X y h y w
where ⊙ denotes element-wise multiplication.
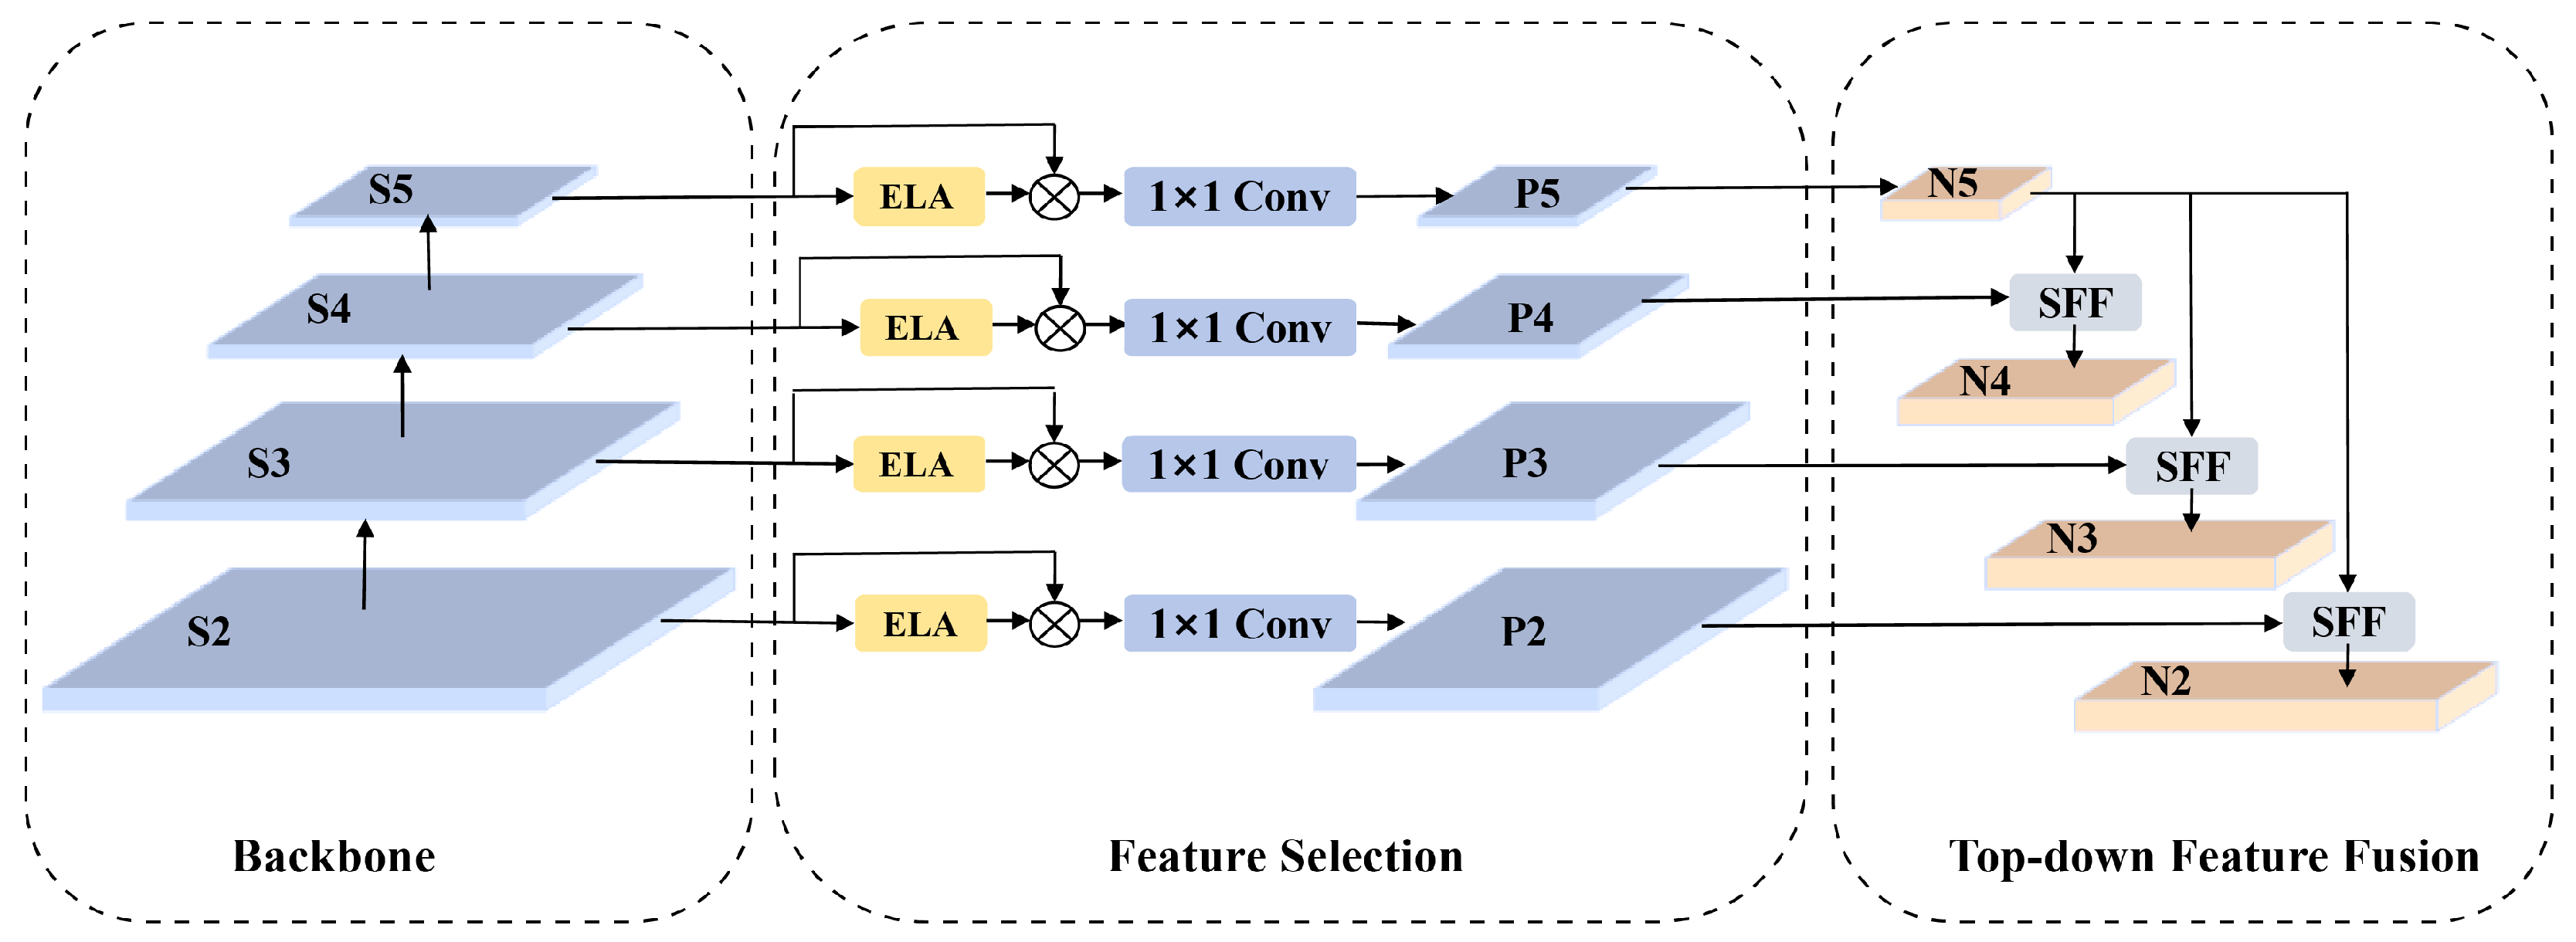
To enhance the model’s local feature extraction capability, the ELA-HSFPN architecture was designed and constructed by integrating the ELA mechanism into the HSFPN. HSFPN divides the feature pyramid into multiple sub-pyramids, each with its own feature fusion and upsampling operations. First, the backbone network extracts multi-level feature maps, where lower-level features contain richer spatial information, while higher-level features provide stronger semantic information. Then, the feature fusion network utilizes the ELA module to refine the features, employing 1 × 1 convolution to reduce channel dimensions and fuse low- and high-level features. Finally, the top-down feature fusion module progressively upsamples and transfers high-level features to lower levels through skip connections, enhancing the multi-scale feature representation. This architecture enables multi-level feature fusion, which improves the model’s performance in detecting boxes with different sizes. The ELA-HSFPN structure is illustrated in Figure 5.

2.3. WIoU Loss Functions

The YOLOv8 loss function consists of multiple components, including classification loss (VFL loss) [32] and regression loss, which combines CIoU loss [33] for bounding box regression. However, CIoU loss does not account for the balance between high-quality and low-quality samples in the dataset. Since most box datasets contain objects with features similar to the background, there is an imbalance between samples of different qualities. To address this limitation, the improved network adopts Wise-IoU (WIoU) [34] as the loss function. The core of WIoU lies in the introduction of an outlier degree metric and a dynamic fuzzy gain allocation strategy. Specifically, WIoU achieves dynamic gradient allocation through a three-level optimization process. The base loss (WIoUv1) enhances local details of the center points by incorporating a distance attention factor. RWIoU further focuses on the center distance between anchor boxes and ground-truth boxes—anchors with lower overlap receive higher RWIoU values.
L I o U = 1 I o U
R W I o U = exp ( x x a t ) 2 + ( y y a t ) 2 W g 2 + H g 2
L W I o U v 1 = R W I o U × L I o U
The variables W g and H g represent the minimum enclosing box size, while x a t and y a t denote the center coordinates of the target box.
To further reduce the loss contribution from low-quality samples, a dynamic non-monotonic frequency modulation is introduced based on WIoUv1. By integrating the non-monotonic modulation factor r with the base loss, WIoUv3 is constructed, as shown in (8) to (10).
r = β δ · q β δ
β = L I o U * L I o U [ 0 , + )
L W I o U v 3 = r · L W I o U v 1
where L I o U * represents the monotonic focus factor, β denotes the outlier degree of the anchor box, r is the non-monotonic focus factor and δ is a hyperparameter. A lower β indicates a high-quality anchor box, while a higher β indicates possible annotation noise or localization errors. By constructing the non-monotonic modulation factor r using the outlier degree and parameters α and β , WIoU effectively prevents low-quality samples from generating harmful gradients, enhances the focus on correctly labeled samples, and improves the accuracy of the network model.

2.4. Incorporating Rotational Angle Regression

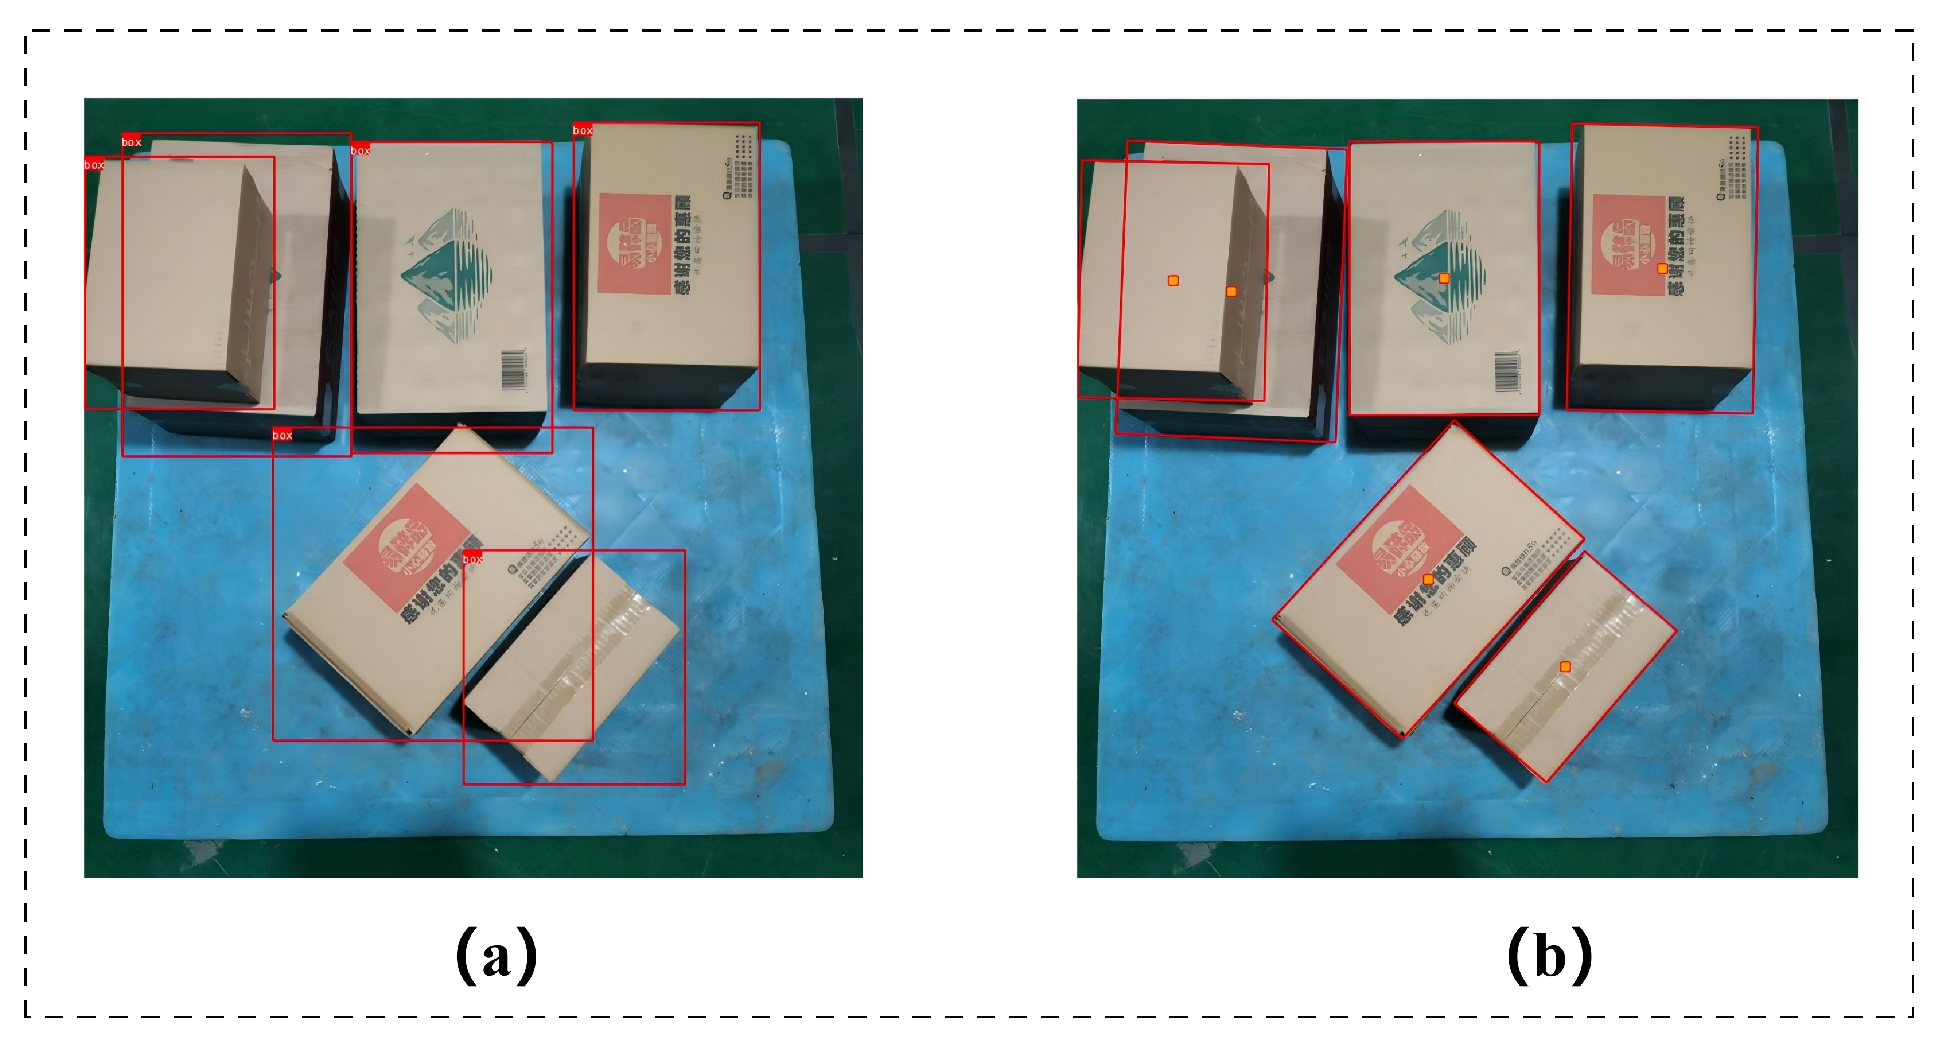
In the field of industrial logistics automation, object detection methods based on axis-aligned bounding boxes (AABB) [35] have long been the dominant approach due to their structural simplicity and computational efficiency. However, in real-world logistics scenarios, box-shaped objects often exhibit irregular rotations, as illustrated in Figure 6a. When the object rotation angle θ [ 0 , 90 ) , axis-aligned bounding boxes introduce excessive background noise, 37.6 % ± 8.9 % on average, which degrades localization accuracy. Figure 6b. compares rotated bounding boxes with horizontal bounding boxes and shows that the latter often encompass background areas such as pallets, leading to inaccurate object localization. Additionally, horizontal bounding boxes may overlap with other boxes, further reducing detection accuracy. In contrast, rotated bounding boxes provide a more accurate representation of object boundaries, making them a more suitable annotation method for logistics box detection. In contrast, the rotated box can more accurately represent the boundaries of the box. Therefore, the OBB box with angular representation is used in the data annotation and modeling process. Each rotated bounding box in the data annotation is represented by five parameters ( x , y , w , h , θ ) , where ( x , y ) are the coordinates of the center point of the box. w and h represent the width and height of the box when it is not rotated, respectively. θ represents the angle corresponding to the long edge of the box rotated counterclockwise from the positive horizontal direction of the image.
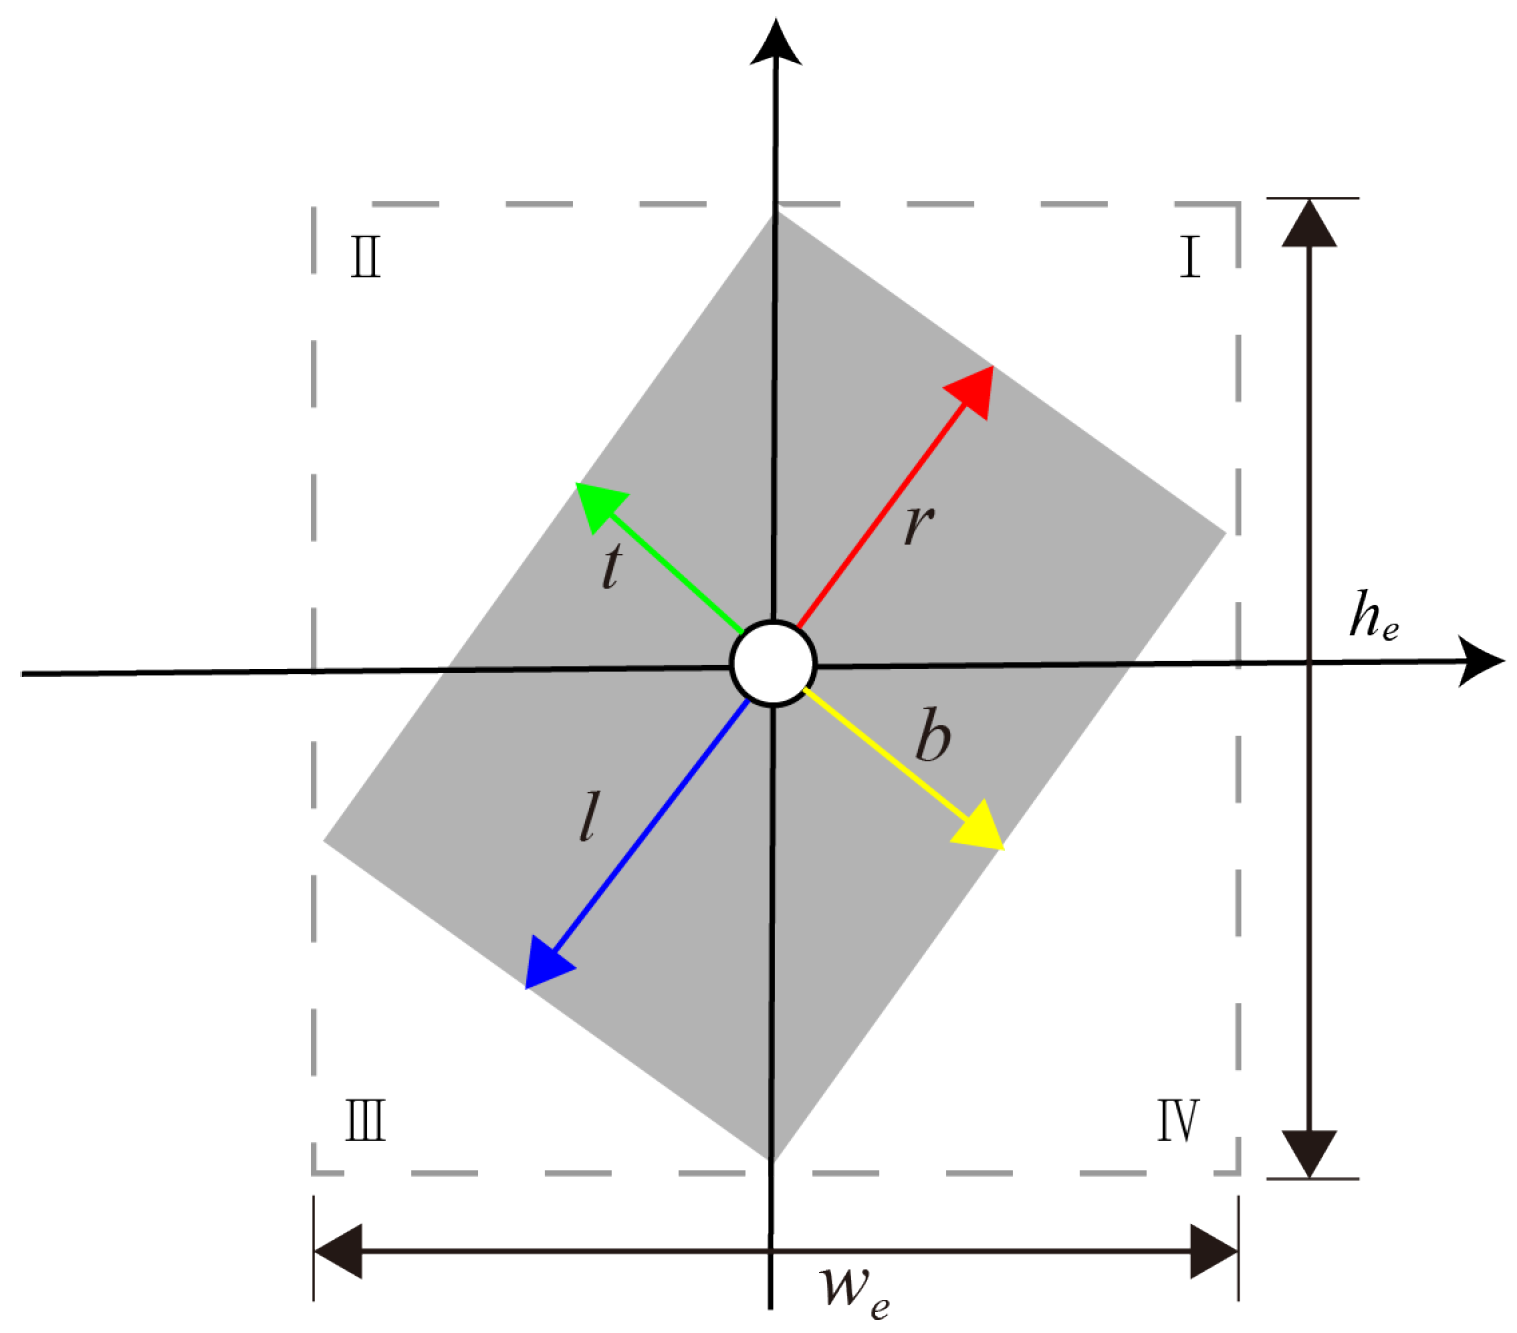
Despite the superior spatial representation capability of the OBB box, there are multiple challenges in directly adopting angular regression. On the one hand, the rotation angle is periodic, e.g., 179 and 181 represent nearly the same direction but with a 360 difference in values, which can easily lead to gradient discontinuity; on the other hand, the box sizes are significantly different, and it is difficult to learn the offset value of small box targets with small values, while the offset of large box targets with large values can easily trigger the gradient explosion, resulting in training instability. To alleviate the above problems, this paper introduces the SAVN (Scale-Adaptive Vector Normalization) strategy in the OBB detection framework and constructs the regression structure based on BBAVectors(Box Boundary-Aware Vectors). Specifically, the network first branches the Box Param to regress the outer width and outer height of the rotating box, which are defined as the smallest rectangular dimensions that can completely enclose the rotating box horizontally and vertically, respectively; then, at the center point c = ( x , y ) , the network simultaneously regresses the four boundary-aware vectors ( v t , v r , v b , v l ). As shown in Figure 7, where v t (top) denotes the vertical offset from the center point to the upper boundary of the box, v r (right) denotes the horizontal offset from the center point to the right boundary of the box, v b (bottom) denotes the vertical offset from the center point to the lower boundary of the box, and v l (left) denotes the horizontal offset from the center point to the left boundary of the box.
In order to eliminate the influence of target scale on training, in this paper, the vectors are normalized so that the offset values reflect only the relative geometric relationship rather than the absolute pixel distance. The specific expression is as follows:
v ˜ k = v k / W e 2 , k { l , r } , v k / h e 2 , k { t , b } .
so that all are mapped v k ˜ to the [ 0 , 1 ] interval, the network only needs to learn the relative offset ratio that is independent of the absolute size of the target, alleviating the problem of the gradient instability caused by too small regression values for small bins that are difficult to fit, as well as large regression values for large bins that are too large. In the inference stage, the same location is predicted in accordance with ( w e , h e ) :
v k = v ˜ k × w e 2 , k { l , r } , v ˜ k × h e 2 , k { t , b } .
Reduced to actual pixel offset vectors v t = ( t x , t y ) , v r = ( r x , r y ) , v b = ( b x , b y ) , v l = ( l x , l y ) . Finally, the coordinates of the four vertices of the rotating frame are computed by summing the center point with the four boundary vector components based on the following equation:
v t l = c ¯ + v t + v l , v t r = c ¯ + v t + v r , v b r = c ¯ + v b + v r , v b l = c ¯ + v b + v l .
where v t l , v t r , v b r , and v b l represent the coordinates of the four vertices of the rotating bounding box: v t l (top-left) represents the upper-left corner point, v t r (top-right) represents the upper-right corner point, v b r (bottom-right) represents the lower-right corner point, and v b l (bottom-left) represents the bottom-left corner.

3. Experimental Environment and Configuration

The present experiment was conducted on a Windows 11 operating system with a single MSI GeForce RTX 4060 graphics card (manufactured by Micro-Star International; New Taipei City, Taiwan). The experiment utilized a Python 3.11 deep learning framework, PyTorch 2.2.0, and a CUDA 11.8 environment. The hardware configuration for training and testing is shown in Table 1.
All input images were of a size of 640 × 640. The model underwent a training period that comprised 200 epochs. The batch size was configured to 16, and the initial learning rate was established at 0.01.

3.1. Dataset

Due to the limited number of publicly available box datasets and the fact that most annotations are in the form of horizontal bounding boxes, this experiment created a dataset, BOX-data, consisting of boxes arranged in different configurations, such as dense, stacked, and rotated. A partial image of the dataset is shown in Figure 8. The images in the dataset were captured by cameras from different orientations around the boxes. A total of 2376 images were collected, and the dataset was split into training, validation, and test sets in a ratio of 7:2:1. The annotation method uses manual labeling with makesense.
In order to enhance the model’s generalizability in complex logistics scenarios and simulate occlusion and lighting changes in real warehousing environments, the following data enhancement techniques are employed in this study to extend the limited occlusion image data: (i) Random Occlusion Enhancement: By randomly placing smaller-sized occluders on the target surface and setting a range of occlusion ratios of 5–25%, we can effectively replicate the actual warehousing, such as stacking of goods and overlapping of objects. This occlusion strategy is realized by randomly generating rectangular regions and overlaying them onto the original image. (ii) Light Perturbation Enhancement: The image is subject to dynamic adjustments in brightness and contrast, as well as random perturbations in hue, saturation, and exposure, in order to simulate the variable lighting conditions that are present in logistics environments. These conditions include the instability of artificial light sources, the diurnal variation of natural light, and shadow interference. These operations are implemented using color space transformation and pixel value mapping techniques to enhance the model’s ability to adapt to different lighting conditions. Figure 9 presents a visual representation of the implemented enhancement techniques, illustrating their effect on the logistics scene image.

3.2. Experimental Data and Evaluation Metrics

In this experiment, five evaluation metrics, including mean Average Precision ( m A P ) , Precision (P), Recall (R), model computational load (GFLOPs), and parameter count (Params), are used to comprehensively evaluate the performance of the developed model. Additionally, the mAP50 (with an IoU threshold of 0.5) is employed to evaluate the accuracy of the developed model. The specific formulas are as follows:
P = T P T P + F P
R = T P T P + F N
A P = 0 1 P ( R ) d R
m A P = c = 1 N A P c N
The T P (true positive) category indicates a positive sample category and a positive model prediction; the F N (false negative) category indicates a positive sample category but a negative model prediction; and the F P (false positive) category indicates a negative sample category but a positive model prediction. A P indicates the average precision of one of the label categories, and m A P is the average precision of all object classes. The size of the A P value directly reflects the average detection accuracy of the model; the larger the value, the better the detection performance. The term Params refers to the total number of model parameters involved in the training process. GFLOPs denotes the number of floating-point operations required for the model to perform one forward propagation, measured in billions of floating-point operations per second. FPS (Frames Per Second) is a key index to measure the inference speed of the model, indicating the number of image frames that can be processed by the model per second. Higher FPS values correspond to better real-time performance of the model.

4. Experiment and Results

4.1. Ablation Experiments

To evaluate the performance of the REW-YOLO model in box detection, ablation experiments were conducted using the YOLOv8n model and the improved model separately on the self-built box dataset, and the training parameters remained consistent throughout the experiment. Figure 10 shows the performance of each improvement throughout the entire training cycle, mAP50 Curve. It can be clearly seen from the figure that the REW-YOLO model consistently outperforms the baseline model. Table 2 shows the comparison of the ablation experiment results of the improved YOLOv8 models. Where the bold part signifies the optimal result.
The results indicate that after adding the C2f RVB module, the recall rate (R) and mAP50 of the model have all decreased. However, the number of parameters (Params) has decreased by approximately 24%, FLOPs have decreased by about 23%, and the Precision (P) has increased by 0.8%. This indicates that the module has improved detection accuracy while reducing computational costs. The ELA-HSFPN module significantly improved Precision (P) (from 87.3% to 89.1%) while maintaining a high recall rate, with a slight increase in FLOPs compared to the C2f RVB module. WIoU improves the recall rate (80.2%) and mAP50 (85.3%). After integrating all optimization modules, the recall rate of the REW-YOLO model increased the most (from 76.9% to 81.1%), and mAP50 as well as mAP50-95 achieved the highest levels at 86.4% and 68.0%; this indicates that these REW-YOLO models are effective in improving the leakage rate of occluded boxes. In addition, the Params and FLOPs of the REW-YOLO model have been significantly reduced to meet the detection needs in complex environments.
To verify the performance of the ELA-HSFPN module, it is compared with other classical attention mechanisms, Channel Attention, Content Anchor Attention, and integrated into the HSFPN structure to train the model and test it on the validation set. As shown in Table 3. Where the bold part signifies the optimal result.
As demonstrated in Table 3, the CA-HSFPN module exhibited an enhancement in accuracy (P) from 86.4% to 90.0%, accompanied by a marginal reduction in recall (R) from 76.9% to 76.1%, subsequent to the integration of the coordinate attention mechanism. However, the mAP50 metric exhibited an increase, reaching 85.1%. In contrast, CAA-HSFPN demonstrated a 90.3% accuracy rate, while mAP50 increased to 85.6%, but slightly reduced the recall rate to 75.7%. It is noteworthy that ELA-HSFPN demonstrates the most exceptional performance in terms of recall rate (77.6%), with an accuracy rate of 89.1%, and mAP50 reaching the highest at 86.0%. This has led to its emergence as the optimal choice for comprehensive performance.

4.2. Comparative Experiment

In this section, we compare the performance of YOLO-ELA with several mainstream object detection algorithms, YOLOv5n, YOLOv5-timm, YOLOv6, YOLOv8-timm, YOLOv9m, and YOLOv10n, under the same experimental conditions. The experimental results are shown in Table 4. Where the bold part signifies the optimal result.
The results in Table 4 indicate that REW-YOLO achieves the highest mAP50 (88.6%) and recall rate (81.1%), outperforming all other models, surpassing the benchmark YOLOv8n (84.8% and 76.9%) and the more powerful YOLOv5 timm (85.5% and 80.1%). REW-YOLO has significant advantages in terms of computing resource consumption. Its model size is only 2.18M parameters, which is smaller than all other models. The computational cost of REW-YOLO (5.9 G FLOPs) is also significantly lower than YOLOv8n (8.1 G) and YOLOv5 timm (121.2 G). This makes our model more feasible in resource-limited environments, significantly reducing computational requirements without sacrificing detection accuracy. Although the FPS of REW-YOLO is slightly lower than YOLOv8n, it still maintains an advantage compared to models with more complex structures and higher computational requirements.

5. Detection Results and Analysis

5.1. Visual Analysis

To comprehensively evaluate YOLO’s performance in logistics box detection, Figure 11 presents the heatmap visualization results of box detection using YOLOv8n and REW-YOLO. In the heatmaps, warm-colored regions indicate areas with higher weights in the detection results. As shown in Figure 11b, the YOLOv8 model mainly focuses on the main body of the box when detecting boxes in logistics environments, resulting in scattered attention to the edges of the box. This is the main reason why YOLOv8 is prone to missed detections in box inspection tasks. The REW-YOLO heatmap is shown in Figure 11c. By applying optimization strategies, the model’s attention to local areas of the box is significantly enhanced, while its attention to irrelevant background elements is suppressed. This observation confirms the effectiveness of the optimizations, demonstrating REW-YOLO ability to reduce background interference while strengthening attention to the target boxes.
To further validate the detection results of the proposed algorithm in this study, experiments were conducted using both the YOLOv8 model and the REW-YOLO model on randomly selected images from the test subset and the publicly available Roblow dataset. The detection results of REW-YOLO for boxes with different physical interference and spatial layout are shown in Figure 12. In the figure, regions highlighted with blue boxes represent successful detections by the network, while red boxes indicate missed detections and yellow boxes indicate detection errors. The text at the top of each bounding box denotes the detected box type, and the accompanying number represents the confidence score of the detection.
By comparing Figure 12, it is evident that YOLOv8 failed to detect two boxes with an occlusion rate higher than 65%. The main reason for the missed detection is that overlapping objects obscure the edges of the boxes, resulting in the loss of critical semantic information. In contrast, the improved REW-YOLO model effectively detects occluded boxes. In most cases, the enhanced REW-YOLO outperforms the standard YOLOv8 in both detection capability and confidence scores. This demonstrates that REW-YOLO provides higher accuracy and robustness, and effectively addresses box detection under varying levels of occlusion in complex environments. In the subset characterised by occlusion and arbitrary rotation angles, the REW-YOLO model achieves an accuracy of 91.3% and a recall of 86.6%. Meanwhile, REW-YOLO achieves 130 FPS and 9.8 ms/image in terms of detection speed. The experimental findings demonstrate that the proposed REW-YOLO model is capable of meeting the real-time requirements of industrial environments while maintaining a high level of recognition accuracy.

5.2. Deployment Validation

To evaluate the deployment feasibility of the proposed lightweight rotated bounding box detection model in real-world industrial scenarios, Comprehensive performance tests were conducted in the experimental environment described in Table 1. The input image size was set to (1, 3, 640, 640). The results indicate that the preprocessing step requires approximately 2.5 milliseconds, the inference step takes about 9.8 milliseconds, and the postprocessing consumes roughly 57.6 milliseconds, yielding an overall detection time of approximately 69.9 milliseconds per image. The average inference time alone is 23.0 milliseconds, corresponding to a detection speed of approximately 43.46 FPS and a throughput of 43.46 images per second. Such performance demonstrates that the model is capable of near real-time processing, meeting the speed requirements of logistics systems applications.

6. Conclusions

This paper proposed a REW-YOLO network model based on YOLOv8, designed to address the complex detection challenges of box stacking, rotation, and occlusion in logistics scenarios. The REW-YOLO achieves innovative breakthroughs by integrating structural reparameterization techniques and direction-aware attention mechanisms. The lightweight C2f-RVB module was constructed by combining the global modeling capability of RepViTBlock and the local feature extraction advantages of depthwise separable convolutions based on the original C2f structure, thereby reducing the number of parameters to 2.18 M and computational redundancy by 28%. The ELA-HSFPN hybrid network was designed to generate direction-sensitive attention weights using strip pooling and 1D convolution, enhancing occlusion box contour features and improving multi-scale occlusion target recall by 4.2%. A rotation angle regression branch and a dynamic Wise-JoU v3 loss function were introduced to optimize the positioning accuracy of the rotated boxes through an outlier-aware gradient allocation strategy. In addition, a rotational angle regression branch is introduced to achieve accurate positioning of rotating boxes, as well as a dynamic Wise-IoU loss function that balances the sample quality distribution of the dataset through an outlier-aware gradient assignment strategy.
Experimental results demonstrate that the model achieves 88.6% mAP50 and real-time performance of 130.8 FPS on the self-constructed BOX-data dataset. The REW-YOLO model meets the accuracy requirements of the warehouse logistics box recognition system. Compared with other lightweight detection frameworks, REW-YOLO shows superior performance in scenarios involving dense object placement, complex orientations, and severe occlusion, achieving a better balance between model compactness and robustness.
Tests conducted in real-world environments have shown relatively low confidence scores for heavily occluded boxes, resulting in a number of non-detections or misclassifications. Although random occlusion-based data augmentation was applied during preprocessing, the model did not fully account for occlusions occurring at different angles. Additionally, we observed a significant increase in misdetection rates when the occlusion ratio reached approximately 70% or higher. In the future, we will incorporate a wider range of occlusion angles and extreme scenarios in the dataset and analyze multi-view images to improve the robustness and adaptability of the model.
References yes
Author Contributions

Conceptualization, X.Z.; methodology, G.W. and S.L.; software, S.L. and Y.Z.; validation, S.L., Y.W. and Z.W.; formal analysis, S.L. and Z.W.; investigation, Y.W.; resources, Y.W.; data curation, S.L.; writing—original draft preparation, S.L.; writing—review and editing, X.Z. and Y.W.; supervision, X.Z.; project administration, J.H.; funding acquisition, X.Z. All authors have read and agreed to the published version of the manuscript.

Funding

This research received no external funding.

Data Availability Statement

Since the research project described in this article is ongoing, the experimental datasets generated during the study are temporarily unavailable. Interested researchers may contact the corresponding author via institutional email for inquiries regarding specific technical implementations, including model architecture details or critical layer configurations.

Acknowledgments

The authors gratefully acknowledge the technical support provided by colleagues during the experimental phase. We extend our sincere appreciation to our mentors for their invaluable guidance and encouragement throughout this research. Finally, we are deeply indebted to the anonymous reviewers for their insightful comments and constructive suggestions, which have significantly improved the quality of this work.

Conflicts of Interest

The authors declare no conflict of interest.

References

  1. Ambrosino, D.; Xie, H. Machine Learning-Based Optimization Models for Defining Storage Rules in Maritime Container Yards. Modelling 2024, 5, 1618–1641. [Google Scholar] [CrossRef]
  2. Chen, C.; Liu, J.; Yin, H.; Huang, B. A Vision-Based Method for Detecting the Position of Stacked Goods in Automated Storage and Retrieval Systems. Sensors 2025, 25, 2623. [Google Scholar] [CrossRef] [PubMed]
  3. Ren, C.; Ji, H.; Liu, X.; Teng, J.; Xu, H. Visual Sorting of Express Packages Based on the Multi-Dimensional Fusion Method under Complex Logistics Sorting. Entropy 2023, 25, 298. [Google Scholar] [CrossRef]
  4. Zhang, Z.; Liu, L.; Zhao, X.; Zhang, L.; Wu, J.; Zhang, Y.; Li, Z. DSSO-YOLO: A fast detection model for densely stacked small object. Displays 2024, 82, 102659. [Google Scholar] [CrossRef]
  5. Huang, X.; Zhu, J.; Huo, Y. SSA-YOLO: An Improved YOLO for Hot-Rolled Strip Steel Surface Defect Detection. IEEE Trans. Instrum. Meas. 2024, 73, 1–17. [Google Scholar] [CrossRef]
  6. Chen, L.C.; Papandreou, G.; Kokkinos, I.; Murphy, K.; Yuille, A.L. DeepLab: Semantic Image Segmentation with Deep Convolutional Nets, Atrous Convolution, and Fully Connected CRFs. IEEE Trans. Pattern Anal. Mach. Intell. 2018, 40, 834–848. [Google Scholar] [CrossRef]
  7. Xia, K.; Weng, Z. Workpieces sorting system based on industrial robot of machine vision. In Proceedings of the 2016 3rd International Conference on Systems and Informatics (ICSAI), Shanghai, China, 19–21 November 2016; pp. 422–426. [Google Scholar]
  8. Girshick, R.; Donahue, J.; Darrell, T.; Malik, J. Rich Feature Hierarchies for Accurate Object Detection and Semantic Segmentation. In Proceedings of the IEEE Conference on Computer Vision and Pattern Recognition (CVPR), Columbus, OH, USA, 23–28 June 2014. [Google Scholar]
  9. Girshick, R.; Radosavovic, I.; Gkioxari, G.; Dollár, P.; He, K. Detectron. 2018. Available online: https://github.com/facebookresearch/detectron (accessed on 20 January 2025).
  10. Redmon, J.; Farhadi, A. YOLO9000: Better, Faster, Stronger. arXiv 2016. [Google Scholar] [CrossRef]
  11. Redmon, J.; Farhadi, A. YOLOv3: An Incremental Improvement. arXiv 2018. [Google Scholar] [CrossRef]
  12. Bochkovskiy, A.; Wang, C.Y.; Liao, H.Y.M. YOLOv4: Optimal Speed and Accuracy of Object Detection. arXiv 2020. [Google Scholar] [CrossRef]
  13. Yan, B.; Fan, P.; Lei, X.; Liu, Z.; Yang, F. A Real-Time Apple Targets Detection Method for Picking Robot Based on Improved YOLOv5. Remote Sens. 2021, 13, 1619. [Google Scholar] [CrossRef]
  14. Wang, C.Y.; Bochkovskiy, A.; Liao, H.Y.M. YOLOv7: Trainable bag-of-freebies sets new state-of-the-art for real-time object detectors. In Proceedings of the IEEE/CVF Conference on Computer Vision and Pattern Recognition (CVPR), Vancouver, BC, Canada, 17–24 June 2023. [Google Scholar]
  15. Wei, L.; Dragomir, A.; Dumitru, E.; Christian, S.; Scott, R.; Cheng-Yang, F.; Berg, A.C. SSD: Single Shot MultiBox Detector. In Proceedings of the Computer Vision—ECCV 2016: 14th European Conference, Amsterdam, The Netherlands, 11–14 October 2016; Proceedings, Part I. Springer: Cham, Switzerland, 2016. [Google Scholar]
  16. Ge, Z.; Liu, S.; Wang, F.; Li, Z.; Sun, J. YOLOX: Exceeding YOLO Series in 2021. arXiv 2021. [Google Scholar] [CrossRef]
  17. Gou, L.; Wu, S.; Yang, J.; Yu, H.; Lin, C.; Li, X.; Deng, C. Carton dataset synthesis method for loading-and-unloading carton detection based on deep learning. Int. J. Adv. Manuf. Technol. 2022, 124, 3049–3066. [Google Scholar] [CrossRef]
  18. Wu, C.; Duan, X.; Ning, T. Express parcel detection based on improved faster regions with CNN features. J. Intell. Fuzzy Syst. 2023, 45, 4223–4238. [Google Scholar] [CrossRef]
  19. Arpenti, P.; Caccavale, R.; Paduano, G.; Andrea Fontanelli, G.; Lippiello, V.; Villani, L.; Siciliano, B. RGB-D Recognition and Localization of Cases for Robotic Depalletizing in Supermarkets. IEEE Robot. Autom. Lett. 2020, 5, 6233–6238. [Google Scholar] [CrossRef]
  20. Zhao, K.; Wang, Y.; Zhu, Q.; Zuo, Y. Intelligent Detection of Parcels Based on Improved Faster R-CNN. Appl. Sci. 2022, 12, 7158. [Google Scholar] [CrossRef]
  21. Domenico, B.; Donato, C.; Luca, D.R.; Nicola, L.; Simone, P.; Giovanni, D.S.; Vitoantonio, B.; Antonio, B. Object Detection for Industrial Applications: Training Strategies for AI-Based Depalletizer. Appl. Sci. 2022, 12, 11581. [Google Scholar] [CrossRef]
  22. Kim, S.; Lee, K.H.; Kim, C.; Yoon, J. Vision-centric 3D point cloud technique and custom gripper process for parcel depalletisation. J. Intell. Manuf. 2024, 1–17. [Google Scholar] [CrossRef]
  23. Murrugarra-Llerena, J.; Kirsten, L.N.; Zeni, L.F.; Jung, C.R. Probabilistic Intersection-Over-Union for Training and Evaluation of Oriented Object Detectors. IEEE Trans. Image Process. 2024, 33, 671–681. [Google Scholar] [CrossRef]
  24. Zhao, Z.; Li, S. OASL: Orientation-aware adaptive sampling learning for arbitrary oriented object detection. Int. J. Appl. Earth Obs. Geoinf. 2024, 128, 103740. [Google Scholar] [CrossRef]
  25. Zhu, X.; Zhou, W.; Wang, K.; He, B.; Fu, Y.; Wu, X.; Zhou, J. Oriented Object Detection in Remote Sensing Using an Enhanced Feature Pyramid Network. Electronics 2023, 12, 3559. [Google Scholar] [CrossRef]
  26. Wang, A.; Chen, H.; Lin, Z.; Han, J.; Ding, G. RepViT: Revisiting Mobile CNN From ViT Perspective. In Proceedings of the IEEE/CVF Conference on Computer Vision and Pattern Recognition (CVPR), Vancouver, BC, Canada, 17–24 June 2023. [Google Scholar]
  27. Chollet, F. Xception: Deep Learning with Depthwise Separable Convolutions. In Proceedings of the 2017 IEEE Conference on Computer Vision and Pattern Recognition (CVPR), Honolulu, HI, USA, 21–26 July 2017. [Google Scholar]
  28. Xu, W.; Wan, Y. ELA: Efficient Local Attention for Deep Convolutional Neural Networks. arXiv 2024, arXiv:2403.01123. [Google Scholar] [CrossRef]
  29. Cai, X.; Lai, Q.; Wang, Y.; Wang, W.; Sun, Z.; Yao, Y. Poly Kernel Inception Network for Remote Sensing Detection. In Proceedings of the 2024 IEEE/CVF Conference on Computer Vision and Pattern Recognition (CVPR), Seattle, WA, USA, 16–22 June 2024. [Google Scholar]
  30. Wu, Y.; He, K. Group Normalization. arXiv 2018. [Google Scholar] [CrossRef]
  31. Ioffe, S.; Szegedy, C. Batch Normalization: Accelerating Deep Network Training by Reducing Internal Covariate Shift. In Proceedings of the 32nd International Conference on Machine Learning: ICML 2015, Lille, France, 6–11 July 2015; Volume 1. [Google Scholar]
  32. Zhang, H.; Wang, Y.; Dayoub, F.; Sünderhauf, N. VarifocalNet: An IoU-aware Dense Object Detector. arXiv 2020, arXiv:2008.13367. [Google Scholar]
  33. Zheng, Z.; Wang, P.; Liu, W.; Li, J.; Ye, R.; Ren, D. Distance-IoU Loss: Faster and Better Learning for Bounding Box Regression. arXiv 2019, arXiv:1911.08287. [Google Scholar] [CrossRef]
  34. Tong, Z.; Chen, Y.; Xu, Z.; Yu, R. Wise-IoU: Bounding Box Regression Loss with Dynamic Focusing Mechanism. arXiv 2023, arXiv:2301.10051. [Google Scholar]
  35. Vitsas, N.; Evangelou, I.; Papaioannou, G.; Gkaravelis, A. Parallel Transformation of Bounding Volume Hierarchies into Oriented Bounding Box Trees. Comput. Graph. Forum 2023, 42, 245–254. [Google Scholar] [CrossRef]
  36. Bucuresti, U.P. BOX DETECTION Dataset. 2024. Available online: https://universe.roboflow.com/universitatea-politehnica-bucuresti-otdur/box-detection-dctdx (accessed on 22 July 2025).
Figure 1. Proposed REW-YOLO model structure diagram.
Modelling 06 00076 g001
Figure 2. Architecture of the C2f-RVB module.
Modelling 06 00076 g002
Figure 3. Depthwise Separable Convolution.
Modelling 06 00076 g003
Figure 4. Architecture of the ELA module network.
Modelling 06 00076 g004
Figure 5. Architecture of the ELA-HSFPN module.
Modelling 06 00076 g005
Figure 6. Comparison chart of different labeling methods (a) Axis-Aligned Bounding Box. (b) Oriented Bounding Box.
Modelling 06 00076 g006
Figure 7. Box boundary-aware vectors.
Modelling 06 00076 g007
Figure 8. Dataset images. (a) Dense box. (b) Mildly occluded box. (c) severely occluded box. (d) rotated offset box. (e) occluded and rotated box.
Modelling 06 00076 g008
Figure 9. Data enhancement. (a) Original box. (b) Illumination variation. (c) Color space transformation. (d) Geometric transformation. (e) Random erasing.
Modelling 06 00076 g009
Figure 10. The mAP50 of the results of ablation experiments.
Modelling 06 00076 g010
Figure 11. Visualization Results of the Heatmap. (a) Original Image. (b) YOLOv8 Heatmap. (c) REW-YOLO Heatmap.
Modelling 06 00076 g011
Figure 12. Comparison of box detection results. Where columns (ac) represent test set image detection results, (d,e) Roboflow-data [36] test results.
Modelling 06 00076 g012
Table 1. Model training environment.
ParameterConfiguration
CPUIntel 13th Gen Core i5-13400F
Random access memory (RAM)16GB
GPURTX 4060
Display memory24 GB
Training environmentCUDA 11.8
Operating systemWindows 11
Development environment (computer)PyTorch 2.2.0 Python 3.11
Table 2. Performance comparison of a feature fusion network with a pyramid.
ModelsP (%)R (%)mAP50%mAP50-95%Params/MFLOPs/G
YOLOv8n (baseline)87.376.984.868.53.008.1
YOLOv8n + C2fRVB88.170.580.161.72.286.3
YOLOv8n + ELA-HSFPN89.177.686.066.22.546.9
YOLO + WIoU87.380.285.367.23.008.1
YOLO + OBB86.183.087.171.73.008.3
REW-YOLO90.281.188.668.02.185.9
Table 3. Experiments Comparing Different Attentional Mechanisms for HSFPN Fusion.
ModulsP (%)R (%)mAP50%
HSFPN86.476.984.6
CA-HSFPN90.076.185.1
CAA-HSFPN90.375.785.6
ELA-HSFPN89.177.686.0
Table 4. Performance comparison of different models.
ModelsP (%)R (%)mAP50%mAP50-95%Params/MFLOPs/GFPS
YOLOv8n87.376.984.868.53.008.1131.1
YOLOv5n89.575.283.965.62.507.1101.1
YOLOv5-timm85.980.185.568.824.22121.263.6
YOLOv689.377.285.466.34.2811.8244.6
YOLOv8-timm87.978.084.865.613.3235.1168.2
YOLOv9m85.875.482.865.020.1577.075.7
YOLOv10n89.572.383.465.52.266.5178.1
REW-YOLO90.281.188.668.02.185.9128.3
Disclaimer/Publisher’s Note: The statements, opinions and data contained in all publications are solely those of the individual author(s) and contributor(s) and not of MDPI and/or the editor(s). MDPI and/or the editor(s) disclaim responsibility for any injury to people or property resulting from any ideas, methods, instructions or products referred to in the content.