Article

An Anisotropic Failure Characteristic- and Damage-Coupled Constitutive Model

1
School of Mechanics and Transportation Engineering, Northwestern Polytechnical University, Xi’an 710072, China
2
State Key Laboratory of Clean and Efficient Turbomachinery Power Equipment, Deyang 618000, China
3
School of Mechanical Engineering, Xi’an University of Science and Technology, Xi’an 710054, China
4
Dongfang Electric Corporation Dongfang Turbine Co., Ltd., Deyang 618000, China
*
Author to whom correspondence should be addressed.
Modelling 2025, 6(3), 75; https://doi.org/10.3390/modelling6030075 (registering DOI)
Submission received: 12 June 2025 / Revised: 25 July 2025 / Accepted: 30 July 2025 / Published: 1 August 2025

Abstract

This study proposes a coupled constitutive model that captures the anisotropic failure characteristics and damage evolution of nickel-based single-crystal (SX) superalloys under various temperature conditions. The model accounts for both creep rate and material damage evolution, enabling accurate prediction of the typical three-stage creep curves, macroscopic fracture morphologies, and microstructural features under uniaxial tensile creep for specimens with different crystallographic orientations. Creep behavior of SX superalloys was simulated under multiple orientations and various temperature-stress conditions using the proposed model. The resulting creep curves aligned well with experimental observations, thereby validating the model’s feasibility and accuracy. Furthermore, a finite element model of cylindrical specimens was established, and simulations of the macroscopic fracture morphology were performed using a user-defined material subroutine. By integrating the rafting theory governed by interfacial energy density, the model successfully predicts the rafting morphology of the microstructure at the fracture surface for different crystallographic orientations. The proposed model maintains low programming complexity and computational cost while effectively predicting the creep life and deformation behavior of anisotropic materials. The model accurately captures the three-stage creep deformation behavior of SX specimens and provides reliable predictions of stress fields and microstructural changes at critical cross-sections. The model demonstrates high accuracy in life prediction, with all predicted results falling within a ±1.5× error band and an average error of 14.6%.

Graphical Abstract

1. Introduction

SX superalloys are widely used in turbine cooling blades due to their superior high-temperature mechanical properties [1,2,3,4]. Their face-centered cubic (FCC) crystal structure endows them with inherently anisotropic mechanical behavior [5]. The mechanical response of SX superalloys shows significant dependence on crystallographic orientation; even under identical testing conditions, the creep life of specimens with different orientations can differ by one to two orders of magnitude [6]. The difference is caused by the activation of different slip systems during creep, which vary with crystallographic orientation [7,8], and is further influenced by temperature and applied stress. Thus, a detailed investigation into the anisotropic creep response of SX superalloys under different temperatures and stresses is required.
The core of creep modeling lies in determining the strain response of materials under constant stress, which enables the formulation of creep evolution laws and the prediction of time to failure. In recent years, numerical methods used to analyze creep behavior in SX superalloys have generally been divided into two main categories: crystal plasticity-based models [9,10,11] and macroscopic phenomenological models grounded in continuum damage mechanics (CDM) [12,13]. The crystal plasticity method is a constitutive modeling approach based on the material’s microscopic crystal structure, which enables an in-depth description of the plastic deformation mechanisms of single- or poly-crystalline materials under external loading. By introducing crystallographic parameters such as slip systems, dislocation density evolution, and texture changes, this method establishes a link between the material response and microstructural evolution at the grain scale, thus allowing for high-precision prediction of anisotropic mechanical behavior. A wide range of research efforts have utilized crystal plasticity theory to explore the mechanical responses and underlying damage mechanisms of various materials [2,9,10,11,14,15,16,17,18]. However, these constitutive models are generally complex in structure and highly dependent on computational resources, which limits their widespread application in engineering practice [19]. In contrast, macroscopic phenomenological methods based on continuum damage mechanics (CDM) introduce internal state variables (e.g., damage factors, damage tensors) into the framework of classical continuum mechanics to characterize performance degradation caused by the accumulation of microscopic defects such as microcracks and micropores under macroscopic stress states. The CDM model originates from the pioneering work of Kachanov [20]. Due to its ease of implementation, especially when integrated into finite element software, it has achieved great success in addressing a wide range of engineering problems [21,22,23,24,25,26,27]. Lemaitre [28] further regarded micro-defects as damage and introduced damage variables, enabling quantitative evaluation of material degradation due to defect nucleation and propagation. Since CDM is generally associated with micromechanics, physics, and continuum mechanics, it has been applied to characterize various damage mechanisms, such as creep [29,30,31,32,33], fatigue [34,35,36,37], creep–fatigue interaction [38,39,40], ductile failure [41,42], and brittle fracture [43,44]. These models have proven to be highly effective in predicting creep lifetime and crack growth rates [45,46,47,48,49,50,51], while their relatively straightforward formulations enhance their applicability in engineering practice. Accordingly, they have attracted considerable attention and widespread use. The constitutive model presented in this work is classified within this category.
Considering the points above, this study investigates the anisotropic creep response of SX superalloys over a wide temperature range. Standard cylindrical specimens are used to perform creep tests at different temperatures and stress levels for three specific crystallographic orientations. Accordingly, a macroscopic creep constitutive model grounded in viscoplasticity theory is formulated. This model can effectively predict anisotropic creep life and deformation with relatively low programming complexity and computational cost. The comparison of model predictions with experimental data shows that the model successfully captures the three-stage creep deformation behavior of SX superalloy specimens for various orientations. Moreover, for specimens with varying crystallographic orientations, the model demonstrates strong consistency with experimental observations in terms of stress distribution at critical cross-sections and microstructural evolution, thereby reinforcing its credibility and predictive accuracy. When applied to creep life prediction using the parameter identification method proposed in this study, all results fell within a ±1.5× error band, with an average prediction error of only 14.6%, indicating that the model exhibits excellent accuracy and reliability.

2. Experiment

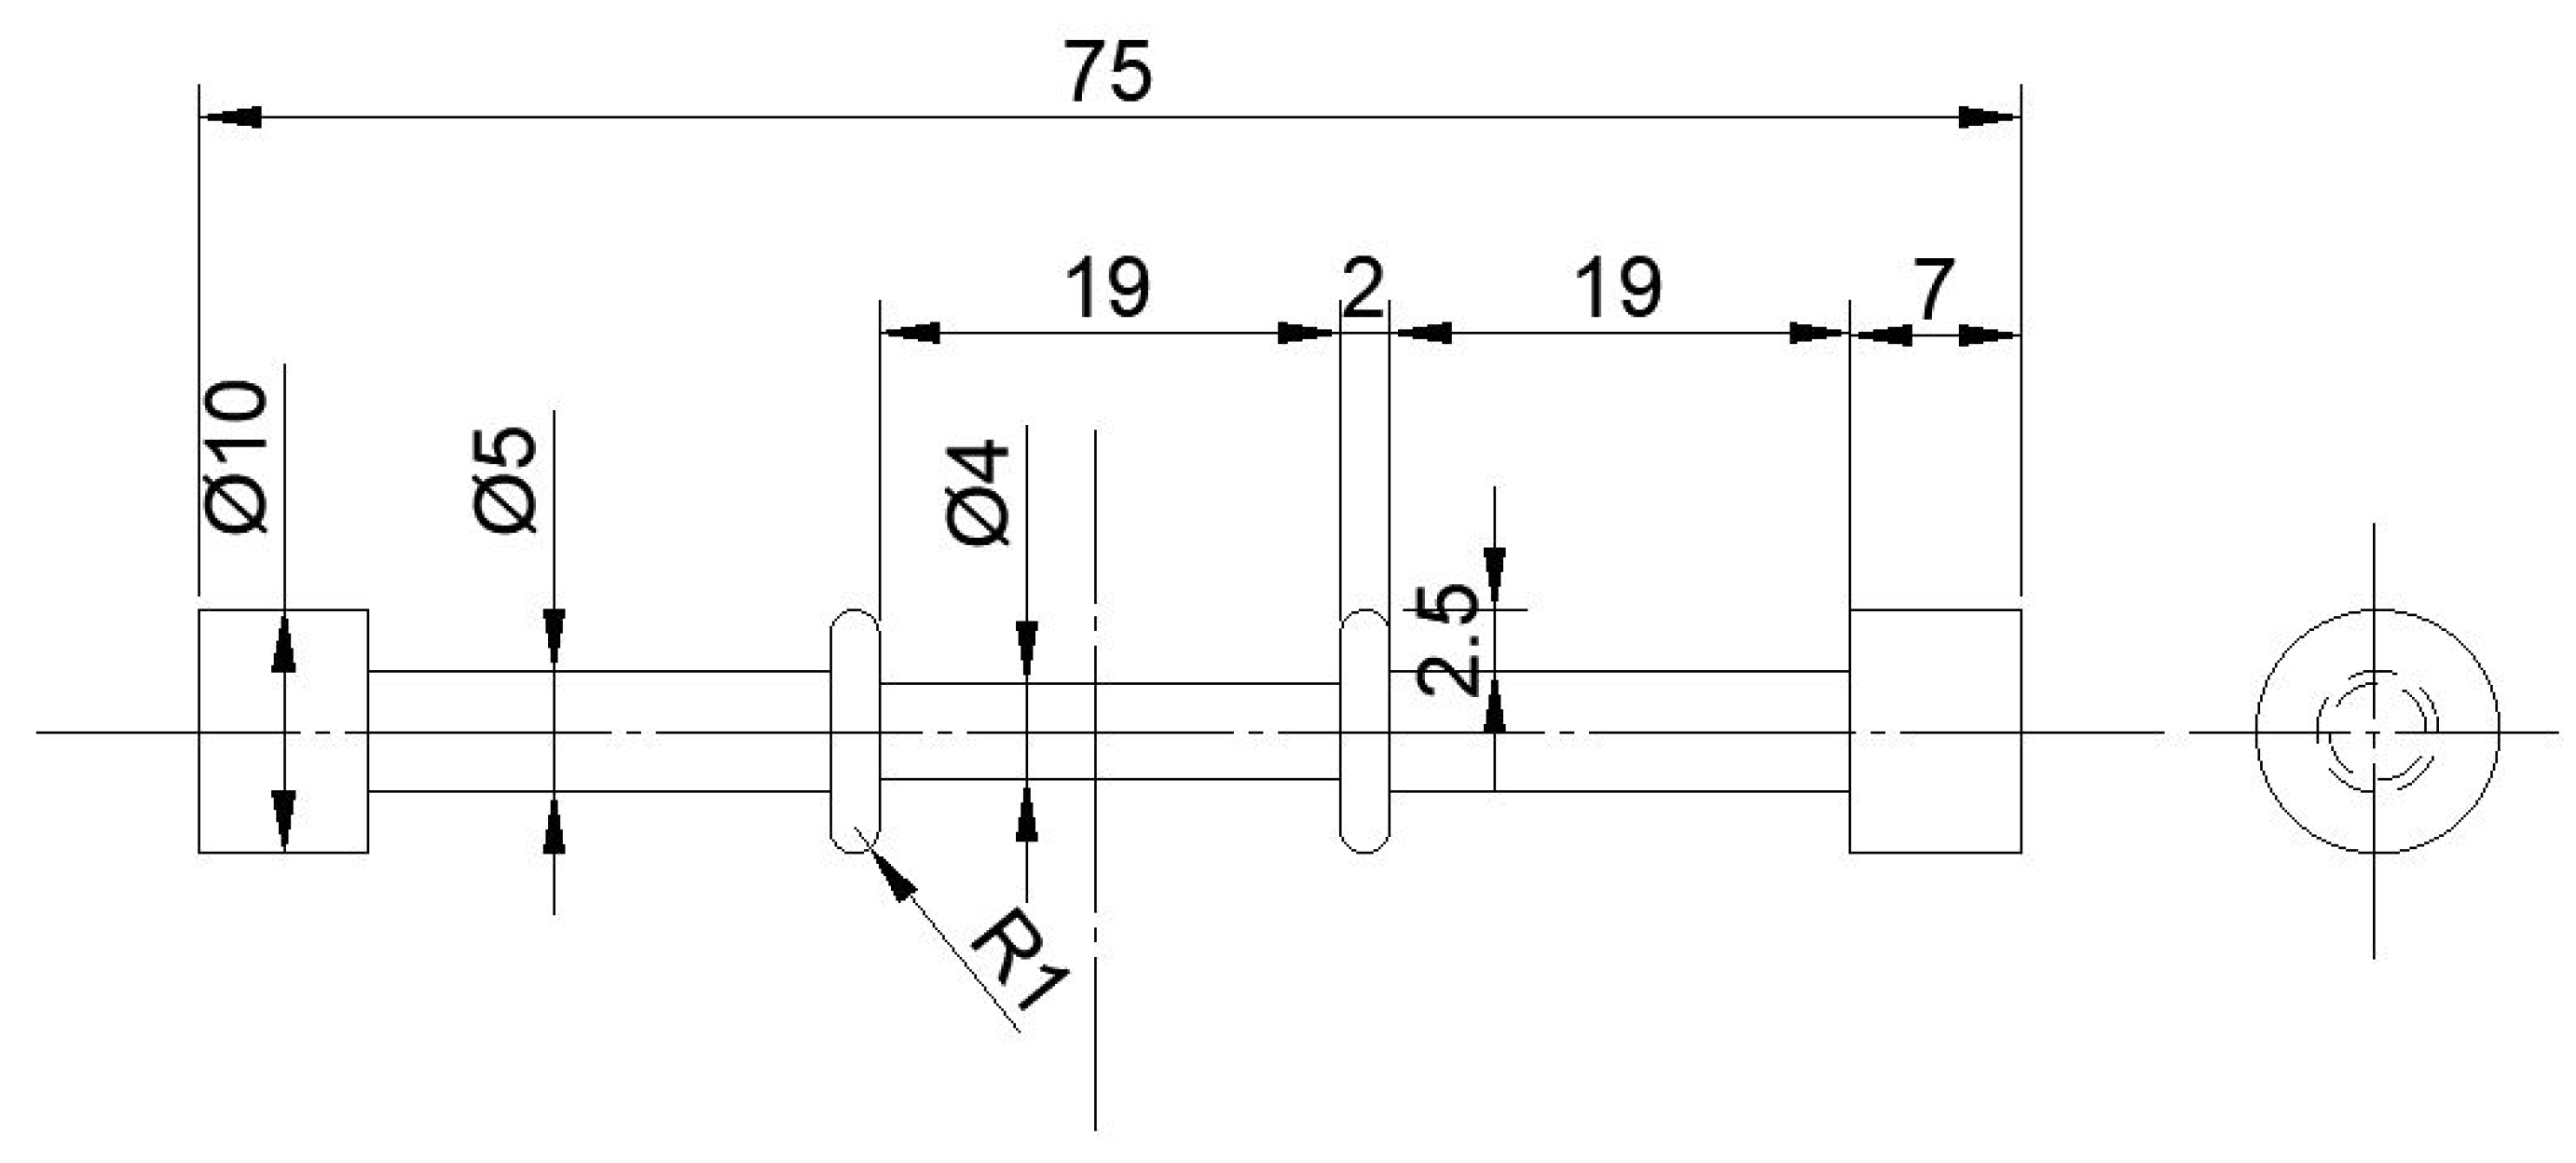
The DD6 alloy was employed as the experimental material. The applied heat treatment involved sequential holds at 1290 °C for 1 h, 1300 °C for 2 h, and 1315 °C for 4 h followed by air cooling, then 1120 °C for 4 h and 870 °C for 32 h, both with air cooling. Figure 1 displays the microstructure of the initial two-phase material and the actual creep specimen. The creep specimen dimensions, shown in Figure 2, include a gauge length of 19 mm and a diameter of 4 mm, matching those used in Gu et al.’s study [19]. The experimental materials consisted of three crystallographic orientations: [001], [011], and [111]. The deviation in specimen orientation was maintained within 3°, allowing the effect of orientation misalignment on the results to be considered negligible.
Tensile creep tests were conducted on specimens with three crystallographic orientations ([001], [011], and [111]) at temperatures of 850 °C, 980 °C, and 1100 °C, covering a range of stress conditions. The experiments yielded creep curves corresponding to various crystallographic orientations, temperatures, and stress levels, as well as post-test fracture surfaces and microstructural observations. The obtained data serve as crucial support for the validation of the macroscopic creep constitutive model for the anisotropic behavior of SX superalloys.

3. Macroscopic Creep Constitutive Model

SX superalloys are materials with transverse isotropy, where the mechanical properties in the crystal growth direction differ from those in other directions. As a consequence, the conventional von Mises stress fails to accurately represent the equivalent stress across different crystallographic orientations. To capture the directional creep response of SX superalloys, this study employs the anisotropic equivalent stress σ e q a n formulated by Boehler and Sawczuk [52], which is represented in tensorial form as follows:
σ e q a n = S : Λ : S
In this expression, S corresponds to the deviatoric stress tensor, and Λ is the fourth-order tensor that characterizes the anisotropy inherent to the material, which is given by the following equation:
Λ = H + 5 F 2 L M ¯ M ¯ + L F 2 H · M ¯ I + I ¯ M 2 3 M I + I M + 2 9 I I + ( F + 2 H ) · I ¯ I 1 3 I I
The anisotropic coefficients H , K , and L are obtained from uniaxial tests on specimens with different crystallographic orientations. The second-order orientation tensor M , derived from crystal orientation vectors ξ , is defined as follows:
M = ξ ξ
M ¯ = M I / 3
where I is the identity tensor.
Considering the three stages of creep deformation in SX superalloys, this study proposes a new creep strain rate prediction model:
ε ˙ = ε ˙ 0 σ ~ e q a n d r σ n e x p Q R T c o t h θ N
In this formulation, ε ˙ represents the creep strain rate, while ε ˙ 0 serves as a material-specific reference rate constant. The parameter d r , correlated with the applied stress, dictates the rate at which the creep strain evolves in the material. Q denotes the activation energy specific to SX superalloys, R is the universal gas constant, and T represents the absolute temperature. The term σ ~ e q a n refers to the anisotropic effective stress that accounts for creep-induced damage:
σ ~ e q a n = S : Λ : S     1 D
In Equation (5), N indicates the creep strain accumulation direction:
N = Λ : S S : Λ : S
In Equation (5), the hyperbolic function c o t h θ controls the evolution rate of the primary stage of creep, where θ is a parameter related to creep time:
θ = λ t + t 0
where t 0 determines the initial creep rate, and λ controls the primary creep evolution rate; both are dimensionless parameters.
According to Lemaitre’s theory of continuous damage mechanics, the initial stage of creep damage is related to the steady-state creep stage [28]. To describe the nonlinear process of material creep damage, this study adopts Bonora’s nonlinear damage theory [53,54,55,56]. The evolution of creep damage is expressed as follows:
d D = ζ 1 l n ε a n , e q i n , c r / ε a n , e q i n , t h 1 D ζ 1 ζ d ε a n , e q i n ε a n , e q i n
Damage initiation occurs once the accumulated anisotropic equivalent creep strain ε a n , e q i n in the material exceeds the threshold ε a n , e q i n , t h . As ε a n , e q i n progresses to the critical value ε a n , e q i n , c r , the damage variable asymptotically approaches its upper limit of 1, indicating complete material failure. The exponent ζ, ranging from 0 to 1, controls the shape of the creep damage curve. The effective stress continuously increases during the tertiary creep stage as damage accumulates, thereby accelerating the creep rate.
To study the rafting morphology under different orientations, this study adopts a rafting model based on the interfacial energy density [57]. During the creep process, the γ phase forms a lamellar or rod-like rafting structure, where the dislocation energy at the phase interfaces is crucial in determining the rafting morphology. Specifically, the phase interface energy caused by dislocation accumulation is a key factor in determining the rafting behavior. The interfacial energy of the γ / γ phase arises from the combined effects of lattice misfit and applied stress, and its density is determined by the following expression:
W i = N i W d i s
where W i is the interfacial energy density, N i is the dislocation density, and W d i s is the dislocation energy. The subscript i i = x , y , z denotes the interface normal to the i -axis. The dislocation energy W d i s may be evaluated through the following equation:
W d i s = α G γ b 2
where α is a constant, G γ is the shear modulus of the γ phase, and b is the Burgers vector magnitude, which is equal to a γ , i / 2 , where a γ is the lattice constant of the γ phase. The dislocation density N i can be expressed in terms of the lattice constants a γ , i and a γ , i of the γ and γ phases, respectively, and is given by the following formula:
N i = 1 a γ , i 1 a γ , i = a γ , i a γ , i a γ , i a γ , i
Based on the above equations, the expression for the interfacial energy density W i is derived as follows:
W i = α 2 a γ , i a γ , i a γ , i a γ , i G γ
Under applied stress, the expressions for α γ , i and α γ , i are given as follows:
a γ , i = a γ , i 0 1 + σ j ν γ σ i + σ k E γ 1 + σ k ν γ σ j + σ i E γ 1 τ i j G γ 1 τ i k G γ
where a γ , i 0 and a γ , i 0 represent the lattice constants of the γ and γ phases in the unstressed state, respectively. The elastic moduli E γ and E γ , Poisson’s ratios ν γ and ν γ , and shear moduli G γ and G γ correspond to the two phases. Shear stress components τ i j are defined with subscripts i , j , and k , representing the x , y , and z axes.
To illustrate the rafting process more intuitively, let us assume that the interfacial energy densities of the (001), (010), and (100) interfaces are denoted as W 1 , W 2 , and W 3 , respectively. Among them, W 1 has the highest value, followed by W 2 , while W 3 is the lowest. Rafting preferentially occurs at the interface with W 1 . As the rafting process progresses, W 1 gradually decreases, whereas W 3 increases. The specific characteristics of rafting can be described based on the following assumptions:
(1) If W 1 is significantly greater than W 2 and W 3 , rafting occurs exclusively on the W 1 interface, forming a P-type (rod-like) rafting structure.
(2) If W 1 and W 2 are notably greater than W 3 , rafting occurs simultaneously on both the W 1 and W 2 interfaces, leading to an N-type (plate-like) rafting structure.
(3) If W 1 , W 2 , and W 3 are approximately equal, meaning that the differences in phase interface energy density are minimal, rafting is not significant, and the material is expected to retain its original morphology.

4. Results and Discussion

4.1. Finite Element Model Development and Constitutive Parameter Determination Methods

4.1.1. Development of the Macroscopic Model

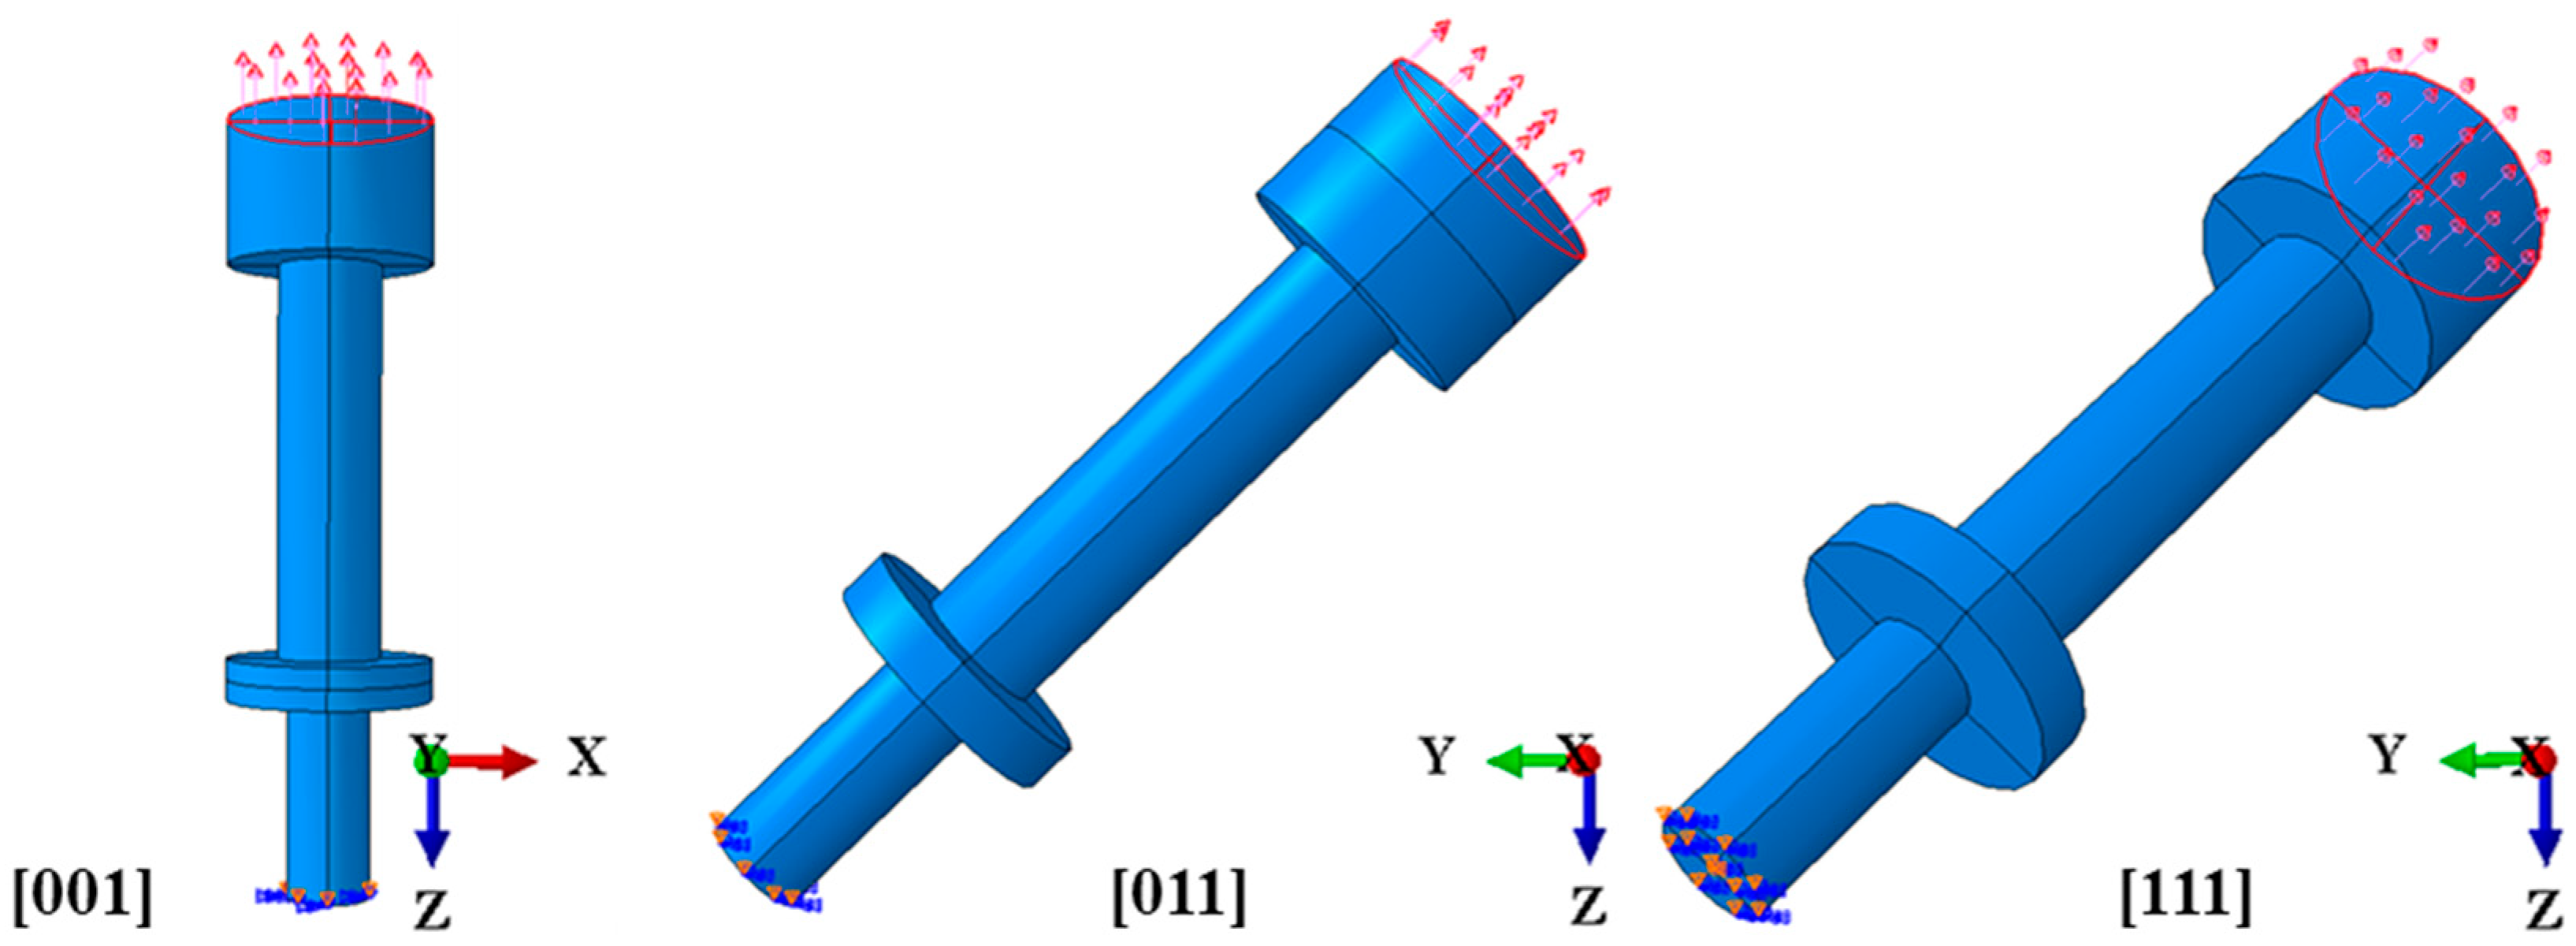
To investigate the cross-sectional necking of SX superalloy specimens with different orientations after creep fracture and to predict the rafting behavior under uniaxial stress conditions, a macroscopic creep model of the cylindrical specimen was constructed in accordance with the geometric dimensions presented in Figure 2. Exploiting the specimen’s symmetry, the finite element model was constructed using half of the geometry to optimize computational efficiency. The mesh size and type are shown in Figure 3, with an approximate global mesh size of 2. Since the gauge section (part-1) is the primary area of interest, mesh refinement was applied to this region, yielding an element size approximately equal to 0.2. To ensure the convergence of computational results and prevent distorted meshes, structured hexahedral meshes were used for Part-1 and Part-3 in Figure 3, with the element type set as C3D8R. Part-2 was meshed with an unstructured tetrahedral mesh, using the element type C3D10. Part-4 was meshed with a swept hexahedral mesh, also employing the C3D8R element type. To simulate uniaxial tensile creep behavior for different crystal orientations, three finite element models of cylindrical specimens were developed for the [001], [011], and [111] orientations, as shown in Figure 4. A uniaxial tensile load was imposed at one end of the specimen along its longitudinal axis, with the opposite end mechanically constrained.

4.1.2. Constitutive Parameter Determination Methods

The parameters in this model can be classified into three categories: The first category can be referred to as constant-type parameters, which are typically material constants or empirical values and can be directly provided, such as the activation energy Q and the gas constant R. The second category is experiment-type parameters, which are obtained from experimental data, such as the steady-state creep rate ε ˙ o C , the critical strain for damage initiation ε a n , e q i n , t h , and the critical strain for damage failure ε a n , e q i n , c r . The third category is fitting-type parameters, which are obtained by fitting to experimental results. These are the key parameters of the model and include λ , t 0 , ε ˙ 0 , d r , n, and ζ . This study proposes a simple method for parameter determination, which enables quick and convenient identification of the required parameters. However, the fitting accuracy of these parameters may be influenced by the stability of the experimental data itself. The parameter determination method is described as follows:
The first category of parameters consists of material constants or empirical values, which can be obtained from the literature. For example, the gas constant R is 8.314 J/(mol·K), and the activation energy Q depends on the material type and temperature T. Under specific material and experimental conditions, these two values are considered constants. Precise values for the first-category parameters are not essential, since the term e x p Q R T will be combined with ε ˙ 0 during the fitting of the third-category parameters to form a new parameter A c .
The second category of parameters is derived from experimental curves. The steady-state creep rate ε ˙ o C is determined by the slope of a linear regression applied to the secondary stage of the creep curve. The creep rate curve is calculated by taking the first-order time derivative of the creep strain curve. The location at which the creep rate attains its minimum value, or equivalently the middle point of the secondary creep stage, can be considered an approximate indicator of damage initiation. The strain corresponding to this position is defined as the critical strain ε a n , e q i n , t h , marking the onset of damage. The strain corresponding to the failure location on the creep curve is designated as the critical damage strain ε a n , e q i n , c r .
The third category of parameters needs to be fitted based on experimental curves, with priority given to fitting the parameters corresponding to the secondary stage. During the secondary stage, ε ˙ corresponds to the steady-state creep rate ε ˙ o C , and at this stage, c o t h θ approaches zero. Since damage is not yet initiated, the equivalent stress σ ~ e q a n can be approximated as the experimental stress σ . To facilitate parameter fitting, we define the following:
A c = ε ˙ 0 · e x p Q R T
For the axial direction, Equation (5) at this stage becomes
ε ˙ o C = A c σ d r σ n
The stress exponent n is extracted from the log σ –log ε ˙ relationship based on Norton’s law, and the parameters A c and d r σ are subsequently determined through nonlinear fitting.
For the creep primary stage, since damage has not yet been initiated, Equation (5) becomes
ε ˙ = A c σ d r σ n c o t h θ N
For the axial direction, substituting into Equation (17) yields:
ε ˙ = ε ˙ o C c o t h θ
Integrating the above equation yields:
ε = ε ˙ o C / λ · l n ( sinh λ · t + t 0 sinh t 0 )
The average value of the steady-state creep rate is taken, and the primary stages of all creep curves are averaged based on time increments to obtain an averaged curve for the primary stage. By substituting this into Equation (20) for fitting, the parameters λ and t 0 , which govern the morphology of the fitted curve during the primary creep stage, can be identified. It should be emphasized that employing the averaged steady-state creep rate and the mean primary creep curve facilitates the use of a unified parameter set for fitting creep curves and predicting creep life across multiple stress levels. Conversely, when the objective is to attain high fitting precision under a specific stress condition, using the steady-state creep rate and primary-stage data for the specific stress level is adequate.
For the creep tertiary stage, damage has already been initiated, and the key lies in determining the damage parameter ζ . The damage variable D is defined in relation to the creep rate as follows:
D = ε a n , e q i n ˙ ε a n , e q i n , t h ˙ ε a n , e q i n , c r ˙ ε a n , e q i n , t h ˙
The damage variable D is defined to be zero when the strain reaches the damage initiation threshold ε a n , e q i n , t h and reaches unity upon attaining the critical failure strain ε a n , e q i n , c r . Based on this, the strain–damage curve during the period from damage initiation to damage failure can be obtained by using the derivative of the creep curve along with the previously determined values of ε a n , e q i n , t h and ε a n , e q i n , c r .
Integrating Equation (9) yields:
D = 1 1 l n ε a n , e q i n / ε a n , e q i n , t h l n ε a n , e q i n , c r / ε a n , e q i n , t h ζ
By combining Equation (21), the damage parameter ζ can be fitted. At this point, all parameters of the model can be determined.
It should be noted that this parameter determination method relies solely on fitting the three-stage characteristics of the creep curve. Therefore, the obtained parameters are mainly applicable to the description of the creep stage and cannot effectively capture the response in the elastic stage. In practical applications, finite element analysis should distinguish between the elastic and creep stages.
Moreover, the determination of almost all parameters is constrained by the characteristics of the creep curve itself, causing parameter fitting quality to heavily rely on experimental process stability. The parameters obtained by this method represent only an approximate solution within the real parameter space. For more accurate fitting results, further optimization and adjustment of the parameters are necessary.

4.2. Creep Curve Fitting Validation of Nickel-Based Single Crystals with Three Orientations Under Different Temperatures and Stresses

Based on the anisotropic failure characteristics and the damage-coupled constitutive model of SX superalloys at different temperatures proposed in this study, a UMAT was developed. ABAQUS was used to perform finite element simulations of creep behavior for three crystallographic orientations under various temperatures and stress levels. Anisotropic creep responses of specimens with [001], [011], and [111] crystallographic orientations were investigated, and their corresponding creep strain-versus-time curves were acquired. The parameters used for the validation of the constitutive model’s feasibility are listed in Appendix A. Figure 5, Figure 6 and Figure 7 illustrate the outcomes of the creep experiments and corresponding finite element simulations.
Figure 5, Figure 6 and Figure 7 display the creep test results and their corresponding finite element calculations under the conditions of 850 °C, 980 °C, and 1100 °C. Figure 5 shows the creep curves for the three orientations and their corresponding fitted curves at 850 °C. Under the same stress, the creep life is [001] > [111] > [011]. The experimental curves for each orientation exhibit the classic three-stage creep curve, and the overall fitting results are satisfactory. Specifically, for the [001] orientation, the fitting results for all stresses are satisfactory, with a high degree of fitting for all three stages. For the [011] orientation, the fitting for the secondary stage at 660 MPa is poor, mainly due to the rapid transition between the primary and secondary stages. To ensure the accuracy of the life approximation and overall curve fitting, there are deviations at the transition between the primary and secondary stages, as well as in the secondary stage. For the [111] orientation, the primary stage is relatively short for all stresses, resulting in poorer fitting for the primary stage and the transition between the primary and secondary stages. Figure 6 shows the creep curves for the three orientations and their corresponding fitted curves at 980 °C. Under the same stress, the creep life is [111] > [001] > [011]. The experimental curves for each orientation differ, but the overall fitting results are acceptable. Specifically, for the [001] orientation, after repeated checks, the primary stage of the experimental curve could not be identified, so fitting started directly from the secondary stage, and the parameters for the primary stage were assigned the same relatively large values. The fitting results for the secondary and tertiary stages at all stresses are satisfactory, but some lag is observed at the transition between the secondary and tertiary stages. For the [011] orientation, the experimental curves at 340 MPa and 360 MPa are well fitted, but at 300 MPa, the primary stage is too high, causing a deviation at the transition between the primary and secondary stages. For the [111] orientation, the fitting results for all stresses are satisfactory, with a high degree of fitting for all three stages. Figure 7 shows the creep curves for the three orientations and their corresponding fitted curves at 1100 °C. Under the same stress, the creep life is [111] > [001] > [011]. Each orientation exhibits the classic three-stage creep curve, and the overall fitting results are satisfactory. Specifically, for the [001] orientation, the fitting results for all stresses are satisfactory, with a high degree of fitting for all three stages. For the [011] orientation, the fitting results for all stresses are also satisfactory, with a high degree of fitting for all three stages. For the [111] orientation, the fitting curves for all stresses show a high degree of fitting in the primary and secondary stages, but some lag is observed at the transition between the secondary and tertiary stages. Overall, this model provides satisfactory predictions for the creep curves of SX superalloys under different temperatures and stresses for the three orientation models. It is capable of fitting the classic three-stage creep curves as well as some curves with missing data. While emphasizing the accuracy of life approximation, the model ensures that the overall curve is as close as possible. However, some lag phenomena may occur at the transition between the primary and secondary stages or between the secondary and tertiary stages.

4.3. Model Parameter Analysis

The functions of each parameter and their approximate determination methods are explained in Section 4.1.2. However, it should be emphasized once again that the methods provided in Section 4.1.2 can only offer approximate values near the true parameter space. In the validation process, the parameters n and ε ˙ 0 were kept nearly constant, and the influence of ζ was already studied in Bonora’s nonlinear damage theory [53,54,55,56]. Therefore, this section will primarily focus on analyzing the influence of the key third-category parameters λ , t 0 , and d r of the constitutive model on the experimental creep curves.
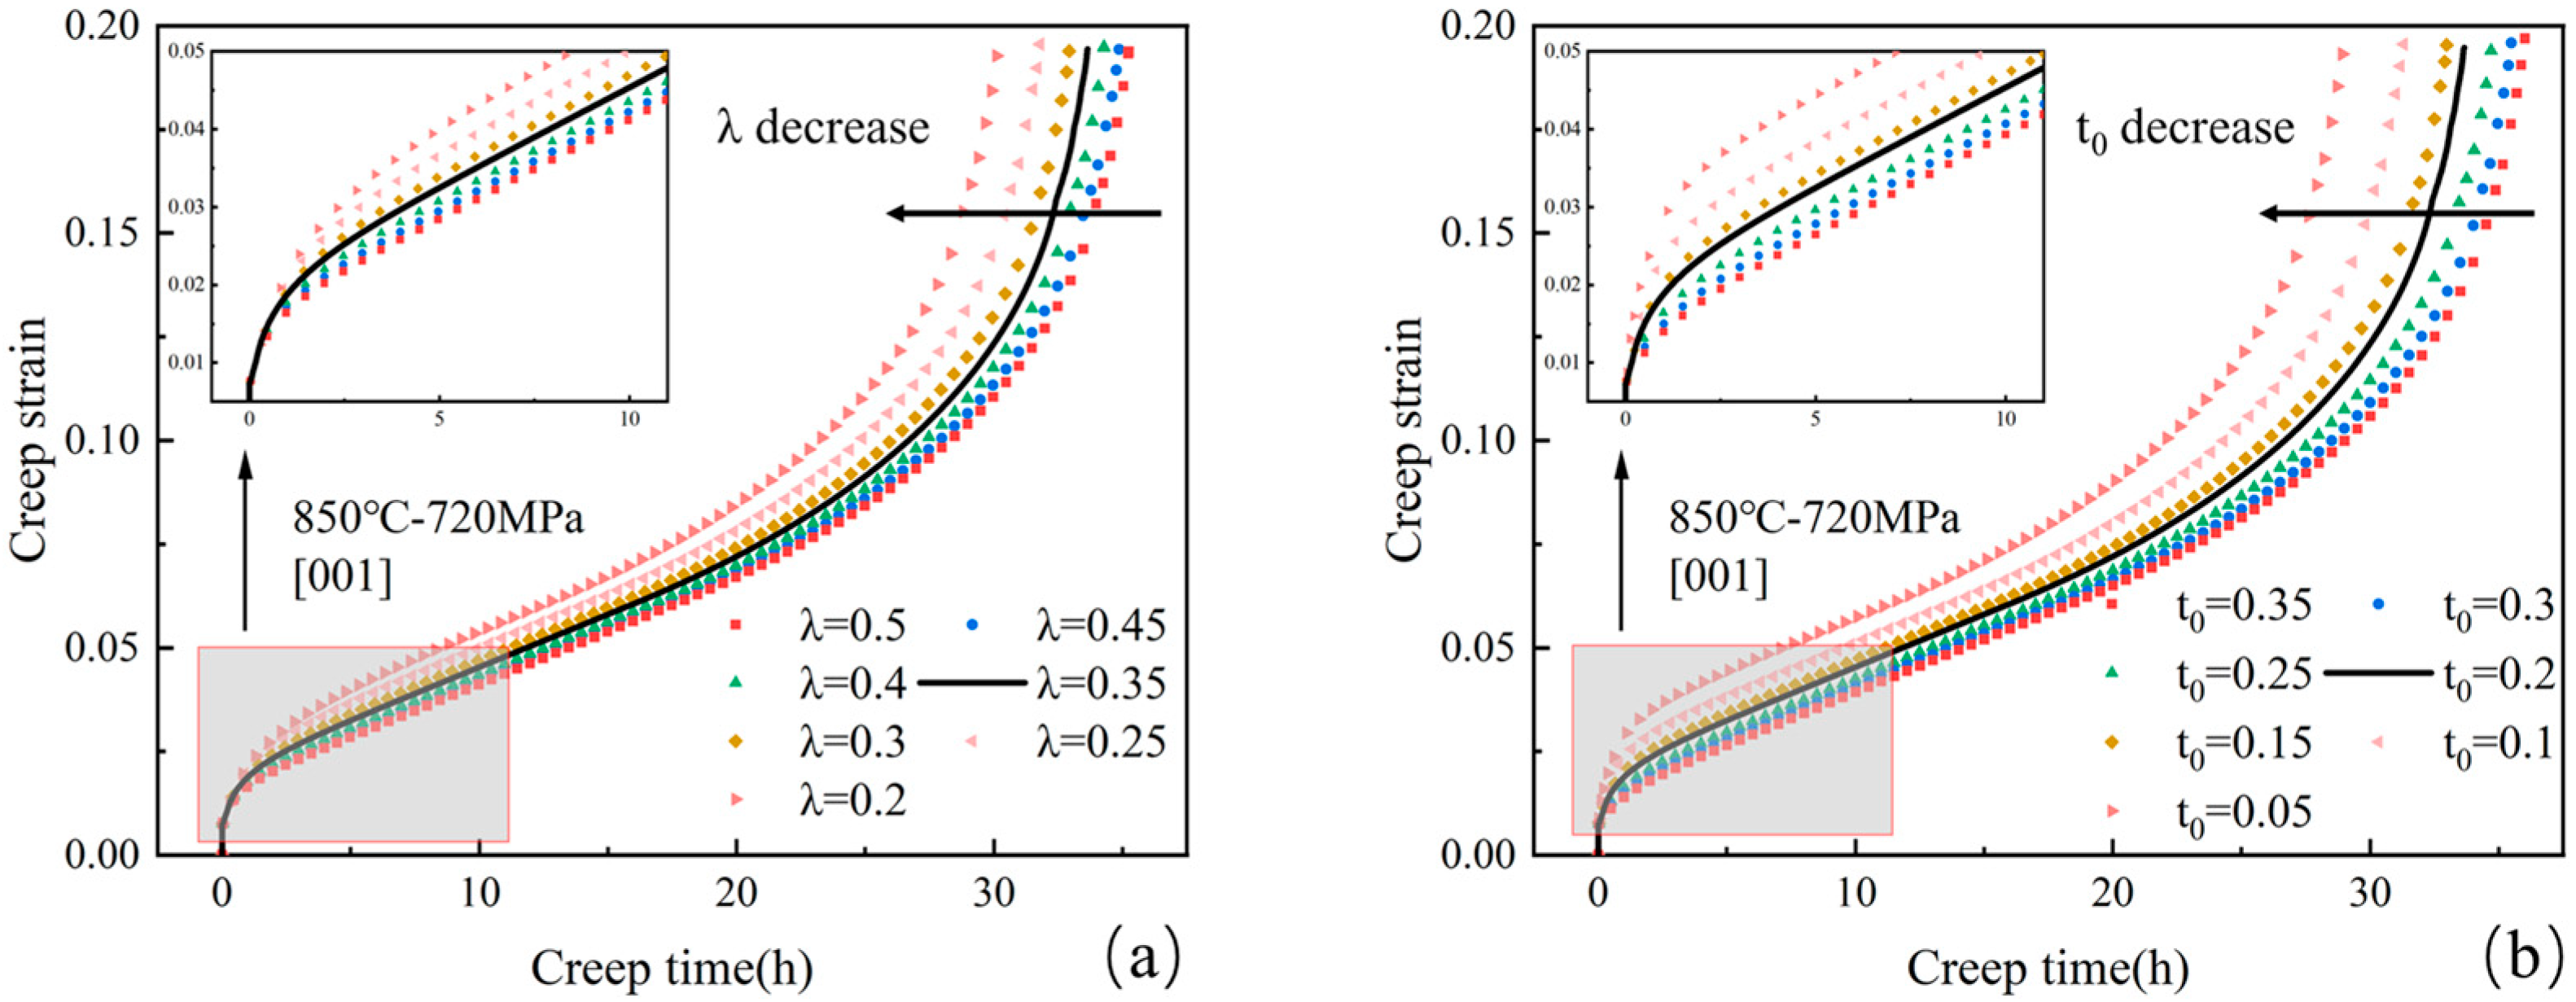
The parameters λ and t 0 primarily affect the primary stage of the creep curve, which corresponds to the period before damage begins. When λ t + t 0 becomes sufficiently large, c o t h θ approaches one. Consequently, variations in the values of λ or t0 can substantially influence the shape of the primary creep stage, thereby affecting the transition into the secondary stage, as well as the time to failure and the accumulated strain at the end of the tertiary stage. The parameter λ primarily governs the temporal extent of the primary creep stage, with larger values facilitating an earlier transition into the secondary regime, thereby narrowing the primary segment of the curve. In contrast, the parameter t 0 regulates the initial creep rate; smaller values yield higher initial rates, resulting in a delayed transition and increased strain accumulation during the primary stage. When the test conditions are set to 850–720 MPa–[001] orientation, the effects of variations in the parameters λ and t 0 on the creep curve are shown in the figure. As seen in Figure 8a, the initial portion of the primary stage of the creep curve largely coincides. As λ decreases, the time for the experimental curve to enter the secondary stage is extended, and the strain increases. This leads reaching the damage initiation value ε a n , e q i n , t h more quickly, leading to earlier failure during the final stage of creep. As seen in the Figure 8b, the time for the creep curve to transition from the primary stage to the secondary stage remains roughly the same. As t 0 decreases, the initial creep rate increases, which results in a larger strain when the experimental curve enters the secondary stage. This leads to reaching the damage initiation value ε a n , e q i n , t h more quickly, thereby shortening the life at the end of the tertiary stage of creep. Notably, slight changes in a small t 0 value can greatly affect the experimental curve.
In this study, the parameter d r plays a crucial role in creep behavior analysis, serving as a key factor in controlling the secondary and tertiary stages of the creep curve. Before damage initiation, d r determines the slope of the secondary stage. After damage initiation, as damage progresses, the equivalent stress σ ~ e q a n increases continuously, directly leading to an increase in the value of σ ~ e q a n d r σ n . Selecting an appropriate d r influences the progression of both the secondary and tertiary stages of the creep curve. In Section 4.2 of this study, we investigated the prediction of creep curves for SX superalloys under various temperature and stress conditions for different orientation models, utilizing appropriate d r values accordingly, as shown in Figure 9. The results in Figure 9a–c clearly demonstrate a consistent pattern across different temperatures and orientations: the experimental stress and d r exhibit a linear relationship, with d r always being greater than the experimental stress.
Additionally, it can be observed that as the experimental stress increases, d r tends to decrease. This trend is attributed to the fact that a higher experimental stress leads to a greater steady-state creep rate in the secondary stage. Furthermore, when the experimental stress increases across all three temperature conditions, the rate of decrease in d r varies by orientation: at 850 °C, the decrease is fastest for the [011] orientation; at 980 °C, the [011] and [111] orientations exhibit the same rate of decrease; and at 1100 °C, the decrease is fastest for the [111] orientation, while the [001] orientation consistently shows the slowest decrease across all temperatures. From Figure 9d, it can be observed that as the temperature increases, the distribution of d r becomes more concentrated, and the overall trend shows a decrease. The higher the temperature, the more pronounced the decline in d r . This phenomenon indicates that, in addition to experimental stress, elevated temperatures accelerate material damage progression. This observation highlights the substantial impact of elevated temperatures on the mechanical response of the material, thereby contributing valuable guidance for the refined engineering and deployment of SX superalloys.

4.4. Prediction of Macroscopic Fracture Surface and Microscopic Morphology

The anisotropy of SX materials is reflected in cross-sectional necking after creep fracture. At 980 °C or 1100 °C, the fracture surface shapes of the [001]-, [011]-, and [111]-oriented rod-shaped specimens after creep fracture tend to be square, elliptical, and triangular [58]. The simulated fracture necking contours of SX cylindrical specimens under different orientations, obtained using the novel anisotropic creep constitutive model proposed in this study, are shown in Figure 10(a1–c1) for each orientation. SDV20 represents the equivalent plastic strain. From the figure, it can be observed that for the [001] orientation, the equivalent plastic strain exhibits central symmetry in the plane perpendicular to the stress axis and spreads outward in a square shape, forming a fourfold symmetric quadrilateral. As a result, the necking fracture surface is square and perpendicular to the stress direction. For the [011] orientation, the equivalent plastic strain on the fracture surface perpendicular to the stress axis diffuses from one side to the other, exhibiting a quadrilateral shape with double symmetry. Consequently, the necking fracture surface intersects the stress axis at an angle, appearing elliptical. For the [111] orientation, the equivalent plastic strain exhibits central symmetry in the plane perpendicular to the stress axis and expands outward in a triangular shape, showing threefold symmetry. As a result, the necking fracture surface forms a triangular shape perpendicular to the stress axis. In Figure 10, the subfigures (a2)/(a3)/(b2)/(b3)/(c2)/(c3) for each orientation represent the corresponding real fracture surface morphology. From these images, the following can be observed: For the [001] orientation, the fracture surface contains numerous regular and parallel square-shaped cleavage planes, which are perpendicular to the stress direction. The edges of the cleavage planes exhibit tearing ridges, while the center contains micropores, which serve as the initiation sites for cracks. For the [011] orientation, the fracture surface features cleavage planes and cleavage steps of varying heights. The cleavage steps are relatively smooth, with the upper region displaying densely packed and fine steps, while the lower region has flatter and more widely spaced steps. For the [111] orientation, the fracture surface contains a large number of clearly defined, equilateral triangular cleavage planes. The intersections of these cleavage planes form sharp and parallel edges, creating equilateral triangular voids. As creep progresses, cracks propagate from these voids, forming equilateral triangular cleavage planes that eventually lead to specimen fracture, exhibiting distinct cleavage fracture characteristics. The necking fracture patterns simulated by this model closely align with the experimental observations of creep fracture surfaces. This consistency demonstrates that the newly proposed anisotropic creep constitutive model effectively captures the creep behavior of SX materials with anisotropic properties.
Based on the interfacial energy-driven rafting theory, this study can effectively predict the rafting behavior of different crystallographic orientations under uniaxial stress conditions. To achieve this, an appropriate finite element model was established based on the specimen type used in the experiments. The interfacial energy density raft theory was incorporated into the ABAQUS finite element software subroutine, enabling detailed simulation and analysis of the raft formation under three different orientations. The different orientations of the model were realized through the modeling process. Using this method, we were able to accurately simulate the raft behavior of the material under uniaxial stress and further reveal the influence of different orientations on the raft formation. The simulation results are shown in Figure 11.
The interfacial energy densities for the (001), (010), and (100) planes are set as W 1 , W 2 , and W 3 , respectively, where W 1 is the largest value, W 2 is the intermediate value, and W 3 is the smallest value. According to the following formula, SDV34 is defined as follows:
S D V 34 = W 1 + W 3 2 W 2
According to the raft formation criterion, when SDV34 < 0, N-type raft formation occurs. When SDV34 > 0, P-type raft formation occurs. When SDV34 ≈ 0 and ( W 1 , W 2 , and W 3 are approximately equal, lamellar raft formation is observed. From Figure 11(a1,a2), it can be observed that the [001]-oriented specimen exhibits an “N”-type raft formation structure perpendicular to the stress axis. The simulation result shows SDV34 < 0, which is consistent with the experimental result. From Figure 11(b1,b2), it can be seen that the [011]-oriented specimen exhibits a bi-directional “P”-type raft formation structure at 45° and 135° angles relative to the stress axis. The simulation result shows SDV34 > 0, which is consistent with the experimental result. From Figure 11(c1,c2), it can be observed that the [111]-oriented specimen exhibits little change compared to the original morphology, with a lamellar raft formation structure in multiple directions relative to the stress axis. The simulation result shows SDV34 ≈ 0, with W 1 , W 2 , and W 3 being approximately equal, which is consistent with the experimental result.
Through the analysis of these finite element simulation results for the three orientations, it is found that they are consistent with the raft formation structures obtained in the creep tests. This indicates that the raft formation model based on interfacial energy density can effectively predict the raft formation modes of differently oriented SX superalloys at high temperatures. The consistency between the simulated and experimental deformation modes indicates that the model based on the interfacial energy density theory possesses good physical credibility.

4.5. Life Prediction of the [001] Orientation at 850 °C Under Different Stress Conditions

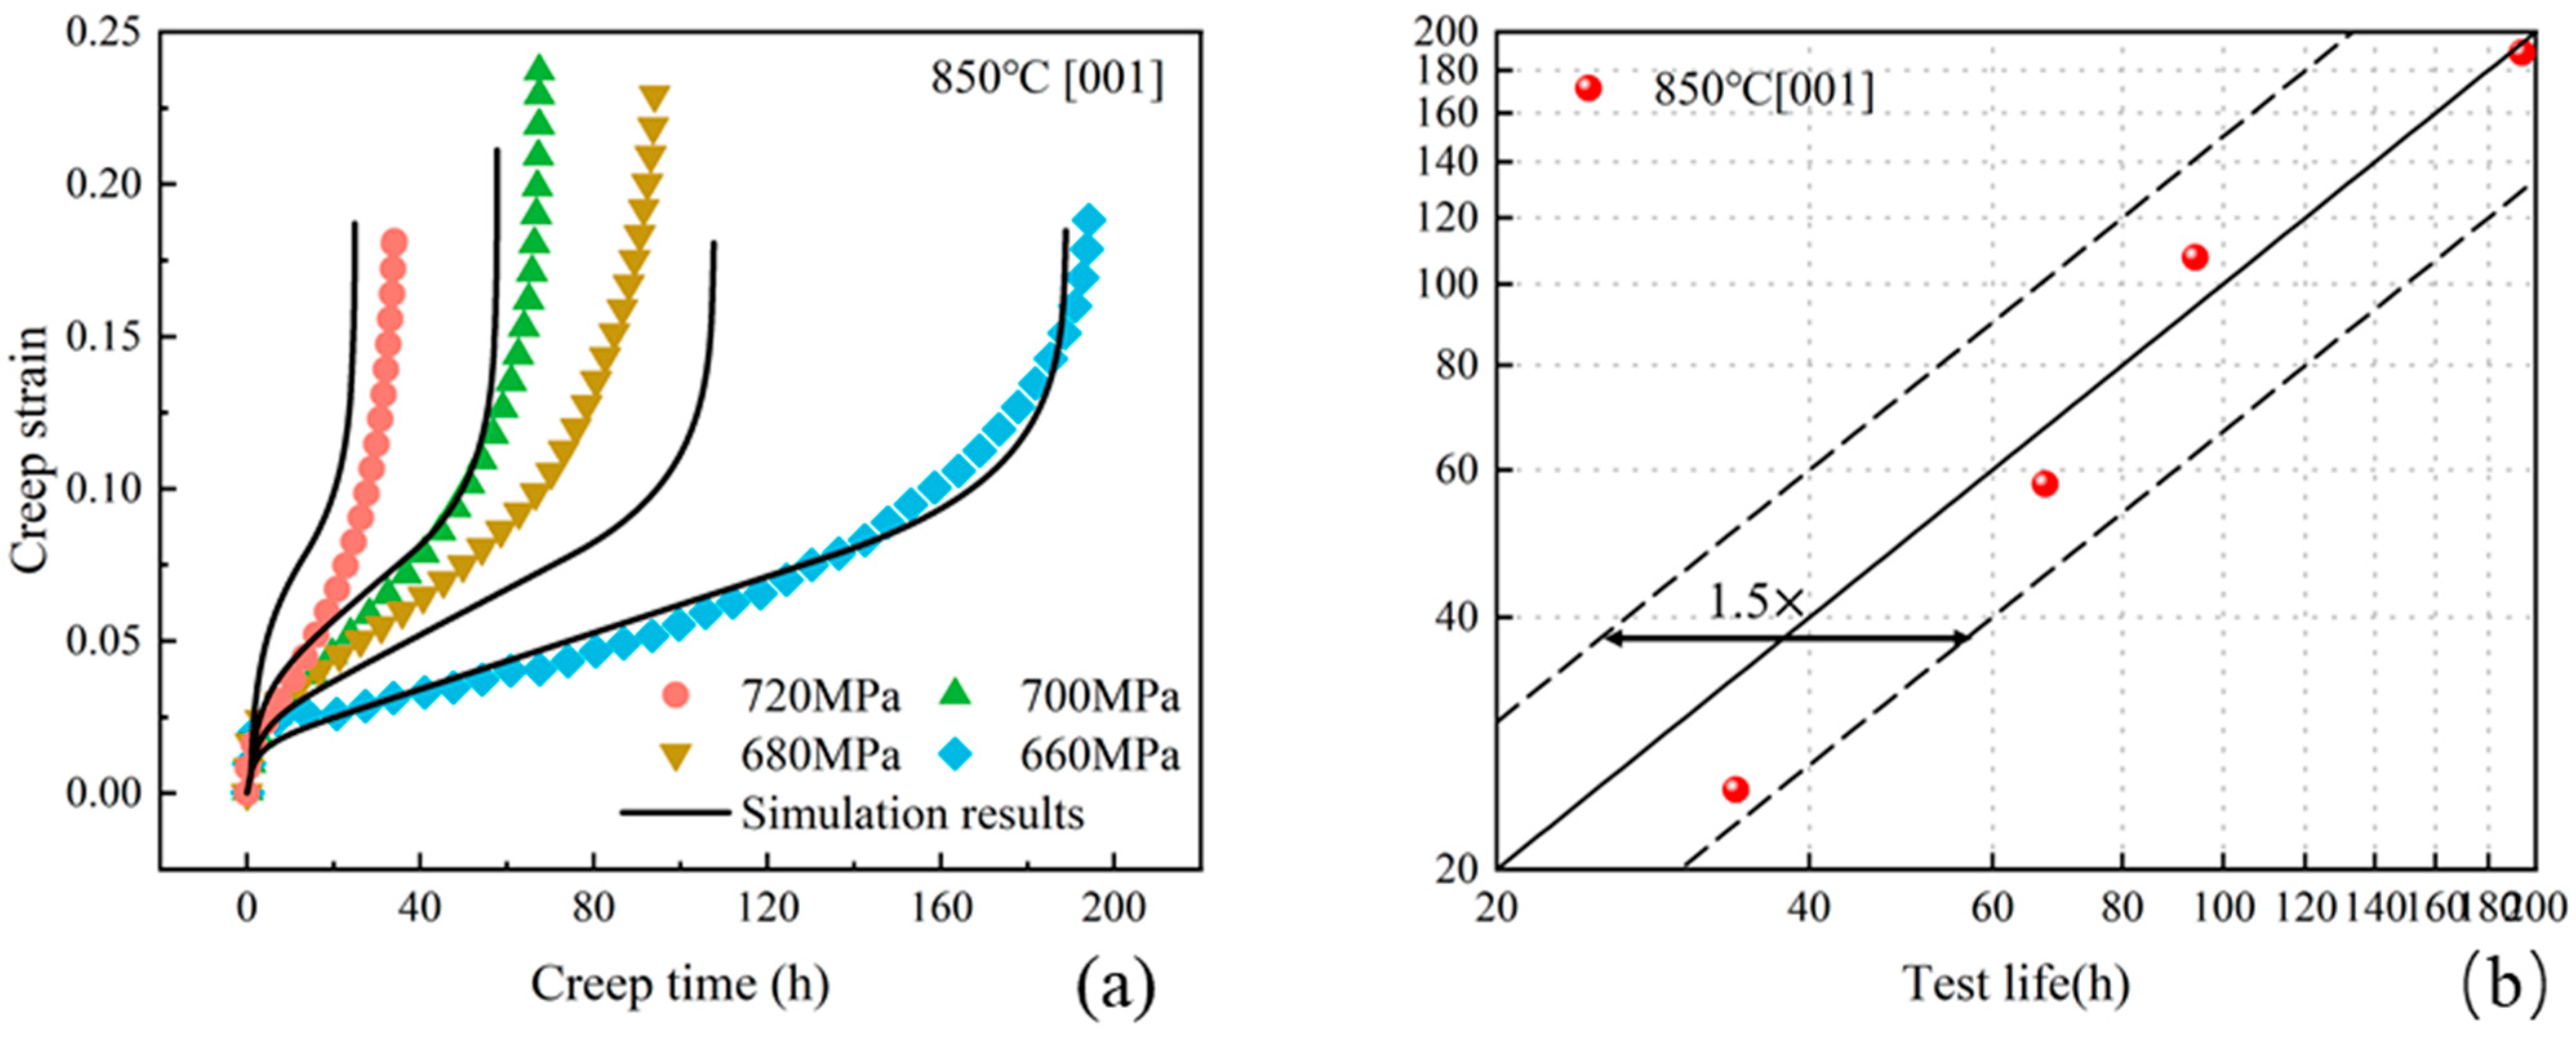
Finite element simulations for the [001] crystallographic orientation at 850 °C were conducted using the approach outlined in Section 4.1.2, employing creep curve data obtained under various stress conditions. To maintain consistency with the experimental loading protocol, the finite element simulation was segmented into two sequential phases: an initial monotonic loading phase (Step 1), succeeded by a creep holding phase (Step 2). The calibrated parameters are provided in Table 1, while the corresponding creep curve fitting results are illustrated in Figure 12a. Experimental lifetimes along with predicted values are compiled in Table 2, with their comparison depicted in Figure 12b.
Figure 12a presents the fitted creep curves for the [001] orientation at 850 °C under varying stress conditions. When the stress is 720 MPa, the fitted curve exhibits a higher and larger proportion in the primary stage compared to the experimental curve, while the tertiary stage proportion is smaller. However, the slope of the secondary stage, the maximum strain, and the predicted life are close to the experimental values. When the stress is 700 MPa, the fitted curve shows a slightly elevated primary stage and a smaller proportion in the secondary stage, causing the tertiary stage to start earlier. The maximum strain is slightly lower than the experimental value, but the predicted life remains close to the experimental value. When the stress is 680 MPa, the fitted curve is generally below the experimental curve, and the predicted life exceeds the experimental life, resulting in a slightly larger deviation. This discrepancy may be attributed to the inherent instability of the experimental curve itself. When the stress is 660 MPa, the fitted curve aligns well with the experimental curve, with only a slight lag at the transition between the secondary and tertiary stages. The maximum strain and predicted life are also close to the experimental values. A comparison between experimental and predicted lifetimes is provided in Table 2 and illustrated in Figure 12b. The predicted life under different stress conditions closely match the experimental results, all within a 1.5-fold error range. The maximum prediction error is 26.8% at 720 MPa, while the minimum error is 2.7% at 660 MPa, with an average error of 14.6%.
As this section utilizes the simplified and efficient method introduced in the present study, the primary aim is to verify the feasibility of the proposed approach. The relatively larger error in short-term creep and smaller error in long-term creep can be attributed to the influence of experimental uncertainties and the use of averaged parameters for the primary and tertiary creep stages under various conditions. As a result, the absolute difference between the predicted and experimental lifetimes under different stress levels is approximately 9 h, whereas the experimental lifetimes themselves vary significantly across conditions, leading to the observed discrepancies.
In future studies, extrapolation can be performed based on short-term creep parameters. For example, the primary and tertiary stage parameters determined under 720 MPa and 700 MPa can be used to predict the behavior at 680 MPa and 660 MPa. Alternatively, algorithm optimization can be applied to increase the weighting of short-term creep parameters, thereby improving prediction accuracy across all conditions.
In summary, the creep prediction for the [001] orientation at 850 °C is satisfactory, effectively capturing the curves of all three creep stages. The simulated maximum strain and predicted lifetime show strong consistency with the experimental measurements.

5. Conclusions

A constitutive model incorporating damage coupling to characterize the anisotropic failure behavior of SX superalloys across different temperatures was formulated and realized through a user-defined material subroutine (UMAT) within ABAQUS. The model incorporates creep rate, anisotropic damage evolution, and microstructural features, enabling accurate prediction of three-stage creep curves, macroscopic fracture morphology, and microstructural rafting evolution under various orientations, temperatures, and stress levels. Through parameter sensitivity analysis and finite element simulations, the model’s capability for predicting stress distribution, creep life, and microstructural evolution was further validated. Simulation results showed good agreement with experimental data, with all predictions falling within a 1.5× error band and an average deviation of 14.6%, demonstrating strong potential for practical engineering applications.
Future work will focus on enhancing the model’s accuracy and parameter identification efficiency via multi-objective optimization algorithms. Additionally, integrating the model with acoustic emission techniques will be explored to enable real-time damage assessment and life prediction of high-temperature components in engineering applications.

Author Contributions

R.C.: conceptualization, writing—reviewing and editing. J.D.: data curation and writing—original draft. S.G.: data curation, funding acquisition, methodology. L.Y.: project administration. L.L.: resources and funding acquisition. J.W.: methodology, writing—reviewing and editing. All authors have read and agreed to the published version of the manuscript.

Funding

This research was funded by the Natural Science Basic Research Plan in Shaanxi Province of China (grant number 2025JC-YBQN-032) and the State Key Laboratory of Clean and Efficient Turbomachinery Power Equipment (grant num-ber DEC8300CG202425595A1228226).

Data Availability Statement

Dataset available on request from the authors.

Acknowledgments

This work was supported by the Natural Science Basic Research Plan in Shaanxi Province of China (2025JC-YBQN-032) and the State Key Laboratory of Clean and Efficient Turbomachinery Power Equipment under DEC8300CG202425595A1228226.

Conflicts of Interest

The authors declare that they have no known competing financial interests or personal relationships that could have appeared to influence the work reported in this paper.

Appendix A

It should be noted in Table A1 that in order to reduce the fitting workload during the validation process, the value of n was uniformly set to 6, and ε ˙ 0 was set to 0.1 for all cases except for the [001] orientation at 850 °C. The parameter values listed in Table A are used solely for the purpose of verifying the feasibility of the model.
Table A1. Parameter summary used for the feasibility validation of the constitutive model.
Temperature/°COrientationStress/MPa λ t 0 ε ˙ 0 d r n ζ ε a n , e q i n , t h ε a n , e q i n , c r
850[001]7200.350.20.02100060.20.0650.26
7000.270.0150.02105060.170.10.26
6800.20.00050.02110060.160.10.26
6600.120.0020.02115060.120.120.26
[011]70080.00440.175060.310.060.26
68040.0090.187060.150.040.24
6601.30.010.199060.180.090.23
[111]70020.140.0490060.10.20.3
6800.250.30.0495060.10.150.33
6600.0350.350.04100060.10.170.33
980[001]4001200.190060.30.0060.23
3601200.192060.350.0040.26
3401200.193060.380.0040.25
3201200.194060.40.0030.29
3001200.195060.420.0020.29
2801200.196060.420.0020.3
[011]3600.070.00090.195060.60.0360.11
3400.040.00010.1101060.60.0450.15
3000.0050.000170.1113060.610.0660.2
[111]3600.220.0010.180060.140.060.31
3400.0570.0030.186060.220.0440.35
3000.010.0040.198060.590.0510.3
1100[001]1900.180.0010.142060.360.0450.23
1700.070.00070.143460.50.0480.23
1600.0340.0010.144160.420.0550.24
1400.010.0010.145560.280.0520.26
[011]1700.090.00090.145060.90.0350.18
1600.0320.00080.147060.880.0450.15
1400.0060.00070.151060.870.0650.16
[111]1700.0430.00130.148060.40.030.24
1600.020.00120.151060.50.0340.27
1400.0030.00110.157060.50.0410.28

References

  1. Wang, J.; Lu, H.; Wen, Z.; Lian, Y.; Wang, Y.; Yue, Z. Crystal plasticity theory coupled with meso-damage to predict the ratchetting behavior of nickel-based single crystal superalloy. Int. J. Fatigue 2022, 165, 107220. [Google Scholar] [CrossRef]
  2. Wang, J.; Liu, T.; Yang, L.; Wen, Z.; Yue, Z.; Mao, Q. Stress redistribution and stress triaxiality effect on the fatigue life of notched Ni-based single crystal superalloy at 760 °C. Theor. Appl. Fract. Mech. 2024, 131, 104380. [Google Scholar] [CrossRef]
  3. Tu, Y.; Wang, J.; Wen, Z.; He, P. Thermomechanical fatigue behavior and lifetime prediction of nickel-based single crystal alloys under varying stress conditions. J. Alloys Compd. 2025, 1023, 180202. [Google Scholar] [CrossRef]
  4. Wang, J.; Xu, X.; Lu, H.; Zhang, L.; Lian, Y.; Wen, Z.; Yue, Z. Fatigue notch strengthening effect of nickel-based single crystal superalloys under different stress ratios. Eur. J. Mech.-A/Solids 2025, 109, 105471. [Google Scholar] [CrossRef]
  5. Choi, Y.S.; Parthasarathy, T.A.; Woodward, C.; Dimiduk, D.M.; Uchic, M.D. Constitutive Model for Anisotropic Creep Behaviors of Single-Crystal Ni-Base Superalloys in the Low-Temperature, High-Stress Regime. Metall. Mater. Trans. A 2012, 43, 1861–1869. [Google Scholar] [CrossRef]
  6. Nörtershäuser, P.; Frenzel, J.; Ludwig, A.; Neuking, K.; Eggeler, G. The effect of cast microstructure and crystallography on rafting, dislocation plasticity and creep anisotropy of single crystal Ni-base superalloys. Mater. Sci. Eng. A 2015, 626, 305–312. [Google Scholar] [CrossRef]
  7. Leverant, G.R.; Kear, B.H.; Oblak, J.M. Creep of precipitation-hardened nickel-base alloy single crystals at high temperatures. Metall. Trans. 1973, 4, 355–362. [Google Scholar] [CrossRef]
  8. Kear, B.H.; Oblak, J.M. Deformation Modes γ’ Precipitation Hardened Nickel-Base Alloys. J. Phys. Colloq. 1974, 35, C7-35–C7-45. [Google Scholar] [CrossRef]
  9. Yang, Q.; Ghosh, S. A crystal plasticity model for porous HCP crystals in titanium alloys under multiaxial loading conditions. Int. J. Solids Struct. 2022, 238, 111400. [Google Scholar] [CrossRef]
  10. Guo, H.-J.; Ling, C.; Busso, E.P.; Zhong, Z.; Li, D.-F. Crystal plasticity based investigation of micro-void evolution under multi-axial loading conditions. Int. J. Plast. 2020, 129, 102673. [Google Scholar] [CrossRef]
  11. Yu, Q.M.; Wang, Y.; Wen, Z.X.; Yue, Z.F. Notch effect and its mechanism during creep rupture of nickel-base single crystal superalloys. Mater. Sci. Eng. A 2009, 520, 1–10. [Google Scholar] [CrossRef]
  12. Lemaitre, J.; Plumtree, A. Application of damage concepts to predict creep-fatigue failures. J. Eng. Mater. Technol. 1979, 101, 284–292. [Google Scholar] [CrossRef]
  13. Lemaitre, J. How to use damage mechanics. Nucl. Eng. Des. 1984, 80, 233–245. [Google Scholar] [CrossRef]
  14. Guo, Z.; Song, Z.; Liu, H.; Hu, D.; Huang, D.; Yan, X.; Yan, W. A dislocation-based damage-coupled constitutive model for single crystal superalloy: Unveiling the effect of secondary orientation on creep life of circular hole. Int. J. Plast. 2024, 173, 103874. [Google Scholar] [CrossRef]
  15. Li, Z.; Wen, Z.; Pei, H.; Yue, X.; Wang, P.; Ai, C.; Yue, Z. Creep life prediction for a nickel-based single crystal turbine blade. Mech. Adv. Mater. Struct. 2022, 29, 6039–6052. [Google Scholar] [CrossRef]
  16. Chaudhary, S.; Guruprasad, P.J.; Patra, A. Crystal plasticity constitutive modeling of tensile, creep and cyclic deformation in single crystal Ni-based superalloys. Mech. Mater. 2022, 174, 104474. [Google Scholar] [CrossRef]
  17. Kasar, Ç.; Kaftancıoglu, U.; Bayraktar, E.; Aslan, O. Lifetime Prediction of Single Crystal Nickel-based Superalloys. Appl. Sci. 2024, 15, 201. [Google Scholar] [CrossRef]
  18. Zhang, J.; Liu, Y.; Cheng, Y.; Wang, H.; Sha, A.; Duan, H. Modeling of creep in nickel-based superalloy based on microtwinning mechanism. Int. J. Plast. 2024, 174, 103916. [Google Scholar] [CrossRef]
  19. Gu, S.; Gao, H.; Wen, Z.; Li, Z.; Zhang, C.; Yue, Z. Creep properties and life model of anisotropic Ni-based single crystal superalloys over a wide temperature range. Int. J. Mech. Sci. 2024, 261, 108674. [Google Scholar] [CrossRef]
  20. Kachanov, L.M. Time of the Rupture Process Under Creep Conditions; Izy Akad; Izvestiia Akademii Nauk SSSR; Otdelenie Teckhnicheskikh Nauk: Moscow, Russia, 1958; Volume 8. [Google Scholar]
  21. Hyde, T.H.; Xia, L.; Becker, A.A. Prediction of creep failure in aeroengine materials under multi-axial stress states. Int. J. Mech. Sci. 1996, 38, 385–403. [Google Scholar] [CrossRef]
  22. Jiang, J.; Wang, W.; Zhao, N.; Wang, P.; Liu, Y.; Jiang, P. Application of a creep-damage constitutive model for the rotor of a 1000 MW ultrasupercritical steam turbine. J. Eng. Gas Turbines Power 2015, 138, 022606. [Google Scholar] [CrossRef]
  23. Luo, Y.; Jiang, W.; Zhang, Y.; Zhou, F.; Tu, S.-T. A new damage evolution model to estimate the creep fracture behavior of brazed joint under multiaxial stress. Int. J. Mech. Sci. 2018, 149, 178–189. [Google Scholar] [CrossRef]
  24. Wang, W.; Buhl, P.; Klenk, A.; Liu, Y. Influence of high-temperature dwell time on creep-fatigue behavior in a 1000 MW steam turbine rotor. Eng. Fract. Mech. 2016, 166, 1–22. [Google Scholar] [CrossRef]
  25. Yuan, B.; Liang, J.; Huang, X.; Huang, Q.; Zhang, B.; Yang, G.; Wang, Y.; Yuan, J.; Wang, H.; Yuan, P. Eco-efficient recycling of engineering muck for manufacturing low-carbon geopolymers assessed through LCA: Exploring the impact of synthesis conditions on performance. Acta Geotech. 2024. [Google Scholar] [CrossRef]
  26. Yuan, B.; Liang, J.; Lin, H.; Wang, W.; Xiao, Y. Experimental Study on Influencing Factors Associated with a New Tunnel Waterproofing for Improved Impermeability. J. Test. Eval. 2024, 52, 20. [Google Scholar] [CrossRef]
  27. Yuan, B.; Chen, W.; Li, Z.; Zhao, J.; Luo, Q.; Chen, W.; Chen, T. Sustainability of the polymer SH reinforced recycled granite residual soil: Properties, physicochemical mechanism, and applications. J. Soils Sediments 2023, 23, 246–262. [Google Scholar] [CrossRef]
  28. Lemaitre, J. A Course on Damage Mechanics; Springer: Berlin/Heidelberg, Germany, 1996. [Google Scholar] [CrossRef]
  29. Becker, A.A.; Hyde, T.H.; Sun, W.; Andersson, P. Benchmarks for finite element analysis of creep continuum damage mechanics. Comput. Mater. Sci. 2002, 25, 34–41. [Google Scholar] [CrossRef]
  30. Hayhurst, R.J.; Mustata, R.; Hayhurst, D.R. Creep constitutive equations for parent, type IV, R-HAZ, CG-HAZ and weld material in the range 565–640 °C for Cr–Mo–V weldments. Int. J. Press. Vessels Pip. 2005, 82, 137–144. [Google Scholar] [CrossRef]
  31. Hayhurst, D.R.; Goodall, I.W.; Hayhurst, R.J.; Dean, D.W. Lifetime predictions for high-temperature low-alloy ferritic steel weldments. J. Strain Anal. Eng. Des. 2005, 40, 675–701. [Google Scholar] [CrossRef]
  32. Nikbin, K. A unified multiscale ductility exhaustion based approach to predict uniaxial, multiaxial creep rupture and crack growth. Eng. Fract. Mech. 2017, 179, 240–259. [Google Scholar] [CrossRef]
  33. Ma, H.S.; Wang, G.Z.; Liu, S.; Tu, S.T.; Xuan, F.Z. Unified constraint parameter solutions for axial and circumferential surface cracks in pressurized pipes under creep condition. Eng. Fract. Mech. 2018, 189, 307–329. [Google Scholar] [CrossRef]
  34. Xiong, J.J.; Shenoi, R.A. A two-stage theory on fatigue damage and life prediction of composites. Compos. Sci. Technol. 2004, 64, 1331–1343. [Google Scholar] [CrossRef]
  35. Dattoma, V.; Giancane, S.; Nobile, R.; Panella, F. Fatigue life prediction under variable loading based on a new non-linear continuum damage mechanics model. Int. J. Fatigue 2006, 28, 89–95. [Google Scholar] [CrossRef]
  36. Correia, J.A.F.O.; Raposo, P.; Muniz-Calvente, M.; Blasón, S.; Lesiuk, G.; De Jesus, A.M.P.; Moreira, P.M.G.P.; Calçada, R.A.B.; Canteli, A.F. A generalization of the fatigue kohout-věchet model for several fatigue damage parameters. Eng. Fract. Mech. 2017, 185, 284–300. [Google Scholar] [CrossRef]
  37. Fazlali, B.; Mohammadi, B. A microscale energy-based fatigue damage model for unidirectional composites under multiaxial loading at different stress ratios. Eng. Fract. Mech. 2019, 205, 120–135. [Google Scholar] [CrossRef]
  38. Kumar, J.; Venugopal Rao, A.; Ganesh Sundara Raman, S.; Kumar, V. Creep-fatigue damage simulation at multiple length scales for an aeroengine titanium alloy. Int. J. Fatigue 2018, 116, 505–512. [Google Scholar] [CrossRef]
  39. JianPing, J.; Guang, M.; Yi, S.; SongBo, X. An effective continuum damage mechanics model for creep–fatigue life assessment of a steam turbine rotor. Int. J. Press. Vessels Pip. 2003, 80, 389–396. [Google Scholar] [CrossRef]
  40. Wang, R.-Z.; Zhu, S.-P.; Wang, J.; Zhang, X.-C.; Tu, S.-T.; Zhang, C.-C. High temperature fatigue and creep-fatigue behaviors in a Ni-based superalloy: Damage mechanisms and life assessment. Int. J. Fatigue 2019, 118, 8–21. [Google Scholar] [CrossRef]
  41. Wu, J.Y.; Li, J.; Faria, R. An energy release rate-based plastic-damage model for concrete. Int. J. Solids Struct. 2006, 43, 583–612. [Google Scholar] [CrossRef]
  42. Pirondi, A.; Bonora, N.; Steglich, D.; Brocks, W.; Hellmann, D. Simulation of failure under cyclic plastic loading by damage models. Int. J. Plast. 2006, 22, 2146–2170. [Google Scholar] [CrossRef]
  43. Kuna-Ciskał, H.; Skrzypek, J.J. CDM based modelling of damage and fracture mechanisms in concrete under tension and compression. Eng. Fract. Mech. 2004, 71, 681–698. [Google Scholar] [CrossRef]
  44. Kaji, Y.; Gu, W.; Ishihara, M.; Arai, T.; Nakamura, H. Development of structural analysis program for non-linear elasticity by continuum damage mechanics. Nucl. Eng. Des. 2001, 206, 1–12. [Google Scholar] [CrossRef]
  45. Jin, Z.; Liu, C.; Cao, Y.; Lu, Y.; Pan, W.; Ji, D. Research on creep damage model of T91/TP347H dissimilar steel welded joints under overheating condition. Press. Vessel Technol. 2021, 38, 18–26. [Google Scholar]
  46. Zhang, D.; Lv, M.; Wen, Z. A unified creep life prediction method and fracture mechanism of high-temperature alloys under multiaxial stress. Eng. Fail. Anal. 2023, 149, 107262. [Google Scholar] [CrossRef]
  47. Ragab, R.; Parker, J.; Li, M.; Liu, T.; Sun, W. Creep crack growth modelling of Grade 91 vessel weldments using a modified ductility based damage model. Eur. J. Mech.-A/Solids 2022, 91, 104424. [Google Scholar] [CrossRef]
  48. Alang, N.A.; Nikbin, K. An analytical and numerical approach to multiscale ductility constraint based model to predict uniaxial/multiaxial creep rupture and cracking rates. Int. J. Mech. Sci. 2018, 135, 342–352. [Google Scholar] [CrossRef]
  49. Alang, N.A.; Nikbin, K. A new approach to predict creep rupture of Grade 92 steel under multiaxial stress states. Int. J. Mech. Sci. 2019, 163, 105096. [Google Scholar] [CrossRef]
  50. Luo, Y.; Zhang, Q.; Jiang, W.; Zhang, W.; Xu, S.; Hao, M. Creep failure prediction of brazing joints with double notches. Mater. Des. 2016, 100, 271–279. [Google Scholar] [CrossRef]
  51. Shigeyama, H.; Takahashi, Y.; Parker, J. Prediction of Creep Life on Notched Bar Specimens of Grade 92 Steel. In Volume 5: High-Pressure Technology, Proceedings of the Rudy Scavuzzo Student Paper Symposium and 24th Annual Student Paper Competition, ASME Nondestructive Evaluation, Diagnosis and Prognosis Division (NDPD), Electric Power Research Institute (EPRI) Creep Fatigue Workshop, Vancouver, BC, Canada, 17–21 July 2016; American Society of Mechanical Engineers: Vancouver, BC, Canada, 2016; p. V005T12A005. [Google Scholar]
  52. Boehler, J.P.; Sawczuk, A. Application of representation theorems to describe yielding of transversely isotropic solids. Mech. Res. Commun. 1976, 3, 277–283. [Google Scholar] [CrossRef]
  53. Bonora, N. A nonlinear CDM model for ductile failure. Eng. Fract. Mech. 1997, 58, 11–28. [Google Scholar] [CrossRef]
  54. Bonora, N.; Gentile, D.; Pirondi, A. Identification of the parameters of a non-linear continuum damage mechanics model for ductile failure in metals. J. Strain Anal. Eng. Des. 2004, 39, 639–651. [Google Scholar] [CrossRef]
  55. Bonora, N.; Gentile, D.; Pirondi, A.; Newaz, G. Ductile damage evolution under triaxial state of stress: Theory and experiments. Int. J. Plast. 2005, 21, 981–1007. [Google Scholar] [CrossRef]
  56. Bonora, N. On the effect of triaxial state of stress on ductility using nonlinear CDM model. Int. J. Fract. 1997, 88, 359–371. [Google Scholar] [CrossRef]
  57. Yue, Z.F.; Lu, Z.Z. Rafting prediction criterion for nickel-base single crvstals under multiaxial stresses and crystallographic orientatione dependence of creep behavior. Acta Met. Sin. 1999, 12, 149–154. [Google Scholar]
  58. Zhang, C.; Wang, P.; Deng, Y.; Wang, X.; Wen, Z.; Lian, Y.; He, P. Influence of crystal orientations on the creep fracture of a nickel-based single crystal superalloy. Int. J. Solids Struct. 2024, 288, 112614. [Google Scholar] [CrossRef]
Figure 1. Microstructure of the original two-phase organization (a) and the actual creep specimen (b).
Modelling 06 00075 g001
Figure 2. Dimensional diagram of the SX cylindrical creep specimen.
Modelling 06 00075 g002
Figure 3. Schematic diagram of the finite element model for the cylindrical specimen.
Modelling 06 00075 g003
Figure 4. Finite element models of cylindrical specimens with three different orientations. (The red arrows indicate the applied load, while the yellow and blue triangles represent the applied constraints).
Modelling 06 00075 g004
Figure 5. Creep life model fitting curves at 850 °C for different orientations: (a) [001], (b) [011], (c) [111].
Modelling 06 00075 g005
Figure 6. Creep life model fitting curves at 980 °C for different orientations: (a) [001], (b) [011], (c) [111].
Modelling 06 00075 g006
Figure 7. Creep life model fitting curves at 1100 °C for different orientations: (a) [001], (b) [011], (c) [111].
Modelling 06 00075 g007
Figure 8. Effect of parameter λ (a) and parameter t 0 (b) on the creep curve at 850 °C–720MPa–[001] orientation.
Modelling 06 00075 g008
Figure 9. Creep stress and d r life model fitting curves under three temperatures and three orientations: (a) 850 °C; (b) 980 °C; (c) 1100 °C; (d) d r distribution under three temperatures and three orientations.
Modelling 06 00075 g009
Figure 10. Simulated images of critical necking fracture surfaces under three orientations (SDV20 represents the equivalent plastic strain). (a1c1) and corresponding real fracture morphologies (a2a3c3) [58].
Modelling 06 00075 g010
Figure 11. Microstructure prediction images of samples under three orientations at 980 °C/340 MPa (SDV34 represents the interfacial energy density difference parameter) (a1c1) and actual evolution images (a2c2).
Modelling 06 00075 g011
Figure 12. (a) Creep curve fitting results for the [001] orientation at 850 °C; (b) comparison between experimental life and predicted life.
Modelling 06 00075 g012
Table 1. Prediction parameters under different stress conditions for the [001] orientation at 850 °C.
Temperature/°COrientation λ t 0 ε ˙ 0 d r n ζ ε a n , e q i n , t h ε a n , e q i n , c r
8500010.090.01370.08900160.150.0870.232
Table 2. Experimental life and predicted life under different stress conditions for the [001] orientation at 850 °C.
Temperature/°COrientationStress/MPa ε ˙ o C Experimental Life/hPredicted Life/hDifference/hError/%
8500017200.0023434.024.99.126.8
7000.001467.457.79.714.4
6800.0010594.0107.613.614.5
6600.00034194.0188.85.22.7
Disclaimer/Publisher’s Note: The statements, opinions and data contained in all publications are solely those of the individual author(s) and contributor(s) and not of MDPI and/or the editor(s). MDPI and/or the editor(s) disclaim responsibility for any injury to people or property resulting from any ideas, methods, instructions or products referred to in the content.