Abstract
The study aims to increase productivity in the cold room door manufacturing industry by addressing non-value-adding operations, identifying bottlenecks, and reducing processing time through digital twin (DT)-based simulation. The goal is to eliminate the need for supply chain outsourcing and increase overall efficiency. The research involves developing a DT of the existing production process for five distinct categories of cold room doors: flush door, single door, double door, face-mounted door, and sliding door. Simulation was used to uncover problems at multiple stations, encompassing curing, welding, and packing. Lean principles were used to identify the causes of inefficiency, and the process was improved using TRIZ principles. These changes produced a 42.90% improvement in productivity, a 20% dependence reduction on outsourcing and an increase of 10.5% added inventory to the shortage demand level. The approach presented is provided for a particular manufacturer of cold room doors, but the methods and techniques used are generally applicable to other manufacturing companies to support systematic innovation. Combining DT simulation, lean techniques and TRIZ principles, this study presents a strong approach to addressing the productivity challenges in manufacturing. The incorporation of these methods has brought considerable operational efficiency and has minimised dependency on external outsourcing.
1. Introduction
A cold room is a large, air-conditioned space carefully designed to maintain precise temperature conditions necessary for preserving various products. Panels, doors, condensers, and evaporators are the four main structural elements; each is essential to its operation. A notable feature of these rooms is that you can change their temperature as needed. Their hermetic sealing serves as an impenetrable barrier, protecting goods being stored from the erratic fluctuations of the outside weather. Moreover, their range of adjustable temperatures goes beyond preservation to function as effective dehumidifiers if dry storage becomes necessary.
The production of cold room doors follows an established sequence developed by the industry. Lean, TRIZ, and simulation are versatile sets of tools and methods for innovation and process improvement, which can be combined with many different tools. Lean manufacturing has emerged as the definitive philosophy for reducing process and supply chain waste, and lean-TRIZ has been used to resolve inventive problems (TRIZ) when processes stagnate [1]. Individually, numerous papers have discussed the implementation of the above concepts. Results from literature research demonstrate that while TRIZ tools have been used in conjunction with other tools for process improvement, most of the research results are not applicable to practice, and case study implementation is sparse [2].
Modern manufacturing is influenced by improved efficiency, customised product offerings, and adaptable modifications to market trends, with the essential need to adhere to sustainable practices. The existing environment has encouraged the use of frameworks like Industry 4.0 to innovate industrial processes through advanced digital technologies like the Internet of Things, Big Data, and cyber–physical systems, ultimately enhancing efficiency and flexibility [3]. The DT plays a crucial role in Industry 4.0, functioning as a digital representation of a physical entity that facilitates a comprehensive understanding, monitoring, and improvement of the entire manufacturing workflow [4].
Yet, the technology-driven orientation of Industry 4.0 has encountered backlash for not properly addressing the concerns of environmental sustainability and human welfare. Considering recent developments, the notion of Industry 5.0 has emerged, expanding upon the technological advancements of Industry 4.0 while shifting focus to a more comprehensive, triple-bottom-line framework that emphasises human-centred strategies, sustainability, and resilience [5]. Within this progressive framework, the intention is not to supplant human labour but to enrich human abilities, encouraging collaborative and adaptive socio-technical systems.
The principles of lean manufacturing, which emphasise waste minimisation and respect for personnel, inherently support the human-focused aims of Industry 5.0, leading to the establishment of “Lean 5.0” [6]. This analysis proposes that the convergence of lean principles for waste elimination, the theory of inventive problem solving (TRIZ) for methodical innovation, and discrete event simulation (DES) for risk-free validation, integrated within a DT framework furnishes an innovative and holistic approach to attaining considerable enhancements in manufacturing performance that resonate with the prevailing paradigm. Although the current scholarship delineates a variety of applications of these concepts separately, there exists a conspicuous shortfall in the practical case study implementations of such integrated frameworks, particularly those utilising data-driven technologies (DTs) for real-time validation in conventional discrete manufacturing sectors.
This study aims to address this using an integrated DT-SimLean-TRIZ framework within a cold room door manufacturing organisation, concentrating on tackling operational problems. The research will explore the following questions:
RQ1: In what ways can a DT-driven simulation model be utilised to identify and quantify critical bottlenecks (curing, welding, packing) in a discrete manufacturing process for cold room doors?
RQ2: How can the fusion of lean root-cause analysis and TRIZ inventive principles, validated within the DT environment, generate and confirm targeted solutions that substantially enhance productivity and minimise makespan?
To develop an understanding of the production line dynamics and identify inefficiencies, a DT of the factory floor was generated. The digital representation mirrors real-time physical operations and is used to simulate various production scenarios. The DT facilitated dynamic evaluation of resource use, bottlenecks, and potential optimisations, serving as a platform through which lean and TRIZ-inspired interventions could be experimented with without disrupting real-life operations. Through the integration of lean, TRIZ, and simulation into a DT, the study offers a practical and real-world solution for addressing significant operating problems. The approach enables experimentation, review, and verification of process optimisation in a risk-free virtual environment, ensuring that only the most effective methodologies are implemented on the shop floor.
The study begins with an introduction to the cold room manufacturing process and establishes the problem statement in Section 1. Section 2 discusses literature related to lean tools and simulation models, critically analysing existing literature and identifying research gaps. Section 3 details the methodology framework and objectives of the study. Section 4 presents the development of a simulation model for cold room manufacturing across five door types, with results analysed using tools such as Pareto charts, cause-and-effect diagrams, 5-whys analysis, and TRIZ. In Section 5, the results are presented and discussed before and after the implementation of lean, focusing on makespan, work-in-progress (WIP), and throughput for each door type. Finally, Section 6 concludes the study.
2. Literature Review
2.1. Application of Lean Tools in Manufacturing
Lean manufacturing, which has its roots in the Toyota production system, is designed to minimise waste while optimising efficiency. It has been widely employed across multiple industries to reduce lead times, operational costs, and improve product quality [7]. In the current competitive global environment, original equipment manufacturers (OEMs) implement lean manufacturing techniques to lower production costs and eliminate waste. Lean principles applied to welding fixtures in the automotive industry have produced significant time and profit savings [8]. This principle is demonstrated with an example of increasing throughput on a gearbox pre-assembly line with lean manufacturing techniques. The study on planet carrier pre-assembly line achieved productivity improvement of 43% in the first phase and reduction of total processing time by 24% during the first phase through the application of value stream mapping and standardisation of work processes, which indicates that the lean practices could enhance efficiency of manufacturing processes accordingly [9]. Saravanan et al. [10] improved the efficiency of the injection moulding shopfloor by lean production methods in which the SMED was utilised to minimise setup time, and the productivity increased significantly by 67.72%. Nallusamy and Majumdar [11] addressed manufacturing problems by combining TPM with lean manufacturing to enhance the efficiency of machine tools. The outcomes indicated that the equipment’s overall efficiency improved 15% due to reduced setup time and operational losses. Kulkarni et al. [12] proposed a hybrid approach to enhance productivity based on work study combined with lean manufacturing. The research has demonstrated, by showing the potential of lean tools in many areas of waste elimination, quality improvement, and organisation, the heavier weights of lean application in technical, engineering, manufacturing, and business domains. Shriram et al. [13] studied productivity improvements in a paper company, using lean principles and integrating IoT techniques for increasing operational efficiency and promoting innovation.
Maia et al. [14] aimed to explore the synergy between lean and TRIZ tools, emphasising their viability. They compare TRIZ and lean production principles, introduce TRIZ tools, and discuss their application in the textile industry. Elyoussoufi et al. [15] designed a holistic framework integrating TRIZ and LSS for organisational improvement, addressing competition challenges and fostering innovation in problem-solving. Anuar et al. [16] introduced a TRIZ-based hybrid machining approach, combining electric discharge machining (EDM) with abrasives to enhance precision in cutting intricate aluminium alloys. Results revealed improved efficiency, tool life, and surface finish. Bassuk and Washington [17] illustrated the application of A3 problem solving reports in a research vivarium at Seattle Children’s, employing continuous performance improvement. Two reports addressed specific issues, demonstrating measurable goals, root cause analyses, and successful outcomes, affirming the efficacy of A3 thinking in problem-solving within the vivarium. Improper maintenance in the production line, resulting in low productivity, was addressed by Johny and Thenarasu [18]. Lean techniques, such as kaizen, kanban, single minute exchange of dies (SMED), and poke-yoke, were implemented to improve production and productivity. LMS tools, including value stream mapping and kaizen, reduced coil expander setup time by 67%, while innovative design changes and process simplifications improved overall efficiency and workplace safety [19]. Enhancing productivity in wire manufacturing involves sustainable value stream mapping, sustainability metrics, life cycle assessment (LCA), and the analytical hierarchy process for improvement strategies [20].
By implementing VSM to identify and eliminate non-value-added time, the manufacturing industry’s productivity was improved through the application of lean principles [21]. Jasiulewicz-Kaczmarek and Saniuk [22] explored the integration of lean thinking and maintenance, emphasising performance indicators. Their study underscored the alignment of maintenance with organisational objectives and the importance of performance measures to evaluate improvements through lean tools. To meet quality and traceability requirements. Neves et al. [23] suggested that companies must adapt to market changes. This study combined plan-do-check-act, 5S (sort, straighten, shine, standardize, and sustain), and 5W2H (who, what, when, where, and why; how and how much) tools to identify and solve problems, achieving a 10% gain in the weaving production process’s available time, emphasising continuous improvement and standardised processes. Sobek and Jimmerson [24] provide a template and explain how to use A3 reports to address organisational challenges in hospitals, demonstrating the success of Toyota’s original lean management principles in improving hospital productivity, quality, and communication. Aziz and Hafez [25] emphasised how the construction industry’s productivity has declined over the past 40 years, leading to the adoption of lean construction. This new production management approach focuses on clear objectives, concurrent design, and project control throughout the project life cycle, resulting in easier management, safety, and cost savings. Abbes et al. [26] developed a model for assessing lean six sigma readiness in the clothing industry using fuzzy logic. The model identifies critical success factors (CSFs) and literature factors, identifying 5 enablers, 6 criteria, and 46 attributes. The model helps managers evaluate readiness before implementation, identifying potential issues and recommending corrective actions for successful LSS implementation [24]. Lean manufacturing has become common knowledge in industry practice, yet there is still space to provide a consistent approach to determine where and how to adopt it. More research is required to investigate an effective implementation of lean within different types of organisations with their own specific challenges and requirements. The principles of lean manufacturing are predominantly based on value-added and non-value-added activities, which means minimal lead time, low operating cost and high product quality [27]. It is a transformative methodology for organisations that want to streamline processes, increase customer value, and gain an edge over competitors.
2.2. Role of Discrete Event Simulation in Process Improvement
Discrete event simulation (DES) is a powerful tool for the modelling of complex systems and is commonly applied to analyse, validate and optimise process improvements brought about by lean principles [28,29]. Its potential across lean construction, health, and manufacturing in terms of waste reduction and efficiency gains is significant, despite being less explored. DES incorporates lean principles for process modelling and improvement. It is underexplored in lean construction, health care, and manufacturing, with possible waste reduction and efficiency gains, in a range of contexts [30]. Mazumder et al. [31] used lean and simulation to improve the productivity of the assembly line. DES identified deficiencies, kaizen (a lean manufacturing technique or strategy) methods were used, and demands were managed, leading to less WIP, cycle time reduction, and a 7.14% increase in throughput. This has implications for managers and policymakers. Thenarasu et al. [32] used MCDM and DSS to set job priorities in large-scale problems. Mohanavelu et al. [33] investigated a press shop in an auto ancillary unit, developing a simulation model to enhance performance measures. By introducing an analytic hierarchy process (AHP)-based priority rule that considers due date and production volume, they demonstrated its effectiveness in improving lead time, WIP, machine utilisation, and queue-related statistics. Rahman and Sabuj [34] highlighted the prevalence of computer simulation in manufacturing, utilising a discrete-event simulation (DES) model for a UPS manufacturing line. Addressing improper layout and load distribution issues, the study identified the transformer-making section as a bottleneck. It proposed solutions, such as facility re-layout and resource adjustments, to enhance system performance through simulation modelling. Neeraj et al. [35] employed DES to analyse the aluminium brake bracket flow in a manufacturing unit. By identifying bottlenecks, they developed a new model, resulting in a 6% productivity increase and an 8.33% decrease in workforce requirements compared to the existing model.
John et al. [36] applied a hybrid model, combining the computerised relative allocation of facilities technique (CRAFT) block layout selection in the foundry section with detailed layout analysis using ARENA software. The approach enhanced layout utilisation by adjusting equipment positions and introducing new machines for iterative improvements. Thenarasu et al. [37] employed hybrid dispatching rules, combining static and dynamic sequencing methods, to optimise job prioritisation in manufacturing. DES validated the effectiveness of the proposed rules in minimising lead time, maximising throughput, and enhancing machine utilisation. Brunzini et al. [38] introduced a transdisciplinary framework for simulation-based training, aiming to enhance performance and learning processes in healthcare and industry. Shawki et al. [39] discussed how DES is a tool for simulating earthwork operations, focusing on its ease and flexibility in simulating various models in various construction areas, presenting a case study and obtaining results.
DES applications are increasingly enhanced by extended reality technologies for immersive engagement, though clear design guidelines are lacking. A review outlines key trade-offs, supported by a mining sector case study [40]. Turner et al. [41] proposed a study plan to further the development of next-generation DES systems. The proposal included technological exploration of DTs, artificial intelligence and augmented reality that prioritises human needs. Ghasemi et al. [42] emphasised that production scheduling (PS) is crucial for sustainable development and supply chain efficiency, and simulation optimisation (SO) can improve the efficiency of industrial systems. This article reviews existing research on SO applied to PS, focusing on the adaptation of Industry 4.0 and real-time SO-based DSTs.
2.3. Digital Twins Applications in Discrete Manufacturing
Digital twins (DTs) are currently considered a fundamental technology enabler for smart manufacturing, especially at the level of discrete manufacturing systems. DT is a virtual physical system carried out by monitoring, simulating, controlling and optimising [43]. Virtual twins are so important for many manufacturing processes, such as the design of the production line, the dynamic scheduling, the fault detection, as well as the predicting maintenance [4]. The successful realisation of DT is highly dependent on accurate modelling methodologies and integration of physical and virtual systems. One of the most used modelling approaches is DES modelling, which allows the simulation of complex, event-driven behaviour in a manufacturing environment [44]. Furthermore, the integration layers in DT architecture enable the system to be reconfigured, operated and more powerful with respect to the usability of DES real-time simulation [45]. However, it still has a lot of technological challenges. Some of these challenges are high-fidelity model generation that can simulate real-world behaviour, a robust real-time data interaction system, and the need to use iterative optimisation approaches that will continuously increase performance.
Recent studies have suggested formal approaches for the development and deployment of DTs in order to tackle these issues. Karakra et al. [46] developed a conceptual architecture of digital twin monitoring (DTM) and digital twin predicting (DTP) in manufacturing and healthcare. Similarly, Ricondo et al. [47] presented simulation-based approaches to improve system design and operational reliability with the utility of DT during planning and installation processes in the context of manufacturing systems. The extended consequences of DT adoption have also been investigated. Morabito et al. [48] demonstrate the capabilities of DTs in improving system flexibility, reconfigurability and operational effectiveness, particularly for situations where adaptive responses to environmental changes are required. Wooley et al. [49] provide an extensive literature review that presents several definitions of DTs, discusses their capabilities in the context of simulation, and investigates their adoption in different industrial domains. Summing up, even though DT holds disruptive power for modern manufacturing, continued research is essential to solve existing limitations and maximise potential. Merging high-fidelity modelling, real-time data assimilation, and simulation-informed decision-making will be paramount in the development of next-generation smart manufacturing systems. The literature, as shown in Table 1, extensively covers lean tools, DES, and DT separately; however, more explicit studies are needed to demonstrate optimisation by integrating these methodologies.

Table 1.
Literature review summary.
2.4. Research Gap and Novelty of the Study
Extensive literature discusses lean tools, DES, and DTs as three diverse methods for process improvement. However, a significant gap exists in studies that demonstrate a holistic and systematic integration of all three, further augmented by the inventive problem-solving power of TRIZ. Most reported applications tackle discrete problems, often without leveraging a data-driven approach (DT) for dynamic, real-time validation and risk-free optimisation of proposed solutions before shopfloor implementation. Furthermore, such integrated, digitally driven frameworks are less explored in traditional discrete manufacturing sectors, such as door making, which are often characterised by high variability and manual-intensive processes.
This gap is directly addressed by this research by implementing a DT-driven Sim-Lean-TRIZ framework. What is novel about this research is that four separate methodologies are formally combined into a systematic and replicable workflow elaborated in Table 1. It provides a hands-on demonstration of how DT can be the hub for systemic diagnosis (simulation), controlled deep-diving root cause analysis (lean), non-obvious inventive solutions (TRIZ) and analytical validation of the proposed solutions in a risk-free virtual world. This goes far further than theoretical or individual scenarios to demonstrate a proven route to substantial productivity gain within a conventional manufacturing paradigm.
3. Research Framework and Methodology
The process flow for cold room door manufacturing is illustrated in Figure 1 for all five types of doors. It begins with sourcing raw materials, often in the form of pre-coated galvanised iron sheets (GI) or stainless-steel rolls (SS). These materials undergo a series of precisely tailored processes designed to meet the specific requirements of door construction.
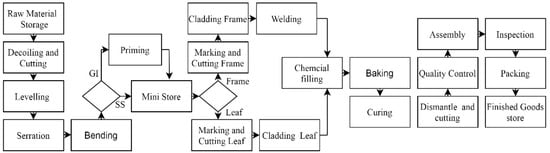
Figure 1.
Process flow chart of cold room door manufacturing.
The manufacturing journey encompasses a sequence of critical steps:
- Material Processing: Raw materials are treated with an optimum decolouring, cutting, and levelling.
- Forming: Several serration processes are carried out to make the required grooves on the surface and side bending to an angle of 90 o with 10 cm is one of the key stages for attaining the required shape and strength.
- Surface Method of Treatment: Galvanised iron sheets are also subjected to additional priming to further improve their long-lasting life.
- Component Making: After temporarily keeping, marking takes place and the materials are then uniformly cut into the leaf and frame, which is divided into two different parts of the leaf and leaf space.
- Sub-Assembly: The second step is cladding, in which supportive members are attached, joints are sealed, and the part sections are welded together.
- Chemical Injection and Cure: During this stage, the chemicals are injected into the open cavity of the frame and leaf; the polyol, the isocyanates and a catalyst (cyclopentane) are infused in exact quantities of 1:2:1. This mixture is baked and left to cure at room temperature.
- Final Assembly and Inspection: It is also about quality assurance all the way. The last step consists of detailed installation of all door parts (handles, hinges, rollers, etc.), which are then thoroughly checked before being packed for shipment.
The floor layout, illustrated in Figure 2, delineates various stations operating across the production floor, encompassing areas dedicated to storing raw materials, finished goods, and administrative functions. However, operational inefficiencies stemming from underutilised resources and inadequate planning have resulted in non-value-added time and bottlenecks along the production line. This situation necessitates outsourcing nearly 20% of the orders, despite the plant needing to fully leverage its production capacity. Moreover, reliance on conventional methods impairs productivity compared to industry competitors, compelling increased investment and outsourcing to meet customer demands.
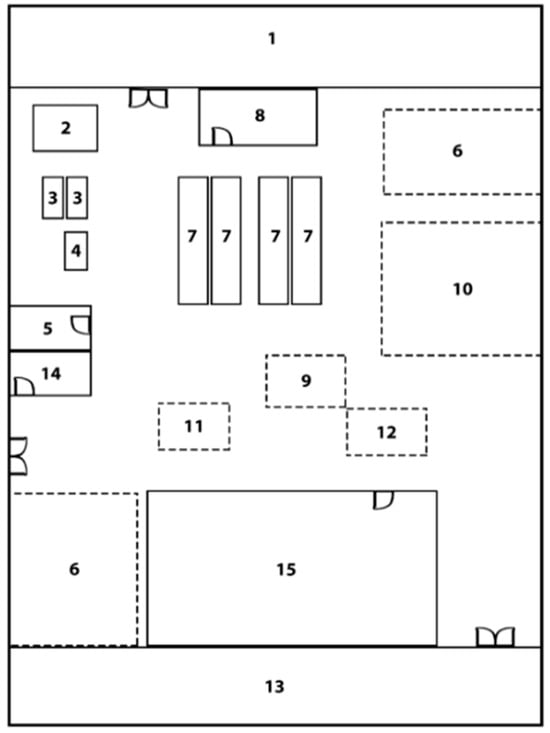
Figure 2.
Floor layout and details. Note: 1. Raw material store, 2. Decoiling and cutting station, 3. Cutting L/F and serration station, 4. Priming station, 5. Mini Store, 6. Marking and cladding, 7. Chemical filling, 8. Chemical Room, 9. QC and Inspection, 10. Welding station, 11. Assembly station, 12. Packing, 13. Finished goods store, 14. Floor manager office, 15. Administration office.
3.1. Objectives
Following the literature review and having visited the plant for discussions, the following research objectives and methods were framed and are as follows:
- i.
- To develop and validate a functional DT of the company’s existing door manufacturing process, being able to simulate its performance and diagnose systemic inefficiencies.
- ii.
- To identify and quantify the effects of critical production bottlenecks on plant performance criteria such as throughput, make span and inventory work-in-progress (WIP).
- iii.
- To adopt a structured, integrated approach which utilises lean techniques and TRIZ-based guidelines to facilitate systematic root cause analysis and creative action finding on methods of relieving the prioritised bottlenecks.
- iv.
- To virtualise the concepts developed in the DT space, forecast their impact on overall productivity and de-risk their physical application.
3.2. Overview of Methodology
As discussed, the five phases include a research framework in order for the objectives to be accomplished. The research framework was developed as seen in Figure 3. However, this framework provides meaning to these objectives. The five phases follow a framework in which the DT, DES, lean and TRIZ methods are systematically applied to diagnose problems and their symptoms, develop solutions and their validation.
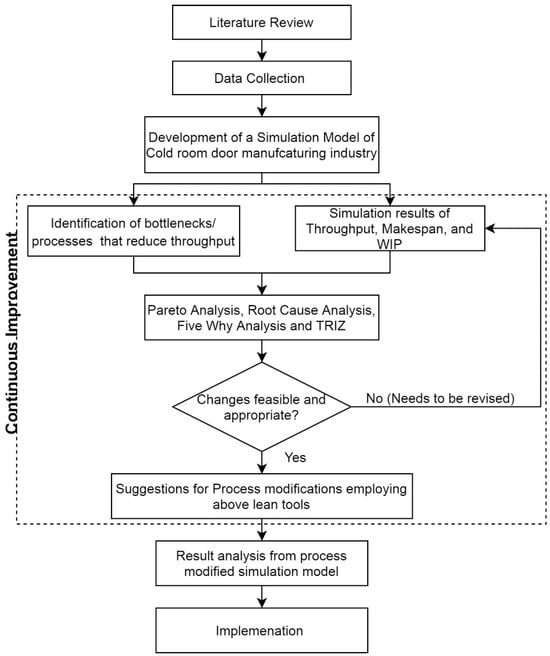
Figure 3.
Framework for productivity improvement.
Phase 1: System diagnosis framework is initiated with the phase 1. In this phase, the shop floor manufacturing processes are mapped, and time-study data are collected. Thus, this data is utilised in building an “As-Is” DT model of all five door variants through DES in Arena software (version 16.20.02) to create a dynamic replica of the real-world operations. Simulations on this model are then run to identify and quantify the bottlenecks using metrics including waiting times, queue lengths, and resource utilisation.
Phase 2: Root cause analysis, the critical bottlenecks identified by the state-of-the-art DT in phase 1 and then analysed rigorously using the lean analysis tools. Cause-and-effect diagrams are used to brainstorm root causes and then the 5-whys technique is used to drill down to the fundamental root cause of the inefficiency; most often, a technical contradiction is surfaced.
Phase 3: Inventive solution generation counter-intuitively, the phase 3 directly addresses this contradiction. Then, TRIZ ’s inventive principles are vigorously applied in to bring about the generation of novel, inventive “To-Be” solutions that address verbatim the limitations of the “As-Is” process. Therefore, this stage casts the conventional remedies for cost reduction out the window and proposes radical new invention concepts for process re-engineering.
Phase 4: Virtual validation and refinement. The “To-Be” solutions replace the “As-Is” model of DT. Simulations of the original and modified systems are conducted to demonstrate the effectiveness of the modification. Such a key stage is needed to enable experimentation and risk-free iterative advances, so that only the best valid solutions enter and learn for the implementation.
Phase 5: Implementation and monitoring requires enacting the verified solutions on the real shop floor. The physical-world impact is then evaluated to validate the productivity improvements forecast by the simulation and close the loop of the continuous improvement cycle. This data-based approach secures a strong correlation from the early diagnosis to the validated improvement and enables an agile production operation.
The feasibility of the proposed changes is rigorously assessed, resulting in detailed recommendations for process modifications. The subsequent implementation of these changes is based on validated simulation results, emphasising commitment to continuous improvement in the efficiency of cold room door manufacturing. Subsequent sections further elaborate on the detailed implementation process, offering a comprehensive insight into each step of the methodology and its contribution to process enhancement.
3.3. Case Study Selection and Generalizability
This study utilises a single-case approach, which is suitable for the investigation of a complex, real-world phenomenon. The manufacturer of the cold room door was selected due to a number of considerations. First, it is a typical small- or medium-sized enterprise (SME) operating in the discrete manufacturing industry. They often see a mix of automation and labour-intensive work, varying processes and products, as well as significant operational challenges, but are traditionally integrated only quite slowly at best to sophisticated digital tools like DTs. This frames the company as an excellent environment to demonstrate the potential real-life applications and feasibility of the developed integrated framework in a context where such applications are not common.
Although the detailed technical solutions are tailored to the unique conditions of this exemplar plant (e.g., the curing and welding details proposed), the general 5-phase methodological stack is designed to be applicable across the board. The approach of using a DT for diagnostics, lean analysis for root cause determination, TRIZ for innovative problem solving and simulation for validation is transferable to all sectors. It possesses the potential for scalability and can be applied within other manufacturing enterprises, particularly in discrete manufacturing sectors (e.g., furniture, custom machinery, aerospace components) that face analogous challenges, including process bottlenecks, suboptimal workflows, and the imperative to improve productivity without incurring significant capital outlays. The framework presents a systematic, reproducible method for any organisation to diminish risks associated with process innovation and encourage data-centric decision-making for ongoing progress.
4. Simulation Model Development in Arena as a Functional Digital Twin
DES is a powerful tool for modelling and analysing complex systems. Its outputs are varied and provide deep insights into the functioning and behaviour of simulated systems. Animation provides visual representations of the system’s functions and procedures. The graphical display helps understand system dynamics. Arena provides various performance measures and statistical data that provide insights into system efficiency, utilisation, throughput, cycle times, waiting times, queue lengths, resource utilisation, and more. These metrics help in evaluating the effectiveness of the modelled system [51].
Additionally, it provides statistical analytic tools for examining behavioural variability in the system. Users can define a probability distribution for each input variable and observe how these distributions affect the system’s output. Altogether, these results provide a comprehensive understanding of system behaviour, facilitate informed decision-making, and support efforts to optimise and improve processes across various industries, including manufacturing, logistics, healthcare, and service operations. A simulation model based on the workflow in the process chart was created using the Arena software. Figure 4 shows the developed model for the production process in the plant. The time study analysis is performed, and the actual processing times are captured. These times were converted into a suitable statistical distribution using the input analyser. All input parameters associated with the model are shown in Table A1 (ANNEXURE), and corresponding time study data for all five doors are provided in Table A2. The best-fit statistical distribution for cutting frame and welding is provided in Figure A1A,B. The company manufactures five doors for cold rooms, which are analysed using the simulation model. Each door type undergoes 18 steps or processes to complete the production process, from raw materials to finished goods. The simulation results enable us to evaluate the throughput, makespan, and WIP, and identify bottlenecks in the production scenario.
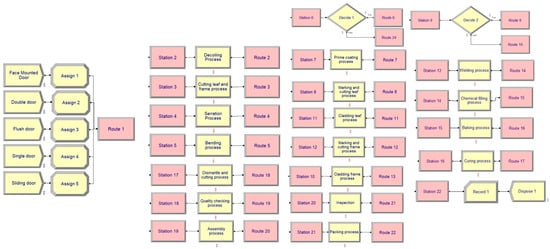
Figure 4.
Simulation model for the plant.
4.1. Data Collection and Model Validation
The validity of any simulation model depends on the input data used and the validation applied. Time-study data was gathered directly on the shop floor for two weeks. A sample of 15 runs was chosen for each of the 18 process conditions using all five door types to ensure statistical soundness. This empirical information, presented in Appendix A (Table A2), was used to parameterise the process time distributions employed in the Arena model with the Input Analyser utility.
To validate the ”As-Is” model, production data was checked against performance. Both models were operated for a one-year simulation time. Each of the five types of doors′ annual throughput being compared with the company’s production throughput one year before was the index of key output. The 5% difference between the calculated output from the simulation and the historical data revealed that the simulation model was a high-fidelity representation of the system and could be serviceably used as a decision support system for bottleneck analysis and what-if analysis.
4.2. Simulation Results
The evaluated simulation results, as shown in Table 2, align with the actual output statistics for each year of production at the company. The eighteen processes are represented as P1 to P18 in the order of P1—decoiling and cutting, P2—cutting leaf and frame, P3—serration, P4—bending, P5—prime coating, P6—marking and cutting leaf, P7—cladding leaf, P8—marking and cutting frame, P9—cladding frame, P10—welding, P11—chemical filling, P12—baking, P13—curing, P14—dismantle, P15—quality check, P16—assembly, P17—inspection, and P18—packing. The waiting times and number of waiting are plotted to identify the bottleneck. Table 2 presents the average number of finished products produced annually, aligning with the company’s actual output statistics for the same period. Table 2 also shows the makespan and WIP of the product, which represents the total time required to produce one unit of a door and the average number of units of doors still undergoing processing in a year, respectively.
Table 2.
Results of throughput, makespan and WIP.
The results obtained from the DES model for door manufacturing are presented in Figure 5 and Figure 6. In Figure 5, the maximum waiting time in the queue associated with each process is illustrated, while Figure 6 depicts the maximum number of waits in each process. These results encompass all five types of doors. Upon analysing the consolidated figures, it becomes apparent that the bottleneck processes in cold room door manufacturing, identified based on the highest waiting times and instances, are welding, curing, and packing. The simulation outcomes offer valuable insights for identifying problematic processes within the cold room door manufacturing flow. Welding, curing, and packing are causing throttling in the production system. Addressing these specific processes can significantly reduce time constraints, thereby enhancing productivity.
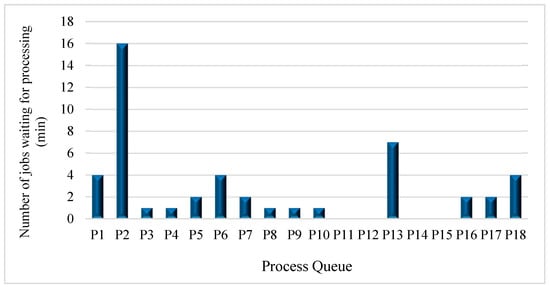
Figure 5.
Waiting time in the queue.
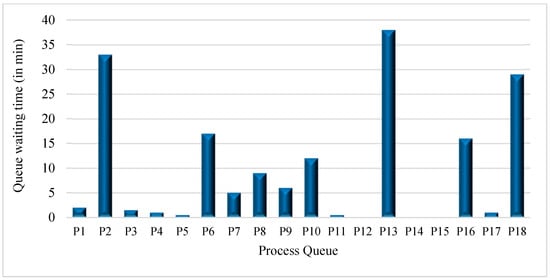
Figure 6.
Number of jobs waiting for processing. Note: P1 de-coiling and cutting_. Queue, P2 cutting leaf and frame_.Queue, P3 serration_.Queue, P4 ending_.Queue, P5 prime coating_.Queue, P6 marking and cutting leaf_.Queue, P7 cladding leaf_.Queue, P8 marking and cutting frame_.Queue, P9 cladding frame_.Queue, P10 welding_.Queue, P11 chem filling_.Queue, P12 baking_.Queue, P13 curing_.Queue, P14 dismantle and cutting_.Queue, P15 quality control_.Queue, P16 assembly_.Queue, P17 inspection_.Queue, P18 packing_.Queue.
5. Root Cause and Improvement Analysis
In this study, Pareto analysis was employed to assess all processes within the cold room door manufacturing plant. The analysis focused on process timings, including de-coiling and cutting, cutting leaf and frame, serration, bending, priming, marking and cutting frame, marking and cutting the leaf, cladding frame, cladding leaf, welding frame, chemical filling, baking, curing and cutting, quality control, assembly, packing, and inspection. A detailed record of the process timings was maintained, with 15 readings taken for each process. The average timing of these readings was then used to create a Pareto chart, which was plotted for each process across the five types of doors under study. The Pareto chart facilitated the identification of common bottlenecks present in all five types of doors. The analysis led to insights that informed process modifications aimed at reducing bottlenecks and enhancing overall productivity. The Pareto chart revealed that the curing process emerged as the most time-consuming, constituting 35–40% of the entire cold room door production. This insight guided the study in proposing various process modifications to streamline the welding and curing process, thereby lowering the overall process time. The proposed modifications aim to enhance productivity throughout the manufacturing plant.
The following are the results obtained from the Pareto analysis. A cumulative time percentage table for each door and its corresponding Pareto chart are shown below. Figure 7 shows the cumulative time percentages and the Pareto chart for the mounted door. Similarly, cumulative time percentages and Pareto charts are created for sliding, single, double, and flush doors. Results obtained from the Pareto analysis of the processes show similarity with results from the arena simulation. The major reasons for increased production time are the same as those pointed out, namely, curved, welding, and packing, which were found to be common in both Pareto analysis and simulation analysis. The Pareto analysis is used to validate the results of the simulation. Focus is provided to the time-consuming processes, and implementation can be made to decrease production time.
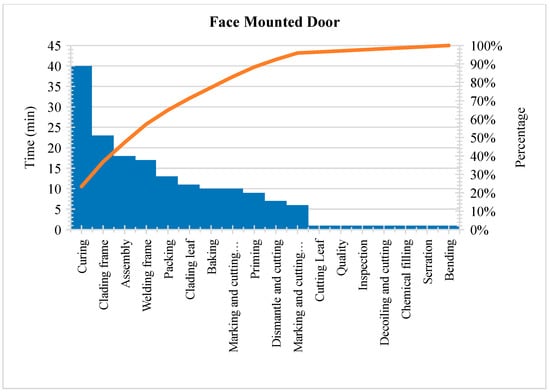
Figure 7.
Pareto chart—Face-mounted door (process time in minutes).
5.1. Root Cause Analysis for Low Productivity
According to the Pareto analysis, it is inferred that curing, welding frame, packing and quality control, cladding frame, and assembly account for 80% of the problems in the manufacturing plant. Out of those, curing, welding frame, and packing were analysed as the most time-consuming and problematic processes based on the simulation results. It was inferred from Figure 8 that the processes after curing, packing, and welding the frame had no queue, which indicates that these processes hold unfinished jobs due to high processing times, thereby slowing down the process flow. Therefore, these problems were taken into consideration and modified. Figure 8 shows the cause-and-effect diagram, which identifies the possible causes of each problem identified through Pareto analysis, contributing to the high processing time.
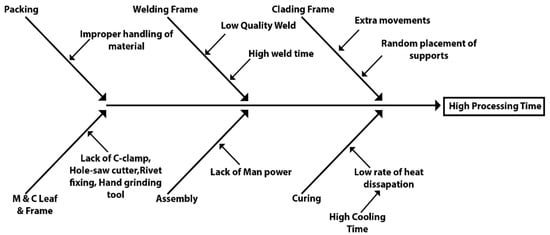
Figure 8.
Cause and effect diagram for low productivity.
5.2. Five-Whys Analysis for Root Cause Determination
The cause-and-effect diagram helped us identify various causes for low production. Curing, welding, and packing were considered for process modifications to enhance productivity. The analysis was chosen for five reasons to determine the sources of those specific causes and processes. This mode of study was employed individually to examine the various processes and causes that directly impacted productivity. This analysis was employed in the welding frame, curing, and packing process. In this method, the question ‘why’ is asked repeatedly for each of the causes until we arrive at the root cause. It was a major help because it enabled us to determine the root causes and thus decide upon the various courses of action needed to tackle those causes and processes.
Problem Statement: The WIP in the curing process is high. Why? The temperature at the start of curing is 160 degrees Celsius and gradually reduces to 35 degrees Celsius, taking an average of 45 min. Why? The heat dissipation rate is lower. Why? It is a free convection process.
Root Cause: The free convection heat transfer mode lowers the heat dissipation rate. It is implemented in the A3 problem-solving sheet for simplification and better understanding. A3 problem-solving sheet implementation of this sheet is mainly used to find the root cause based on a 5-whys analysis with a fixed target, which must be achieved by identifying the permanent solution. So, it was of great benefit to increase efficiency. The three main processes that caused the major flaws were identified using Pareto analysis; thus, the A3 problem-solving sheet is stringent for those defects.
5.3. Critical Process Analysis with TRIZ Principles
Based on the simulation of bottlenecks and lean analysis of root causes, the step in the framework focuses on finding inventive solutions. Lean can help to identify waste, but it does not necessarily offer a systematic way to solve the technical contradictions that underlie the problem. For this, TRIZ is a powerful tool. TRIZ is a logical, data-driven approach to problem-solving based on logic, data and structured innovation. Its principles can be employed to be creative, generating something novel as the solution to system opposition. The TRIZ principles that are used to solve the problem of welding, curing and packing problems in the current research of this paper are segmentation, parameter changes, and mechanics substitution, as shown in Table 3. The theory for inventive problem solving (TRIZ), a problem-solving methodology rooted in innovation, synergises with lean principles to enhance efficiency and eliminate waste. This dynamic integration propels continuous improvement and fosters inventive solutions in manufacturing processes. The following principles of TRIZ are used: segmentation, parameter changes, and mechanism substitutions to reduce processing time, as discussed in Table 3.
Table 3.
Critical process analysis with TRIZ principles.
5.3.1. Critical Process 1: Welding
From the Pareto chart and arena simulation, it was found that the welding process had a high processing time. A standard oxy-acetylene torch was used in the welding process. It took three passes for each weld, and the weld surface quality needed to be improved, contributing to the high processing time. With the help of the segmentation theory principle in the lean thinking tool TRIZ, we innovatively conceived the idea of using a standard oxy-acetylene torch with powder metal fed into the flame from an attached hopper so that the edge of the corners can be welded, as shown in Figure 9. This method was validated using prior studies, including the work on high-productivity multi-wire submerged arc welding and metal-powder cladding [52]. Effect of addition of metal powder on deposition rate, mechanical properties, and metallographic properties of weld joints during submerged arc welding [53]. We understand from papers that introducing this method leads to a decrease in the number of passes from 3 to 1. Thus, it helps reduce time and increase productivity. Powder welding results in a smooth weld area and a dense coating with a diffusion bond to the base metal. It is simple to use, as the deposition of filler metal and fusing are completed in one step. Strong bonding and smooth surface were also noted. We also infer from papers that shielding flux consumption was reduced by 15–25%, resulting in a 6% increase in the deposition rate. It was noted that the deposition rate was 0.5–2.5 kg/hour, deposition thickness was 0.2–12 mm, and deposition hardness was 20–62 HRC.
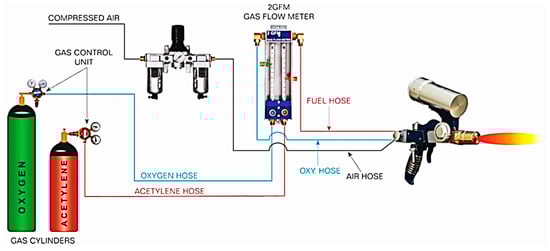
Figure 9.
Powder metal welding setup.
Table 4 presents the A3 problem-solving sheet for welding modification, which includes a suggested powder metal welding setup. Hence, we received an average of 60% reduction in the welding process time because the welding could be finished with one pass, making the work simple and stress-free for the workers.
Table 4.
Welding A3 problem-solving sheet.
5.3.2. Critical Process 2: Curing
According to the simulation and Pareto chart, the work in progress during the curing process is high. Conventional heat transfer mode, free convection, was used in the company to reduce the temperature of the sandwich panels from 165 °C to 35 °C. With the help of the parameter changes principle in the lean thinking tool TRIZ, the free convection process is replaced with forced convection. Introduction of industrial fans/blowers with a radius of 40 cm, power consumption of 180 watts, sweep of 20 mm and air delivery of 200 , the curing time was reduced to 37.5% for each door, and the overall increase in productivity was found to be 8.1%. Using Equation (1), the Grashof number was calculated and was obtained to be 1.111 × . Employing this result, the Rayleigh number is determined using Equation (2). The Prandells number at = 373 K was obtained from the heat transfer data book. In free convection, the average Nusselt number was calculated using Equation (3) and is used to calculate the heat transfer rate (h) using Equation (4). The substitution is shown in Equation (4). In forced convection, to determine the heat transfer rate, we need to calculate the average Nusselt number. This number is dependent on the Reynolds number, which is calculated using Equation (5). By considering the fan specification, the volume flow rate is taken as 200 cm. The Reynolds number was calculated, and the flow was found to be laminar.
The theoretical calculations which prove the above statements are as follows:
where m/,, , , γ = 1.81 × .
Grashof number, was computed as 1.111 ×
where Prandell No Pr for = 373 K is 0.695 (ref heat transfer table).
In free convection,
where can be computed using the equation shown below, and h is found to be 7.038 W/:
After substitution, the average Nusselt number is computed as 485.408. In forced convection, volume flow rate = , where = area of the door, volume flow rate = 200 cubicmeter per min:
The Reynolds number was determined as 366,353.59, which is less than 5 ×
Therefore, the flow is laminar. = 355.99, and h is calculated to be 3247.816 J/s. For a single door, fixing ∆T constant at 130 K in free convection, the heat dissipation rate is 2012.86 J/S, and for the temperature to drop from 165 °C to 35 °C, it takes 20 min. By fixing ∆T at 130 K in forced convection, the dissipation rate is 3247.816 J/S, and for the temperature to drop from 165 °C to 35 °C, it takes 12.5 min. Table 5 shows time reduction in all types of doors due to curing modification, and Table 6 shows the A3 problem-solving sheet for the curing modification.
Table 5.
Time reduction due to curing modification.
Table 6.
Curing A3 problem-solving sheet.
5.3.3. Critical Process 3: Packing
In the current situation, hand packing is performed, involving stressful and chaotic work. Workers may experience fatigue after a certain number of job cycles, leading to less efficient work patterns. Utilising the mechanics’ substitution principle in the lean thinking tool, TRIZ introduces mechanical support for the task. As a result, an automated packing machine is employed for packing rectangular slabs of varying widths quickly after the final inspection.
The material used for packing is low-density polyethylene. The advantages of using a packing machine include reducing the number of workers to two per machine for operation and support. This ensures that proper, standard packing procedures can be consistently executed without causing worker fatigue. Additionally, there is an average reduction of 40% in time for each cold room door type. An automated packing machine that aligns with the packing process requirements is identified and recommended. Table 7 illustrates the A3 problem-solving sheet for the packing modification.
Table 7.
Packing A3 problem-solving sheet.
6. Implementation and Validation
In this study, lean, TRIZ and simulation were applied to address challenges within the manufacturer such as a reduction in processing time, elimination of non-value-added waste and elimination of bottlenecks to improve cold room door manufacturing productivity. The process involved in cold room door manufacturing was studied, and based on its productivity, a simulation model using discrete-event simulation (DES) was created. Through DES, bottleneck analysis, throughput, and makespan were determined from the simulation results, with the help of the results obtained for curing, welding, and packing. By comparing new simulation results with old results, it is observed that implementing the proposed modifications will result in a significant improvement in production, with a 15–19% decrease in the work in progress value. By introducing alternative methods and techniques to the existing ones, productivity has increased significantly. For instance, the installation of fans/blowers instead of relying on natural convection in the curing process resulted in an 8.16% increase in productivity. Incorporating powdered metal into gas welding increased productivity by 8.10%. Introducing automation into the packing procedure increased productivity by 8.12%.
A summary of the A3 problem-solving sheet is prepared, including the root cause, its solution, and the benefit if implemented. Resource levelling is performed on the surface, which allows a better flow. It would drastically reduce time and increase productivity. It provides a future scope by allowing a better flow. By implementing the above techniques and methodologies, the plan would be able to meet customers’ demands and reduce outsourcing, thereby directly enhancing the profitability of its production. The proposed modifications reduced the processing time for the entire manufacturing process and increased production. This implementation results in a change in production per year. Table 8 shows the improvements achieved by makespan and work in progress using all the suggested methods. Table 9 shows the improved production in terms of the number of doors output per model per year with modifications suggested. A comparison of the current and modified scenarios with different methods is highlighted below. Also, Table 9 compares the current scenario’s makespan to the modified scenario’s makespan for different door types. There was an average drop of 16.944% in the makespan time after modification.
Table 8.
Improved production in terms of no-of-door output per model per year.
Table 9.
Makespan improvement using all suggested methods together.
Table 10 illustrates the comparison between the current scenario and the modified work in progress (WIP) scenario for different types of doors manufactured. There was an average drop of 2.67% in work in progress after modification. Table 11 presents productivity statistics achieved after implementation, along with the percentage increase in production for the cold room door models. Furthermore, productivity can be improved further with in-depth resource levelling and line-balancing techniques. An average improvement of about 42.906% is observed.
Table 10.
Work in progress improvement using all suggested methods together.
Table 11.
Resource levelling.
The implemented modifications in cold room door manufacturing led to substantial improvements, notably increasing production output and streamlining processes. They achieved productivity enhancement, averaging 42.906%. Innovative methods, such as using fans/blowers in curing and introducing automation in packing, resulted in significant boosts ranging from 8.10% to 8.16%. A structured A3 problem-solving approach systematically addresses root causes. Surface-level resource levelling reduced time and laid the foundation for future optimisations. These enhancements position the plant to meet customer demands, decrease outsourcing, and directly enhance production profitability, aligning with operational excellence goals.
7. Resource Optimisation and Cost Implications
On the plant floor, 50 workers are currently distributed according to the needs of the machine or process requirements, as outlined in Table 11. However, the analysis of the table reveals that only 47 workers are actively engaged in completing all necessary tasks. Modifying the processes improved overall output.
Table 11 indicates an understaffing issue in the cutting leaf and frame processes, leading to extended processing times. In response to this insight, adjustments were made to the packing process. The introduction of automation in packing reduced the required operators per machine from three to two. Consequently, two workers from the packing section were reallocated to cut leaves and frames, enhancing the sub-product flow along the production line. Despite these changes, the total number of workers in use remains constant. Overall, the modifications not only optimised the packing process through automation but also addressed the understaffing issue in critical areas, resulting in a more efficient and balanced distribution of workers across the plant floor.
8. Discussion
8.1. Comparison with Previous Literature
The findings of this study demonstrate a significant 42.90% average increase in productivity through an integrated DT, lean, TRIZ, and simulation approach, and contribute valuable empirical evidence to the existing body of literature. Despite the individually proven benefits of lean tools (e.g., Campos and Vazquez-Brust [7]; Karikalan et al. [8]; Saravanan et al. [9]), discrete event simulation (e.g., Collins et al. [30]; Mazumder et al. [31]), and, more recently, DTs (e.g., Feng and Wan [4]; Cimino et al. [43] (See Table 12)), the novelty of the present work lies in its holistic integration and application within a cold room door manufacturing setting. It represents a traditional industry that is less frequently documented in advanced digitalisation literature.
Table 12.
Review of past studies and how this study addresses their gaps.
The observed productivity gains are comparable to, and in some respects extend, those found in focused lean implementations. Saravanan et al. [9] reported a 43% productivity increase on a gearbox pre-assembly line through value stream mapping and work standardisation. This study achieved a similar overall improvement through a broader, digitally integrated strategy. The use of TRIZ by Muruganantham et al. [1] and Maia et al. [14] for tackling inventive problems where processes stagnate proved vital in devising specific solutions for welding, curing, and packing operations. Our findings substantiate their assertion that TRIZ can unlock improvements beyond conventional lean approaches.
Furthermore, this research directly addresses the identified gap concerning the sparse application of integrated lean, TRIZ, and DT technologies in a framework that enables systematic, real-time, and validated productivity improvement in classical discrete manufacturing. While studies employing multiple techniques, such as Mohanavelu et al. [33], have demonstrated the benefits of DES with AHP-based rules, and others, like Ricondo et al. [47], have proposed simulation-based DT frameworks for system design, our work provides a detailed case of operational optimisation through a specific methodological combination. The DT served not just as a simulation environment, as explored by John et al. [36], but as an active hub for diagnosing issues, experimentally validating TRIZ-derived solutions, and guiding lean interventions. This tool demonstrates a pathway to overcome the often abstract or overly complex nature of previously reported research outcomes. The reduction in outsourcing dependency by 20% further underscores the practical efficacy of the framework in enhancing operational self-sufficiency
8.2. Theoretical Implications
This research offers several noteworthy theoretical implications. It contributes to a more nuanced understanding of how DTs can integrate continuous improvement and innovation methodologies such as lean, TRIZ, and DES. The study unearths the synergistic dynamics that emerge from the combination despite the individual theoretical underpinnings of these approaches being well-documented [1,14]. This extends the discourse on lean methodologies by illustrating how digital transformation-driven simulation can facilitate rapid, data-rich feedback loops. Consequently, this approach accelerates the plan-do-check-act cycles in a manner that is both more controlled and predictive than what traditional applications permit.
The theoretical application of TRIZ, showcasing its efficacy in resolving complex system-level contradictions identified through the holistic view afforded by a DT, extends its use beyond the typical component-level inventive problem-solving, thereby increasing the usability of these tools. The framework presented implicitly proposes a model for how the abstract problem identification capabilities of lean and the solution-generation power of TRIZ can be practically operationalised and validated through DES, with the DT acting as the persistent, evolving repository of system knowledge and the testbed for innovation. This interconnectedness, where DT not only models reality but also actively shapes the application of improvement strategies, enriches the theoretical constructions of smart manufacturing and adaptive production systems. The findings suggest that such integrated frameworks can offer a more robust pathway to achieving systemic optimisation than the sequential or isolated application of these methodologies.
8.3. Practical Implications
The study offers a validated, data-driven pathway for managers to enhance productivity and reduce reliance on outsourcing. Manufacturers can move beyond piecemeal improvements to holistic system optimisation by using the DT-Lean-TRIZ-simulation framework. The capability of DT for rigorous analysis of throughput, makespan, and WIP, effectively pinpointing bottlenecks for targeted interventions, is evident from the study. Practitioners can leverage this approach to de-risk innovation; the ability to simulate and validate changes inspired by lean and TRIZ within the DT before physical implementation mitigates concerns about potential disruptions and resource wastage. It enables managers to make informed decisions by simulating a range of possible scenarios before selecting the most suitable one(s). The detailed application of Pareto analysis, cause-and-effect diagrams, and 5-whys analysis, culminating in TRIZ-based solutions, provides a clear template for structured problem-solving that can be consistently applied and replicated. Forced convection curing, powder-fed welding, and automated packing offer tangible examples for other manufacturers facing similar process challenges and bottlenecks. Managers can use the evidence from the simulation results to make more informed strategic decisions regarding capacity planning and investment by understanding the incremental and cumulative effects of process changes. This leads to more efficient resource allocation and stronger competitive positioning. The successful implementation highlights the potential for small to medium enterprises (SMEs) in traditional sectors to embrace elements of Industry 4.0, demonstrating that advanced digital tools, when thoughtfully integrated with established improvement philosophies, can yield significant operational and financial benefits, ultimately fostering a culture of continuous, data-informed improvement as noted by Sojka and Lepšík [2].
9. Conclusions and Outlook
This study successfully demonstrated the powerful synergy between lean principles, TRIZ for systematic innovation, and discrete event simulation within a DT framework to address critical productivity challenges in cold room door manufacturing. Robust virtual experiments and accurate bottleneck identification were enabled by the construction of a dynamic DT that imitated the production environment through research. The follow-up application of focused lean and TRIZ methodologies, proven through simulation, led to substantial performance improvement, especially in curing, welding, and packing workstations.
All effects combined with the average production output per item increased by 42.9%, the average product makespan was reduced by 16.9% and the WIP was reduced by around 2.7%. These findings directly contribute to the study’s main research questions by indicating how a holistic approach can successfully reduce lead time, eliminate waste, relieve bottlenecks, and optimise the entire process flow. The novelty of this research is in practically demonstrating the DT as a core orchestrating platform for diagnosing systemic problems, rigorously testing innovative solutions, and directing data-driven improvements in a typical discrete manufacturing sector. This work has tackled an area where such holistic integrations are not yet widespread, and thus fills an important gap in existing literature, and provides a strong model for other manufacturing firms aiming to achieve operational excellence.
Although strong evidence of the effectiveness of the framework is provided through this single-case study, the focus on one manufacturing environment introduces restrictions in generalizability. Also, the research limitations of human orientation in the context of Industry 5.0 need to be mentioned. Hence, the resulting DT is a model of the process and machinery and does not reflect data or real-time status information on the human operators, such as fatigue, cognitive load or ergonomic stress. Indeed, a genuine human digital twin (HDT) as envisaged in the recent literature would describe an individual human designing an environment that is fully personalised and truly human-centric.
The transformation of our process-oriented digital transformation towards a more holistic, human-centric paradigm is a major and exciting stride forward into future research. This foundation needs to be further developed. By leveraging technology to support real-time shopfloor feedback loops and predictive analytics functions, VSM can be enhanced as a superior pro-active decision-support tool. Other opportunities relate to the development of step-wise digitalisation and automation of upstream processes, as well as the use of more advanced resource levelling and dynamic line-balancing techniques. Further extensive research needs to focus on scaling up/down and customising the framework for specific SMEs, standardising the protocols of embedding lean-TRIZ tools within DT interfaces and exploring the organisational and people-empowerment factors which are critical for adoption.
Author Contributions
Conceptualisation, T.M. and S.A.; methodology, T.M.; software, T.M.; validation, T.M., S.A. and N.M.S.; formal analysis, T.M.; investigation, T.M.; resources, T.M.; data curation, T.M.; writing—original draft preparation, T.M.; writing—review and editing, T.M. and O.M.; visualisation, A.P.; writing—original draft preparation, O.M.; project administration. All authors have read and agreed to the published version of the manuscript.
Funding
This research received no external funding.
Data Availability Statement
The DES model and the associated data used in this study are available from the corresponding author upon reasonable request.
Acknowledgments
The authors would like to thank the company managers for their valuable support and cooperation during this study.
Conflicts of Interest
The authors declare no conflicts of interest.
Abbreviations
The following abbreviations are used in this manuscript:
| DES | Discrete Event Simulation |
| DT | Digital Twin |
| TRIZ | Theory of Inventive Problem Solving |
| SMED | Single-Minute Exchange of Dies |
| 5W2H | Who, What, When, Where, Why, How, and How Much |
| OEMs | Original Equipment Manufacturers |
| TPM | Total Productive Maintenance |
| CSFs | Critical Success Factors |
| MCDM | Multi-Criteria Decision Making |
| AHP | Analytic Hierarchy Process |
Appendix A
Table A1.
Input details for the simulation model.
Table A1.
Input details for the simulation model.
| Process | Time Expressions and Constants | No. of Resources | ||||
|---|---|---|---|---|---|---|
| Single Door | Face Mounted Door | Flush Door | Double Door | Sliding Door | ||
| Decoiling and cutting | 18.5 + LOGN (3.66, 3.8) | TRIA (18.5, 21, 26.5) | 31.5 + 4 * BETA (0.543, 1.13) | TRIA (20.5, 23.4, 25.5) | TRIA (37.5, 40, 43.5) | 1 |
| Cutting leaf and frame | 180 + 31 * BETA (0.667, 0.793) | 183 + 31 * BETA (0.852, 0.803) | 240 + 51 * BETA (0.283, 0.61) | 376 + 45 * BETA (0.861, 0.991) | NORM (282, 5.78) | 1 |
| Serration | 7.5 + 4 * BETA (1.9, 1.72) | 7.5 + WEIB (2.22, 2.38) | NORM (22.4, 1.5) | 17.5 + 6 * BETA (1.59, 1.92) | NORM (30.5, 1.59) | 1 |
| Bending | TRIA (5.5, 9.2, 11.5) | 7.5 + GAMM (0.663, 2.87) | 10.5 + 4 * BETA (1.71, 2.32) | 11.5 + 8 * BETA (1.26, 1.5) | NORM (20.6, 1.93) | 1 |
| Prime coating | 350 | 500 | 600 | 700 | 700 | 1 |
| Mini store | 12 | 12 | 12 | 12 | 12 | 1 |
| Marking and cutting frame | 8.5 + 3 * BETA (1.75, 2.06) | 8.5 + 3 * BETA (1.16, 1.52) | TRIA (11.5, 15, 18.5) | TRIA (15.5, 18, 23.5) | 18.5 + 5 * BETA (1.1, 1.52) | 2 |
| Cladding frame | 20.5 + 6 * BETA (1.07, 1.1) | 20.5 + 6 * BETA (1.13, 1.21) | 29.5 + 8 * BETA (0.364, 0.714) | NORM (27.6, 1.45) | 29.5 + 7 * BETA (1.04, 1.08) | 4 |
| Welding | 14.5 + 6 * BETA (1.53, 1.31) | 14.5 + 6 * BETA (1.78, 1.26) | 18.5 + 5 * BETA (1.56, 1.33) | 20.5 + 6 * BETA (1.07, 0.874) | TRIA (29.5, 29.8, 34.5) | 4 |
| Marking and cutting leaf | 3.5 + ERLA (0.433, 5) | 4.5 + GAMM (0.649, 2.62) | TRIA (6.5, 10, 13.5) | 9.5 + 4 * BETA (1.26, 1.3) | 7.5 + 7 * BETA (2.05, 1.94) | 2 |
| Cladding leaf | 8.5 + ERLA (0.475, 4) | 7.5 + 5 * BETA (1.21, 0.877) | 14.5 + GAMM (1.32, 1.95) | 19.5 + LOGN (1.66, 1.07) | 14.5 + GAMM (1.32, 1.95) | 4 |
| Chemical filling | 9.5 + ERLA (0.455, 4) | 9.5 + 3 * BETA (1.05, 1.81) | 11.5 + 3 * BETA (0.577, 0.528) | 10.5 + ERLA (0.522, 3) | 15.5 + 5 * BETA (0.754, 1.46) | 4 |
| Baking | 10 | 10 | 10 | 10 | 10 | 4 |
| Curing | 20 | 40 | 30 | 40 | 50 | 4 |
| Dismantle and cutting | 4.5 + 5 * BETA (1.24, 1.05) | 4.5 + ERLA (1.15, 2) | TRIA (6.5, 8.2, 9.5) | TRIA (6.5, 9, 12.5) | 6.5 + GAMM (0.4, 4.42) | 4 |
| Quality control | 20 | 25 | 30 | 25 | 35 | 4 |
| Assembly | 14.5 + 7 * BETA (0.863, 0.967) | 15.5 + WEIB (3.87, 2.07) | TRIA (19.5, 30, 40.5) | 26.5 + 7 * BETA (1.39, 1.56) | 20.5 + 10 * BETA (0.805, 0.714) | 4 |
| Inspection | 20 | 25 | 30 | 30 | 30 | 1 |
| Packing | TRIA (6, 7.48, 10.9) | TRIA (6.36, 7.68, 9) | 7.38 + 4.62 * BETA (2.24, 2.26) | NORM (8.25, 0.751) | 10.2 + GAMM (0.492, 2.18) | 2 |
Note: The symbol “*” denotes multiplication used in processing time calculations.
Table A2.
(A) Time study of Single door. (B) Time study of Flush door. (C) Time study of Sliding door. (D) Time study of face-mounted door. (E) Time study of Double door.
Table A2.
(A) Time study of Single door. (B) Time study of Flush door. (C) Time study of Sliding door. (D) Time study of face-mounted door. (E) Time study of Double door.
| (A) | |||||||||||||||||
| S.No. | Single Door (In Seconds) | ||||||||||||||||
| Process name | Decoiling and Cutting | Time for Serration | Side Bending | Priming | Marking and Cutting Leaf | Marking and Cutting Frame | Cladding Leaf | Cladding Frame | Welding | Chemical Filling | Baking | Curing | Dismantle and Cutting | Quality Checking | Assembly | Inspection | Packing |
| 1 | 20 | 10 | 9 | 10 | 9 | 11 | 10 | 25 | 18 | 10 | 10 | 20 | 5 | 20 | 20 | 20 | 10 |
| 2 | 19 | 9 | 8 | 10 | 8 | 10 | 11 | 24 | 15 | 11 | 10 | 20 | 7 | 20 | 18 | 20 | 9 |
| 3 | 21 | 9 | 6 | 10 | 6 | 10 | 10 | 26 | 17 | 10 | 10 | 20 | 8 | 20 | 21 | 20 | 10 |
| 4 | 22 | 8 | 7 | 10 | 7 | 9 | 11 | 23 | 15 | 10 | 10 | 20 | 9 | 20 | 17 | 20 | 15 |
| 5 | 19 | 11 | 9 | 10 | 9 | 10 | 12 | 25 | 16 | 11 | 10 | 20 | 6 | 20 | 16 | 20 | 14 |
| 6 | 25 | 9 | 10 | 10 | 10 | 11 | 9 | 24 | 19 | 12 | 10 | 20 | 6 | 20 | 15 | 20 | 11 |
| 7 | 24 | 9 | 10 | 10 | 10 | 9 | 10 | 26 | 17 | 11 | 10 | 20 | 8 | 20 | 15 | 20 | 13 |
| 8 | 23 | 9 | 9 | 10 | 9 | 10 | 10 | 21 | 19 | 12 | 10 | 20 | 7 | 20 | 15 | 20 | 11 |
| 9 | 20 | 10 | 10 | 10 | 10 | 10 | 10 | 22 | 18 | 10 | 10 | 20 | 9 | 20 | 17 | 20 | 10 |
| 10 | 20 | 8 | 8 | 10 | 8 | 9 | 9 | 24 | 19 | 11 | 10 | 20 | 8 | 20 | 20 | 20 | 15 |
| 11 | 26 | 11 | 8 | 10 | 8 | 10 | 11 | 23 | 20 | 10 | 10 | 20 | 7 | 20 | 18 | 20 | 14 |
| 12 | 21 | 10 | 11 | 10 | 11 | 9 | 10 | 21 | 17 | 10 | 10 | 20 | 6 | 20 | 21 | 20 | 12 |
| 13 | 20 | 11 | 7 | 10 | 7 | 11 | 10 | 24 | 19 | 11 | 10 | 20 | 5 | 20 | 17 | 20 | 13 |
| 14 | 25 | 10 | 9 | 10 | 10 | 9 | 11 | 21 | 20 | 10 | 10 | 20 | 8 | 20 | 18 | 20 | 11 |
| 15 | 24 | 10 | 8 | 10 | 9 | 10 | 12 | 23 | 18 | 10 | 10 | 20 | 9 | 20 | 19 | 20 | 10 |
| (B) | |||||||||||||||||
| S.No | Flush Door (In seconds) | ||||||||||||||||
| Process name | Decoiling and Cutting | time for Serration | Side Bending | Priming | Marking and Cutting Leaf | Marking and Cutting Frame | Cladding Leaf | Cladding Frame | Welding | Chemical Filling | Baking | Curing | Dismantle and Cutting | Quality Checking | Assembly | Inspection | Packing |
| 1 | 32 | 26 | 11 | 10 | 6 | 14 | 15 | 30 | 23 | 12 | 10 | 30 | 7 | 30 | 20 | 30 | 15 |
| 2 | 32 | 22 | 12 | 10 | 8 | 19 | 16 | 30 | 23 | 14 | 10 | 30 | 8 | 30 | 25 | 30 | 15 |
| 3 | 32 | 23 | 13 | 10 | 7 | 16 | 16 | 30 | 22 | 12 | 10 | 30 | 9 | 30 | 26 | 30 | 15 |
| 4 | 33 | 23 | 13 | 10 | 6 | 15 | 16 | 32 | 21 | 12 | 10 | 30 | 8 | 30 | 30 | 30 | 16 |
| 5 | 32 | 22 | 12 | 10 | 6 | 17 | 19 | 34 | 22 | 12 | 10 | 30 | 8 | 30 | 37 | 30 | 17 |
| 6 | 32 | 22 | 13 | 10 | 8 | 16 | 17 | 37 | 22 | 12 | 10 | 30 | 8 | 30 | 35 | 30 | 20 |
| 7 | 34 | 23 | 14 | 10 | 7 | 15 | 15 | 35 | 20 | 12 | 10 | 30 | 8 | 30 | 25 | 30 | 15 |
| 8 | 32 | 24 | 13 | 10 | 6 | 15 | 19 | 35 | 19 | 12 | 10 | 30 | 8 | 30 | 29 | 30 | 13 |
| 9 | 32 | 24 | 12 | 10 | 6 | 12 | 20 | 35 | 22 | 14 | 10 | 30 | 8 | 30 | 30 | 30 | 17 |
| 10 | 33 | 22 | 11 | 10 | 5 | 15 | 20 | 30 | 22 | 14 | 10 | 30 | 7 | 30 | 30 | 30 | 18 |
| 11 | 32 | 20 | 11 | 10 | 7 | 14 | 17 | 35 | 20 | 14 | 10 | 30 | 7 | 30 | 40 | 30 | 16 |
| 12 | 32 | 22 | 11 | 10 | 5 | 15 | 15 | 30 | 20 | 14 | 10 | 30 | 8 | 30 | 36 | 30 | 17 |
| 13 | 35 | 20 | 13 | 10 | 6 | 18 | 18 | 30 | 20 | 14 | 10 | 30 | 9 | 30 | 30 | 30 | 15 |
| 14 | 34 | 21 | 12 | 10 | 5 | 17 | 16 | 30 | 22 | 14 | 10 | 30 | 9 | 30 | 30 | 30 | 16 |
| 15 | 35 | 22 | 12 | 10 | 5 | 13 | 17 | 30 | 20 | 14 | 10 | 30 | 9 | 30 | 30 | 30 | 17 |
| (C) | |||||||||||||||||
| S.No. | Sliding Door (In seconds) | ||||||||||||||||
| Process name | Decoiling and Cutting | time for Serration | Side Bending | Priming | Marking and Cutting Leaf | Marking and Cutting Frame | Cladding Leaf | Cladding Frame | Welding | Chemical Filling | Baking | Curing | Dismantle and Cutting | Quality Checking | Assembly | Inspection | Packing |
| 1 | 40 | 30 | 20 | 10 | 11 | 20 | 15 | 35 | 30 | 18 | 10 | 50 | 10 | 35 | 25 | 30 | 20 |
| 2 | 39 | 32 | 21 | 10 | 11 | 22 | 16 | 34 | 31 | 16 | 10 | 50 | 8 | 35 | 26 | 30 | 20 |
| 3 | 42 | 31 | 18 | 10 | 13 | 21 | 16 | 36 | 30 | 19 | 10 | 50 | 9 | 35 | 23 | 30 | 20 |
| 4 | 43 | 29 | 20 | 10 | 12 | 20 | 16 | 32 | 32 | 20 | 10 | 50 | 8 | 35 | 28 | 30 | 22 |
| 5 | 40 | 30 | 19 | 10 | 12 | 22 | 19 | 34 | 31 | 17 | 10 | 50 | 8 | 35 | 29 | 30 | 19 |
| 6 | 39 | 32 | 16 | 10 | 10 | 19 | 17 | 30 | 30 | 16 | 10 | 50 | 8 | 35 | 21 | 30 | 20 |
| 7 | 42 | 31 | 22 | 10 | 10 | 21 | 15 | 32 | 32 | 17 | 10 | 50 | 8 | 35 | 25 | 30 | 21 |
| 8 | 41 | 30 | 21 | 10 | 10 | 19 | 19 | 31 | 30 | 18 | 10 | 50 | 8 | 35 | 26 | 30 | 23 |
| 9 | 40 | 26 | 20 | 10 | 11 | 21 | 20 | 33 | 34 | 17 | 10 | 50 | 8 | 35 | 22 | 30 | 21 |
| 10 | 39 | 33 | 24 | 10 | 11 | 22 | 20 | 34 | 32 | 17 | 10 | 50 | 7 | 35 | 26 | 30 | 20 |
| 11 | 40 | 30 | 21 | 10 | 13 | 23 | 17 | 36 | 31 | 19 | 10 | 50 | 7 | 35 | 21 | 30 | 19 |
| 12 | 42 | 32 | 22 | 10 | 13 | 19 | 15 | 32 | 33 | 16 | 10 | 50 | 8 | 35 | 25 | 30 | 23 |
| 13 | 38 | 31 | 23 | 10 | 12 | 21 | 18 | 34 | 31 | 16 | 10 | 50 | 9 | 35 | 30 | 30 | 21 |
| 14 | 41 | 30 | 20 | 10 | 12 | 20 | 16 | 31 | 32 | 16 | 10 | 50 | 9 | 35 | 30 | 30 | 20 |
| 15 | 40 | 31 | 22 | 10 | 11 | 19 | 17 | 30 | 30 | 16 | 10 | 50 | 9 | 35 | 30 | 30 | 19 |
| (D) | |||||||||||||||||
| S.No. | Face Mounted Door (In seconds) | ||||||||||||||||
| Process name | Decoiling and Cutting | time for Serration | Side Bending | Priming | Marking and Cutting Leaf | Marking and Cutting Frame | Cladding Leaf | Cladding Frame | Welding | Chemical Filling | Baking | Curing | Dismantle and Cutting | Quality Checking | Assembly | Inspection | Packing |
| 1 | 21 | 9 | 9 | 10 | 6 | 11 | 10 | 24 | 18 | 10 | 10 | 40 | 6 | 25 | 20 | 25 | 13 |
| 2 | 21 | 10 | 8 | 10 | 5 | 9 | 10 | 25 | 17 | 11 | 10 | 40 | 5 | 25 | 19 | 25 | 14 |
| 3 | 22 | 9 | 8 | 10 | 7 | 10 | 11 | 25 | 17 | 10 | 10 | 40 | 6 | 25 | 22 | 25 | 11 |
| 4 | 22 | 8 | 9 | 10 | 6 | 10 | 11 | 22 | 16 | 10 | 10 | 40 | 6 | 25 | 19 | 25 | 12 |
| 5 | 19 | 11 | 9 | 10 | 5 | 9 | 12 | 26 | 15 | 11 | 10 | 40 | 7 | 25 | 17 | 25 | 14 |
| 6 | 25 | 10 | 10 | 10 | 5 | 11 | 8 | 25 | 19 | 12 | 10 | 40 | 7 | 25 | 18 | 25 | 13 |
| 7 | 23 | 8 | 11 | 10 | 5 | 9 | 9 | 24 | 20 | 11 | 10 | 40 | 5 | 25 | 16 | 25 | 13 |
| 8 | 21 | 9 | 9 | 10 | 5 | 10 | 10 | 21 | 19 | 12 | 10 | 40 | 8 | 25 | 19 | 25 | 14 |
| 9 | 24 | 9 | 11 | 10 | 4 | 11 | 11 | 22 | 19 | 10 | 10 | 40 | 5 | 25 | 18 | 25 | 15 |
| 10 | 21 | 10 | 8 | 10 | 6 | 10 | 8 | 25 | 18 | 11 | 10 | 40 | 6 | 25 | 22 | 25 | 13 |
| 11 | 23 | 9 | 9 | 10 | 7 | 9 | 9 | 21 | 20 | 10 | 10 | 40 | 8 | 25 | 20 | 25 | 12 |
| 12 | 21 | 10 | 11 | 10 | 6 | 9 | 12 | 22 | 16 | 10 | 10 | 40 | 9 | 25 | 21 | 25 | 13 |
| 13 | 25 | 11 | 9 | 10 | 7 | 10 | 12 | 23 | 19 | 11 | 10 | 40 | 9 | 25 | 18 | 25 | 14 |
| 14 | 26 | 9 | 10 | 10 | 5 | 9 | 11 | 24 | 20 | 10 | 10 | 40 | 6 | 25 | 17 | 25 | 12 |
| 15 | 24 | 10 | 10 | 10 | 6 | 10 | 12 | 22 | 18 | 10 | 10 | 40 | 9 | 25 | 18 | 25 | 11 |
| (E) | |||||||||||||||||
| S.No. | Double Door (In seconds) | ||||||||||||||||
| Process name | Decoiling and Cutting | time for Serration | Side Bending | Priming | Marking and Cutting Leaf | Marking and Cutting Frame | Cladding Leaf | Cladding Frame | Welding | Chemical Filling | Baking | Curing | Dismantle and Cutting | Quality Checking | Assembly | Inspection | Packing |
| 1 | 22 | 21 | 15 | 10 | 9 | 20 | 20 | 28 | 24 | 12 | 10 | 40 | 7 | 25 | 30 | 30 | 15 |
| 2 | 21 | 20 | 16 | 10 | 7 | 21 | 20 | 27 | 26 | 11 | 10 | 40 | 9 | 25 | 31 | 30 | 14 |
| 3 | 24 | 22 | 15 | 10 | 8 | 19 | 21 | 29 | 21 | 15 | 10 | 40 | 10 | 25 | 29 | 30 | 15 |
| 4 | 23 | 21 | 16 | 10 | 10 | 18 | 21 | 28 | 23 | 12 | 10 | 40 | 11 | 25 | 28 | 30 | 16 |
| 5 | 22 | 20 | 14 | 10 | 11 | 19 | 23 | 27 | 22 | 11 | 10 | 40 | 9 | 25 | 29 | 30 | 17 |
| 6 | 23 | 18 | 12 | 10 | 10 | 17 | 21 | 26 | 21 | 12 | 10 | 40 | 9 | 25 | 31 | 30 | 15 |
| 7 | 24 | 19 | 18 | 10 | 13 | 16 | 21 | 28 | 25 | 11 | 10 | 40 | 10 | 25 | 27 | 30 | 16 |
| 8 | 25 | 19 | 12 | 10 | 9 | 18 | 22 | 29 | 26 | 13 | 10 | 40 | 11 | 25 | 28 | 30 | 14 |
| 9 | 23 | 20 | 16 | 10 | 8 | 19 | 21 | 26 | 24 | 12 | 10 | 40 | 12 | 25 | 29 | 30 | 17 |
| 10 | 23 | 18 | 13 | 10 | 11 | 22 | 20 | 27 | 23 | 11 | 10 | 40 | 9 | 25 | 32 | 30 | 16 |
| 11 | 24 | 19 | 15 | 10 | 10 | 21 | 21 | 28 | 25 | 12 | 10 | 40 | 9 | 25 | 31 | 30 | 13 |
| 12 | 24 | 21 | 19 | 10 | 10 | 18 | 21 | 30 | 22 | 12 | 10 | 40 | 12 | 25 | 32 | 30 | 12 |
| 13 | 22 | 20 | 18 | 10 | 12 | 22 | 21 | 24 | 26 | 12 | 10 | 40 | 11 | 25 | 30 | 30 | 14 |
| 14 | 24 | 23 | 15 | 10 | 10 | 23 | 23 | 28 | 24 | 13 | 10 | 40 | 8 | 25 | 33 | 30 | 16 |
| 15 | 23 | 22 | 13 | 10 | 11 | 18 | 21 | 29 | 25 | 12 | 10 | 40 | 9 | 25 | 27 | 30 | 15 |

Figure A1.
(A) Input analyser graph for cladding frame. (B) Input analyser graph for welding.
References
- Muruganantham, V.R.; Krishnan, P.N.; Arun, K.K. Performance improvement and cost minimisation for manufacturing components in a fabrication plant by the application of Lean with TRIZ principles. Int. J. Product. Qual. Manag. 2013, 12, 449–472. [Google Scholar] [CrossRef]
- Sojka, V.; Lepšík, P. Use of triz, and triz with other tools for process improvement: A literature review. Manag. Prod. Eng. Rev. 2020, 11, 104–122. [Google Scholar] [CrossRef]
- Mourtzis, D. Simulation in the design and operation of manufacturing systems: State of the art and new trends. Int. J. Prod. Res. 2020, 58, 2475–2499. [Google Scholar] [CrossRef]
- Feng, X.; Wan, J. Digital Twins for Discrete Manufacturing Lines: A Review. Big Data Cogn. Comput. 2024, 8, 45. [Google Scholar] [CrossRef]
- Neumann, W.P.; Winkelhaus, S.; Grosse, E.H.; Glock, C.H. Industry 4.0 and the human factor–A systems framework and analysis methodology for successful integration. Comput. Ind. Eng. 2021, 153, 107063. [Google Scholar] [CrossRef]
- Fani, V.; Bucci, I.; Rossi, M.; Bandinelli, R. Lean and industry 4.0 principles toward industry 5.0: A conceptual framework and empirical insights from fashion industry. J. Manuf. Technol. Manag. 2024, 35, 118–143. [Google Scholar] [CrossRef]
- Campos, L.M.S.; Vazquez-Brust, D.A. Lean and green synergies in supply chain management. Supply Chain. Manag. Int. J. 2016, 21, 627–641. [Google Scholar] [CrossRef]
- Karikalan, R.; Sreeharan, B.N.; Baalaje, R.A.; Nitheeshwar, R.K.; Damodaram, A.K. Application of lean thinking for enhancing productivity in an automotive industry. AIP Conf. Proc. 2023, 2869, 030007. [Google Scholar] [CrossRef]
- Saravanan, V.; Nallusamy, S.; George, A. Efficiency enhancement in a medium scale gearbox manufacturing company through different lean tools-A case study. Int. J. Eng. Res. Afr. 2018, 34, 128–138. [Google Scholar] [CrossRef]
- Saravanan, V.; Nallusamy, S.; Balaji, K. Lead time reduction through execution of lean tool for productivity enhancement in small scale industries. Int. J. Eng. Res. Afr. 2018, 34, 116–127. [Google Scholar] [CrossRef]
- Nallusamy, S.; Majumdar, G. Enhancement of Overall Equipment Effectiveness using Total Productive Maintenance in a Manufacturing Industry. Int. J. Perform. Eng. 2017, 13, 173–188. [Google Scholar] [CrossRef]
- Kulkarni, P.P.; Kshire, S.S.; Chandratre, K.V. Productivity improvement through lean deployment and work study methods. Int. J. Res. Eng. Technol. 2014, 3, 429–434. [Google Scholar] [CrossRef]
- Shriram, K.R.; Karthiban, S.K.; Kumar, A.C.; Mathiarasu, S.K.; Saleeshya, P.G. Productivity improvement in a paper manufacturing company through lean and IoT-a case study. Int. J. Bus. Syst. Res. 2023, 17, 97–119. [Google Scholar] [CrossRef]
- Maia, L.C.; Alves, A.C.; Leão, C.P. How could the TRIZ tool help the continuous improvement efforts of the companies? Procedia Eng. 2015, 131, 343–351. [Google Scholar] [CrossRef][Green Version]
- Elyoussoufi, S.; Mazouzi, M.; Cherrafi, A. TRIZ and LSS integrated models assessment: A holistic model development for organisations’ excellence. In Proceedings of the 2nd Indian International Conference on Industrial Engineering and Operations Management, Warangal, India, 16–18 August 2022; IEOM Society International: Southfield, MI, USA, 2022; pp. 1–12. [Google Scholar]
- Anuar, A.; Sadek, D.M.; Kheng, L.K.; Ghazali, M.F.; Hasan, M.Z.; Habidin, N.F. Issues Faced by Micro Businesses during COVID-19: The Integration of Lean Practices and TRIZ. Inf. Manag. Bus. Rev. 2023, 15, 122–130. [Google Scholar] [CrossRef]
- Bassuk, J.A.; Washington, I.M. The A3 problem-solving report: A 10-step scientific method to execute performance improvements in an academic research vivarium. PLoS ONE 2013, 8, e76833. [Google Scholar] [CrossRef]
- Jhony, J.; Thenarasu, M. Productivity Enhancement in A Pressure Vessel Manufacturing Industry Using Lean Principles. Int. J. Innov. Technol. Explor. Eng. 2019, 8, 3272–3279. [Google Scholar]
- Das, B.; Venkatadri, U.; Pandey, P. Applying a lean manufacturing system to improve the productivity of air-conditioning coil manufacturing. Int. J. Adv. Manuf. Technol. 2014, 71, 307–323. [Google Scholar] [CrossRef]
- Venugopal, V.; Saleeshya, P.G. Productivity improvement through the development of sustainability metrics in the wire manufacturing industry. Int. J. Product. Qual. Manag. 2023, 39, 1–19. [Google Scholar] [CrossRef]
- Muthuvel, R.; Sharieff, M.; Thenarasu, M. Productivity Enhancement through introducing Lean Principles in Multi-Model Assembly Line. Int. J. Eng. Adv. Technol. 2019, 8, 2476–2482. [Google Scholar]
- Jasiulewicz-Kaczmarek, M.; Saniuk, A. How can we make maintenance processes more efficient using lean tools? In Advances in Social & Occupational Ergonomics; Goossens, R.H.M., Ed.; Springer International Publishing: Berlin/Heidelberg, Germany, 2018; pp. 9–20. [Google Scholar] [CrossRef]
- Neves, P.; Silva, F.J.G.; Ferreira, L.P.; Pereira, T.; Gouveia, A.; Pimentel, C. Implementing lean tools in the manufacturing process of trimmings products. Procedia Manuf. 2018, 17, 696–704. [Google Scholar] [CrossRef]
- Sobek II, D.K.; Jimmerson, C. A3 reports: A tool for process improvement. In IIE Annual Conference, Proceedings; Institute of Industrial and Systems Engineers (IISE): Peachtree Corners, GA, USA, 2004. [Google Scholar]
- Aziz, R.F.; Hafez, S.M. Applying lean thinking in construction and performance improvement. Alex. Eng. J. 2013, 52, 679–695. [Google Scholar] [CrossRef]
- Abbes, N.; Sejri, N.; Xu, J.; Cheikhrouhou, M. New Lean Six Sigma readiness assessment model using fuzzy logic: Case study within clothing industry. Alex. Eng. J. 2022, 61, 9079–9094. [Google Scholar] [CrossRef]
- Roldán Bravo, M.I.; Maqueira-Marin, J.M.; Moyano-Fuentes, J. Supply chain 4.0 ambidexterity and lean supply chain management: Interrelationships and effect on the focal firm’s operational performance. Supply Chain. Manag. Int. J. 2023, 28, 112–128. [Google Scholar] [CrossRef]
- Soufi, Z.; Mestiri, S.; David, P.; Yahouni, Z.; Fottner, J. A material handling system modeling framework: A data-driven approach for the generation of discrete-event simulation models. Flex. Serv. Manuf. J. 2025, 37, 67–96. [Google Scholar] [CrossRef]
- Grenzfurtner, W.; Pichler, E.; Gronalt, M. Increasing the output of mixed-model assembly lines for industrialised housebuilding: Learnings from a case-based simulation study. Int. J. Prod. Res. 2025, 63, 3192–3207. [Google Scholar] [CrossRef]
- Collins, A.J.; Sabz Ali Pour, F.; Jordan, C.A. Past challenges and the future of discrete event simulation. J. Def. Model. Simul. 2023, 20, 351–369. [Google Scholar] [CrossRef]
- Mazumder, S.; Padmanabhan, S.; Thenarasu, M. Assembly line balancing and workstation design for a manufacturing industry. Int. J. Sci. Technol. Res. 2020, 9, 6470–6475. [Google Scholar]
- Thenarasu, M.; Rameshkumar, K.; Di Mascolo, M.; Anbuudayasankar, S.P. Multi-criteria scheduling of realistic, flexible job shop: A novel approach for integrating simulation modelling and multi-criteria decision making. Int. J. Prod. Res. 2024, 62, 336–358. [Google Scholar] [CrossRef]
- Mohanavelu, K.; Rameshkumar, K.; Prakash, M. Simulation modelling and development of analytic hierarchy process-based priority dispatching rule for a dynamic press shop. Int. J. Ind. Syst. Eng. 2017, 27, 340–364. [Google Scholar] [CrossRef]
- Rahman, C.; Sabuj, S.U. Process flow improvement proposal of a batch manufacturing system using arena simulation modelling. Rev. Gen. Manag. 2015, 21, 63–77. [Google Scholar]
- Neeraj, R.R.; Pranav Nithin, R.; Niranjhan, P.; Sumesh, A.; Thenarasu, M. Modelling and Simulation of discrete manufacturing industry. Mater. Today Proc. 2018, 5, 24971–24983. [Google Scholar] [CrossRef]
- John, B.; James, J.; Rengaraj, R. Analysis and optimisation of plant layout using relative allocation of facilities technique. Int. J. Emerg. Technol. Adv. Eng. 2013, 3, 415–422. [Google Scholar]
- Thenarasu, M.; Ramesh Kumar, K.; Anbuudayasankar, S.P.; Arjunbarath, G.; Ashok, P. Development and selection of hybrid dispatching rule for dynamic job shop scheduling using multi-criteria decision making analysis (MCDMA). Int. J. Qual. Res. 2020, 14, 487–494. [Google Scholar] [CrossRef]
- Brunzini, A.; Peruzzini, M.; Barbadoro, P. Human-centred data-driven redesign of simulation-based training: A qualitative study applied on two use cases of the healthcare and industrial domains. J. Ind. Inf. Integr. 2023, 35, 100505. [Google Scholar] [CrossRef]
- Shawki, K.M.; Kilani, K.; Gomaa, M.A. Analysis of earth-moving systems using discrete-event Simulation. Alex. Eng. J. 2015, 54, 533–540. [Google Scholar] [CrossRef]
- Scurati, G.W.; Ferrise, F.; Bertoni, M. Extended realities and discrete events simulations: A systematic review to define design trade-offs and directions. Comput. Ind. 2025, 164, 104188. [Google Scholar] [CrossRef]
- Turner, C.J.; Garn, W. Next generation DES simulation: A research agenda for human-centric manufacturing systems. J. Ind. Inf. Integr. 2022, 28, 100354. [Google Scholar] [CrossRef]
- Ghasemi, A.; Farajzadeh, F.; Heavey, C.; Fowler, J.; Papadopoulos, C.T. Simulation optimisation applied to production scheduling in the era of industry 4.0: A review and future roadmap. J. Ind. Inf. Integr. 2024, 39, 100599. [Google Scholar] [CrossRef]
- Cimino, C.; Negri, E.; Fumagalli, L. Review of digital twin applications in manufacturing. Comput. Ind. 2019, 113, 103130. [Google Scholar] [CrossRef]
- Jiang, H.; Qin, S.; Fu, J.; Zhang, J.; Ding, G. How to model and implement connections between physical and virtual models for digital twin application. J. Manuf. Syst. 2021, 58, 36–51. [Google Scholar] [CrossRef]
- Sakr, A.H.; Aboelhassan, A.; Yacout, S.; Bassetto, S. Building discrete-event simulation for digital twin applications in production systems. In Proceedings of the 2021 26th IEEE International Conference on Emerging Technologies and Factory Automation (ETFA), Västerås, Sweden, 7–10 September 2021; IEEE: New York, NY, USA, 2021; pp. 1–8. [Google Scholar]
- Karakra, A.; Fontanili, F.; Lamine, E.; Lamothe, J. A discrete event simulation-based methodology for building a digital twin of patient pathways in the hospital for near real-time monitoring and predictive simulation. Digit. Twin 2022, 2, 1–24. [Google Scholar] [CrossRef]
- Ricondo, I.; Porto, A.; Ugarte, M. A digital twin framework for the simulation and optimization of production systems. Procedia CIRP 2021, 104, 762–767. [Google Scholar] [CrossRef]
- Morabito, L.; Ippolito, M.; Pastore, E.; Alfieri, A.; Montagna, F. A discrete event simulation-based approach for digital twin implementation. IFAC-PapersOnLine 2021, 54, 414–419. [Google Scholar] [CrossRef]
- Wooley, A.; Silva, D.F.; Bitencourt, J. When is a simulation a digital twin? A systematic literature review. Manuf. Lett. 2023, 35, 940–951. [Google Scholar] [CrossRef]
- Thenarasu, M.; Sakthi Balaji, S.; Sumesh, A.; Narassima, M.S.; Rameshkumar, K.; Babaee Tirkolaee, E. Enhancing the productivity of mould shop using continuous improvement tools and simulation. Int. J. Syst. Sci. Oper. Logist. 2024, 11, 2425014. [Google Scholar] [CrossRef]
- Thenarasu, M.; Pai, V.; Narassima, M.S.; Rousseau, J.; McDermott, O.; Gedam, V.V. Inventory policy in closed-loop supply chain: A simulated case study analysis. Int. J. Manag. Sci. Eng. Manag. 2025, 1–15. [Google Scholar] [CrossRef]
- Patel, A.V.; Patel, V.P.; Bansal, P.; Bhuva, B.V. Optimization and Performance Analysis of Submerged Arc Welding: Influence of Bead Geometry, Process Parameters, and Heat-Affected Zone-A review. Int. Res. J. Eng. Technol. 2025, 12, 1012–1015. [Google Scholar]
- Nand, S.; Singh, P.K. Effect of addition of metal powder on deposition rate, mechanical properties, and metallographic property of weld joints during Submerged Arc Welding process. J. Mach. Form. Technol. 2014, 6, 159–174. [Google Scholar]


Disclaimer/Publisher’s Note: The statements, opinions and data contained in all publications are solely those of the individual author(s) and contributor(s) and not of MDPI and/or the editor(s). MDPI and/or the editor(s) disclaim responsibility for any injury to people or property resulting from any ideas, methods, instructions or products referred to in the content. |
© 2025 by the authors. Licensee MDPI, Basel, Switzerland. This article is an open access article distributed under the terms and conditions of the Creative Commons Attribution (CC BY) license (https://creativecommons.org/licenses/by/4.0/).