Article

Thermo-Hydro-Mechanical–Chemical Modeling for Pressure Solution of Underground sCO2 Storage

Petroleum and Natural Gas Engineering Department, Middle East Technical University (METU), ODTÜ Üniversiteler Mah. Dumlupınar Blv. No:1, Çankaya, 06800 Ankara, Turkey
Modelling 2025, 6(3), 59; https://doi.org/10.3390/modelling6030059
Submission received: 15 May 2025 / Revised: 16 June 2025 / Accepted: 23 June 2025 / Published: 1 July 2025

Abstract

Underground production and injection operations result in mechanical compaction and mineral chemical reactions that alter porosity and permeability. These changes impact the flow and, eventually, the long-term sustainability of reservoirs utilized for CO2 sequestration and geothermal energy. Even though mechanical and chemical deformations in rocks take place at the pore scale, it is important to investigate their impact at the continuum scale. Rock deformation can be examined using intergranular pressure solution (IPS) models, primarily for uniaxial compaction. Because the reaction rate parameters are estimated using empirical methods and the assumption of constant mineral saturation indices, these models frequently overestimate the rates of compaction and strain by several orders of magnitude. This study presents a new THMC algorithm by combining thermo-mechanical computation with a fractal approach and hydrochemical computations using PHREEQC to evaluate the pressure solution. Thermal stress and strain under axisymmetric conditions are calculated analytically by combining a derived hollow circle mechanical structure with a thermal resistance model. Based on the pore scale, porosity and its impact on the overall excessive stress and strain rate in a domain are estimated by applying the fractal scaling law. Relevant datasets from CO2 core flooding experiments are used to validate the proposed approach. The comparison is consistent with experimental findings, and the novel analytical method allows for faster inspection compared to numerical simulations.

1. Introduction

The compaction of minerals and their chemical reactions result in alterations in porosity and permeability, ultimately impacting the flow and operational lifetime of the reservoir. Assessment of thermo-hydro-mechanical–chemical (THMC) coupling and intergranular pressure solution (IPS) creep to depict the mineral compaction mechanism is important, particularly from an economic standpoint in reservoirs used for hydrocarbon production, geothermal operations, underground CO2 sequestration, and hydrogen storage processes [1,2,3].
Numerous experiments have been conducted to capture, extract, and store CO2 in depleted hydrocarbon reservoirs and other geological formations [4,5,6,7,8].
Large-scale CO2 injections into geologic formations can result in a variety of interrelated effects, including chemical, mechanical, thermal, and hydrodynamic interactions. Nonetheless, the inspections are primarily divided into two categories: mechanical and chemical.
Li et al. [9] developed an integrated modeling framework to combine the acid stimulation and CO2 flooding processes independently under immiscible and miscible circumstances. Their findings show that for acid stimulation, field-scale simulations generally reproduce the usual dissolving patterns and the ideal acid injection rate that corresponds to the lowest acid breakthrough volume. The dissolving patterns cause CO2 fingering in the simulation of CO2 floods. Giovannetti et al. [10] investigated hydration processes of CO2 that are important for underground storage sites. The authors produced three hydrate types: CO2 hydrate in pure water, in sand, and CO2/CH4 hydrate. Replacement tests were conducted via depressurization and thermal stimulation. According to their findings, CO2 hydrates in pure water formed uniform crystals, while those in sand were more compact. CH4/CO2 gas hydrates contained the highest CO2 concentration, indicating effective replacement.
Eigbe et al. [5] highlighted geomechanical risks. In particular, the authors pointed out that the faults or fractures could be a pathway for CO2 transport, where the rock may collapse due to stress, and concluded that the injection pressure, injection rate, and depth estimation are essential parameters for safe CO2 sequestration. In their investigation, they ignored chemical interactions. To determine the variables governing mineral chemical reactions for CO2 sequestration, Pachalieva et al. [4] conducted a series of flow and reactive transport simulations in three-dimensional fracture networks. They disregarded the mechanical impact, in contrast to Eigbe et al. [5]. Recently, Zhuang et al. [8] proposed a hybrid approach that solely considers chemical interactions and hydrodynamic processes for the life-cycle prediction and optimization of a CO2 mixture and sequestration in tight oil reservoirs.
THMC process and IPS creep have been assessed with experiments [11,12,13], analytical solutions [14,15,16], and numerical models, particularly on a pore scale and upscaled to continuum models [17,18,19,20,21,22,23].
Through a reaction–diffusion chemical process inside a chemically closed system, the IPS creep mechanism, which is based on spherical cubic-packed grains and is driven by temperature-dependent stress, results in changes in the morphologies of mineral grains [24,25,26]. The IPS model mechanism takes into account (i) the effect of diffusive transport in a thin water film at grain-to-grain contacts [26,27]. The measurements show that the thin water film transmits the normal stress across the grain contacts to compress, and its thickness ranges from 1 to 100 nm depending on the depth [28,29]. (ii) Mineral dissolution at grain-to-grain contacts and precipitation in the pore space [30,31]. Under constant rates of precipitation and dissolution, the models approximately represent the strain rate.
Spiers et al. [32] have formulated analytical equations for IPS creep under uniaxial compaction, assuming linear kinetic relationships between chemical dissolution and precipitation rates. Similar models also estimate compaction occurring at slightly higher porosities as a makeshift solution [16]. According to Lang et al. [33], the observed compaction rates were not adequately described by existing pressure solution models but were attributed to other mechanisms, such as stress corrosion [34]. Moreover, Wheeler [35] suggests establishing the impact of stress on the thermodynamic equilibrium if a quantitative model can replicate the reaction pathway.
The IPS models often overestimate compaction and strain rates by several orders of magnitude, mainly when the porosity is below 0.2 [14,15]. This occurs because the reaction rate parameters are estimated based on empirical equations, assuming constant saturation indices of minerals. Furthermore, the rate of change in grain diameters is considered steady. Van den Ende et al. [6] have proposed a modified thermodynamic IPS model that introduces an upscaled equation to capture the physics at a lower porosity.
The IPS models successfully imitated the observations in experiments, particularly uniformly compacted homogeneous minerals [36]. However, natural samples have heterogeneity and distorted grain shapes.
The grain shape preferred orientation (SPO) provides a quantitative understanding of the mechanical strength and reaction surfaces [37,38,39]. During dissolution–precipitation, mass redistribution from highly to low-stressed surfaces is essential for acquiring SPO [40,41]. Malvoisin and Baumgartner [16] developed a model for reaction under stress by considering the SPO approach with reaction kinetics and dissolved aqueous species transport. The model allows creep laws to be determined for pressure solution and dissolution–precipitation. The model predictions are compared to observations in metasediments. According to Malvoisin and Baumgartner [16] and Zhang et al. [11], pressure solution creep in sandstones is influenced by the saturation state of the pore fluid, with under-saturation accelerating creep and super-saturation retarding it. Recently, a unified analytical model that couples diffusion and reaction during pressure solution was presented by Wang and Gilbert [42]. The study focuses on the steady-state solution, where the normal stress and the dissolution reaction rate remain constant over time.
A complete numerical solution of the coupled THMC equation system can achieve a more accurate approximation. Moreover, utilizing thermodynamic databases and conducting iterative time-dependent calculations of chemical mass balance in a geochemical computation program such as PHREEQC, developed by Parkhurst and Appelo [43], or a more sophisticated numerical tool, TOUGHREACT, can provide stable solutions [44].
Kolditz et al. [45] summarized a large range of numerical methods that have been developed and experimentally tested to describe coupled hydro-mechanical and thermo-mechanical fracture processes in crystalline greywacke and gneiss rock samples in two main projects, DECOVALEX [46] and SAFENET. The task teams in these projects were introduced, applied, and compared for both continuum and discontinuum methods for simulating related fracture processes. In some cases, their study was restricted to poro-elasticity because plasticity requires even more parameters, which are hard to ascertain from experimental data.
Liu et al. [47] propose a theoretical algorithm for recovery enhancement efficiency in coalbed methane displacement by a hot flue. They used the validated parameters in the THMC coupling model to study the mechanism of gas recovery enhanced by hot flue gas. However, their theoretical results were not validated with any experimental data.
Zhang et al. [48] inspected THMC processes for heat extraction from hot dry rock reservoirs. The authors presented a THMC coupling model that uses the extended finite volume technique to address mechanical deformation and the finite volume approach to solve fluid flow, heat transport, and chemical processes. For multicomponent reactions at high temperatures and high pressures, the reaction module integrates PHREEQC. The correctness and computational performance of the model are verified by comparing it with experimental data for mineral reactions at high temperatures and high pressures, as well as extended finite volume and finite element method COMSOL, version 5.3, simulations for displacement fields.
Yasuhara et al. [17] used COMSOL Multiphysics coupled with PHREEQC, Lang et al. [33] and Taron and Elsworth [49] used TOUGHREACT coupled with a mechanical process. However, a three-dimensional (3D) numerical model is typically challenging due to the widely disparate physical scales and reaction kinetic rates of THMC processes. McDermott et al. [19] used hybrid numerical methods to combine the advantages of numerical solutions with physically based analytical models, reducing the computational demands and increasing flexibility. Furthermore, Lang et al. [33] studied the pore-scale numerical model developed by Bernabé and Evans [20], based on single, axisymmetric grain contacts to three-dimensional models of randomly rough, self-affine surfaces.
Ciantia and Hueckel [50] present an analytical chemo-mechanical coupled hollow circle model segregated into critical and compaction zones at a single pore scale. Furthermore, an upscaling process is integrated to calibrate the mesoscale parameters using macroscopic experiments, allowing for identifying material constants such as the strain rate and mass removal rate at different scales. This model considers strain-hardening and chemical-softening constants and ignores the thermal changes.
Ilgen et al. [51] addressed the consequences of calcarenite dissolution under stressed conditions. The study utilizes a multiscale approach involving three scales: micro-scale, simulating chemistry and kinetic laws; meso-scale, quantifying chemically enhanced mechanical damage; and macro-scale, modeling a reactive porous continuum for large-scale computations. Experimental data, including laboratory experiments on calcarenite, are used for the inter-scale identification of model parameters. Despite its complexity, the chosen geometry of the representative elementary volume (REV) allows for a semi-analytical solution. The upscaling procedure reveals that the macroscopic mass removal rate is proportional to the macroscopic volumetric plastic strain.
Another point to be addressed is that natural samples have heterogeneity and consist of cementations as clay or carbonates, precipitated on the surface of a primary mineral such as quartz [52]. Chemical reactions and compactions mainly occur in cemented secondary minerals. Therefore, cementation along strained mineral boundaries is a crucial component to include in any model of the dissolution–precipitation process in rocks. For instance, CO2–brine interactions can lead to the dissolution of carbonate cement in sandstone, affecting its mechanical properties and failure strength [3]. According to Vafaie et al. [53], it is challenging to imitate a supercritical CO2 sequestration into a porous rock and requires laboratory testing under various CO2 exposure and physical constraints. Industrial-scale CO2 injection in a reservoir, as illustrated in Figure 1, intermediate-scale rock laboratory tests, and laboratory-scale observations can all be theoretically correlated with the use of coupled THMC modeling injection [54]. The development of THMC constitutive models applicable to many types of rocks should be the focus of future studies. However, Ilgen et al. [51] and Viswanathan et al. [2] stated that evaluations of fully coupled THMC models are rare due to their complexity.
The objective of this study is to propose a novel coupled analytical THMC model developed particularly for the pressure solution process in porous media and to provide more accurate results than the traditional IPS model for the inspection of CO2 sequestration operations.

2. Methods

In most of the THMC reservoir modeling exercises, similar coupling processes were considered, and simplified mechanical solutions can be used as axisymmetric approximations for more complicated pore geometries in a porous medium. For instance, analytical solutions for a point heat source in a thermo-poro-elastic medium and plane line discontinuity in a poro-elastic medium are used as a common basis for classic hydro-mechanical and thermo-hydro-mechanical benchmark exercises [45,46]. Moreover, PHREEQC has been integrated into the process of most of the previous THMC numerical simulation processes for geochemical computations [1,17,48]. In this study, similar analytical solution assumptions are implemented as a point heat source in the thermo-mechanical process, the line heat source theory for the heat flow advection, and PHREEQC for the geochemical computations. Moreover, fractal law is incorporated for upscaling from the pore scale to the continuum. When compared to numerically coupled THMC processes, this overall analytical integration yields faster predictions and more accurate estimations than the traditional IPS approach.
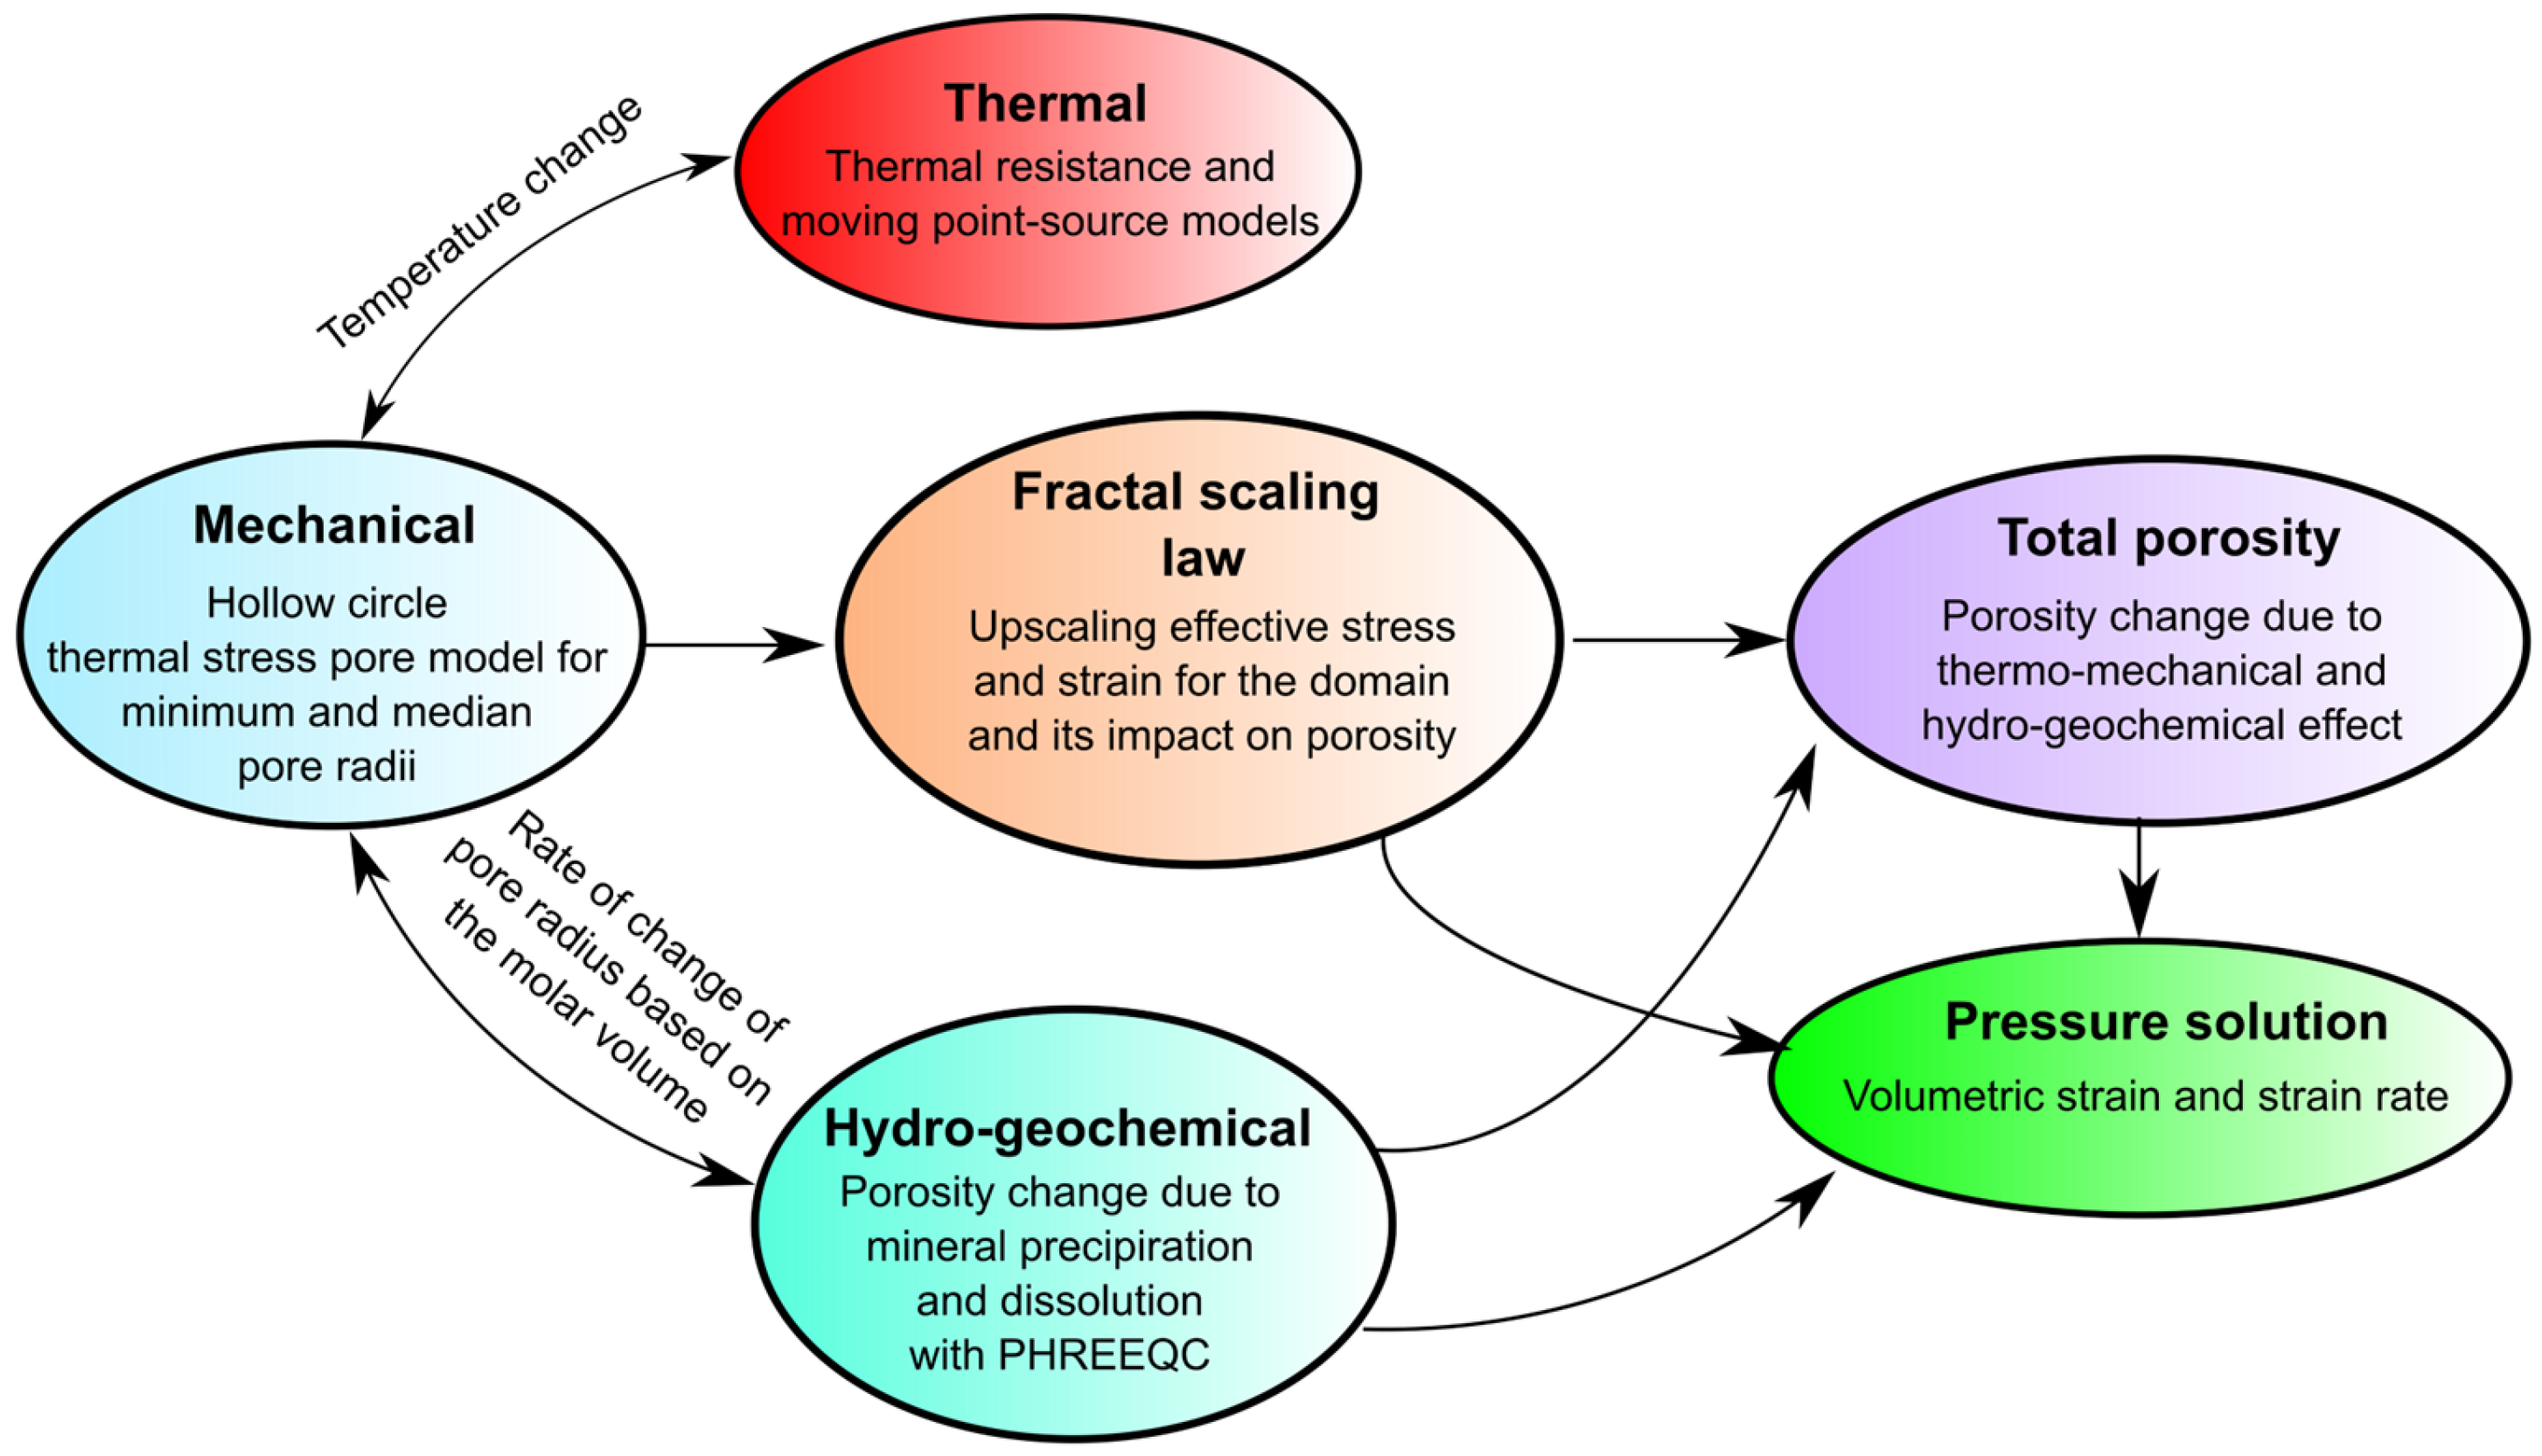
The proposed algorithm combines thermo-mechanical computation with conventional hydrochemical calculation with IPHREEQC [43]. In both coupling processes, the porosity changes due to thermo-mechanical compaction/dilatation or mineral precipitation/dissolution, due to brine–CO2–mineral interaction. The process is iteratively calculated between these two coupled processes. In PHREEQC, the molar volume change in secondary minerals is computed with kinetic rate laws. The rate of change in volume is calculated, and the alteration in the radius of minerals is taken into account for the next step in the thermo-mechanical calculation. The entire coupled process is computed in MATLAB R2024b, including the IPHREEQC module. The schematic demonstration of the process is illustrated in Figure 2.
Thermal computation is assessed using a thermal resistance model and paired with a hollow circle mechanical model to evaluate thermal stress and strain in axisymmetric conditions. The thermo-mechanical model is depicted in a single pore scale segregated into two segments: the interior zone of the pore wall represents the cementation of a secondary mineral, and the secondary external zone depicts the primary minerals. Ciantia and Hueckel [50] and Ilgen et al. [51] use a similar hollow circle assumption to assess the chemo-mechanical properties in compaction zones at a single pore scale. The fractal scaling law with the power law cumulative distribution function (CDF) is used to predict the porosity and its impact on the total stress occurring in a domain.
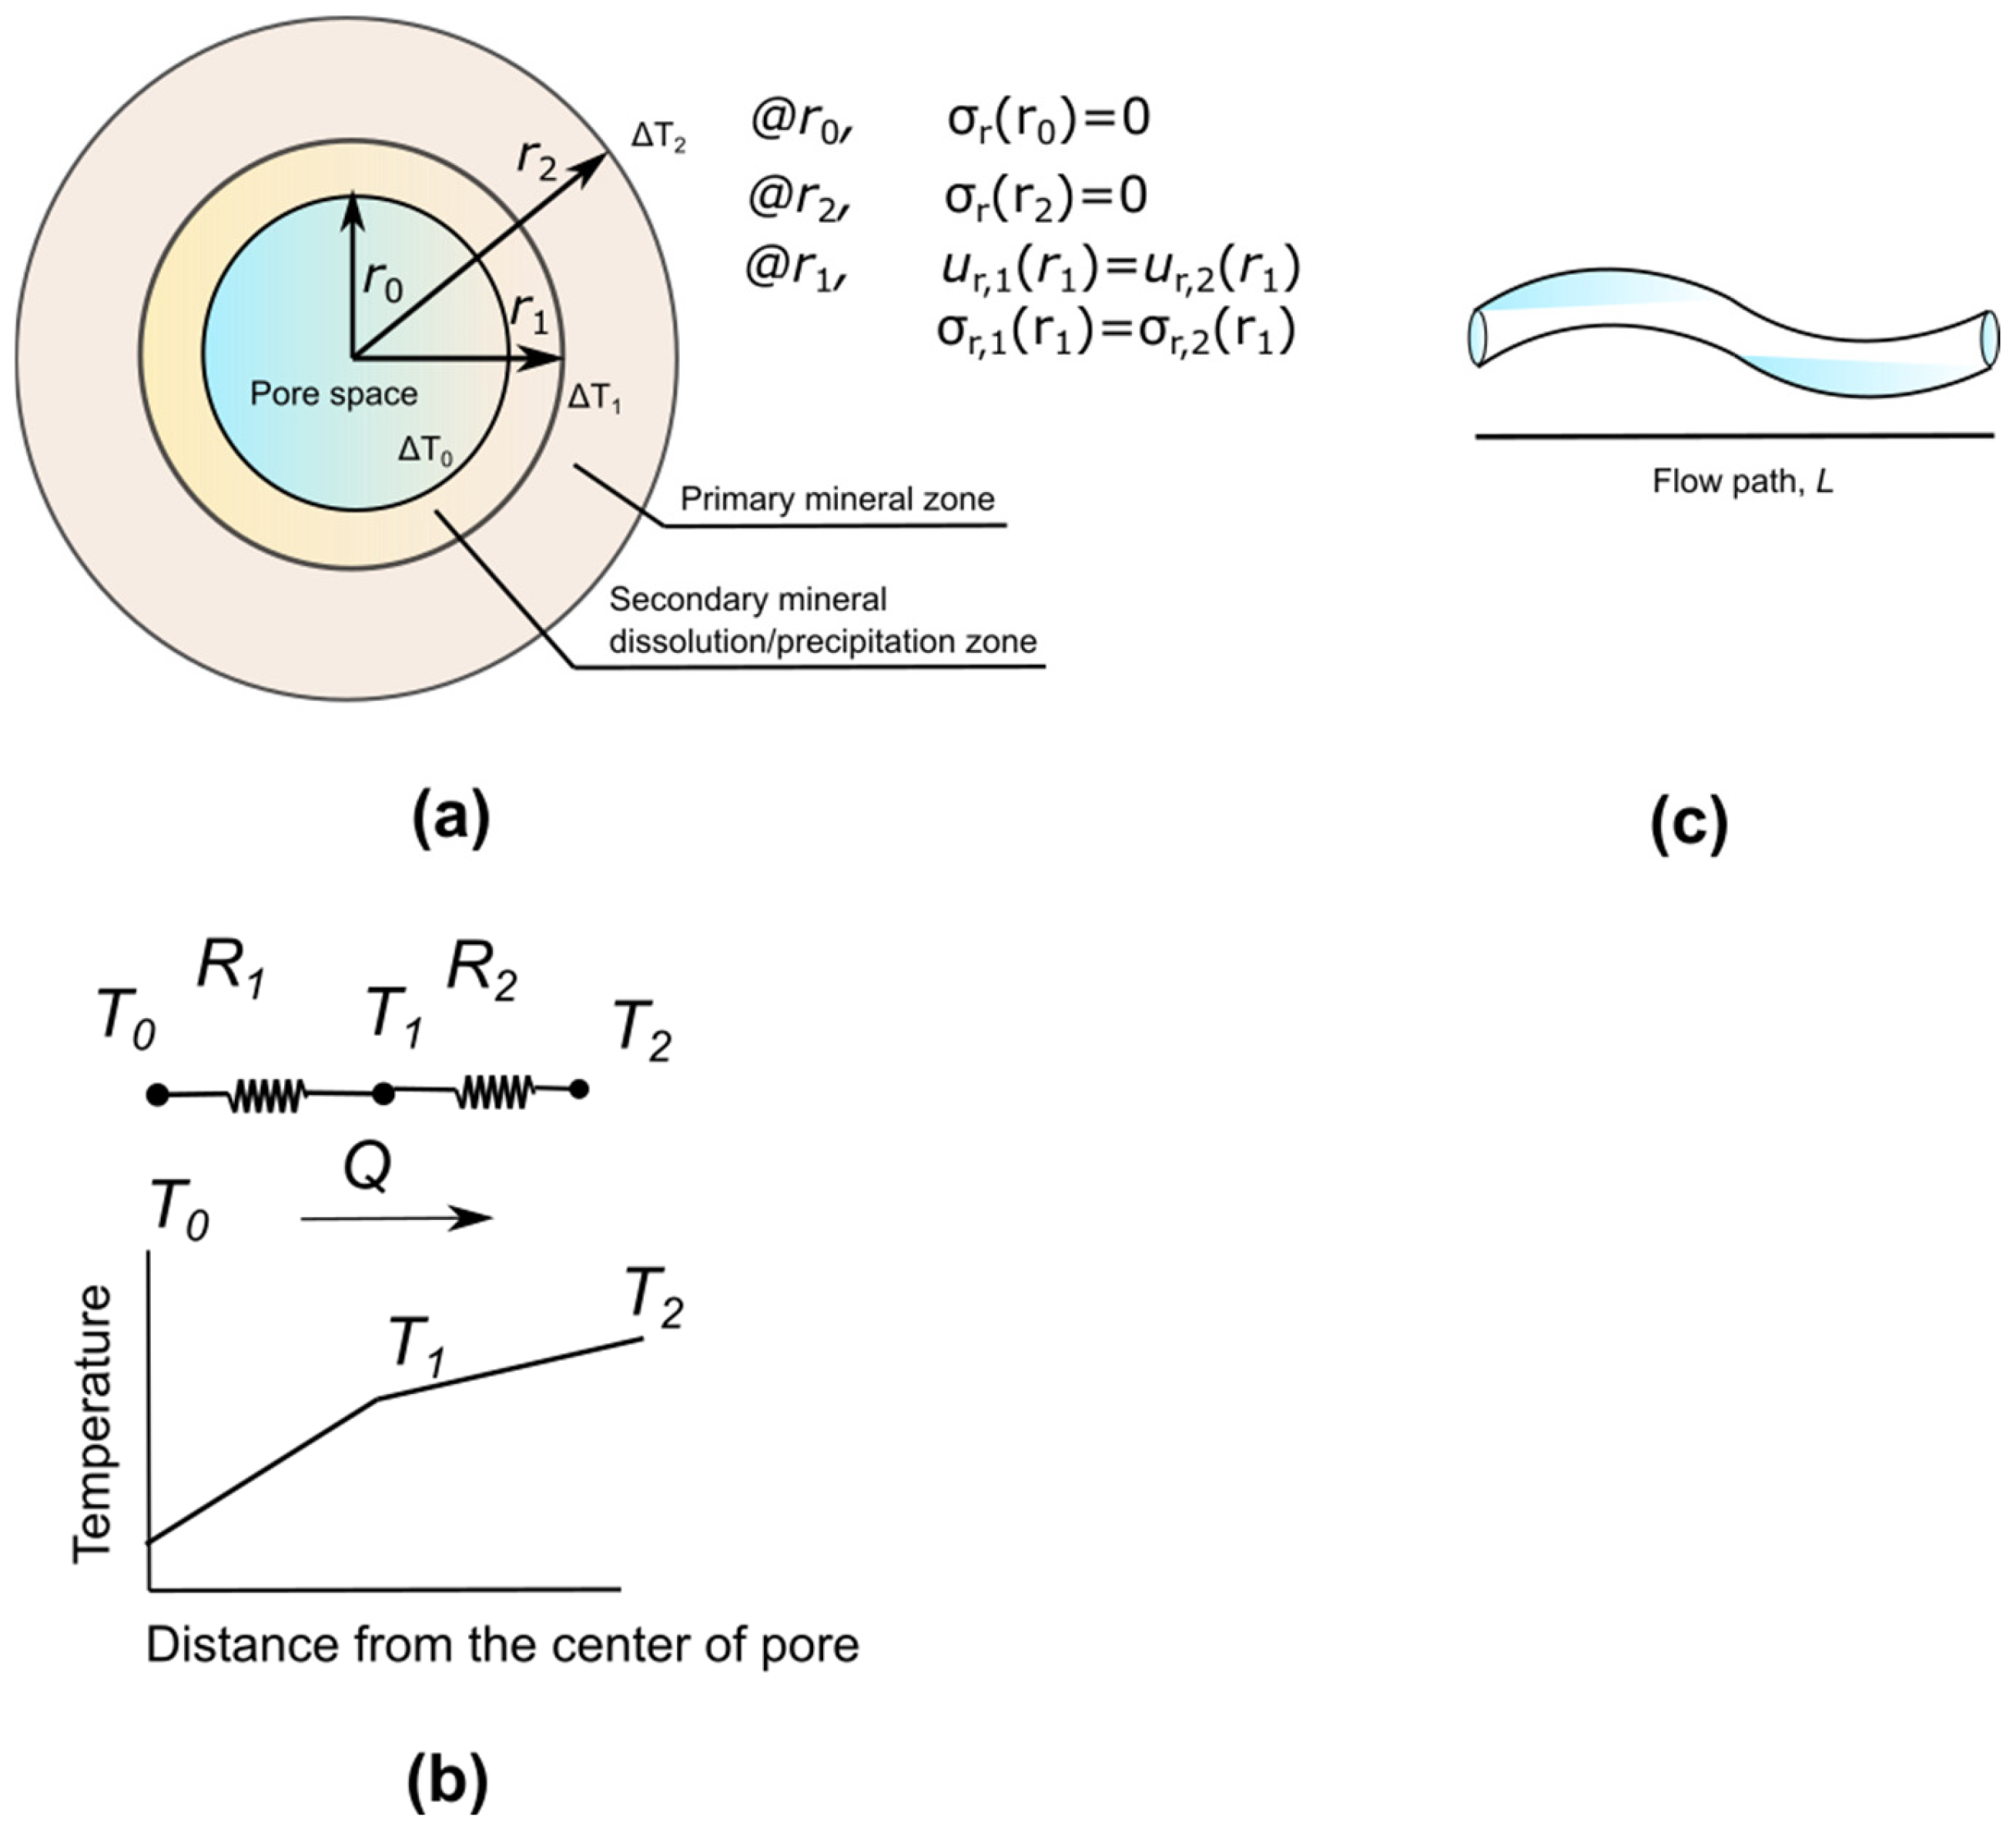
The thermal stress in a pore space is analytically solved with an axisymmetric two-hollow circle model in a plane strain. In the pore, the inner circle represents the secondary precipitated mineral, while the outer circle depicts the primary mineral. The following are the presumed boundary conditions of the two combined hollow circles problem (Figure 1).
The inner boundary of the hollow circle describing the secondary mineral for r = r0 and the outer boundary delineating the primary mineral for r = r2 are free of stress. It is assumed that another pore space may exist at r2, which is thought to be a grain diameter distance.
At radius r = r1, the radial displacement and radial stress of secondary and primary minerals are equal. Thus, the two thermo-mechanical problems between the two hollow circles are connected.
A moving point-source model that accounts for the thermal resistances of the minerals and the injected sCO2 temperature is used to calculate the temperature change as a function of time at the inner radius r0. The proportional temperature gradient through the outer radius r2 is calculated based on the thermal resistances of minerals.

2.1. Thermo-Mechanical

The thermo-mechanical equations for the hollow circle geometry under plane-strain conditions are compiled. The equation for the momentum equilibrium in cylindrical coordinates of axisymmetry is given as [55,56]
σ r r + 1 r σ r σ θ = 0
r is the radial distance, and σr and σθ are the radial and tangential stresses, respectively. The components of the strain tensor are given as
ε r = u r r , ε θ = 1 r u θ θ + u r
ur is the radial displacement in the circle.
According to poro-elastic theory, Biot’s effective stress σef, which is derived from the total stress σT and pore pressures of brine Pb and CO2 PCO2, determines both the deformations and the strengths [57]:
σ e f = σ T P b S b P C O 2 S C O 2 b
Sb and SCO2 are the saturation ratios of brine and CO2. The relationship between these parameters is given as Sb = 1 − SCO2, and SCO2 increases over time as the injected sCO2 penetrates the pore space along the distance. b is Biot’s coefficient, which can be calculated depending on the bulk modulus of the drained porous medium K0 and of the mineral grain Ks as b = 1 − K0/Ks. Ks depends on the porosity. Corey–Brooks-type functions for saturation ratios and pressure can be used [58,59].
The generalized Hooke’s law in 2D plane-strain equations combined with Biot’s poro-elastic definition provides the following stress–strain relationship: The stress–strain can be correlated including pore pressure for isotropic and linear thermo-elastic rock under non-isothermal conditions in cylindrical coordinates [55,60]:
σ r , T = E 1 + ν 1 2 ν ν ε θ + 1 v ε r α δ T ( 1 + ν ) + P l S l + P C O 2 S C O 2 b
σ θ , T = E 1 + ν 1 2 ν ν ε r + 1 v ε θ α δ T ( 1 + ν ) + P l S l + P C O 2 S C O 2 b
in which E is the elasticity modulus (Young’s modulus), υ is the expansion ratio (Poisson’s ratio), and α is the linear thermal expansion coefficient. The thermal impact on the stress state is embedded in the term αδT (1 + ν). The tensile stress is presumed to be positive by sign convention.
The displacement ur as a function of the radius with two integral constants is obtained by substituting the specific solution of the strain components (Equation (2)) into the stress equations (Equations (4) and (5)) and solving them in Equation (1) concerning the boundary conditions defined above. The complete derivation can be found in Appendix A.
The radial and tangential strains that account for Biot’s effective stress are obtained as follows:
ε r = 1 + ν α δ T P l S l + P C O 2 S C O 2 b α E 1 + ν α F r 2 + G H r 2
ε θ = 1 + ν α F r 2 + G + H r 2
where F is the integration of temperature difference ∫δTτdτ concerning the radial distance r, solved in Appendix A (Equations (A5)–(A7)), and G and H are the integral constants.
This set of equations is the general solution for a circle’s thermo-elastic problem, assuming an axisymmetrical temperature distribution. The current issue combines two hollow circle problems, as described in Figure 2. Consequently, four integration constants must be determined: G1 and H1 for the secondary mineral at the inner circle, and G2 and H2 for the primary mineral problem at the outer circle. The characteristic properties of the secondary and primary minerals are denoted by subscripts 1 and 2, respectively. A detailed breakdown of these constants was determined based on the particular boundary conditions of the current problem, which can be found in Appendix B.
The radial and tangential thermal effective stress components on the inner and outer circle minerals around a pore can be computed from the following generalized equations based on the corresponding mineral parameters by substituting the subscript as follows:
σ r = E α F r 2 H 1 + ν r 2 + G 1 + ν 1 2 ν ν α δ T 1 2 ν + ν P l S l + P C O 2 S C O 2 b
σ θ = E α F r 2 + H 1 + ν r 2 + G 1 + ν 1 2 ν + ν 1 α δ T 1 2 ν + 1 ν P l S l + P C O 2 S C O 2 b
The temperature distribution along the radius of a hollow circle in an axisymmetric temperature field can be defined at the two boundaries.
The analytical function of the Laplace equation for temperature change is given as
δ T = T s T w ln r
δT is based on the steady-state condition. In our instance, however, the temperature evolution at the problem boundaries ΔT0, ΔT1, and ΔT2 accounts for the time-dependent effect, with the temperature profile evolution being viewed as a series of steady-state conditions. The validity of this approach can be attributed to the short distance between the heat source and the mineral outer radial distance under consideration, which allows for rapid heat transfer to the equilibrium.
In Equation (10), Ts can be calculated as
T s = Δ T i n n e r ln r o u t e r ln r o u t e r ln r i n n e r + Δ T o u t e r ln r i n n e r ln r i n n e r ln r o u t e r
where ΔTinner and ΔTouter are the temperature variations at the boundary, and rinner and router refer to the radial distance from r0 to r1 and from r1 to r2 in the hollow circle model, respectively.
Tw is computed as
T w = Δ T i n n e r Δ T o u t e r ln r o u t e r ln r i n n e r
By integrating the Laplacian temperature change δT and setting the components in Equations (11) and (12), we obtain the secondary mineral at the inner circle:
F 1 r = T s , 1 r 2 r 0 2 2 T w , 1 2 r 2 ln r 1 2 r 0 2 ln r 0 2 1 2 2 P b S b + P c o 2 S c o 2 b ν 1 1 α 1 E 1 1 + ν 1 r 2 r 0 2
and the primary mineral at the outer circle:
F 2 r = T s , 2 r 2 r 1 2 2 T w , 2 2 r 2 ln r 1 2 r 1 2 ln r 1 2 1 2 2 P b S b + P c o 2 S c o 2 b ν 2 1 α 2 E 2 1 + ν 2 r 2 r 1 2
For the thermal stress calculations in a hollow circle, the temperature change is initially time-dependent, and at t = 0, the domain experiences a constant stress and temperature.
The temperature differences between hollow circles can be approximated based on the moving point-source theory. Given that the thermal resistance of the mineral and the heat exchange rate between the primary mineral and the heat source are proportionate [61,62,63],
Q = T r e f T C O 2 4 π λ m + Ε r 2 2 y v T t 2 4 a t + Ψ T
Q is the heat exchange rate with the surrounding porous domain, r is the radial distance, λm is the weighted average thermal conductivity of the fluid and minerals, vT = vy(ρc)CO2mcm is the thermal transport velocity, a is the mean thermal diffusivity, and ψT is the thermal resistance of the inner and outer minerals including the convective thermal resistance of the pore fluid sCO2. The injected fluid temperature TCO2 and the undisturbed pore system temperature Tref are the known parameters.
Depending on the heat exchange rate and thermal resistances, the inner circle temperature difference is calculated as
T 1 T C O 2 Δ T 1 = ψ c + ψ 1 Q
ΔT1 accounts for the difference between the injected fluid temperature TCO2 and the temperature at r1, ΔT1 = TCO2(r0) − T1(r1). The outer circle temperature difference is given as
T 2 T C O 2 Δ T 2 = ψ T Q
ψT is the total thermal resistance that accounts for the convective ψc, and conductive thermal resistances of hollow circle minerals ψ1 and ψ2 [64]:
ψ T = ψ c + ψ 1 + ψ 2
The convective thermal resistance is
ψ c = 1 2 π h
h is the heat transfer coefficient estimated depending on the Nusselt number, fluid thermal conductivity, and hydraulic diameter (h = Nu.λf/d).
The conductive thermal resistances are approximated depending on the radial distances of each mineral and their thermal conductivities:
ψ 1 = ln r 1 / r 0 2 π λ 1
ψ 2 = ln r 2 / r 1 2 π λ 2
The verification of the analytical derivations described for thermo-mechanical processes is carried out with COMSOL Multiphysics. The verification results can be found in Appendix C.

2.2. Fractal Scaling Law

A fractal modeling approach is used to determine the relationship between the calculated thermal stress of a microporous structure and a porous domain to assess the thermo-mechanical impact on porosity (i.e., micro- to meso-scale).
The rate of change in a pore radius due to the effect of the thermal effective stress should be calculated concerning the minimum and maximum limits of pore radii to account for all pore populations [65,66]:
r min = C 1 + σ e f , min E r min , 0
For the upper limit, the maximum pore radius is typically defined; however, the best approximation is obtained concerning the median pore size [67]:
r m e d = C 1 + σ e f , m e d E r m e d , 0
C is an empirically determined constant of order that is commonly assumed to be one in circle geometry [68].
The cumulative number of pore size distributions can be determined using the power law cumulative distribution function (CDF), which implements the fractal dimension as a scale exponent parameter. The differentiation of the cumulative number of pores with respect to upper and lower bounds yields the total pore area in a domain:
d N = D f 1 r r m e d D f + 1 d r r m e d
The integration gives the total pore area:
A p = r min r m e d π r 2 4 d N = π D f r m e d 2 4 2 D f 1 r min r m e d
The ratio of a domain area to the total pore area Ap to its total cross-section A is used to calculate porosity ϕ.
Porosity can also be defined based on the fractal dimension and pore sizes, as the rate of change in porosity ϕTM alters with the pore radius change as a result of thermal stress, calculated based on Equations (22) and (23) [69]:
ϕ T M = C r min r m e d D T D f
Equation (26) can be solved for ϕTM depending on the calculated effective thermal stress and total stress.
If permeability is also measured, the porosity modified by the thermo-mechanical impact can also be estimated and verified using the Kozeny–Carman-type fractal model derived by Erol et al. [67] as follows:
ϕ T M = τ T M κ 0 24 A p 8 γ 1 π
where κ0 is the initial permeability, γ is the flow constant, and τTM is the tortuosity, while the ratio between L0 and L is modified by the effective stress. To take into account the effect of stress on the cylinder flow path channel in Figure 3c, the rate of change in the length of a flow path can be estimated as follows [66]:
L = 1 σ θ , e f ν E L 0 τ T M = L 0 L
L0 is the initial length of the path, E is the elasticity modulus, and v is Poisson’s ratio. Every cylindrical flow channel within the domain is assumed to be uniformly distributed.

2.3. Hydrochemical

In the hydrochemical process through the equilibrium phases, the rates and the transport are computed with IPHREEQC [43]. The flow velocity can be adjusted with respect to the length of a sample divided by a specified time step in the transport data block The brine–CO2–geofluid interactions are assessed using the Lawrence Livermore National Laboratory (LLNL) database, which yields results that are mostly consistent with the experimental analyses within a specified system.
The following kinetic rate equation, taking into account the temperature dependence, describes the dissolution or precipitation process of minerals [70]:
R m i = ω m i k i 25 exp E i _ a 0 R g a s 1 T 1 298.15 1 Ω i p q
in which the subscript i denotes the ith mineral, ki25 is the kinetic rate constant at 25 °C, ωmi is the specific surface area of the total pore space, Ea is the activation energy, and Ω is the saturation index. The exponents p and q are empirical constants related to the precipitation, and dissolution is usually assigned as one for sandstone [71].
The volume fraction change in each mineral Vfi is calculated along with reaction rates. The porosity ϕc that changes due to chemical reactions is then obtained by adding the latter [72]:
V f i = V f i 0 ± v i R i t
Each mineral molar volume is represented by vi. Vfi0 represents the dissolution or precipitation controls ±, and the initial volume fraction.
ϕ c = 1 i = 1 n V f i
in which n is the number of minerals. The porosity is recalculated at each time step as Vfi varies.

2.4. Total Porosity and Strain Rate

The molar volume of the secondary mineral represented at the inner hollow circle in the thermo-mechanical computation cannot be less than zero during this computation—otherwise, the computation breaks.
ϕ T = ϕ 0 + ϕ 0 ϕ c Δ ϕ c + ϕ 0 ϕ T M Δ ϕ T M
The dissolution, precipitation, and diffusion strain rate equations are the three main mechanisms combined in a typical IPS strain rate equation [11]. Traditionally, the computations use empirically determined chemical kinetic rates and strain measurements from a uniaxial compaction experiment. The total of these three equations yields the overall strain rate. Alternatively, a single equation is used in this study to determine the total strain rate ε T , as given below:
ε ˙ T = R d p exp β σ T Φ R T 1 d ϕ T
Rdp = k25Φ is the kinetic dissolution/precipitation velocity, Φ is the molar volume of the mineral, σT is the applied total stress, and ϕT is the rate of change in total porosity calculated based on the grain radius change iterative calculations described above. β is the strain-dependent parameter that can be calculated
β = 6 d 2 A c 1 ε v o l 2 / 3
Ac is the contact area per primary mineral, and volumetric strain is calculated based on the rate of change in total porosity.
ε v o l = ϕ 0 ϕ T 1 ϕ T
The relationship between the total stress in a cross-section, the rate of change in total porosity, and the effective thermal stress on a solid is expressed based on the pore pressure Pp [60]:
σ T = ϕ T P p + 1 ϕ T σ e f
where σef is the first principal stress that we can replace with the tangential effective stress σθ,ef on the primary mineral for the calculations.

2.5. Conventional IPS Model

Three volumetric strain rate equations that constitute the main mechanisms of the conventional IPS model are as follows: dissolution ε ˙ dis , precipitation ε ˙ pre , and diffusion ε ˙ D . Three mechanism strain rates are summed up to determine the total strain rate of the conventional IPS model as given below [11,30]:
ε ˙ T I P S = ε ˙ d i s + ε ˙ D + ε ˙ p r e
The volumetric strain rate for each rate-controlling process for dissolution, diffusion, and precipitation can be subsequently calculated as follows:
ε ˙ d i s = R d i s exp β σ T Φ R T 1 d 6 1 ε v o l 1 / 3 f d i s ϕ 0 , ε v o l
for diffusion:
ε ˙ D = D C S exp β σ T Φ R T 1 d 3 144 π d 2 1 ε v o l 1 / 3 f D ϕ 0 , ε v o l
for precipitation:
ε ˙ p r e = R p r e exp β σ T Φ R T 1 d A c A p 6 1 ε v o l 1 / 3 f p r ϕ 0 , ε v o l
where Rdis and Rpre are the dissolution and precipitation velocities, d is the grain diameter, σT is the total applied stress, Φ is the molar volume of the mineral, β is the strain-dependent parameter, and εvol is the volumetric strain. fdis, fD, and fpre stand for the porosity functions related to the strain.
In Equation (30), D is the molecular diffusion coefficient, C is the concentration of the mineral, and S is the thin water film thickness at the grain boundary.
The pore area in the cubic-packed grain geometry changes as the grains are compacted under stress. Ap can be estimated as
A p = 4 π r 2 6 2 π r r χ
where r is the radius of the grain and χ is the central distance from the spherical grain to the neighbor spherical grain, which can be estimated depending on the volumetric strain as
χ = r 1 ε v o l 1 / 3
The strain-dependent parameter β related to the contact area of per unit grain Ac is calculated as follows:
β = 6 d 2 1 ε v o l 2 / 3 A c
The contact area Ac is
A c = 6 π r 2 χ 2
The rate of change in grain radius is estimated with a cubic equation:
2 r 3 + 4.5 r 2 χ 1.5 χ r = 0

3. Validation

It is challenging to find a relevant dataset and experiment that provides each parameter that must be measured to incorporate it into the THMC algorithm to fulfill its specifications and validate it using additional measured porosity. Pressure solution studies mostly lack a complete identification of aqueous chemical properties, mineralogy assessment, and saturation data before and after the experiment. In contrast, most of the core flooding experiments lack measurements of mechanical properties such as the elasticity modulus, Poisson’s ratio, and tensile or compressive strength of the rock. Two fully coupled experimental study processes were selected in the literature from Vafaie et al. [53], where almost all necessary parameters were measured and achieved successfully after the core flooding test.
A comparison is carried out between the proposed THMC algorithm above and the experimental sCO2 core flooding test dataset of Shi et al. [73] and Harbert et al. [74].
Harbert et al. [74] inspected the geochemical reactions between brine and sCO2 to recognize any changes in the geomechanical characteristics of Mt Simon sandstone cores with 0.025 m in diameter and 0.07 m in length. The samples were analyzed for changes in the aqueous chemistry of fluid, brittleness, elastic modulus, compressive strength, microstructure, mineralogy, permeability, and porosity using spectral, geochemical, scanning electron microscopy (SEM), petrophysical, and geomechanical techniques both before and after the one-month exposure. The results of the VW1-6919 sample have been considered for comparison purposes. sCO2 was injected at 53 °C and 13.1 MPa into one end of the core sample while it was brine-saturated.
The measured aqueous species of the brine before and after the experiment are given in Table 1. The amounts of Ca, K, Mg, and Na decreased, Fe did not change, and Ba increased after the test. According to Harbert et al. [74], the variations in the amount of ions are due to the difference between the injected sCO2–brine composition and the brine in the saturated sample in the autoclave. Another reason could be solid solutions likely occurring in the system as end-members of clay minerals. However, Ba is a trace element in the system, and its difference in amount indicates a brine recipe change between the injected fluid and the existing fluid. The amount of SiO2 could not be measured before the experiment began due to the low detection threshold. Predicting the chemical composition changes is essential for the validation of the geochemical calculations to determine whether the minerals listed in Table 2 are dissolved and dissociated ions in the bulk fluid or whether the initial quantity of aqueous species listed in Table 1 goes through a precipitation reaction process with those minerals. The porosity is directly impacted by the total dissolution and precipitation process, and any alterations to the porosity affect the bulk modulus parameter, which measures the mechanical strength and the strain of the domain.
The mineralogy of Mt Simon sandstone was analyzed by Shi et al. [75], and similar rock samples were used in the experiments of Harbert et al. [74]. Shi et al. [75] examined the mineralogy of three samples taken from depths ranging between 1816 and 2127 m, predominantly composed of quartz and K-feldspar minerals. Table 2 summarizes the mineral composition of the core sample taken from the depth of 2109 m, and the moles were estimated based on the porosity and the volume of the cylinder sample.
The porosity changes are measured before and after exposure to CO2–brine injection conditions and are given in Table 3. Harbert et al. [74] did not explain the decrease in porosity. The minimum pore radius of Mt. Simon sandstone is 0.5 × 10⁻⁶ m, and the median is 2 × 10⁻⁶ m [75].
The injection conditions of the experiment for the VW1-6619 sample are given in Table 4.
Biot’s coefficient is taken as 0.7 [57]. The mechanical, chemical, and thermal properties of constituent minerals are obtained from Harbert et al. [74] and other references in Table 5.
Shi et al. [73] studied a Tako sandstone core sample measuring 0.145 m in length and 0.0368 m in diameter used for the tests. An X-ray computer tomography (CT) scanner with a resolution of 0.35 mm × 0.35 mm was used to horizontally map the saturation profile through the core sample in three dimensions (3D). Thus, the alterations in porosity were monitored, and the fluid saturation was tracked after sCO2 injection at 40 °C and 10 MPa into one end of the core sample.
Quartz constitutes 52% of the main composition of Tako sandstone, with k-feldspar at 7% and muscovite at 3%, and with substantial minerals, primarily kaolinite (36%) [78]. In addition, different clay mineral forms, such as smectite at 200 °C and illite at 40 °C, can form from kaolinite at different temperatures and coexist in the system. According to Zhang et al. [78], compared to pore pressure alone, the strain changes caused by CO2 adsorptions on clay minerals were noticeably more prominent due to swelling. However, depending on the Al/Si ratio, clay minerals can dissolve at lower pH values and temperatures below 50 °C [79]. This state could develop during the sCO2 injection and render the porosity higher.
Petrophysical characteristics of the Tako sandstone sample and their changes before and after the exposure of brine–sCO2 and injection conditions are reported by Shi et al. [73] and listed in Table 6. The brine’s ionic strength was the only information provided by Shi et al. [73]. Therefore, Na and Cl ions were allocated during the IPHREEQC computation, and their amounts were adjusted to the ionic strength 3.
Table 7 provides the parameters used for the thermo-mechanical computation.

4. Results

Mt Simon sandstone and Tako sandstone geochemical reactions and mechanical processes are scrutinized during sCO2 injection, and the results are compared and justified with the outcomes of the corresponding references.
Harber et al. [74] emphasized that based on the mineralogy of Mt Simon sandstone, the dissolution of injected sCO2 in brine forms carbonic acid under a sufficient partial pressure, and it triggers K-feldspar (KAlSi3O8) dissolution due to a reaction with carbonic acid (H2CO3), where the reaction produces kaolinite (Al2Si2O5). This observation is partially compatible with the new THMC model evaluations, which show that the saturation index of K-feldspar is negative and kaolinite is initially positive and eventually turns negative. The precipitation of nontronite as a secondary mineral during the CO2 injection into a sandstone is consistent with the study by Ilgen and Cygan [81] for temperatures between 25 °C and 59 °C. At the end of the experiment (e.g., 720 h), the saturation index of nontronite changes to negative, indicating another dissolution at the top of the core sample. This suggests that the chemical equilibrium between minerals and sCO2–brine was not achieved after 720 h, and if the experiment continued for longer, the porosity would increase, which was seen in the new model calculation results.
The calculated porosity change over time with the THMC process is consistent with the experimental results of Harbert et al. [74], as shown in Figure 4a. The volumetric strain increases as porosity reduces due to the nontronite precipitation. sCO2 injection into a reservoir under these conditions may increase stress by decreasing permeability and cause a tensile fracture in the porous domain concerning the tensile strength of the rock.
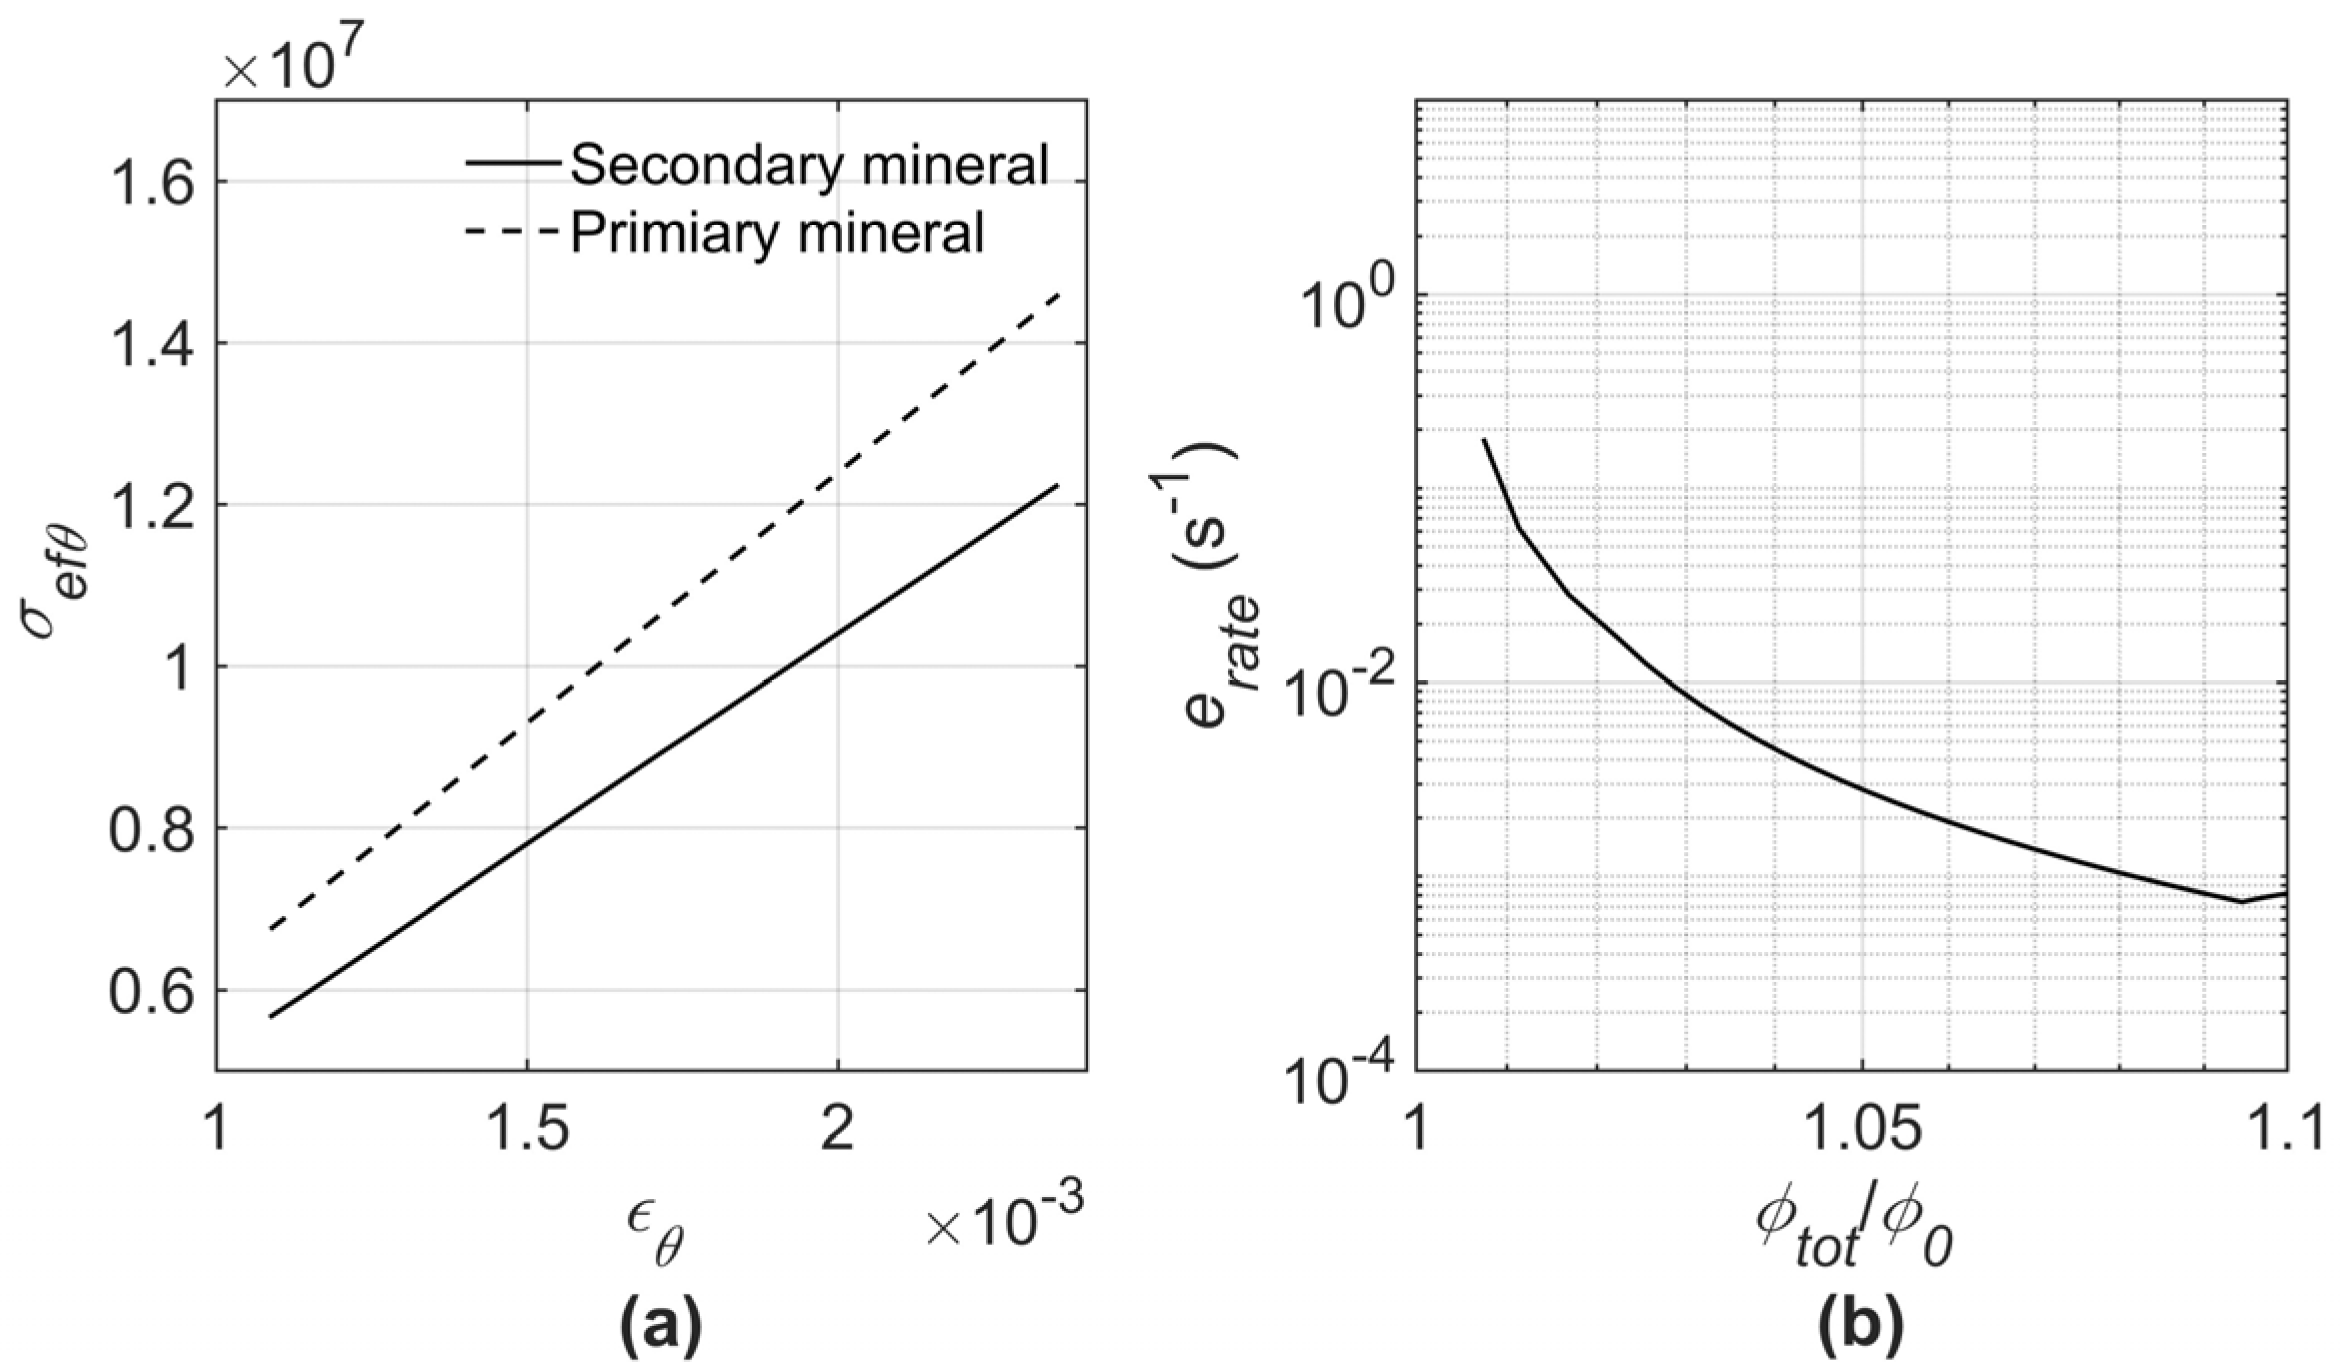
The effective tangential stress significantly impacts the sample due to the axisymmetric pore pressure and thermal stress loading. Therefore, the effective tangential stress and tangential strain components are scrutinized in Figure 5, plotted at the interface of two minerals, the secondary mineral (K-feldspar) and the primary mineral (quartz). There is a considerable difference in the tangential stresses between the two minerals at their contact point due to their elasticity modulus and Poisson’s ratio (Figure 5a). This could cause the secondary mineral to separate from the surface of the primary mineral, increasing the surface area of the secondary minerals and interaction with the injected sCO2 and facilitating faster dissolution and precipitation processes. The strain rate is higher at the start of sCO2 injection because the sample quickly becomes CO2-saturated after a few hours (Figure 6b). Afterward, the strain rate gradually decreases due to geochemical interactions between minerals and sCO2–brine, controlling the creeping process.
The pH results shown in Figure 6d support this reaction occurring in an acidic system. As shown in Figure 6c, nontronite, another member of the clay mineral group, most likely precipitates and reduces porosity over time, which is consistent with the experimental results of Harber et al. [74] (Figure 4a).
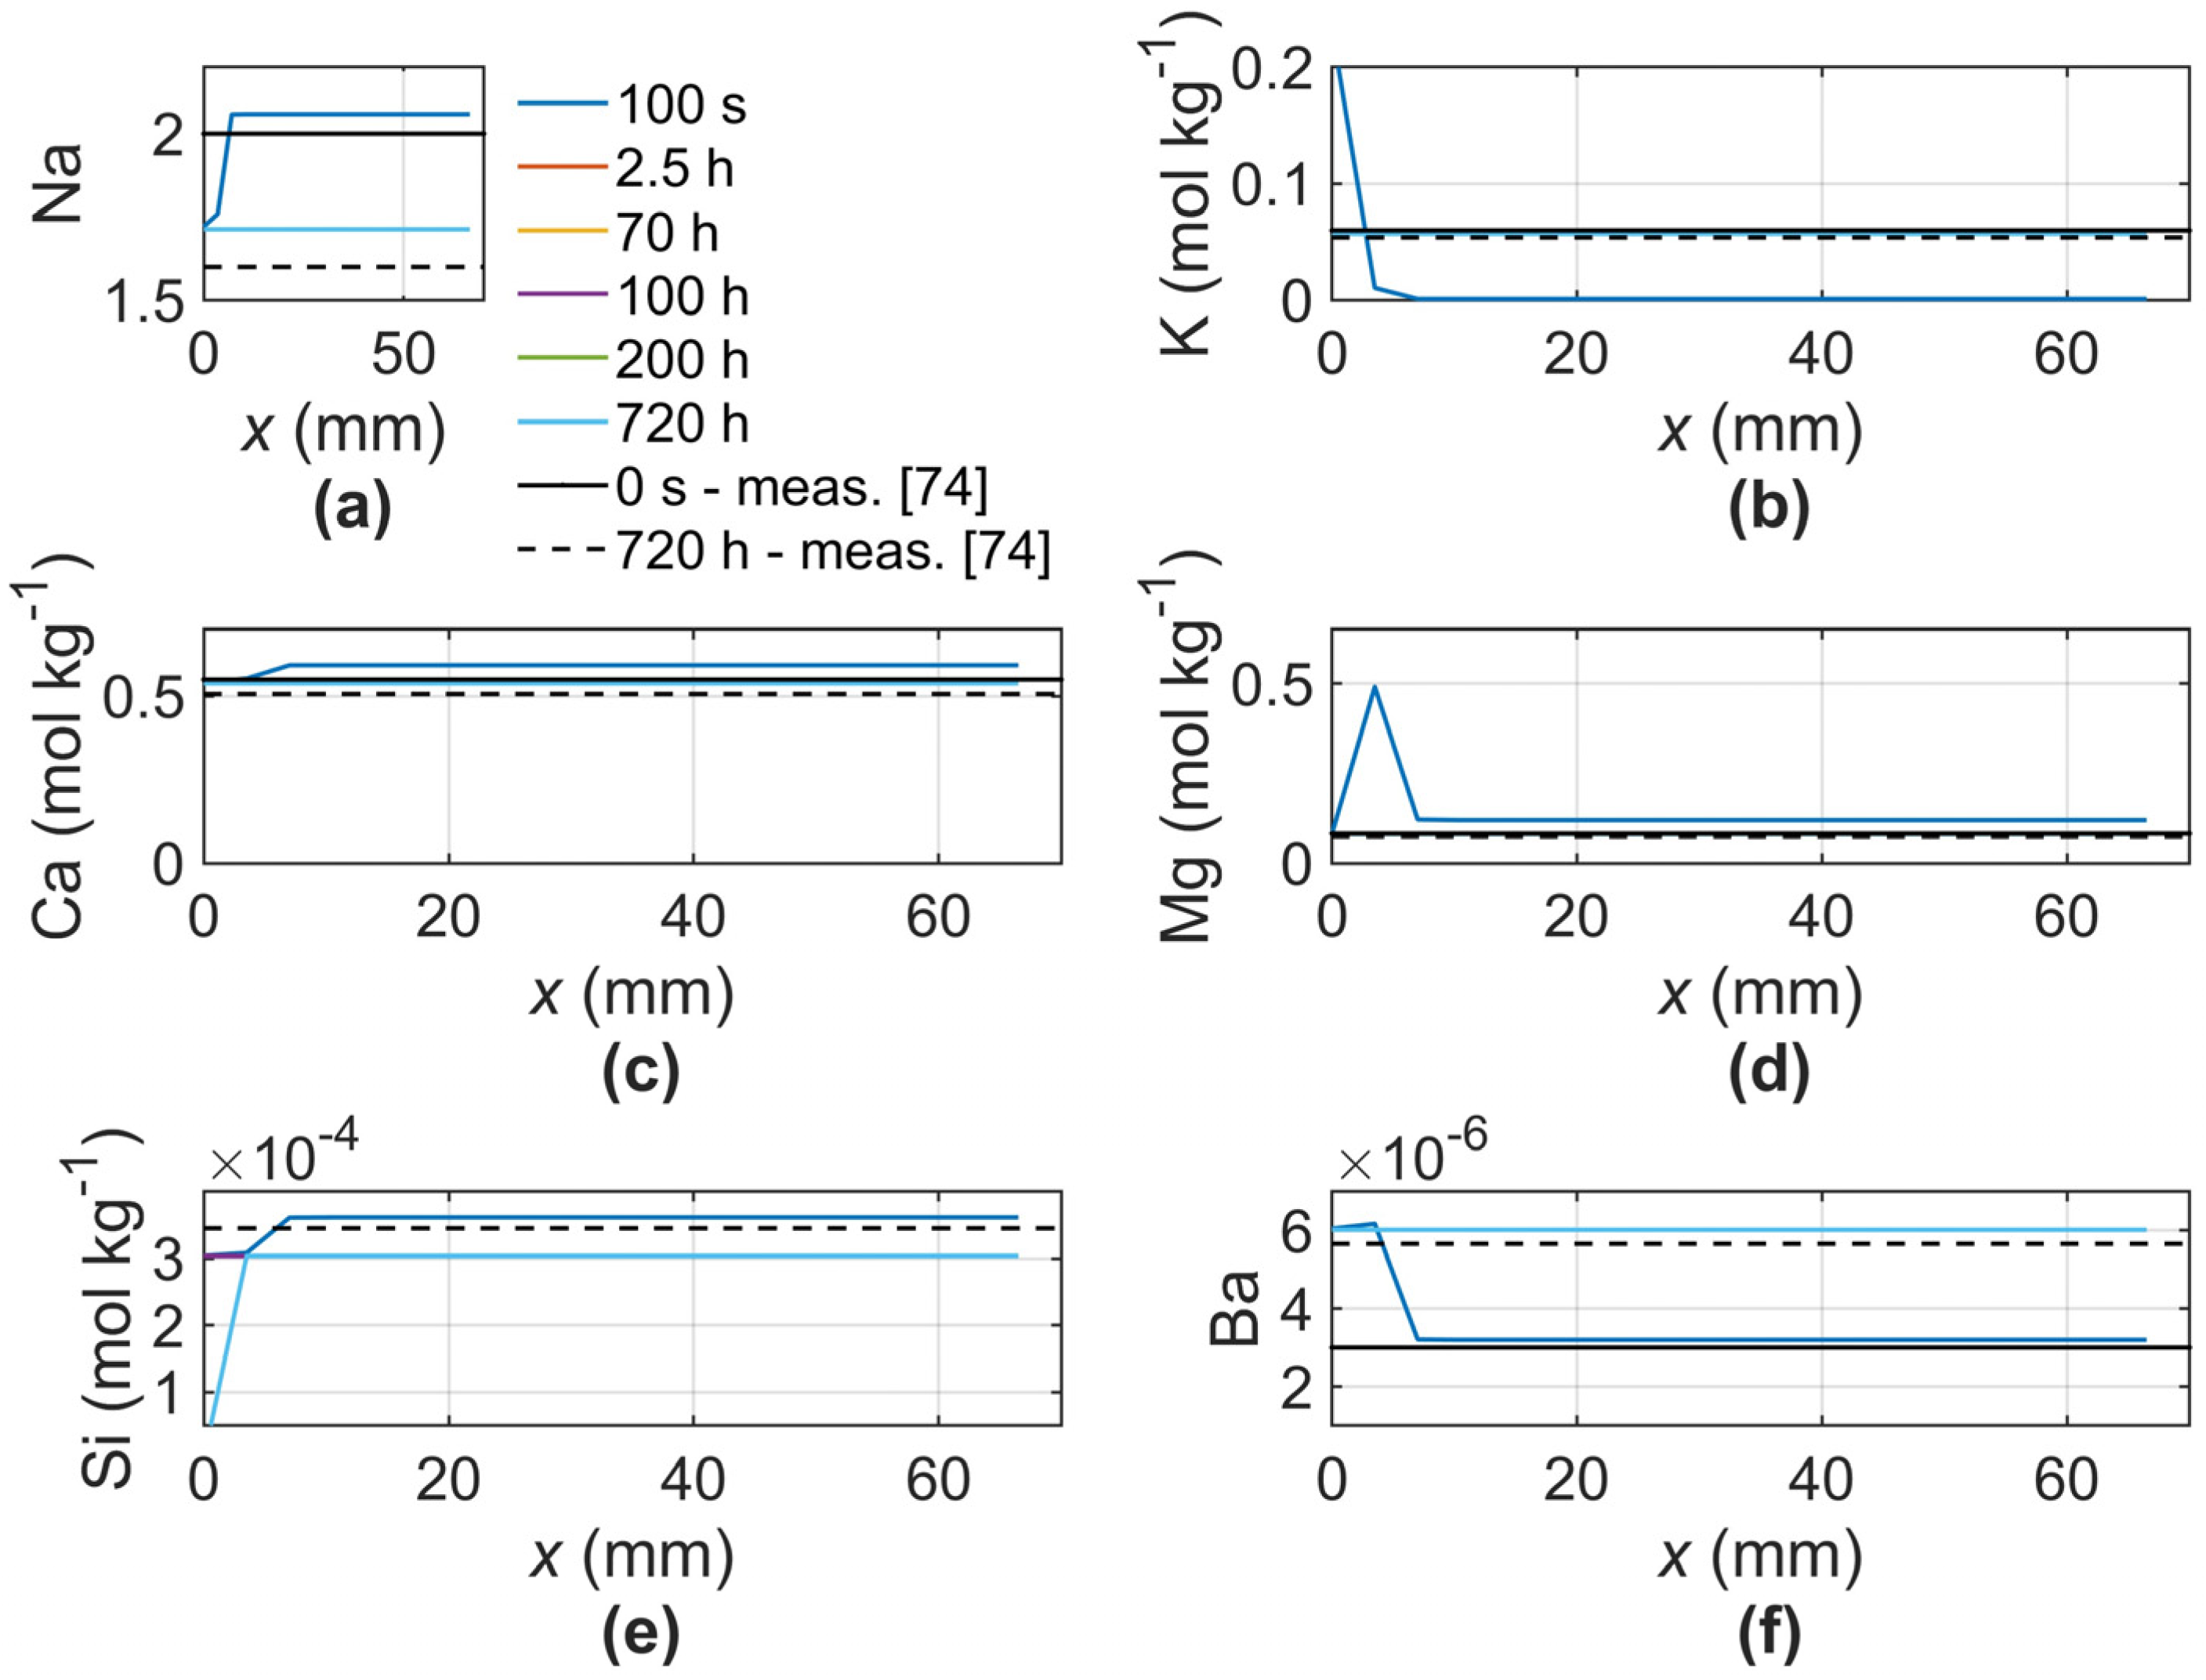
Figure 7 compares the amounts of aqueous species before and after the sCO2 injection process and validates the calculations of the new THMC model results with the elemental analysis results of Harbert et al. [74].
The solid black line denoting the measurement results before the injection can be justified with the solid dark blue line at 100 s, whereas the black dashed line representing the picture after the injection can be compared with the light blue line at 720 h. The calculation results differ from the measurement in K at the beginning of the injection, which may be attributed to the dissolution of K-feldspar and later K ions, used to produce kaolinite and other forms of clay minerals. Later, as the sCO2–brine composition is penetrated through the domain, K dissociates from the minerals and mixes with the bulk fluid. At the later stage, the computation results are consistent with the measured values. The amounts of Ca, Mg, and Na decreased, and the geochemical computation results are consistent with the measurements. The computation results demonstrate that Na is mainly used to produce the end-member clay minerals such as Nontronite-Na after the injection. In Figure 7d, at 100 s, a large jump in the Mg amount can be attributed to a numerical error where the chemical phase calculation is not converged. The Ba results are in line with the experimental results shown in Figure 7f. Ba increased after the injection of sCO2–brine. Ba is a trace ion, and the difference in its concentration between the injected fluid and the initial solution suggests a slight alteration in the brine composition; the computation results support these findings. The amount of SiO2 was not measured before the experiment began due to the low detection threshold. In the calculations, the initial concentration of SiO2 is zero, but after 100 s of injection, SiO2 appears in the bulk fluid as the injected sCO2–brine mixture interacts with the minerals, and the ultimate SiO2 concentration is in agreement with the concentration found experimentally by Harbert et al. [74].
The porosity comparison between the computed THMC process results and the experimental micro CT evaluations of Shi et al. [73] can be seen in Figure 8a. The computational estimation is somewhat in agreement with the measured values.
Figure 9 demonstrates the tangential effective stress and tangential strain components of primary (quartz) and secondary minerals (smectite) at the contact point r1. The stress difference seems negligible, but circumferential forces can still cause it to separate and create a new surface area between the primary and secondary minerals. With the sCO2 exposure, it initiates a more extensive chemical reaction. At the beginning of the exposure, the strain rate is higher and progressively decreases. This could suggest that the first few hours of a CO2 injection into a reservoir are critical, particularly when close to the injection wellbore. When the strain rate is higher, this could result in tensile failure. This is especially noticeable when there is a significant temperature difference between the reservoir and the injected sCO2, as it increases the thermal stress.
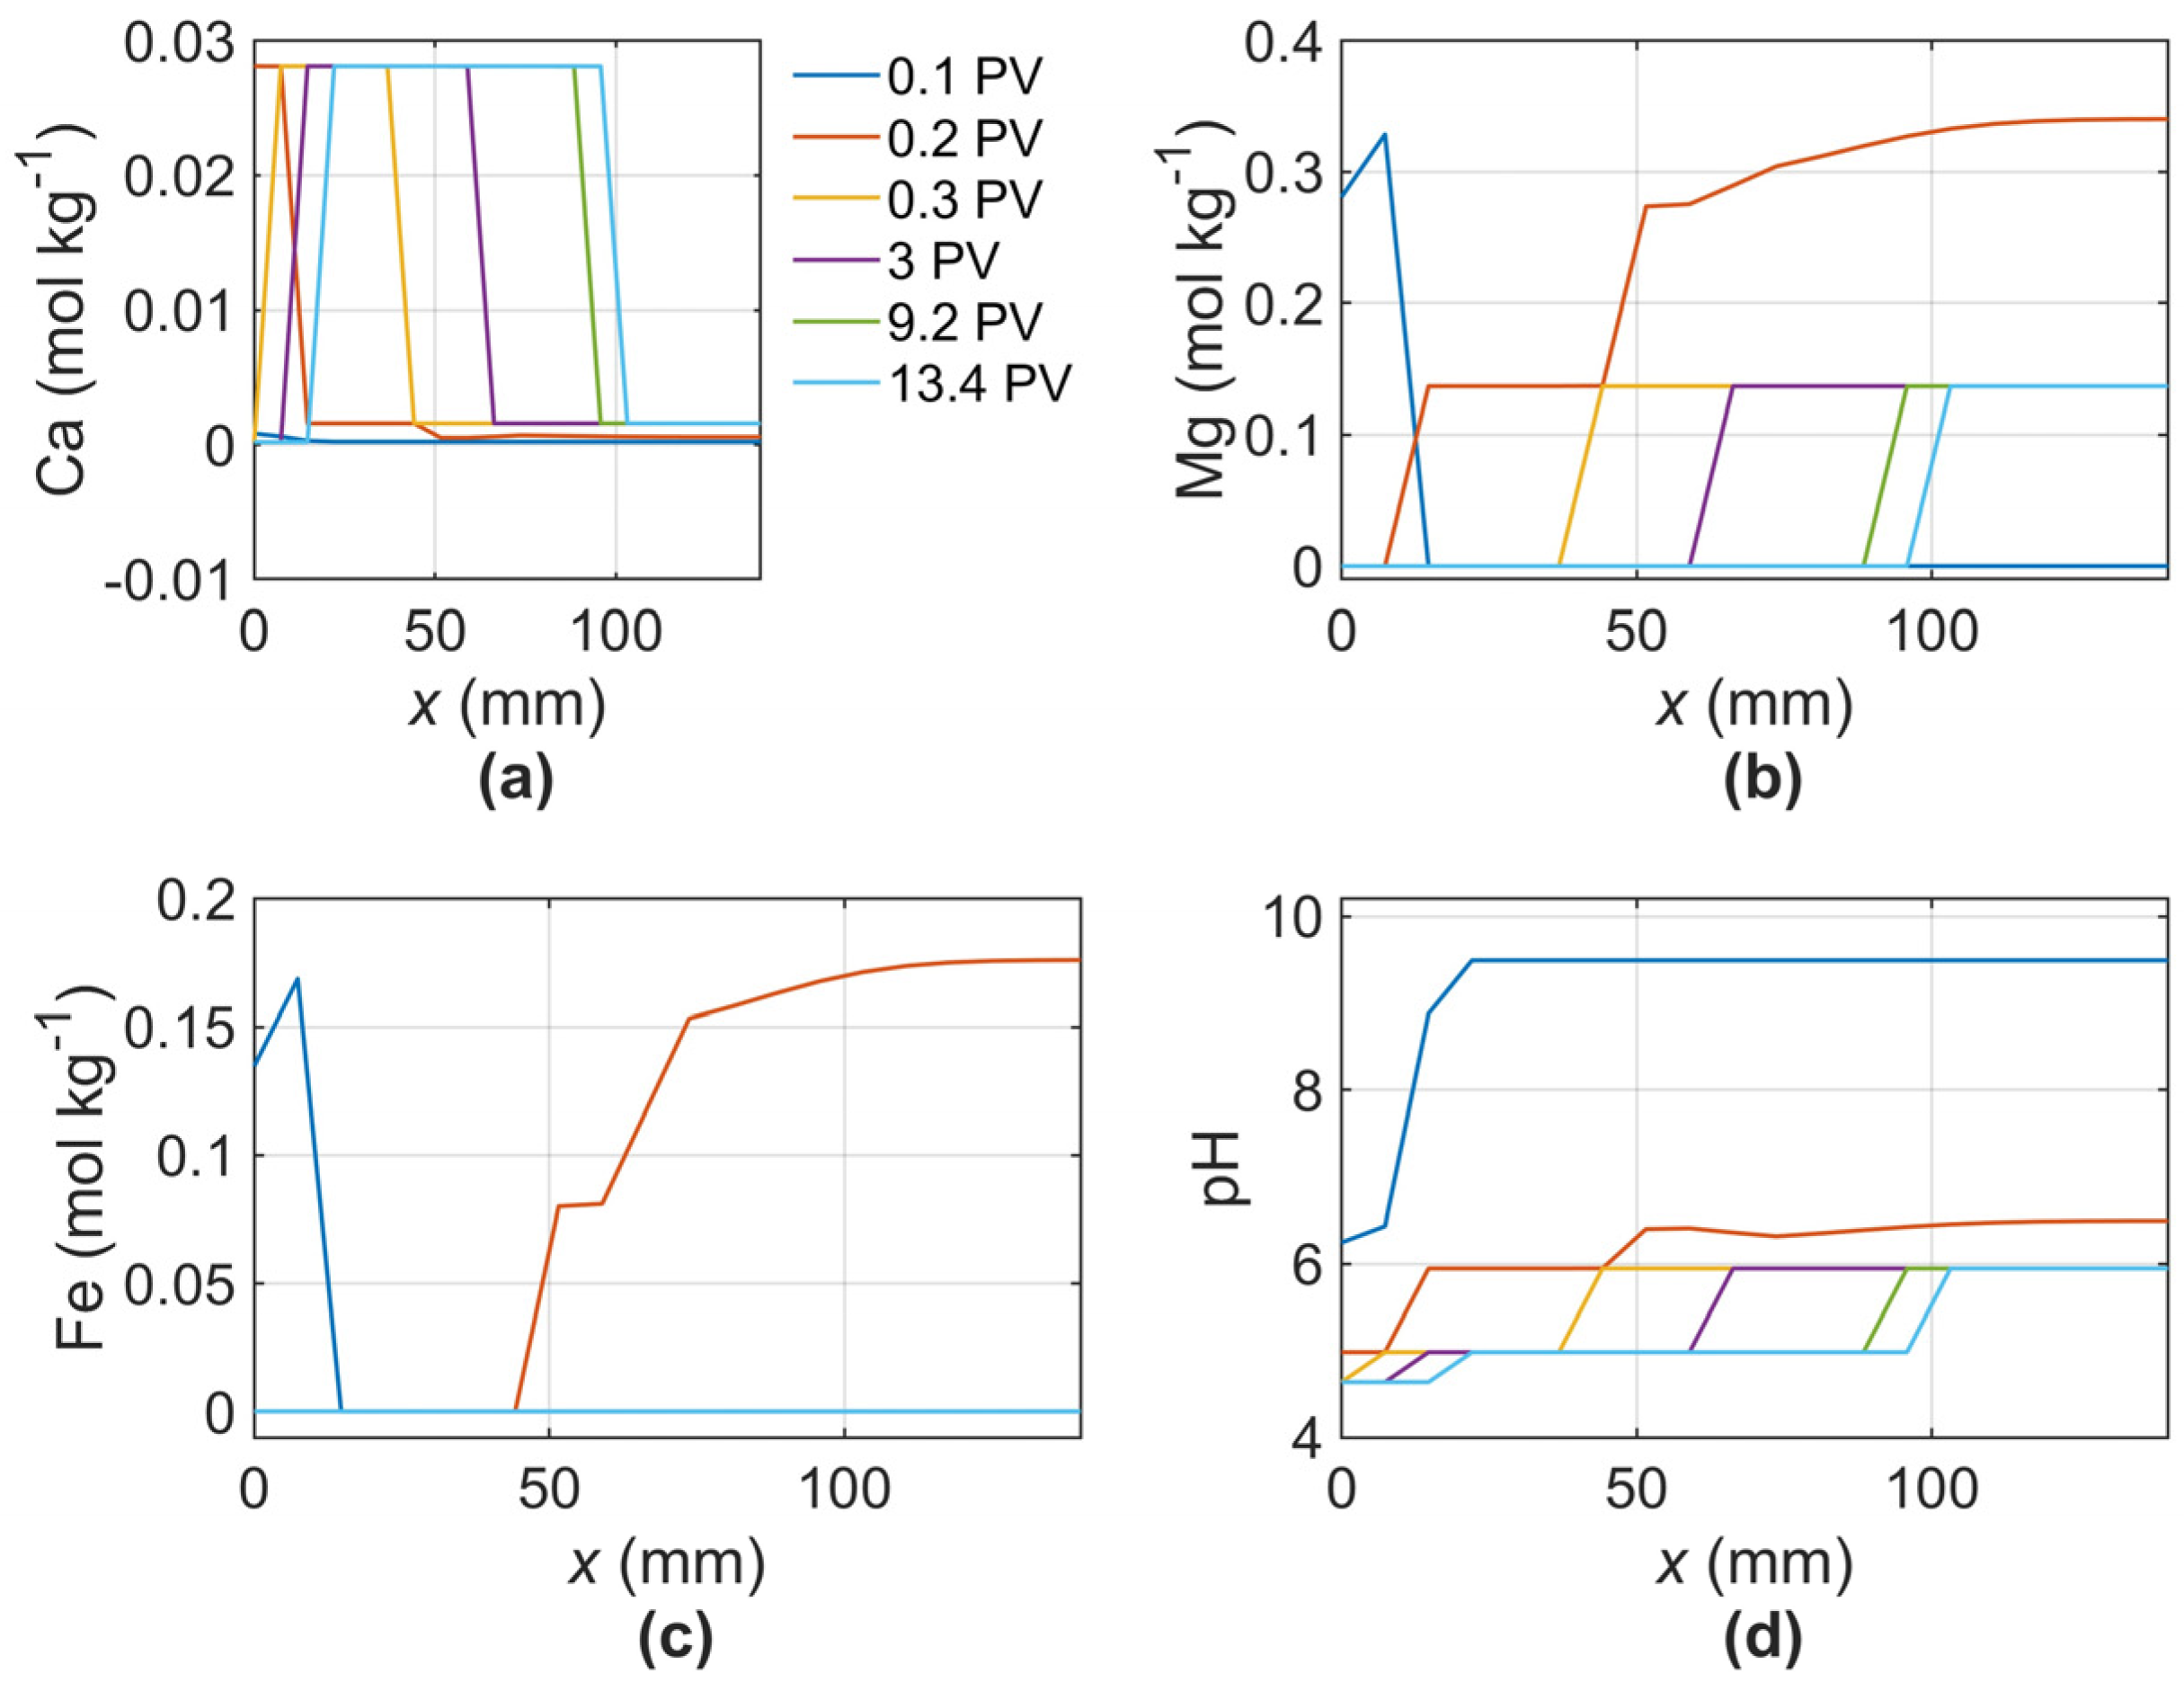
The sCO2 propagates from the left-hand side to the right-hand side through the sample, and the porosity increases with the saturation of sCO2. The significant increase in porosity is due to the dissolution of clay minerals, particularly undersaturated smectite (Figure 10c). The sign convention of the volumetric strain is negative due to the dissolution of minerals increasing the void space in the porous domain.
Approximately 0.43 is reached by the mean level of CO2 saturation following the injection of 13.4 PV of sCO2 (Figure 10a). Shi et al. [73] state that the gas phase initially remained in the system as a residual gas at the beginning of the brine–sCO2 exposure. If we look at the saturation index of quartz over time, shown in Figure 10d, quartz was most likely not involved in any chemical reaction.
Changes in the concentration of the aqueous species are shown in Figure 11, where, following the injection of brine-sCO2, the smectite dissolves Ca, Fe, and Mg mixed with the brine. Most likely, a reaction involving the Mg and Fe produces hematite and dolomite, which have positive saturation indices. The amount of Ca increases and partially remains in the brine over time.

5. Comparison of Conventional IPS Theory

Liteanu and Spiers [82] conducted experiments on uniaxial compaction on crushed carbonate rock samples to evaluate the rate-controlling process and determine whether creep occurs by IPS under stress. A saline pore fluid solution with sCO2 was injected through the sample at a pressure of 10 MPa. The proposed THMC algorithm including Equation (33) is compared to the conventional IPS model depicted in Equation (37).
The tests were carried out at 80 °C with a total applied stress of 30 MPa. One sample was taken into consideration for the comparison. The grain size of the sample is 50 μm. The sample consists of 98% CaCO3. Six grams of sample were soaked in pore fluid with 1 M of NaCl in the experiment. After 48 h, high-purity CO2 (99.9%) was injected into the fluid-filled sample. A CO2–Ar separator supported by a high-pressure argon buffer was then used to increase the pressure to 10 MPa at the test temperature of 80 °C. The sample has an initial porosity of about 0.25. Strain values from a uniaxial compaction experiment on the sample and empirically determined chemical kinetic rates are used in the geochemical calculations of the conventional IPS model.
The kinetic parameters that were used to calculate the strain rates with the existing IPS model are provided in Table 8.
In Equation (39), C is estimated based on the solubility product Ksp. The solubility product of calcite mineral is empirically calculated as log(Ksp) = −171.9065 − 0.077993T + 2839.319/T + 71.595.log(T).
The main difference between the conventional IPS and the novel THMC algorithm is related to the coupled thermo-mechanical and dynamic geochemical computation. The geometric assumptions were used to calculate the reaction surface area and the volume of the experiment. Kinetic path modeling and a transport process are designed to predict the porosity change and then the strain, and the strain rate is calculated. The kinetic rate constant and the activation energy of calcite are 1.2 × 10⁻⁶ mol m2 s−1 and 23.5 KJ mol−1, respectively, assigned in iPHREEQC calculations [70].
As can be seen in Figure 12b, the conventional IPS calculation results (i.e., dashed line) overestimate the strain rate compared to the measurements, whereas the novel THMC algorithm provides more consistent outcomes. The root mean square logarithmic error (RMSLE) between the Equation (33) results and Equation (37) evaluations varies around 1.4 to 1.5.
More accurate findings are obtained when the Lawrence Livermore National Laboratory (LLNL) thermodynamic database is used to dynamically compute the saturation index of calcite minerals in a batch system. The results are greatly impacted by the dynamic calculation of the molar changes in calcite and its kinetic rate, which changes at each step as a consequence of variations in the reaction surface area. Calcite dissolution slows the strain rate as the volumetric strain rises over time, but the traditional IPS theory is unable to forecast at higher strains. The small discrepancy between the measurements and the results of the novel THMC algorithm (i.e., solid lines) can be attributed to the quadratic stain-dependent equation (Equation (34)), leading to fractional variations as precipitation and dissolution occur over time, affecting the surface area and the grain radius.

6. Discussion

The present study was limited to isotropic poro-elasticity and flow, as anisotropy requires even more parameters, which are difficult to determine from experimental data. Another concern is that the proposed algorithm requires saturation data during the CO2-fluid core flooding process related to relative permeability. When CO2-fluid displacement reaches a steady state, the estimation of the total volume of injected CO2 is greatly impacted by the errors in residual gas saturation and residual liquid saturation. Zheng et al. [83] state that a 0.1 change in gas saturation or residual saturation can result in a deviation in total volume injection of up to 0.5 pore volume and that a change in gas saturation may cause a larger predictive deviation in local CO2 saturation than that in residual gas saturation. The model predictions are rather consistent with either Corey’s curve or the Brooks–Corey curve [73,83,84]. However, the predictions drastically change upon using the van Genuchten curve. In our study, the implemented saturation dataset of Shi et al. [73] was also fitted with Corey’s curve.
Geochemical thermodynamic databases used in PHREEQC also considerably affect the results. Different thermodynamic databases such as LLNL [43] and Thermoddem [85] can be tested for consistency with experiments. When defining relevant end-members of minerals, the Thermoddem thermodynamic database takes into consideration crystallographic features and constraints. It can be applied to metamorphic rocks and takes into consideration a solid solution that most likely occurs within hydrothermal systems. The LLNL database is used in this study because it produced results that were highly compatible with the experimental datasets of Shi et al. [73], Harbert et al. [74], and Liteanu and Spiers [82].
Consistent approximations with the pertinent experimental datasets are obtained by using fractal approximation to estimate the total pore area based on the cumulative distribution of the minimum and median pore diameters. The computed porosity is overstated when compared to the experiments since the maximum pore size is typically incorporated into fractal models. Using the median pore size instead of the maximum pore size results in a better fit.
The deficiencies of the proposed algorithm are (i) the simplification of the pore space in an axisymmetric assumption with two mineral systems. In nature, there are more than two mineral systems. In that case, each primary and possible secondary mineral can be separately calculated in a domain, and a median value for porosity changes can be used to determine the strain rate and the effective thermal stress. However, this process may increase the overall computation time. (ii) The fractal scaling law may overestimate or underestimate the porosity. Therefore, the pore radius during the calculations should be carefully selected for a consistent computation. An appropriate value can be obtained from the sieve analysis of the crushed rock samples and its cumulative distribution with respect to the grain diameters. The cubic-packing assumption of the grains can be used to predict the proper pore radius with the help of the geometry.

7. Conclusions

This study presents a new coupled analytical THMC model specifically designed for the pressure solution process in porous media. This model has been validated against the existing literature and provides consistent results with experimental datasets. Moreover, the comparison of the new THMC model with the conventional IPS model indicates its straightforward reliability for the inspection of CO2 sequestration processes. The key findings of this study can be listed as follows:
  • It was demonstrated that the strain rate first increased as a consequence of the rapid CO2 saturation, then gradually decreased as a result of the geochemical interactions between the minerals and the CO2–brine solution. This suggests that a major part of the process involves mineral dissolution.
  • The results show that the dissolution of clay minerals, particularly undersaturated smectite, during the CO2 injection procedure considerably increased porosity. This alteration in porosity is crucial for understanding the dynamics of CO2 storage in geological formations.
  • This study primarily investigates isotropic poro-elasticity, geochemical interaction, and flow and ignores anisotropic conditions.
  • An important aspect of this study is the reliance on saturation data during the CO2-fluid core flooding process. The accuracy of estimating the total volume of injected CO2 can be affected by the errors in residual gas and residual liquid saturation.
  • The proposed algorithm simplifies calculations employing a fractal approximation to estimate the total pore area based on pore diameter distributions and considers a rock consisting of only two minerals using the hollow cylinder approach. When accounting for multiple mineral systems, minerals can be segregated into groups, which may increase the computation time.
  • The results indicate that more inspection is required to better understand how mechanical and chemical processes interact with CO2 sequestration and to improve the model so it can predict the long-term behavior of CO2 in geological formations.
These conclusions provide a comprehensive understanding of the processes involved in CO2 sequestration and highlight the need for continued investigation into the associated risks and interactions.

Funding

This research received no external funding.

Data Availability Statement

The MATLAB scripts and the data will be provided upon request.

Conflicts of Interest

The author declares no conflicts of interest.

Nomenclature

athermal diffusivity [m2 s−1]
bBiot’s coefficient
dhydraulic diameter [m]
Dffractal dimension of the porous medium
Eelasticity modulus [Pa]
Eaactivation energy [J mol−1]
hheat transfer coefficient [W m−2]
ki25kinetic rate constant of mineral at 25 °C [mol m−2 s−1]
K0bulk modulus of medium [Pa]
Kssolid grain modulus of medium [Pa]
Llength of flow path [m]
Ppressure [Pa]
Rmkinetic rate [mol s−1]
Rgasgas constant [J K−1 mol−1]
Qheat exchange rate [W m−1]
r0pore radius [m]
r1inner hollow circle radius (secondary mineral) [m]
r2outer hollow circle radius (primary mineral) [m]
Sbsaturation ratio of brine
SCO2saturation ratio of sCO2
ttime [s]
Ttemperature [K]
TCO2injected sCO2 temperature [K]
Trefundisturbed pore system temperature [K]
ΔT0temperature difference between TCO2 and T1 at r1 [K]
ΔT1temperature difference at the outer wall of the grout material [K]
ΔT2temperature difference at the outer wall of the pipe [K]
δTLaplacian temperature difference [K]
udisplacement [m]
vyflow velocity of sCO2 in y-direction [m s−1]
vTthermal transport velocity [m s−1]
y, zspace coordinates [m]
Greek symbols
αlinear thermal expansion coefficient [K−1]
εθtangential strain
εrradial strain
ϕporosity
κpermeability [m2]
λmbulk thermal conductivity of fluid and minerals [W m−1 K−1]
(ρc)CO2volumetric heat capacity of sCO2 [J m−3 K−1]
ρmcmbulk volumetric heat capacity of pore system [J m−3 K−1]
σθtangential stress [Pa]
σrradial stress [Pa]
σTtotal stress [Pa]
τtortuosity
υPoisson’s ratio
ψTtotal thermal resistance in hollow circles [K m W−1]
ψcconvective thermal resistance of injected sCO2 [K m W−1]
ψ1conductive thermal resistance of secondary mineral [K m W−1]
ψ2conductive thermal resistance of primary mineral [K m W−1]
ωmsurface area of mineral [m2]
Ωsaturation index of mineral
Subscripts
inner
outer
cchemical
efeffective
rradial
ppore
Ttotal
TMthermo-mechanical
θtangential

Appendix A

Equations (4) and (5) of the stress components are substituted with the strain components given in Equations (2) and (3), and the result is assigned to the momentum equilibrium (Equation (1)):
2 u r r 2 + 1 r u r r 1 r 2 u r = α δ T r 1 + ν P b S b b + P C O 2 S C O 2 b r 1 2 ν E
Replacing and rearranging the equation gives the following:
ψ = δ T P b S b + P C O 2 S C O 2 1 2 ν b α E 1 + ν
The equilibrium equation simplifies to
r 1 r r r u r = α ψ r 1 + ν
The total displacement is obtained as follows after two integrations with respect to r1 after converting the indefinite integral into definite with the boundaries of the inner circle radius r0 and outer radius r2 subject to axisymmetric temperature change δT = δT(r):
u r = 1 + ν α r r 0 r ψ τ d τ F + G r + H r
where G and H are the integral constants. The integration F depends on the boundary conditions in the inner circle representing secondary mineral F1 and the outer circle denoting primary mineral F2.
The integration of the inner secondary mineral and outer primary mineral is
F 1 = r 1 r ψ τ d τ ; F 2 = r 2 r ψ τ d τ
Both are as follows:
F 1 = r 0 r ψ τ d τ = r 0 r δ T 1 P b S b + P C O 2 S C O 2 b 1 2 ν 1 α 1 E 1 1 + ν 1 τ d τ
F 2 = r 1 r ψ τ d τ = r 1 r δ T 2 P b S b + P C O 2 S C O 2 b 1 2 ν 2 α 2 E 2 1 + ν 2 τ d τ
The particular solutions of strain components can be solved as in the inner circle:
ε r , 1 = u r , 1 r 1 + ν 1 α 1 δ T 1 P b S b + P C O 2 S C O 2 b α 1 E 1 1 + ν 1 α 1 F 1 r 0 1 2 + G 1 H 1 r 0 1 2
ε θ , 1 = u r , 1 r 1 + ν 1 α 1 F 1 r 0 1 2 + G 1 + H 1 r 0 1 2
and in the outer circle:
ε r , 2 = u r , 2 r 1 + ν 2 α 2 δ T 2 P b S b + P C O 2 S C O 2 b α 2 E 2 1 + ν 2 α 2 F 2 r 1 2 2 + G 2 H 2 r 1 2 2
ε θ , 2 = u r , 2 r = 1 + ν 2 α 2 F 2 r 1 2 2 + G 2 + H 2 r 1 2 2
where the integral constants G1, H1, G2, and H2 are deduced as in Appendix C.
Finally, the analytical expressions of radial and tangential stress can be deduced when the strains (Equations (A18)–(A21)) are introduced in the equations of the stress components (Equations (23) and (24)).

Appendix B

(i) From Equation (8), assuming that the stress at r0 is zero, the constant H1 can be related to G1 as
σ r , 1 r 0 = 0 H 1 = r 0 2 1 2 v 1 G 1 v 1 1 + v 1 α 1 δ T 1 + ν 1 P b S b + P c o 2 S c o 2 b 1 + ν 1 1 2 v 1 E 1
(ii) The boundary condition of the stress at the outer-wall radius of the grout rb is zero, and the constant H2 can be related to G2 as
σ r , 2 r 2 = 0 H 2 = α 2 F 2 r 2 1 + v 2 + r 2 2 G 2 ν 2 α 2 δ T 2 1 + ν 2 1 2 v 2 r 2 2 1 + ν 2 ν 2 P b S b + P c o 2 S c o 2 b E 2
(iii) Displacement at the interface between the two materials ur,1(r2) = u r,2(r2) will require determining the third integral constant G2. In the displacement equation given in Equation (A4) as ur,2(r1), when H2 is expressed as a function of G2 (Equation (A13)), and similarly in the inner circle as u r,1(r1), when H1 is expressed as a function of G1 (Equation (A12)), it gives
1 + ν 1 α 1 F 1 r 1 r 1 + G 1 r 1 + H 1 r 1 = 1 + ν 2 α 2 F 2 r 1 0 r 1 + G 2 r 1 + H 2 r 1
This leads to
G 2 = G 1 ζ 1 + ζ 2 + ζ 3 ζ 4
with
ζ 1 = r 1 r 0 2 1 2 v 1 r 0
ζ 2 = 1 r 1 1 + v 1 α 1 F 1 r 1 1 + v 2 α 2 F 2 r 2
ζ 3 = ν 1 1 + ν 1 α 1 δ T 1 r 0 2 r 1 1 2 ν 1 ν 2 1 + ν 2 α 2 δ T 2 r 2 2 r 1 1 2 ν 2 P b S b + P c o 2 S c o 2 b r 1 ν 1 1 + ν 1 r 0 2 E 1 ν 2 1 + ν 2 r 2 2 E 2
ζ 4 = r 1 r 2 2 r 1 1 2 v 2
(iv) To evaluate the stress equilibrium at the interface σr,1(r1) = σr,1(r1) by using Equation (8), the stress occurring in the secondary mineral, determined as the constants H1, H2, and G2 (Equations (A12), (A13), and (A15)), is replaced as a function of the constant G1:
G 1 = χ 1 + χ 2 χ 3
χ 1 = E 1 α 1 F 1 r 1 r 1 2 ν 1 δ T 1 1 2 ν 1 1 r 0 2 r 1 2 + P b S b + P c o 2 S c o 2 b ν 1 1 r 0 2 r 1 2 ν 2 1 r 2 2 r 1 2
χ 2 = E 2 α 2 1 r 1 2 F 2 r 1 F 2 r 2 + ν 2 δ T 2 r 2 2 1 2 ν 2 r 1 2 1 1 + ν 2 + C 2 + C 3 D 1 C 4
χ 3 = E 2 ζ 1 η 1 ζ 4 E 1 η 2
η 1 = 1 1 + ν 2 1 2 ν 2 1 r 2 2 r 1 2
η 2 = 1 1 + ν 1 1 2 ν 1 1 r 0 2 r 1 2
As the constants have been determined, the stress components can be calculated for the secondary mineral and primary mineral concerning the Laplacian temperature differences in the inner circle δT1 and the outer circle δT2.

Appendix C

The analytical thermo-mechanical equations described in Section 2.1 for the hollow circle geometry under plane-strain conditions are verified with the finite element numerical simulator COMSOL Multiphysics. The thermal stress module is utilized, which combines heat transfer and the solid mechanics equations. The mesh consists of more than 200k triangular elements.
A 2D plane-strain homogenous model domain is used to represent the investigation (Figure A1). The triangular elements are used to create the mesh. The pore space is located in the center of the model domain.
Two connected co-centric hollow cylinders are used to solve the problem. The primary mineral (outer circle) is represented by the first one, and the secondary mineral (inside circle) by the second.
The following are the boundary conditions of the numerical model:
  • The internal boundary condition at the inner circle r = r0, and the outer circle of the primary mineral r = r2 are free of stress.
  • The radial displacement and radial stress of the primary and secondary minerals are equivalent at r = r1. The two thermo-mechanical problems are coupled as a result of this combined boundary condition, which transforms the mechanical equilibrium between the primary and secondary minerals.
  • At the inner radius r0, the temperature is fixed. Equations (15)–(17) are used to evaluate the temperature variations at the outer radius r1 of the secondary mineral and the outer radius r2 of the primary mineral.
Figure A1. Two-dimensional plane-strain numerical model of the two combined hollow circles.
Modelling 06 00059 g0a1
The analytical derivations for the thermo-mechanical process are verified with the numerical model results shown in Figure A2.
Figure A2. Verification of analytical solution (Equations (8) and (9) for both inner and outer circles) with numerical results. Young’s moduli of primary and secondary minerals are 6.5 GPa and 2 GPa, and Poisson’s ratios are 0.07 and 0.08, respectively. The thermal expansion coefficient is 1.4 × 10⁻⁵ K−1 and identical for both inner and outer minerals.
Modelling 06 00059 g0a2
Figure A2 demonstrates the 2D axisymmetric analytical solution results as effective tangential and radial stress components, whereas the 2D numerical results are depicted as the first, second, and third principal stress components. The numerical results and the analytical solution outcomes are consistent. From the inner circle to the outer circle, the effective tangential stress replaces and fits from the first to the third principal stress results of the numerical model since the tangential stress is the maximum principal stress. At the inner circle, the secondary mineral resists the largest stress close to the tensile strength limit of most of the rocks where fractures may occur.

References

  1. Ogata, S.; Yasuhara, H.; Kinoshita, N.; Kishida, K. Coupled thermal–hydraulic–mechanical–chemical modeling for permeability evolution of rocks through fracture generation and subsequent sealing. Comput. Geosci. 2020, 24, 1845–1864. [Google Scholar] [CrossRef]
  2. Viswanathan, H.S.; Ajo-Franklin, J.; Birkholzer, J.T.; Carey, J.W.; Guglielmi, Y.; Hyman, J.D.; Karra, S.; Pyrak-Nolte, L.J.; Rajaram, H.; Srinivasan, G.; et al. From Fluid Flow to Coupled Processes in Fractured Rock: Recent Advances and New Frontiers; John Wiley and Sons Inc.: Hoboken, NJ, USA, 2022. [Google Scholar] [CrossRef]
  3. Barbot, S. A Rate-, State-, and Temperature-Dependent Friction Law With Competing Healing Mechanisms. J. Geophys. Res. Solid Earth 2022, 127, e2022JB025106. [Google Scholar] [CrossRef]
  4. Pachalieva, A.; Hyman, J.D.; O’Malley, D.; Viswanathan, H.; Srinivasan, G. Learning the Factors Controlling Mineralization for Geologic Carbon Sequestration. arXiv 2023, arXiv:2312.13451. [Google Scholar]
  5. Eigbe, P.A.; Ajayi, O.O.; Olakoyejo, O.T.; Fadipe, O.L.; Efe, S.; Adelaja, A.O. A general review of CO2 sequestration in underground geological formations and assessment of depleted hydrocarbon reservoirs in the Niger Delta. Appl. Energy 2023, 350, 121723. [Google Scholar] [CrossRef]
  6. Dehghani, M.R.; Kafi, M.; Nikravesh, H.; Aghel, M.; Mohammadian, E.; Kazemzadeh, Y.; Azin, R. Data driven models for predicting pH of CO2 in aqueous solutions: Implications for CO2 sequestration. Results Eng. 2024, 24, 102889. [Google Scholar] [CrossRef]
  7. Massarweh, O.; Abushaikha, A.S. CO2 sequestration in subsurface geological formations: A review of trapping mechanisms and monitoring techniques. Earth-Sci. Rev. 2024, 253, 104793. [Google Scholar] [CrossRef]
  8. Zhuang, X.; Wang, W.; Su, Y.; Shi, M.; Dai, Z. Life-cycle prediction and optimization of sequestration performance in CO2 mixture huff-n-puff development for tight hydrocarbon reservoirs. Appl. Energy 2025, 388, 125618. [Google Scholar] [CrossRef]
  9. Li, L.; Jia, C.; Yao, J.; Sepehrnoori, K.; Abushaikha, A.; Liu, Y. An Investigation of Gas-Fingering Behavior during CO2 Flooding in Acid Stimulation Formations. SPE J. 2024, 29, 3369–3386. [Google Scholar] [CrossRef]
  10. Giovannetti, R.; Gambelli, A.M.; Rossi, A.; Castellani, B.; Minicucci, M.; Zannotti, M.; Nicolini, A.; Rossi, F. Thermodynamic assessment and microscale Raman spectroscopy of binary CO2/CH4 hydrates produced during replacement applications in natural reservoirs. J. Mol. Liq. 2022, 368, 120739. [Google Scholar] [CrossRef]
  11. Zhang, X.; Spiers, C.J.; Peach, C.J. Compaction creep of wet granular calcite by pressure solution at 28 °C to 150 °C. J. Geophys. Res. Solid Earth 2010, 115, B09217. [Google Scholar] [CrossRef]
  12. Rathnaweera, T.D.; Ranjith, P.G.; Perera, M.S.A. Experimental investigation of geochemical and mineralogical effects of CO2 sequestration on flow characteristics of reservoir rock in deep saline aquifers. Sci. Rep. 2016, 6, 19362. [Google Scholar] [CrossRef] [PubMed]
  13. Mérit, L.; Soret, M.; Dubacq, B.; Agard, P.; Précigout, J.; Stünitz, H. Grain-scale feedback between deformation mechanisms and metamorphic reactions: Dissolution-precipitation processes in the lower crust (Kågen gabbros). Earth Planet. Sci. Lett. 2025, 656, 119275. [Google Scholar] [CrossRef]
  14. van den Ende, M.P.A.; Niemeijer, A.R.; Spiers, C.J. Influence of Grain Boundary Structural Evolution on Pressure Solution Creep Rates. J. Geophys. Res. Solid Earth 2019, 124, 10210–10230. [Google Scholar] [CrossRef]
  15. Van Oosterhout, B.G.A.; Hangx, S.J.T.; Spiers, C.J. A threshold stress for pressure solution creep in rock salt: Model predictions vs. observations. In Mechanical Behavior of Salt; CRC Press: Boca Raton, FL, USA, 2022. [Google Scholar]
  16. Malvoisin, B.; Baumgartner, L.P. Mineral Dissolution and Precipitation Under Stress: Model Formulation and Application to Metamorphic Reactions. Geochem. Geophys. Geosystems 2021, 22, e2021GC009633. [Google Scholar] [CrossRef]
  17. Yasuhara, H.; Kinoshita, N.; Ogata, S.; Cheon, D.S.; Kishida, K. Coupled thermo-hydro-mechanical-chemical modeling by incorporating pressure solution for estimating the evolution of rock permeability. Int. J. Rock Mech. Min. Sci. 2016, 86, 104–114. [Google Scholar] [CrossRef]
  18. Zhu, T.; Wei, X.; Zhang, Z. Numerical simulation of hydraulic-mechanical-chemical field coupled acid fracturing in complex carbonate reservoir. Comput. Geotech. 2023, 156, 105277. [Google Scholar] [CrossRef]
  19. McDermott, C.; Bond, A.; Harris, A.F.; Chittenden, N.; Thatcher, K. Application of hybrid numerical and analytical solutions for the simulation of coupled thermal, hydraulic, mechanical and chemical processes during fluid flow through a fractured rock. Environ. Earth Sci. 2015, 74, 7837–7854. [Google Scholar] [CrossRef]
  20. Bernabé, Y.; Evans, B. Numerical modelling of pressure solution deformation at axisymmetric asperities under normal load. Geol. Soc. Lond. Spec. Publ. 2007, 284, 185–205. [Google Scholar] [CrossRef]
  21. Jiao, K.; Han, D.; Wang, B.; Chen, Y.; Bai, B.; Gong, L.; Yu, B. Pore-scale modeling of thermal-hydro-mechanical-chemical coupled rock dissolution and fracturing process. J. Clean. Prod. 2023, 421, 138391. [Google Scholar] [CrossRef]
  22. Yang, X.-S. Pressure solution in sedimentary basins: Effect of temperature gradient. Earth Planet. Sci. Lett. 2000, 176, 233–243. [Google Scholar] [CrossRef]
  23. Yang, X.-S. A unified approach to mechanical compaction, pressure solution, mineral reactions and the temperature distribution in hydrocarbon basins. Tectonophysics 2001, 330, 141–151. [Google Scholar] [CrossRef]
  24. Hu, M.; Steefel, C.I.; Rutqvist, J. Microscale Mechanical-Chemical Modeling of Granular Salt: Insights for Creep. J. Geophys. Res. Solid Earth 2021, 126, e2021JB023112. [Google Scholar] [CrossRef]
  25. Schneider, F.; Potdevin, J.L.; Wolf, S.; Faille, I. Mechanical and chemical compaction model for sedimentary basin simulators. Tectonophysics 1996, 263, 307–317. [Google Scholar] [CrossRef]
  26. Rutter, E.H. The kinetics of rock deformation by pressure solution. Philos. Trans. R. Soc. Lond. Ser. A Math. Phys. Sci. 1976, 283, 203–219. [Google Scholar]
  27. Renard, F.; Ortoleva, P.; Gratier, J.P. Pressure solution in sandstones: Influence of clays and dependence on temperature and stress. Tectonophysics 1997, 280, 257–266. [Google Scholar] [CrossRef]
  28. Tokunaga, T.K. DLVO-based estimates of adsorbed water film thicknesses in geologic CO2 reservoirs. Langmuir 2012, 28, 8001–8009. [Google Scholar] [CrossRef]
  29. Desarnaud, J.; Bonn, D.; Shahidzadeh, N. The Pressure induced by salt crystallization in confinement. Sci. Rep. 2016, 6, 30856. [Google Scholar] [CrossRef]
  30. van Noort, R.; Spiers, C.J. Kinetic effects of microscale plasticity at grain boundaries during pressure solution. J. Geophys. Res. 2009, 114. [Google Scholar] [CrossRef]
  31. Gundersen, E.; Renard, F.; Dysthe, D.K.; Bjørlykke, K.; Jamtveit, B. Coupling between pressure solution creep and diffusive mass transport in porous rocks. J. Geophys. Res. Solid Earth 2002, 107, ECV 19-1–ECV 19-19. [Google Scholar] [CrossRef]
  32. Spiers, C.J.; de Meer, S.; Niemeijer, A.R.; Zhang, X.D. Kinetics of rock deformation by pressure solution and the role of thin aqueous films. In Physicochemistry of Water in Geological and Biological Systems: Structures and Properties of Thin Aqueous Films; Nakashima, S., Spiers, C.J., Mercury, L., Fenter, P.A., Hochella, M.F., Jr., Eds.; Universal Academy Press: Tokyo, Japan, 2004; pp. 129–158. [Google Scholar]
  33. Lang, P.S.; Paluszny, A.; Zimmerman, R.W. Hydraulic sealing due to pressure solution contact zone growth in siliciclastic rock fractures. J. Geophys. Res. Solid Earth 2015, 120, 4080–4101. [Google Scholar] [CrossRef]
  34. Yasuhara, H.; Elsworth, D. Compaction of a rock fracture moderated by competing roles of stress corrosion and pressure solution. Pure Appl. Geophys. 2008, 165, 1289–1306. [Google Scholar] [CrossRef]
  35. Wheeler, J. Dramatic effects of stress on metamorphic reactions. Geology 2014, 42, 647–650. [Google Scholar] [CrossRef]
  36. Gratier, J.; Guiguet, R.; Renard, F.; Jenatton, L.; Bernard, D. A pressure solution creep law for quartz from indentation experiments. J. Geophys. Res. Solid Earth 2009, 114. [Google Scholar] [CrossRef]
  37. Robin, P.-Y.F. Letter Section Determination of geologic strain using randomly oriented strain markers of any shape. Tectonophysics 1977, 42, T7–T16. [Google Scholar] [CrossRef]
  38. Launeau, P.; Bouchez, J.-L.; Benn, K. Shape preferred orientation of object populations: Automatic analysis of digitized images. Tectonophysics 1990, 180, 201–211. [Google Scholar] [CrossRef]
  39. Mulchrone, K.F.; Meere, P.A. Shape fabric development in rigid clast populations under pure shear: The influence of no-slip versus slip boundary conditions. Tectonophysics 2015, 659, 63–69. [Google Scholar] [CrossRef]
  40. Wassmann, S.; Stöckhert, B. Low stress deformation of garnet by incongruent dissolution precipitation creep. J. Struct. Geol. 2013, 46, 200–219. [Google Scholar] [CrossRef]
  41. Wassmann, S.; Stöckhert, B. Rheology of the plate interface—Dissolution precipitation creep in high pressure metamorphic rocks. Tectonophysics 2013, 608, 1–29. [Google Scholar] [CrossRef]
  42. Wang, Z.; Gilbert, B. A Unified Analytical Model for Pressure Solution With Fully Coupled Diffusion and Reaction. Geophys. Res. Lett. 2025, 52, e2024GL112975. [Google Scholar] [CrossRef]
  43. Parkhurst, D.L.; Appelo, C.A.J. Description of Input and Examples for PHREEQC Version 3: A Computer Program for Speciation, Batch-Reaction, One-Dimensional Transport, and Inverse Geochemical Calculations. In Modeling Techniques; U.S. Geological Survey: Reston, VA, USA, 2013. [Google Scholar] [CrossRef]
  44. Pruess, K.; Oldenburg, C.; Moridis, G. TOUGH2 User’s Guide, Version 2.0; LBNL-43134; Earth Sciences Division, Lawrence Berkeley National Laboratory University of California: Berkeley, CA, USA, 1996. [Google Scholar]
  45. Kolditz, O.; McDermott, C.; Yoon, J.S.; Mollaali, M.; Wang, W.; Hu, M.; Sasaki, T.; Rutqvist, J.; Birkholzer, J.; Park, J.-W.; et al. A systematic model- and experimental approach to hydro-mechanical and thermo-mechanical fracture processes in crystalline rocks. Geomech. Energy Environ. 2025, 41, 100616. [Google Scholar] [CrossRef]
  46. Birkholzer, J.T.; Graupner, B.J.; Harrington, J.; Jayne, R.; Kolditz, O.; Kuhlman, K.L.; LaForce, T.; Leone, R.C.; Mariner, P.E.; McDermott, C.; et al. DECOVALEX-2023: An international collaboration for advancing the understanding and modeling of coupled thermo-hydro-mechanical-chemical (THMC) processes in geological systems. Geomech. Energy Environ. 2025, 42, 100685. [Google Scholar] [CrossRef]
  47. Liu, T.; Shi, Y.; Liu, T.; Lin, B. Dynamic Response of Gas Recovery Enhancement Efficiency in Coalbed Methane Displacement by Hot Flue Gas: From the Perspective of Thermo-Hydro-Mechanical-Chemical Coupling. Energy Fuels 2024, 38, 6962–6981. [Google Scholar] [CrossRef]
  48. Zhang, W.; Han, D.; Wang, B.; Chen, Y.; Jiao, K.; Gong, L.; Yu, B. Research on the solution of the thermo-hydro-mechanical-chemical coupling model based on the unified finite volume method framework. Therm. Sci. Eng. Prog. 2024, 55, 102889. [Google Scholar] [CrossRef]
  49. Taron, J.; Elsworth, D. Coupled mechanical and chemical processes in engineered geothermal reservoirs with dynamic permeability. Int. J. Rock Mech. Min. Sci. 2010, 47, 1339–1348. [Google Scholar] [CrossRef]
  50. Ciantia, M.O.; Hueckel, T. Weathering of submerged stressed calcarenites: Chemo-mechanical coupling mechanisms. Geotechnique 2013, 63, 768–785. [Google Scholar] [CrossRef]
  51. Ilgen, A.G.; Newell, P.; Hueckel, T.; Espinoza, D.N.; Hu, M. Coupled chemical-mechanical processes associated with the injection of CO2 into subsurface. In Science of Carbon Storage in Deep Saline Formations: Process Coupling Across Time and Spatial Scales; Elsevier: Amsterdam, The Netherlands, 2018; pp. 337–359. [Google Scholar] [CrossRef]
  52. Putnis, A. Mineral replacement reactions. Rev. Mineral. Geochem. 2009, 70, 87–124. [Google Scholar] [CrossRef]
  53. Vafaie, A.; Cama, J.; Soler, J.M.; Kivi, I.R.; Vilarrasa, V. Chemo-hydro-mechanical effects of CO2 injection on reservoir and seal rocks: A review on laboratory experiments. Renew. Sustain. Energy Rev. 2023, 178, 113270. [Google Scholar] [CrossRef]
  54. Vilarrasa, V.; Rutqvist, J. Thermal effects on geologic carbon storage. Earth-Sci. Rev. 2017, 165, 245–256. [Google Scholar] [CrossRef]
  55. Slaughter, W.S. The Linearized Theory of Elasticity; Birkhaeuser: Boston, MA, USA, 2002. [Google Scholar]
  56. Boley, A.A.; Weiner, J.H. Theory of Thermal Stresses; John Wiley & Sons: New York, NY, USA, 1960; Volume 270, p. 586. [Google Scholar] [CrossRef]
  57. Kasani, H.A.; Selvadurai, A.P.S. A Review of Techniques for Measuring the Biot Coefficient and Other Effective Stress Parameters for Fluid-Saturated Rocks. Appl. Mech. Rev. 2023, 75, 020801. [Google Scholar] [CrossRef]
  58. Li, K. Analytical derivation of Brooks-Corey type capillary pressure models using fractal geometry and evaluation of rock heterogeneity. J. Pet. Sci. Eng. 2010, 73, 20–26. [Google Scholar] [CrossRef]
  59. Lian, P.Q.; Tan, X.Q.; Ma, C.Y.; Feng, R.Q.; Gao, H.M. Saturation modeling in a carbonate reservoir using capillary pressure based saturation height function: A case study of the Svk reservoir in the Y Field. J. Pet. Explor. Prod. Technol. 2016, 6, 73–84. [Google Scholar] [CrossRef]
  60. Coussy, O. Mechanics and Physics of Porous Solids; Wiley: Hoboken, NJ, USA, 2010. [Google Scholar] [CrossRef]
  61. Carslaw, H.S.; Jaeger, J.C. Conduction of Heat in Solids, 2nd ed.; Oxford University Press: New York, NY, USA, 1959. [Google Scholar]
  62. Molina-Giraldo, N.; Blum, P.; Zhu, K.; Bayer, P.; Fang, Z. A moving finite line source model to simulate borehole heat exchangers with groundwater advection. Int. J. Therm. Sci. 2011, 50, 2506–2513. [Google Scholar] [CrossRef]
  63. Erol, S.; François, B. Multilayer analytical model for vertical ground heat exchanger with groundwater flow. Geothermics 2018, 71, 294–305. [Google Scholar] [CrossRef]
  64. Bejan, A.; Kraus, A.D. Heat Transfer Handbook; John Wiley & Sons Inc.: Hoboken, NJ, USA, 2003; p. 1480. [Google Scholar] [CrossRef]
  65. Huang, X.; Sun, J.; Shi, C.; Du, Y.; Xu, G. Fractal Analysis of the Penetration Flow Through Micro-nano Porous Gaskets with Effects of Slippage and Stress-Sensitivity. Fractals 2019, 27, 1950031. [Google Scholar] [CrossRef]
  66. Tan, X.-H.; Li, X.-P.; Liu, J.-Y.; Zhang, L.-H.; Fan, Z. Study of the effects of stress sensitivity on the permeability and porosity of fractal porous media. Phys. Lett. A 2015, 379, 2458–2465. [Google Scholar] [CrossRef]
  67. Erol, S.; Fowler, S.J.; Harcouët-Menou, V.; Laenen, B. An Analytical Model of Porosity—Permeability for Porous and Fractured Media. Transp. Porous Media 2017, 120, 327–358. [Google Scholar] [CrossRef]
  68. Katz, A.J.; Thompson, A.H. Fractal sandstone pores: Implications for conductivity and pore formation. Phys. Rev. Lett. 1985, 54, 1325–1328. [Google Scholar] [CrossRef]
  69. Li, W.; Zhao, H.; Li, S.; Sun, W.; Wang, L.; Li, B. A fractal model of effective stress of porous media and the analysis of influence factors. Results Phys. 2018, 8, 920–925. [Google Scholar] [CrossRef]
  70. Palandri, J.L.; Kharaka, Y.K. A Compilation of Rate Parameters of Water-Mineral Interaction Kinetics for Application to Geochemical Modeling; USGS Report 2004-1068; USGS: Menlo Park, CA, USA, 2004.
  71. Lasaga, A.C. Chemical kinetics of water-rock interactions. J. Geophys. Res. Solid Earth 1984, 89, 4009–4025. [Google Scholar] [CrossRef]
  72. Emmanuel, S.; Berkowitz, B. Effects of pore-size controlled solubility on reactive transport in heterogeneous rock. Geophys. Res. Lett. 2007, 34, 1–5. [Google Scholar] [CrossRef]
  73. Shi, J.Q.; Xue, Z.; Durucan, S. Supercritical CO2 core flooding and imbibition in Tako sandstone-Influence of sub-core scale heterogeneity. Int. J. Greenh. Gas Control 2011, 5, 75–87. [Google Scholar] [CrossRef]
  74. Harbert, W.; Goodman, A.; Spaulding, R.; Haljasmaa, I.; Crandall, D.; Sanguinito, S.; Kutchko, B.; Tkach, M.; Fuchs, S.; Werth, C.J.; et al. CO2 induced changes in Mount Simon sandstone: Understanding links to post CO2 injection monitoring, seismicity, and reservoir integrity. Int. J. Greenh. Gas Control 2020, 100, 103109. [Google Scholar] [CrossRef]
  75. Shi, Z.; Sun, L.; Haljasmaa, I.; Harbert, W.; Sanguinito, S.; Tkach, M.; Goodman, A.; Tsotsis, T.; Jessen, K. Impact of Brine/CO2 exposure on the transport and mechanical properties of the Mt Simon sandstone. J. Pet. Sci. Eng. 2019, 177, 295–305. [Google Scholar] [CrossRef]
  76. Hangx, S.; van der Linden, A.; Marcelis, F.; Bauer, A. The effect of CO2 on the mechanical properties of the Captain Sandstone: Geological storage of CO2 at the Goldeneye field (UK). Int. J. Greenh. Gas Control 2013, 19, 609–619. [Google Scholar] [CrossRef]
  77. Bagdassarov, N. Thermal Properties of Rocks and Minerals. In Fundamentals of Rock Physics; Cambridge University Press: Cambridge, UK, 2021; pp. 455–504. [Google Scholar] [CrossRef]
  78. Zhang, Y.; Xue, Z.; Park, H.; Shi, J.; Kiyama, T.; Lei, X.; Sun, Y.; Liang, Y. Tracking CO2 Plumes in Clay-Rich Rock by Distributed Fiber Optic Strain Sensing (DFOSS): A Laboratory Demonstration. Water Resour. Res. 2019, 55, 856–867. [Google Scholar] [CrossRef]
  79. Cama, J.; Ganor, J. Dissolution Kinetics of Clay Minerals. Dev. Clay Sci. 2015, 6, 101–153. [Google Scholar] [CrossRef]
  80. Cosenza, P.; Giot, R.; Hedan, S. Elastic moduli of clay minerals and their aggregates: A review. Appl. Clay Sci. 2023, 236, 106878. [Google Scholar] [CrossRef]
  81. Ilgen, A.G.; Cygan, R.T. Mineral dissolution and precipitation during CO2 injection at the Frio-I Brine Pilot: Geochemical modeling and uncertainty analysis. Int. J. Greenh. Gas Control 2016, 44, 166–174. [Google Scholar] [CrossRef]
  82. Liteanu, E.; Spiers, C.J. Influence of pore fluid salt content on compaction creep of calcite aggregates in the presence of supercritical CO2. Chem. Geol. 2009, 265, 134–147. [Google Scholar] [CrossRef]
  83. Zheng, Z.; Ma, Q.; Hu, P.; Song, Y.; Wang, D. Uncertainty and sensitivity analysis of relative permeability curves for the numerical simulation of CO2 core flooding. Greenh. Gases Sci. Technol. 2020, 10, 519–530. [Google Scholar] [CrossRef]
  84. Shi, J.Q.; Xue, Z.; Durucan, S. History matching of CO2 core flooding CT scan saturation profiles with porosity dependent capillary pressure. Energy Procedia 2009, 1, 3205–3211. [Google Scholar] [CrossRef]
  85. Blanc, P.; Lassin, A.; Piantone, P.; Azaroual, M.; Jacquemet, N.; Fabbri, A.; Gaucher, E. Thermoddem: A geochemical database focused on low temperature water/rock interactions and waste materials. Appl. Geochem. 2012, 27, 2107–2116. [Google Scholar] [CrossRef]
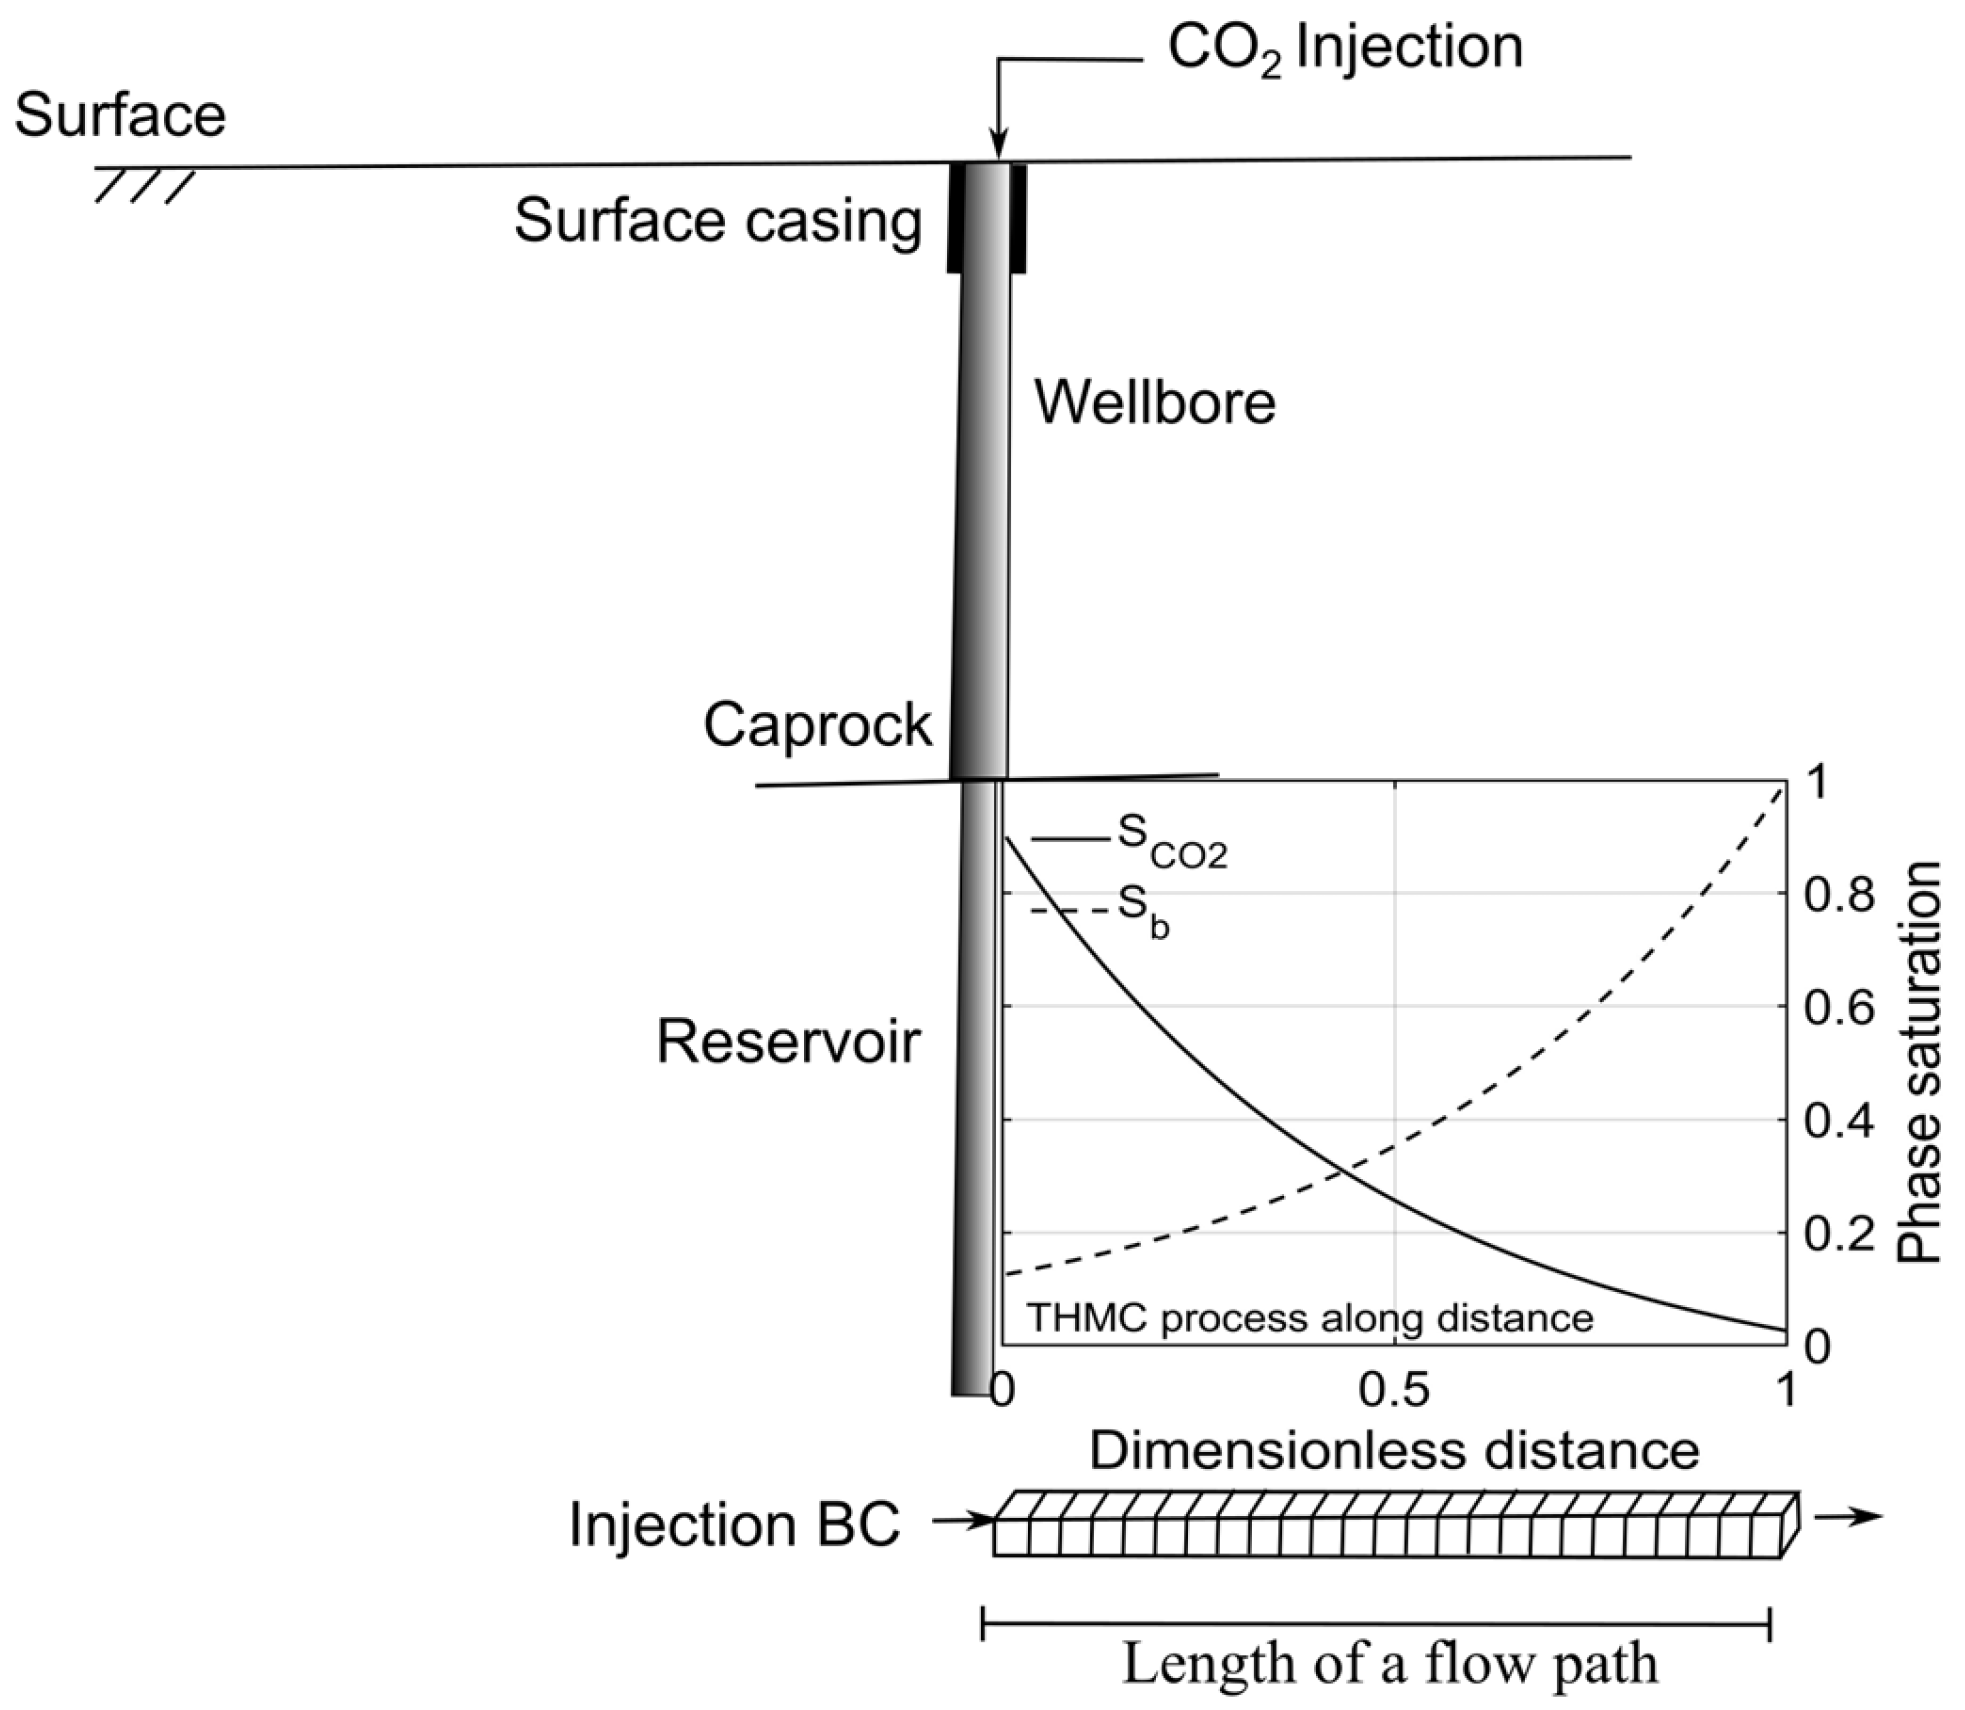
Figure 1. Illustration of the phase saturation change in CO2 and brine in an underground reservoir.
Modelling 06 00059 g001
Figure 2. Illustration of coupling in THMC process for pressure solution.
Modelling 06 00059 g002
Figure 3. Illustration of (a) two hollow circles for thermal stress problem; (b) thermal resistance model; (c) length of cylinder flow path.
Modelling 06 00059 g003
Figure 4. Validation between the computed porosity change with the THMC process and porosity measurements at 0 s (solid black line) and after 720 h (dashed black line) of the sCO2 exposure taken from Harbert et al. [74]. (a) Porosity changes over distance in time. (b) Total stress change was calculated in the sample along the Mt. Simon sandstone.
Modelling 06 00059 g004
Figure 5. Evaluations of stress–strain components of Mt Simon sandstone. (a) Effective stress versus strain of primary and secondary constituent minerals at the pore scale at r1. (b) Strain rates versus normalized porosity.
Modelling 06 00059 g005
Figure 6. (a) Saturation index of k-feldspar. (b) Amount of CO2 change in time. (c) Saturation index of nontronite. (d) pH. The results are evaluated with IPHREEQC depending on the boundary and initial conditions of the experiment provided by Harbert et al. [74].
Modelling 06 00059 g006
Figure 7. Validation of aqueous species. Measurements of Harbert et al. [74] are before (solid black line) and after (dashed black line). Colored lines are IPHREEQC results. (a) Sodium, (b) Potassium, (c) Calcium, (d) Magnesium, (e) Silica and (f) Barium.
Modelling 06 00059 g007
Figure 8. Validation between the computed porosity change with the THMC computation process (lines) and measured porosity changes taken from Shi et al. [73] evaluated with a micro-CT (markers) during the sCO2 injection. (a) Porosity change over distance concerning injected PV. (b) Calculated volumetric strain change along the Tako sandstone.
Modelling 06 00059 g008
Figure 9. Evaluations of stress–strain components of Tako sandstone. (a) Effective stress versus strain of primary and secondary constituent minerals at the pore scale at r1. (b) Strain rates versus normalized porosity.
Modelling 06 00059 g009
Figure 10. (a) Saturation of CO2 in Tako sandstone measured by Shi et al. [73]. (b) Amount of CO2 as pore volume PV changes. (c) Saturation index of smectite. (d) Saturation index of quartz. (bd) IPHREEQC evaluations based on the boundary and initial conditions of the experiment by Shi et al. [73].
Modelling 06 00059 g010
Figure 11. Evaluation of the number of aqueous species in the Tako sample, calculated with IPHREEQC. Computation is carried out based on the boundary (PV injection) and initial conditions of the experiment by Shi et al. [73]. (a) Calcium, (b) Magnesium, (c) Iron and (d) pH.
Modelling 06 00059 g011
Figure 12. Comparison of measurements taken from Liteanu and Spiers [82], the conventional IPS model described by Zhang et al. [11], and the novel THMC algorithm results. (a) Volumetric strain over time. (b) Strain rate comparison between the conventional IPS model in Equation (37) (dashed line), measurements (circles), and Equation (33) coupled with the THMC algorithm (solid line). The applied total stress σT is 30 MPa at 80 °C, and the sCO2 injection pressure is 10 MPa. The salinity of the pore fluid is 1 M NaCl.
Modelling 06 00059 g012
Table 1. Aquatic chemistry of experiments taken from Harbert et al. [74].
IonSample VW1-6926 [mol kg−1]
Before the TestAfter the Test (720 h)
Ca0.5520.5067
K0.0580.0537
Mg0.0820.0752
Na1.911.607
Ba2.97 × 10−65.66 × 10⁻⁶
Fe2.18 × 10−62.18 × 10⁻⁶
SiO2Below detection limit3.45 × 10−4
Table 2. Mineral constituents of the core sample were taken from Harbert et al. [74] and Shi et al. [75] for Mt Simon sandstone.
MineralVolume Fraction of the Core Sample (%)Moles in the Core Sample Based on the Solid Volume (2.852 × 10⁻⁵ m3)
Quartz (Primary)881.01
K-feldspar (Secondary)120.3
Table 3. The porosity of Mt Simon sandstone before and after the experiment was taken from Harbert et al. [74].
ParameterSample VW1-6919
Before the TestAfter the Test
Porosity0.2360.214
Table 4. Parameters for injection conditions [74].
ParameterValue
Total pore volume [m3]5.8412 × 10⁻⁶
Reference temperature Tref [K]326.15
Injection pressure of sCO2 [Pa]13.1 × 10⁶
Injection temperature Tinj [K]326.15
Injection volumetric flow rate [m3 s−1]4.5 × 10⁻⁷
Calculated flow velocity [m s−1]9.16 × 10⁻⁴
Table 5. Mechanical and chemical properties of minerals used for THMC computation.
ParameterQuartzK-Feldspar
Ratio of expansion of compacted power (Poisson’s ratio) 0.13 a0.05 b
Elasticity modulus of compacted powder E [Pa]16.2 × 10⁹ a12 × 109 b
Thermal expansion coefficient α [K−1] c1.5 × 10−51.5 × 10⁻⁵
Density of solid [kg m−3 K−1] c27502550
Thermal conductivity [W m−1 K−1] c64
Kinetic rate constant [mol m−2 s−1] d1 × 10−143.9 × 10⁻¹³
Activation energy Ea [kJ mol−1] d87.638
a [74] for Mt. Simon sandstone; b [76]; c [77]; d [70].
Table 6. Parameters taken from Shi et al. [73] for the Tako sandstone sample were used to calculate the THMC process, and a comparison was performed with their experimental results.
ParameterSample T36-14.5
Before the TestAfter the Test
Permeability [m2]3.6 × 10−1539.5 × 10−15
Porosity~0.25~0.285
Minimum pore radius [m]0.1 × 10⁻⁷
Maximum pore radius [m]1 × 10⁻⁶
Total pore volume [m3]4.161 × 10⁻⁵
Reference temperature Tref [K]298.15
Injection pressure of sCO2 [Pa]10 × 106
Injection temperature Tinj [K]313.15
Injection volumetric flow rate [m3 s−1]
Injected pore volume [PV]
1.66 × 10⁻⁹ between 0.1 and 2.9 PV
5 × 10⁻⁸ between 5 and 13.4 PV
Calculated flow velocity [m s−1]1.5 × 10⁻⁶ between 0.1 and 2.9 PV
4.55 × 10⁻⁵ between 5 and 13.4 PV
Ionic strength of the brine in the saturated core sample~3
Table 7. Thermo-mechanical–chemical parameters based on the Tako sandstone experiment of Shi et al. [73] used in THMC computation.
ParameterQuartzKaolinite
Ratio of expansion of compacted power (Poisson’s ratio) 0.08 a0.05 b
Elasticity modulus of compacted powder E [Pa]7 × 10⁹ a10 × 109 b
Thermal expansion coefficient α [K−1] c1.5 × 10−51.5 × 10⁻⁵
Density of solid [kg m−3 K−1] c27502600
Thermal conductivity of quartz [W m−1 K−1] c64
Kinetic rate constant of quartz [mol m−2 s−1] d1 × 10−141 × 10−13
Activation energy of quartz Ea [kJ mol−1] d87.622.2
a [80]; b [76]; c [77]; d [70].
Table 8. Mechanical and chemical kinetic parameters used for existing IPS model. All values were taken from Zhang et al. [11].
ParameterValue at 80 °C
Dissolution velocity Rdis8.49 × 10−10 [m s−1]
Precipitation velocity Rpre3.81 × 10−9 [m s−1]
Diffusion coefficient D5.98 × 10−10 [m2 s−1]
Water film thickness S1 × 10−9 [m]
Applied effective stress σe30 × 106 [Pa]
Molar volume of calcite Φ3.62 × 10⁻⁵ [m3 mol−1]
Disclaimer/Publisher’s Note: The statements, opinions and data contained in all publications are solely those of the individual author(s) and contributor(s) and not of MDPI and/or the editor(s). MDPI and/or the editor(s) disclaim responsibility for any injury to people or property resulting from any ideas, methods, instructions or products referred to in the content.