1. Introduction
Shear bands are a common phenomenon in many materials and also widely exist in geotechnical media. This phenomenon is closely related to the material properties and the local stress and strain situation [
1,
2]. Many researchers have studied the initiation conditions for simple shear and shear under one- or two-dimensional conditions [
3,
4].
From the micro point of view, the formation of a shear band in sediment results from local heterogeneous deformation during the rearrangement of the particles in the sediment [
5], causing a change in volume (dilation). In soil and rock layers, the volume change can be viewed as the change in porosity because the particles can be taken as incompressible. There are a lot of pores, including holes and fissures, in sediment, including gas hydrate-bearing sediments (GHBSs). When the sediment is disturbed under internal and external loadings, local pores expand or contract first, and new pore fissures may occur, which can cause changes in the neighboring pores, e.g., the diffusion of the pores in sediment. Generally, the sediment becomes weak and unstable when the porosity increases. These changes in porosity in local zones can cause local stability and further induce shear bands.
Only a few studies on shear bands in GHBS have been published. Kato et al. [
6] found that the width of the shear band in gas hydrate-bearing sand is thinner than that in pure sand, while more particle crushing occurs inside the shear band in MH-bearing sand. Jiang et al. [
7] argued that the occurrence of a shear band in GHBS is due to damage to the cohesion among grains, demonstrated by means of numerical simulation using the distinct element method. Sun [
8] investigated the initiation and development of a shear band in GHBS by using a triaxial apparatus combined with CT. Yoneda et al. [
9] found that the structure of the shear band significantly changed due to the movement and rotation of the soil particles and the hydrates in krypton hydrate-bearing sand by using a micro-focus X-ray CT in a novel micro triaxial testing apparatus via the PIV (particle image velociraptor) method. Pinkert and Grozic [
10] presented two micro-scale mechanisms of failure to explain the sudden strength loss and occurrence of double shear banding in gas hydrate-bearing sand. However, the understanding of the initiation of shear bands in GHBS is very limited. The occurrence of gas hydrates in sediment enhances the cementation among grains and decreases the porosity. During shear, the cementation may be damaged with the separation of grains and the expansion of porosity, which leads to the initiation mechanism of the shear band being more complex in GHBS than in common soils.
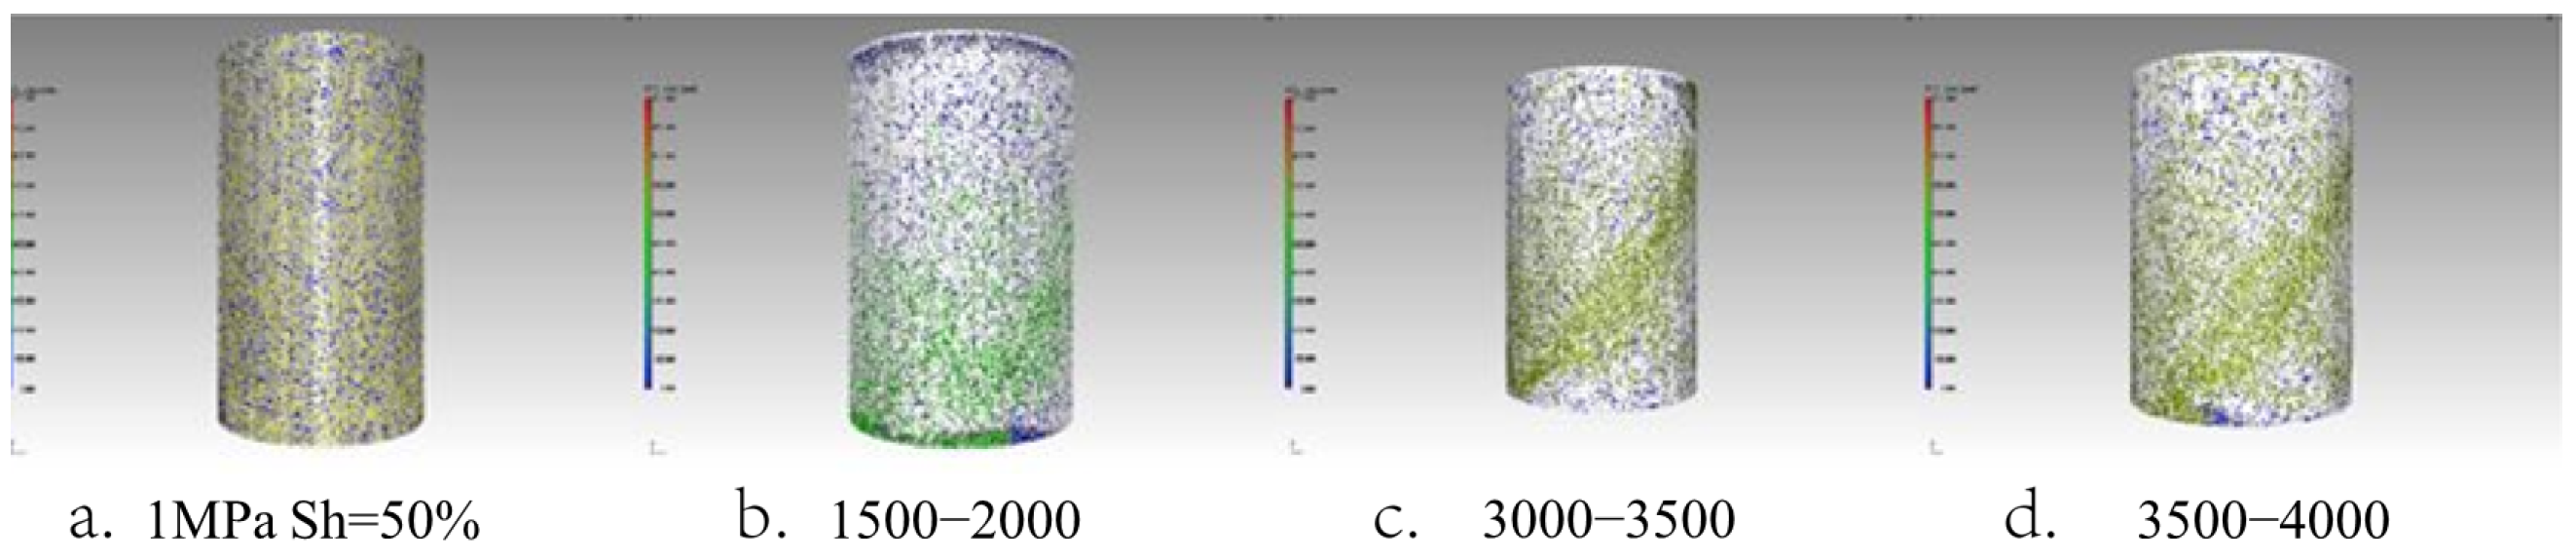
Figure 1 shows the changes in pore scale during shear [
8,
11]. The figure presents the retained pore volume after removing all the sand at different strain levels from the CT image while the sample is subjected to triaxial compression. Different pore volumes are represented by different colors. When the axial strain increases from 5% to 15%, the pore scale increases from 1500–2000 mm
3 to 3500–4000 mm
3. When the saturation of the gas hydrates is over 50%, the sediment displays brittleness. During shear, the sediment is dilatant, and the pore volume increases with the rising strain. The distribution of pore scale changes gradually from initially relatively uniform to inhomogeneous. Large pores gradually concentrate into one thin zone, namely, the shear band. From these experimental results, we can see that the changes in pore scale play a important role in the initiation of the shear band. In the beginning, the shear induces large pores in some very small local zones due to dilatation. With the increase in strain, the sum of large pores increases and correspondingly, the local strength of the zones with large pores decreases gradually. Once the local strength is below a certain value, the damage develops quickly and forms a thin penetrating stripe, meaning that the shear band forms. In other words, the development of a shear band is a destabilized process.
Theoretical studies on the initiation of shear bands have mainly employed the perturbation method or the bifurcation analysis method [
12,
13]. Perturbation analysis involves obtaining a set of equations for small-dimensional parameters by applying perturbation to a basic solution of the considered equations first, and then the critical instability conditions are obtained by analyzing the characteristic value. The bifurcation analysis method involves obtaining the instability conditions by analyzing the characteristic value of a system at the compatibility condition of stress and strain [
14,
15]. Experimental studies are mainly conducted using conventional triaxial experiments [
16] and plane strain compression tests [
17]. Research shows that uniform responses are often accompanied by diffuse, non-uniform deformation patterns, and then an obvious shear band occurs [
18,
19].
In this paper, the initiation of a shear band considering the effects of pore diffusion will be studied in order to develop a deep understanding of the instability phenomenon in sediment. Water and skeleton particles are both taken as being incompressible. The mathematical model is composed of a momentum equation of the skeleton and a pore diffusion equation. The shear stress is determined by the shear strain, strain rate, and porosity. The critical conditions for the initiation of a shear band are investigated theoretically by using the perturbation method. The changes in stress, strain, and porosity during the shear process are investigated by means of numerical simulation.
2. Mathematical Model
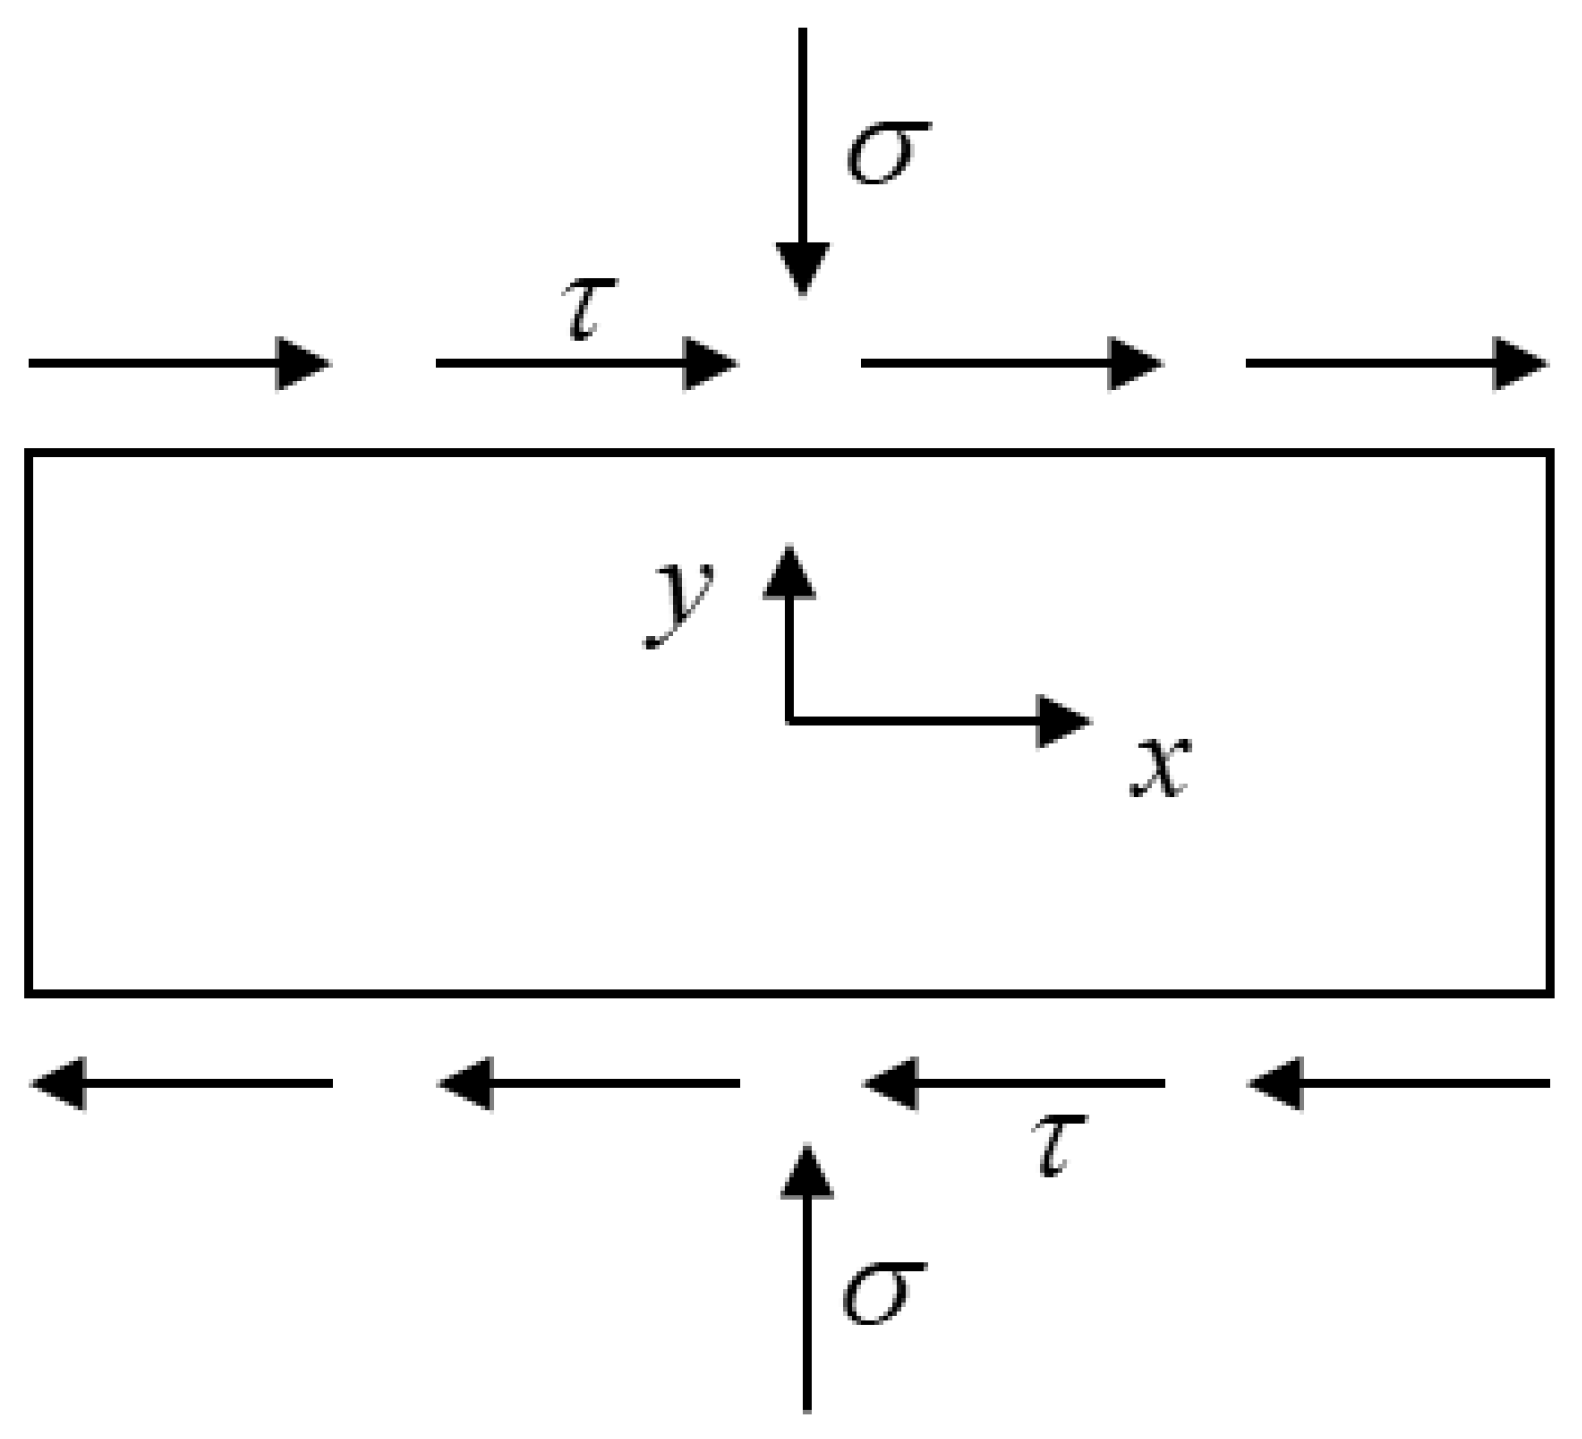
In this paper, we consider the following problem: the sediment is subject to simple shear. Deformation, particle rearrangement, and rotation can cause pore scale change. The changes in pores can diffuse to the surrounding area and cause changes in the local stress and strain. Therefore, it is assumed that the stress of sediment is determined by the strain, strain rate, and porosity. The expansion of pores due to dilation generally weakens the contact among particles and reduces the local strength of the sediment, resulting in the inhomogeneity of the sediment’s properties. The strain can make the sediment dense and increase its strength. The results of these two actions determine whether the deformation of sediment develops in the direction of localization or homogenization. The problem diagram is shown in
Figure 2.
For dense sediment, the particles occlude tightly with each other. When subjected to shear load, the particles will stagger, roll, lift, rotate, and pull out, resulting in an increase in the pore volume and a decrease in the strength. GHBS is actually a mixture composed of sediment particles, hydrate crystals, and pore water/gas, where sediment particles typically include sand or clay particles. Many studies show that pure hydrates have obvious compressive and shear strength effects, so hydrates can be regarded as another solid phase in sediment [
20]. The overall strength of hydrate sediments often depends not on the strength of the constituent particles but on the strength of the bonds between different particles. Under natural conditions, the proportion of hydrate particles in hydrate sediments is significantly lower than that of soil particles. Therefore, the effect of hydrate saturation on sediment strength is usually greater than the effect of the strength of the pure hydrate itself. Pure hydrates mainly affect the overall strength by filling sediment pores. In terms of the micro-scale mechanism, hydrate saturation and its occurrence in pores will affect the pore structure of GHBS and change the friction, cementation, and rolling of particles. In other words, the changes in the pore structure can be impacted by the saturation of gas hydrates.
Therefore, it is reasonable to assume that the strength is a function of porosity [
21].
According to the definition of the void ratio, for a sediment with non-suspended gas hydrates, the void ratio will decrease with the increase in hydrate saturation. In the constitutive model of GHBS, the void ratio is usually defined as the state parameters which are often used to reflect the shear dilatation and strain hardening/softening. The variation in the void ratio or porosity is related directly to the volume strain. Therefore, Zhang et al. took the volume strain as the damage parameter to build the stress–strain relationship [
22].
Therefore, it can be assumed that the stress is a function of the strain, strain rate, and porosity, i.e.,
There are a lot of pores in sediment. During shear, the skeleton of the sediment will deform and lead to changes in the pores. The changes in the pores, such as through movement, will affect the surrounding pores. This pore movement can be referred to as diffusion [
23], which is related to shear and diffusion effects. Since sediment particles can be considered incompressible, the volume change caused by shear dilatation is equal to the change in porosity. Martin et al. [
24] argued that the dilatancy is related to the maximum shear strain and the previous strain—that is, the volumetric strain rate is related to the shear strain rate. In other words, they argued that the mechanism of dilatancy is related to the shear work since the maximum shear strain is determined by the maximum shear stress and the current modulus or cumulated volume strain. The maximum shear strain is also determined by the scale of the hysteresis loop, which is the plastic work.
Based on the above, the diffusion equation of porosity n can be expressed as
in which
is the diffusion coefficient of porosity, and
C is the constant indicating the dilatation. The second term on the left-hand side indicates the diffusion of porosity, while the term on the right-hand side represents the dilatation caused by plastic work.
Assuming that there is no pore water, the deformation rate of the skeleton is slow, so the migration acceleration term can be ignored. The influence of gravity is not considered, and the momentum balance equation can be written as follows [
14]:
in which
is the displacement of sediment and is only a function of the coordinate
x,
is the density of sediment,
n is the porosity, and
is the shear stress.
Differentiating Equation (
3) with respect to
x,
in which
is the shear strain.
3. Perturbation Analysis
In this section, the perturbation method is used to analyze the initiation conditions of a shear band. Perturbation analysis is a common method to analyze system stability. By applying a perturbation solution to the system under consideration, the method can find the condition under which the perturbation grows infinitely with time—that is, the condition of system instability. Here, we take [
25]
in which
,
, and
are a set of solutions of Equations (
2) and (
4), and the absolute value is much larger than that of
,
,
. The second terms on the right-hand side of the above equations are perturbations,
is the frequency, and
is the wave number of the perturbation.
According to Equation (
1), we can get
in which
is the strain-stiffening coefficient, and
;
is the strain rate-stiffening coefficient, and
; and
is the porosity-softening coefficient, and
.
Instituting Equations (
5) and (
6) into Equations (
2) and (
4), the set of equations of perturbations can be obtained by retaining the first-order terms:
If the above homogeneous equation has a solution, the determinant of the coefficient matrix should be equal to zero. Then we get the characteristic equation of
:
in which
,
.
in which
It is obvious that this equation has two extreme situations.
(i) For a long wavelength (
), Equation (
9) has two solutions:
The deformation is always stable in this case due to the negative .
(ii) For a short wavelength (
), Equation (
9) has only one solution, which is
The deformation is again stable in this case due to the negative .
However, we can see that there is a term,
, which can be negative in Equation (
9). This negative term can cause the occurrence of positive
, i.e., the initiation of a shear band. It must occur at spectral wave numbers. Therefore, it is of interest to seek the wave number
for which the corresponding
is a maximum value. In addition to the spectral Equation (
18),
and
must satisfy the following equation:
which is
Due to
and
, we can obtain an important inequality:
Instituting Equation (
13) into Equation (
9), the equation to determine
can then be obtained as follows:
in which
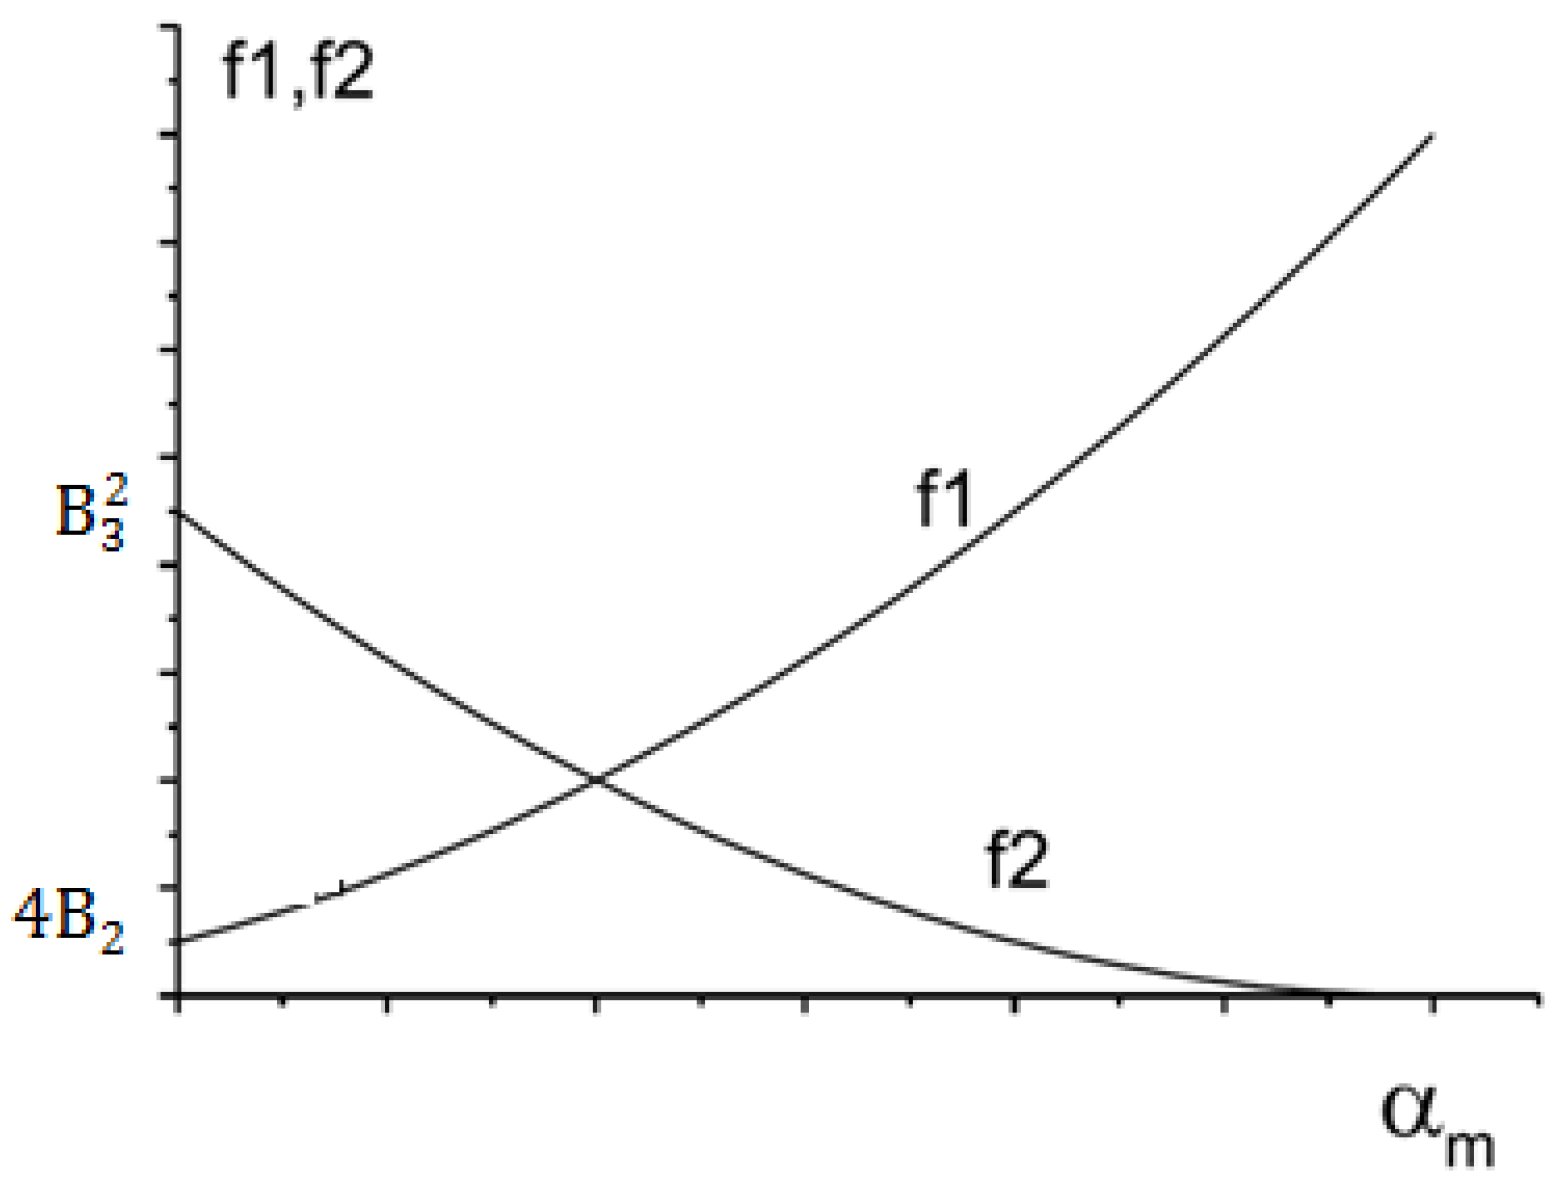
From
Figure 3 for the region
, it may be seen that the left branch of function
and the right branch of
must have an intersection between 0 and
as long as
This is the criterion for the existence of a solution
that we desire. Under most conditions
, since the case where
is greater than zero does not correspond to the actual situation analyzed in this paper, its absolute value being greater than zero actually implies the case where
is less than zero, and then the criterion can be simplified to [
2]
This shows that the instability or initiation of a shear band is the result of porosity-softening effects over strain-hardening effects. The micro-scale mechanism indicates that when the sediment is subject to shearing, the relatively dense sediment will be dilatant, the particles will rearrange, and the initial randomly arranged particles in sediment will all become upright due to inversion, meaning the number of pores will increase and the local strength will decrease. When this trend develops to a certain extent, instability occurs, the strain is further concentrated locally, and a shear band appears.
It is very interesting that the occurrence of instability is not related to the diffusion coefficient and the strain rate-hardening effect . However, these factors influence instability markedly in some other aspects. Next, three interesting special cases, namely no penetration, no strain hardening, and no pore pressure, will be discussed.
Three other conditions
(1) No diffusion of porosity, .
In this case, the spectral Equation (
8) becomes
We can see that if
, namely
,
will have a positive real root and instability will occur. It is important to appreciate that the same formal criterion (Equation (
19)) can be used whether the instability is due to diffusion or not.
(2) No strain hardening,
In this case, the spectral Equation (
8) becomes
The condition
has a positive real root as given below:
In this criterion, the diffusion coefficient , strain rate-hardening effect , and softening effect play a role.
(3) No pore pressure softening,
Now, we turn to discuss the second mode of instability, in which there is no pore pressure softening. In this case, we rewrite the spectral Equation (
8) as
Though
must be positive,
may be negative. Therefore,
may be another possible reason for instability. Equation (
23) can be rewritten as
It is easy to see that there must be a solution ; therefore, the deformation must be unstable.
4. Numerical Simulation
In the previous section, the instability conditions or the initiation of the shear band of the problem are obtained, but the details of the changes in the stress, strain, and porosity with time and space are not clear. Therefore, in this section, numerical simulation is conducted based on Equations (
2) and (
3) to validate the instability conditions and study the initiation and the evolution of the shear band and the development process of stress and porosity.
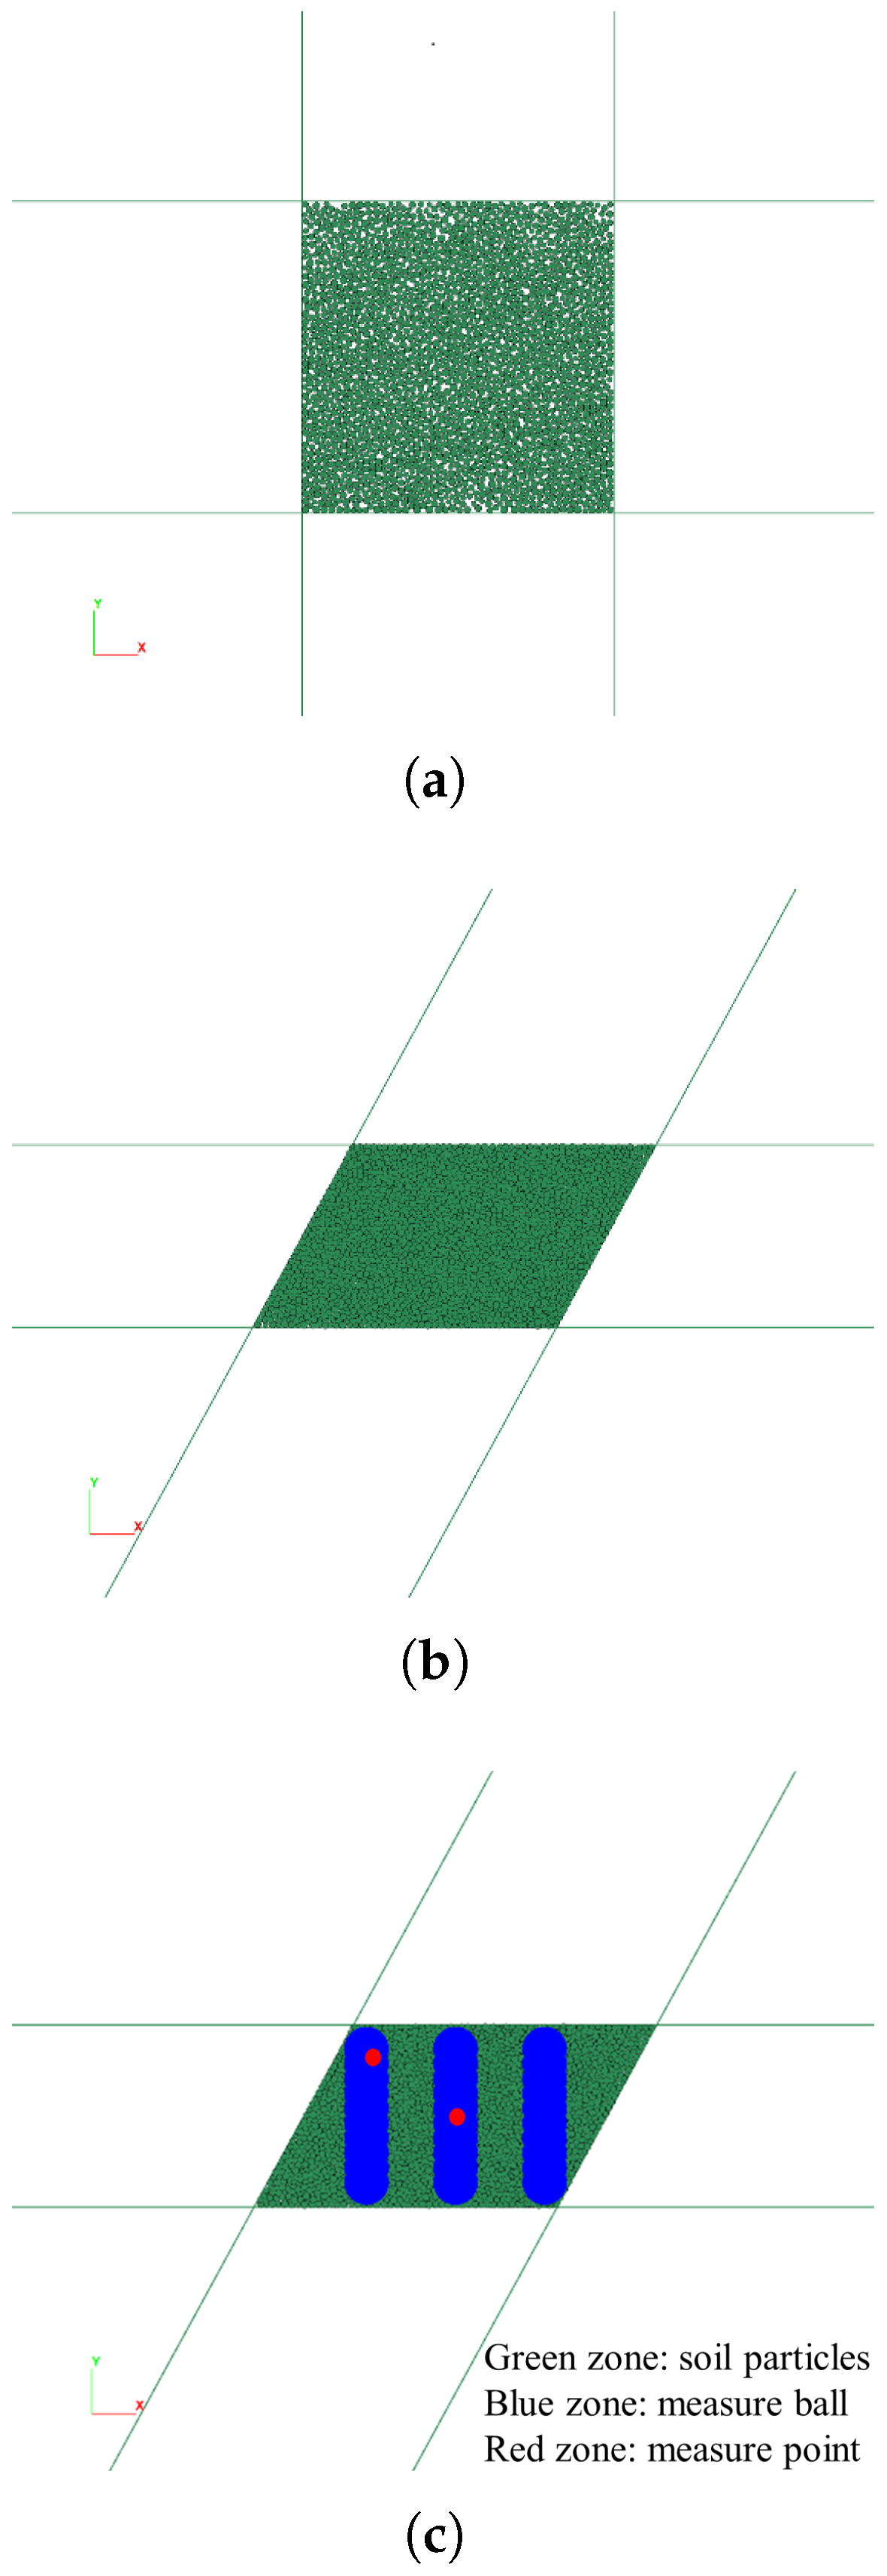
Firstly, a simple shear box model with a length and width of 0.07 m was established based on the PFC6.00 software. The size of the model was determined based on simple shear tests in soil mechanics. When simulating, the left and right walls were rotated at the same time with uniform clockwise rotation under the vertical extrusion of the upper and bottom walls, which made the internal particles subject to shear. The initial and termination states are shown in
Figure 4a,b, respectively. During this period, measuring balls were set up inside the model, as shown in
Figure 4c, to monitor the stress, strain rate, and porosity changes inside the model. In order to simulate the initiation of shear band under simple shear conditions, the particles in the model need to have different particle sizes. For this purpose, two particle sizes commonly found in soil particles were selected as representatives. Particles with diameters of 0.006 m and 0.009 m were used to fill the entire internal space of the model. The particle contact model is a cohesionless linear contact model with an initial porosity of 0.02 and a sphere density of 2500 kg/m
3. The results of the numerical simulation are shown in
Figure 5,
Figure 6 and
Figure 7 below.
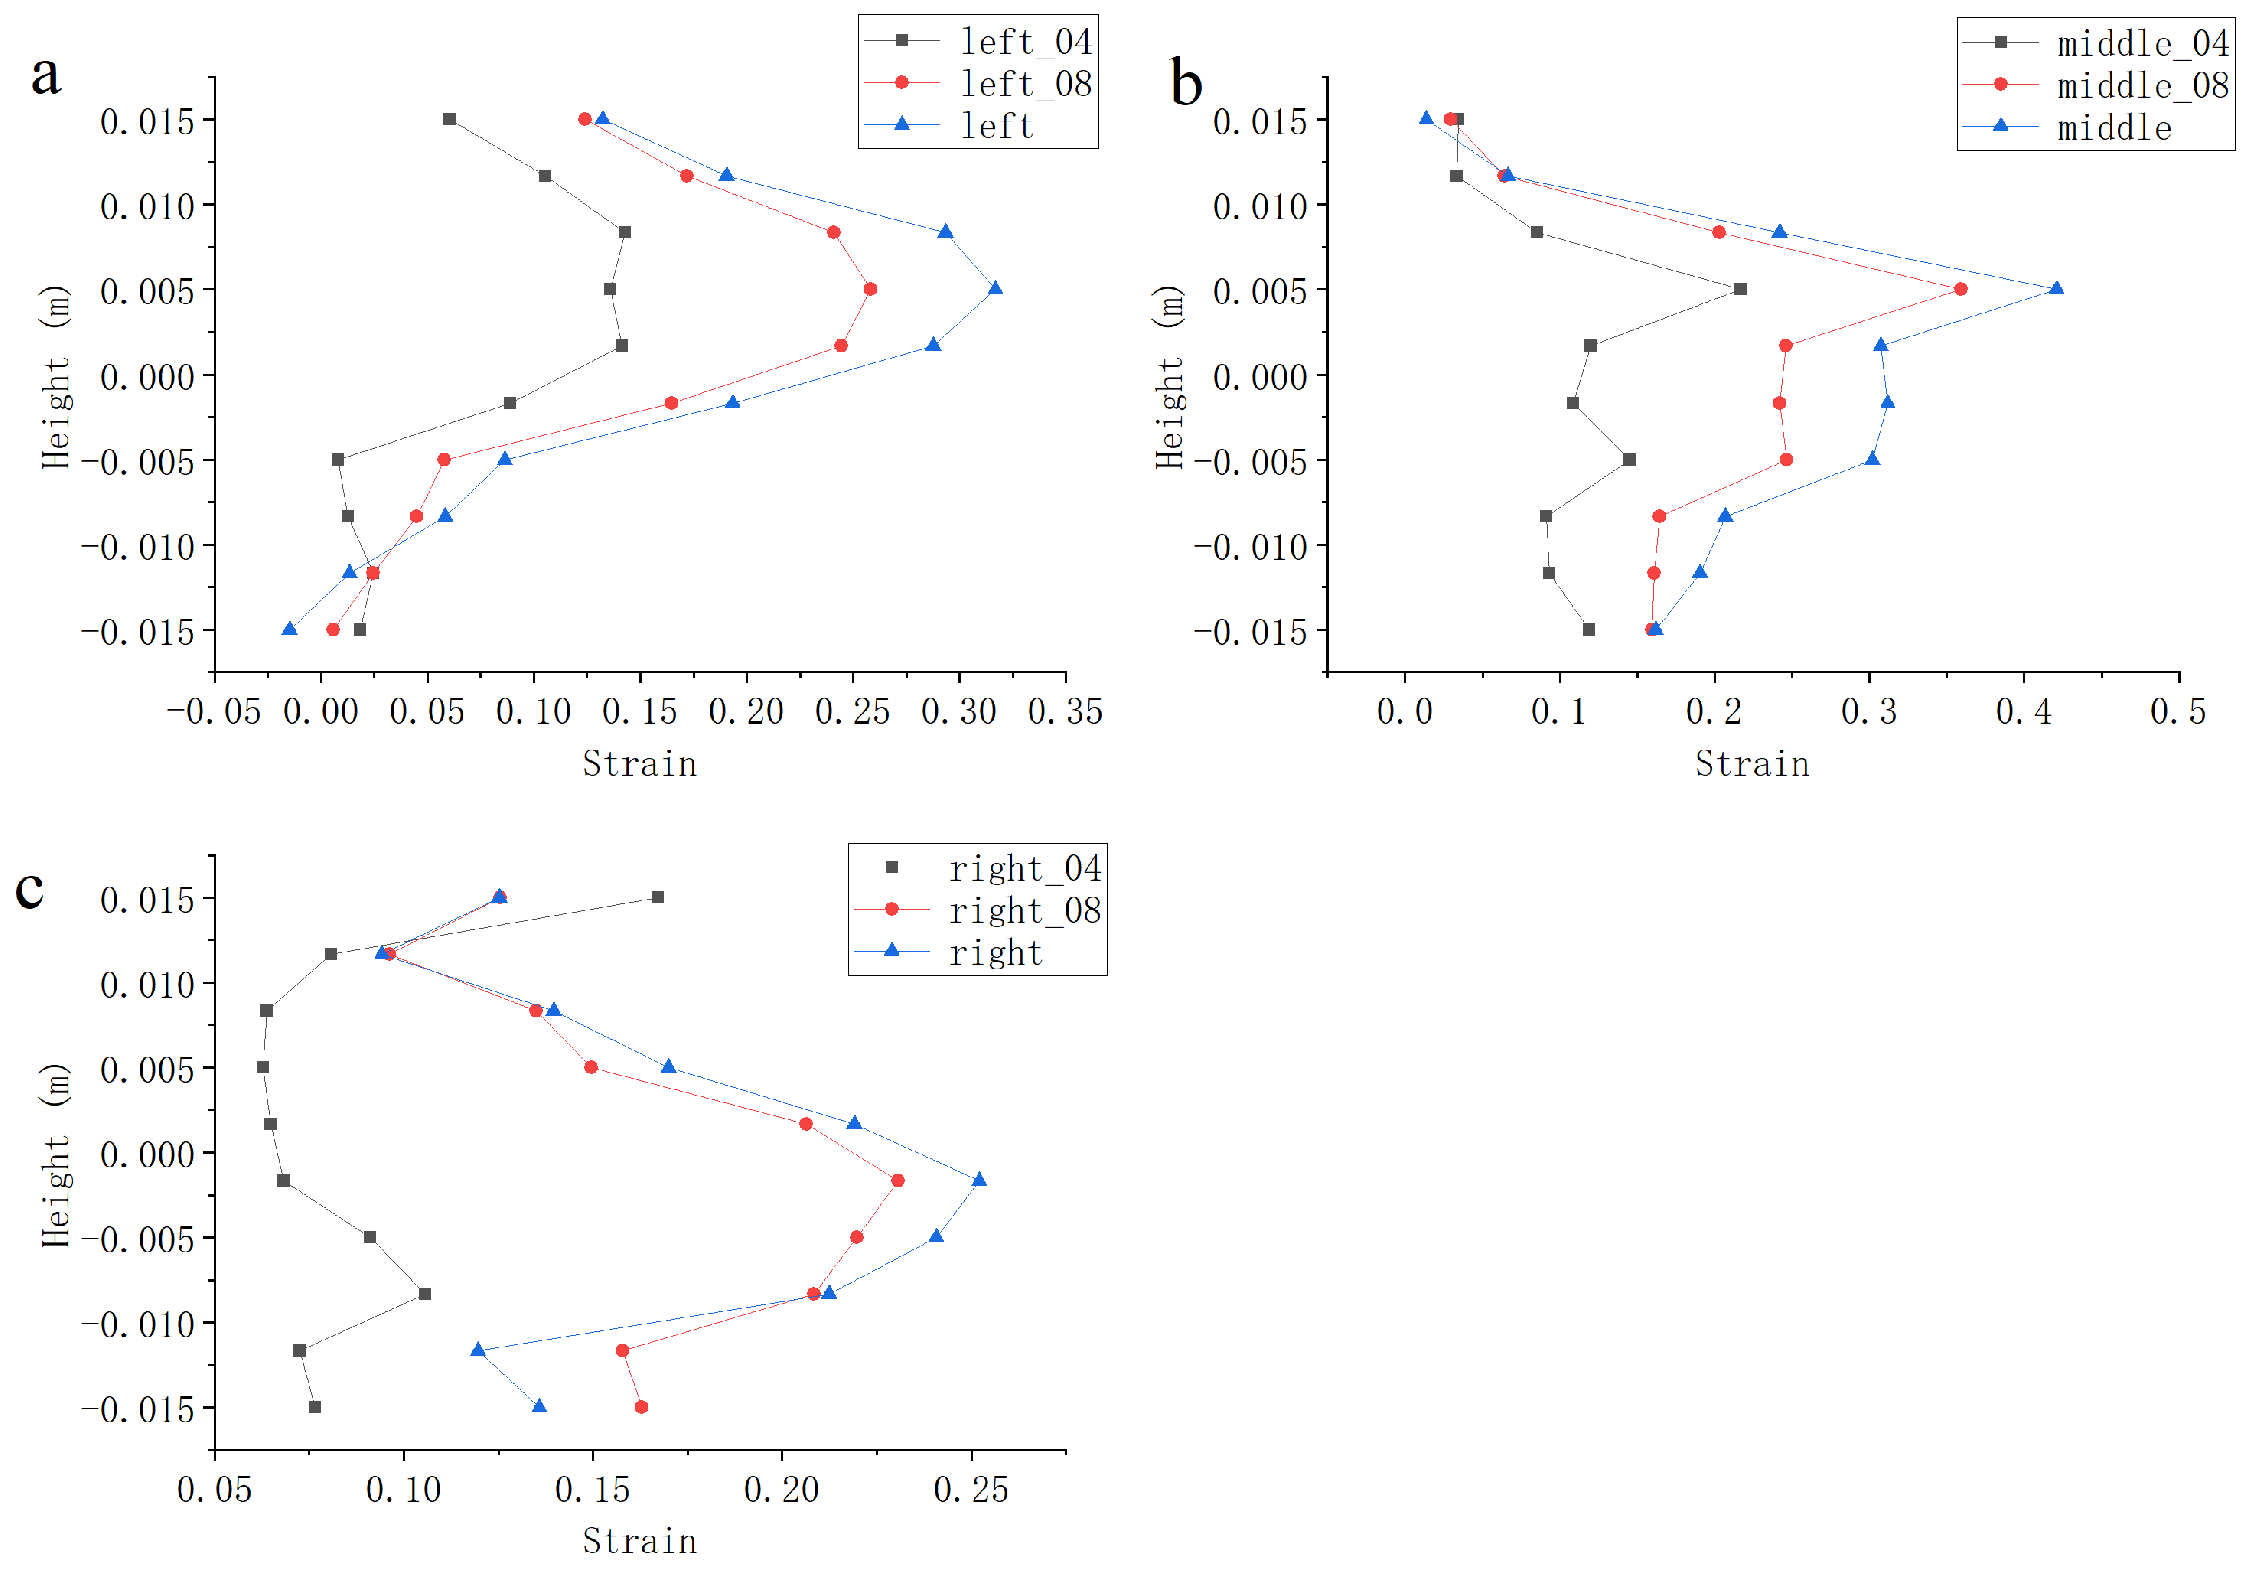
It can be seen from
Figure 5 that the closer we are to the center point
during shearing, the higher the strain value as the time of shearing increases. Considering the possible errors, no attempt is made here to find out the boundary of the shear zone. Instead, the point with coordinates
and the point with coordinates
at the boundary of the upper left corner of the model are used to substituted the judgment conditions of the shear zone (i.e., red point in
Figure 4). According to the analysis of the previous content, the point with coordinates
should exist inside the shear zone, while the point at the boundary should be in the region outside the shear zone. The curves in
Figure 5 support this viewpoint; moreover, the parameters corresponding to these two points are shown in
Table 1 below, and for sandy soil, taking
, the calculation results are as follows.
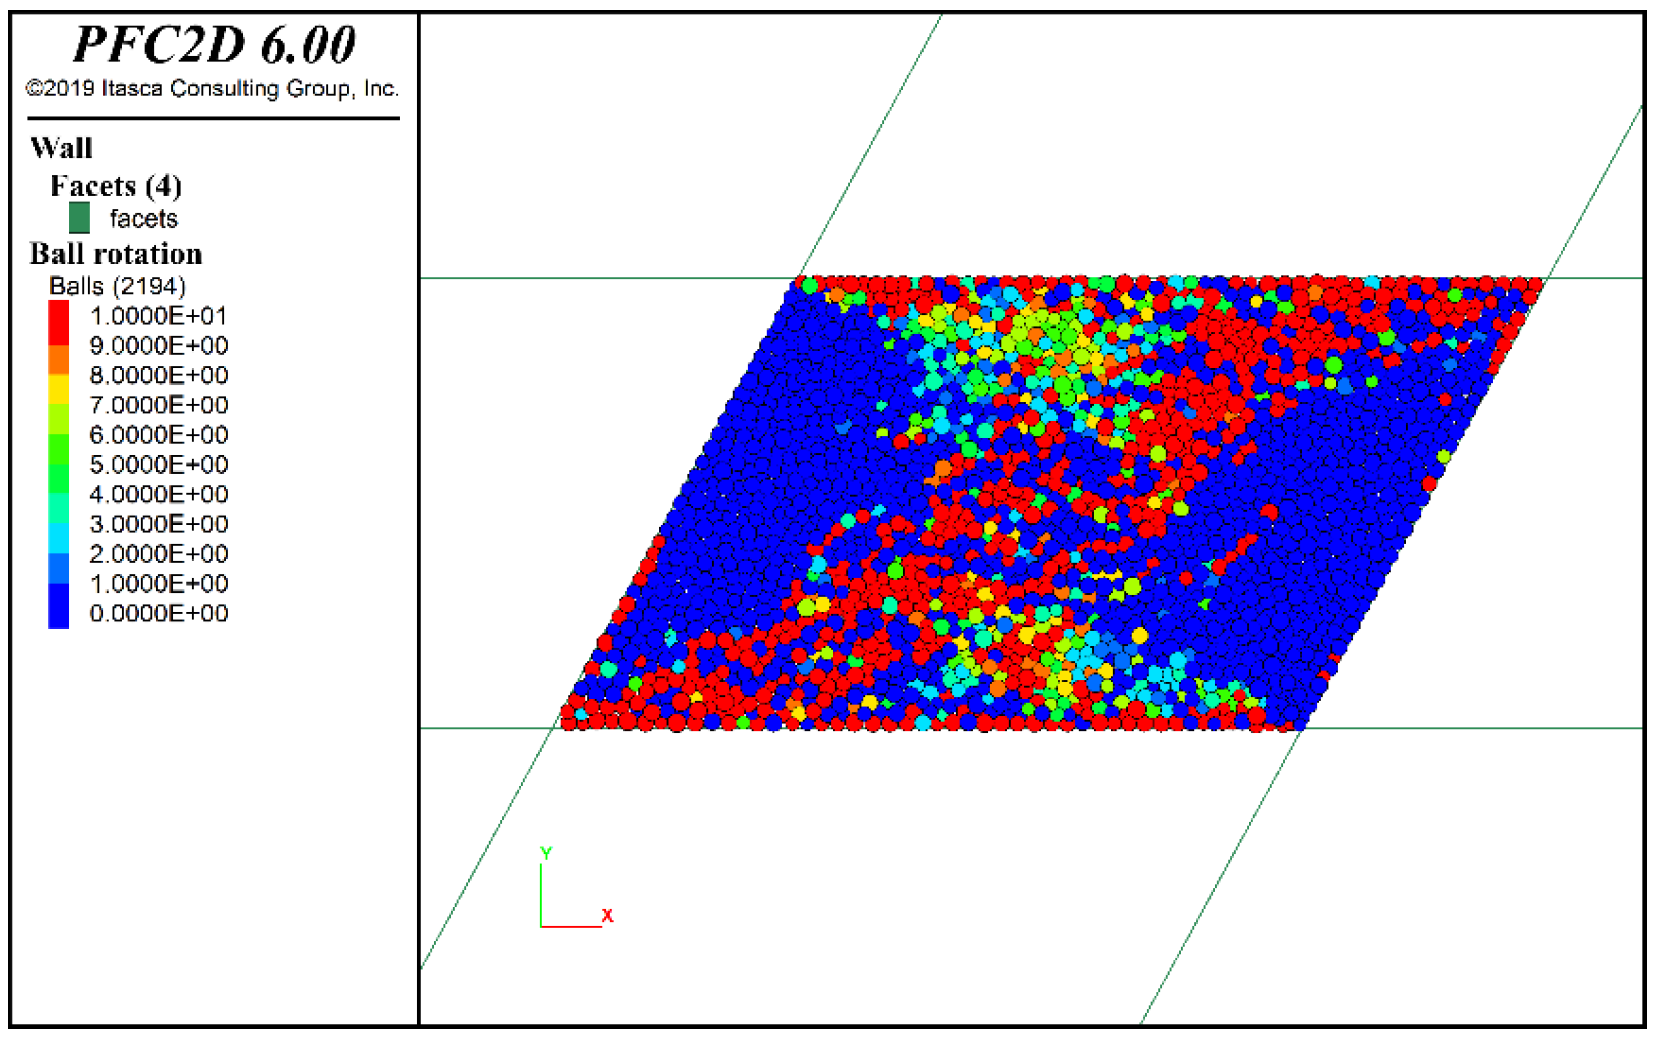
From the results of the calculations, it can be seen that even if the model is set up with a rather small size and most of the particles are already affected at the termination of the shear, with a considerable number of particles undergoing rotation (
Figure 6), the aforementioned criterion can still be used to determine the region of occurrence of the shear zone. In addition, as shown in
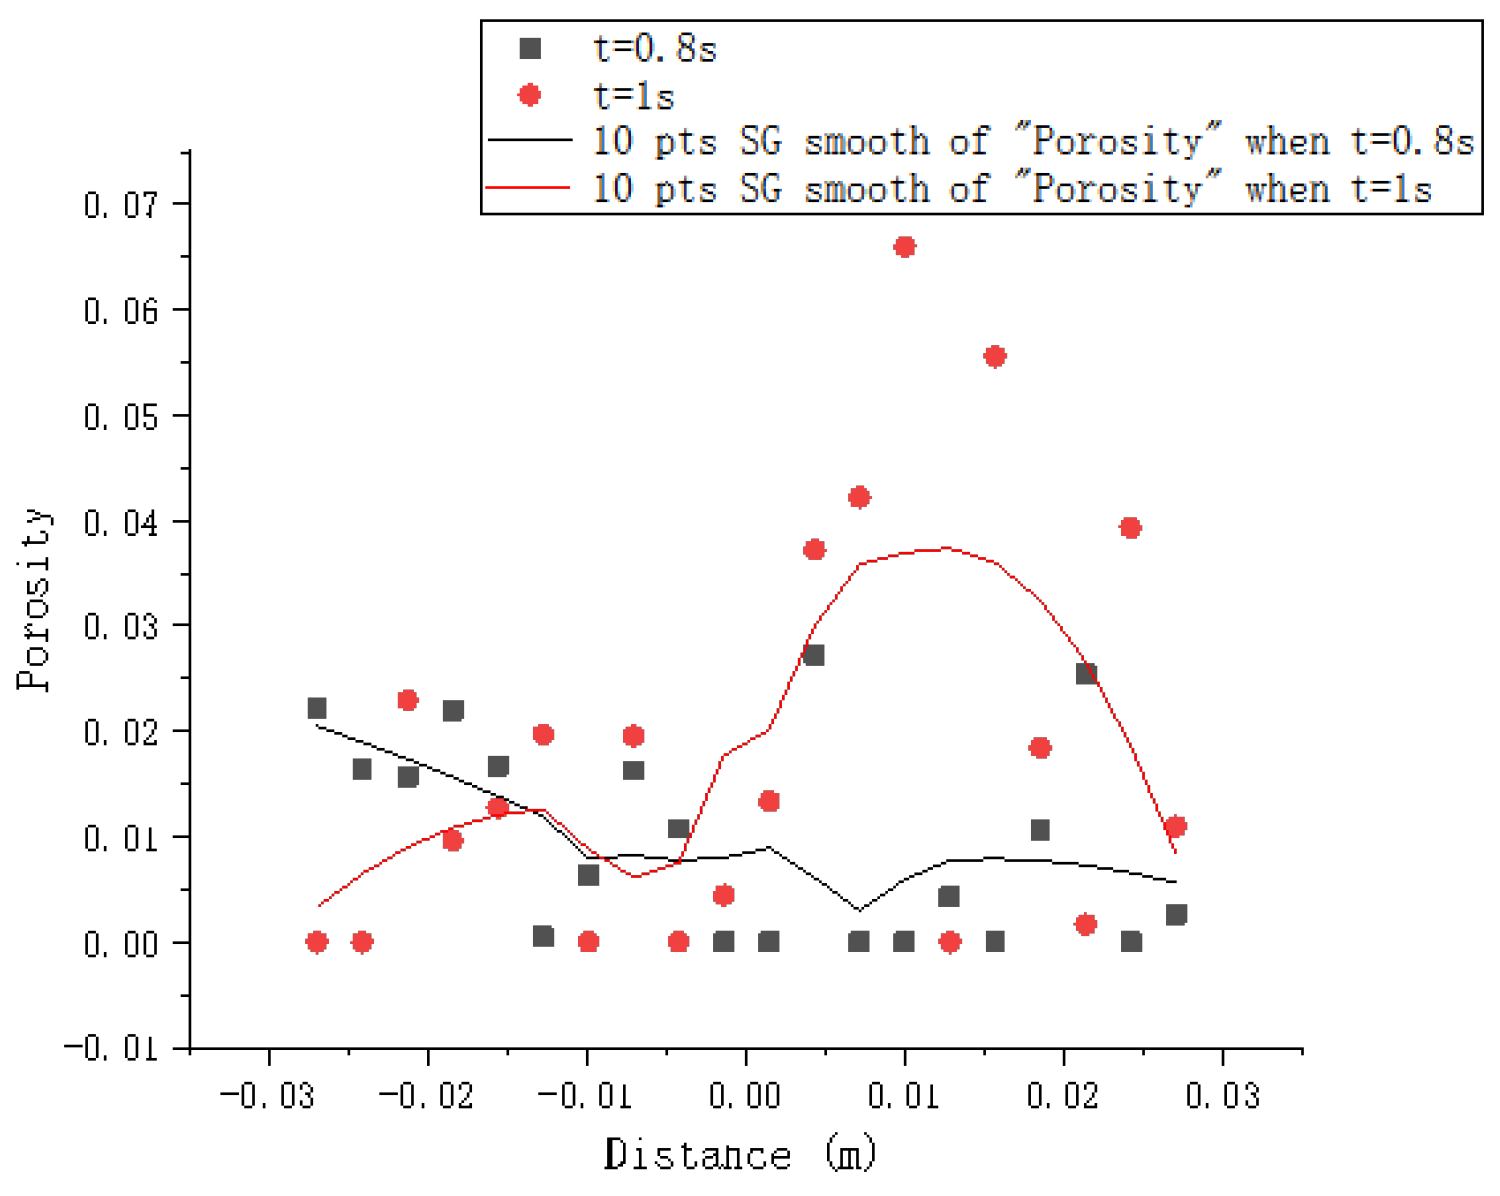
Figure 7, the final-state porosity profile along the transverse axis shows that, although most of the region has been perturbed, the largest porosity value still corresponds to the region in the center of the model, as speculated in the previous section. In addition, the time parameters included in the subsequent images are used to help determine the sequence in which the phenomenon occurred. The specific time at which the shear band formed is related to the loading speed, which is not the main issue here, so it will not be discussed.
Regarding the initiation and the evolution of the shear band and the development process of stress and porosity, generally, the constitutive model of sediment is nonlinear, and the following constitutive model is adopted in the simulation for simplicity:
The parameters adopted in the simulation are as follows: , , , , , , , and , .
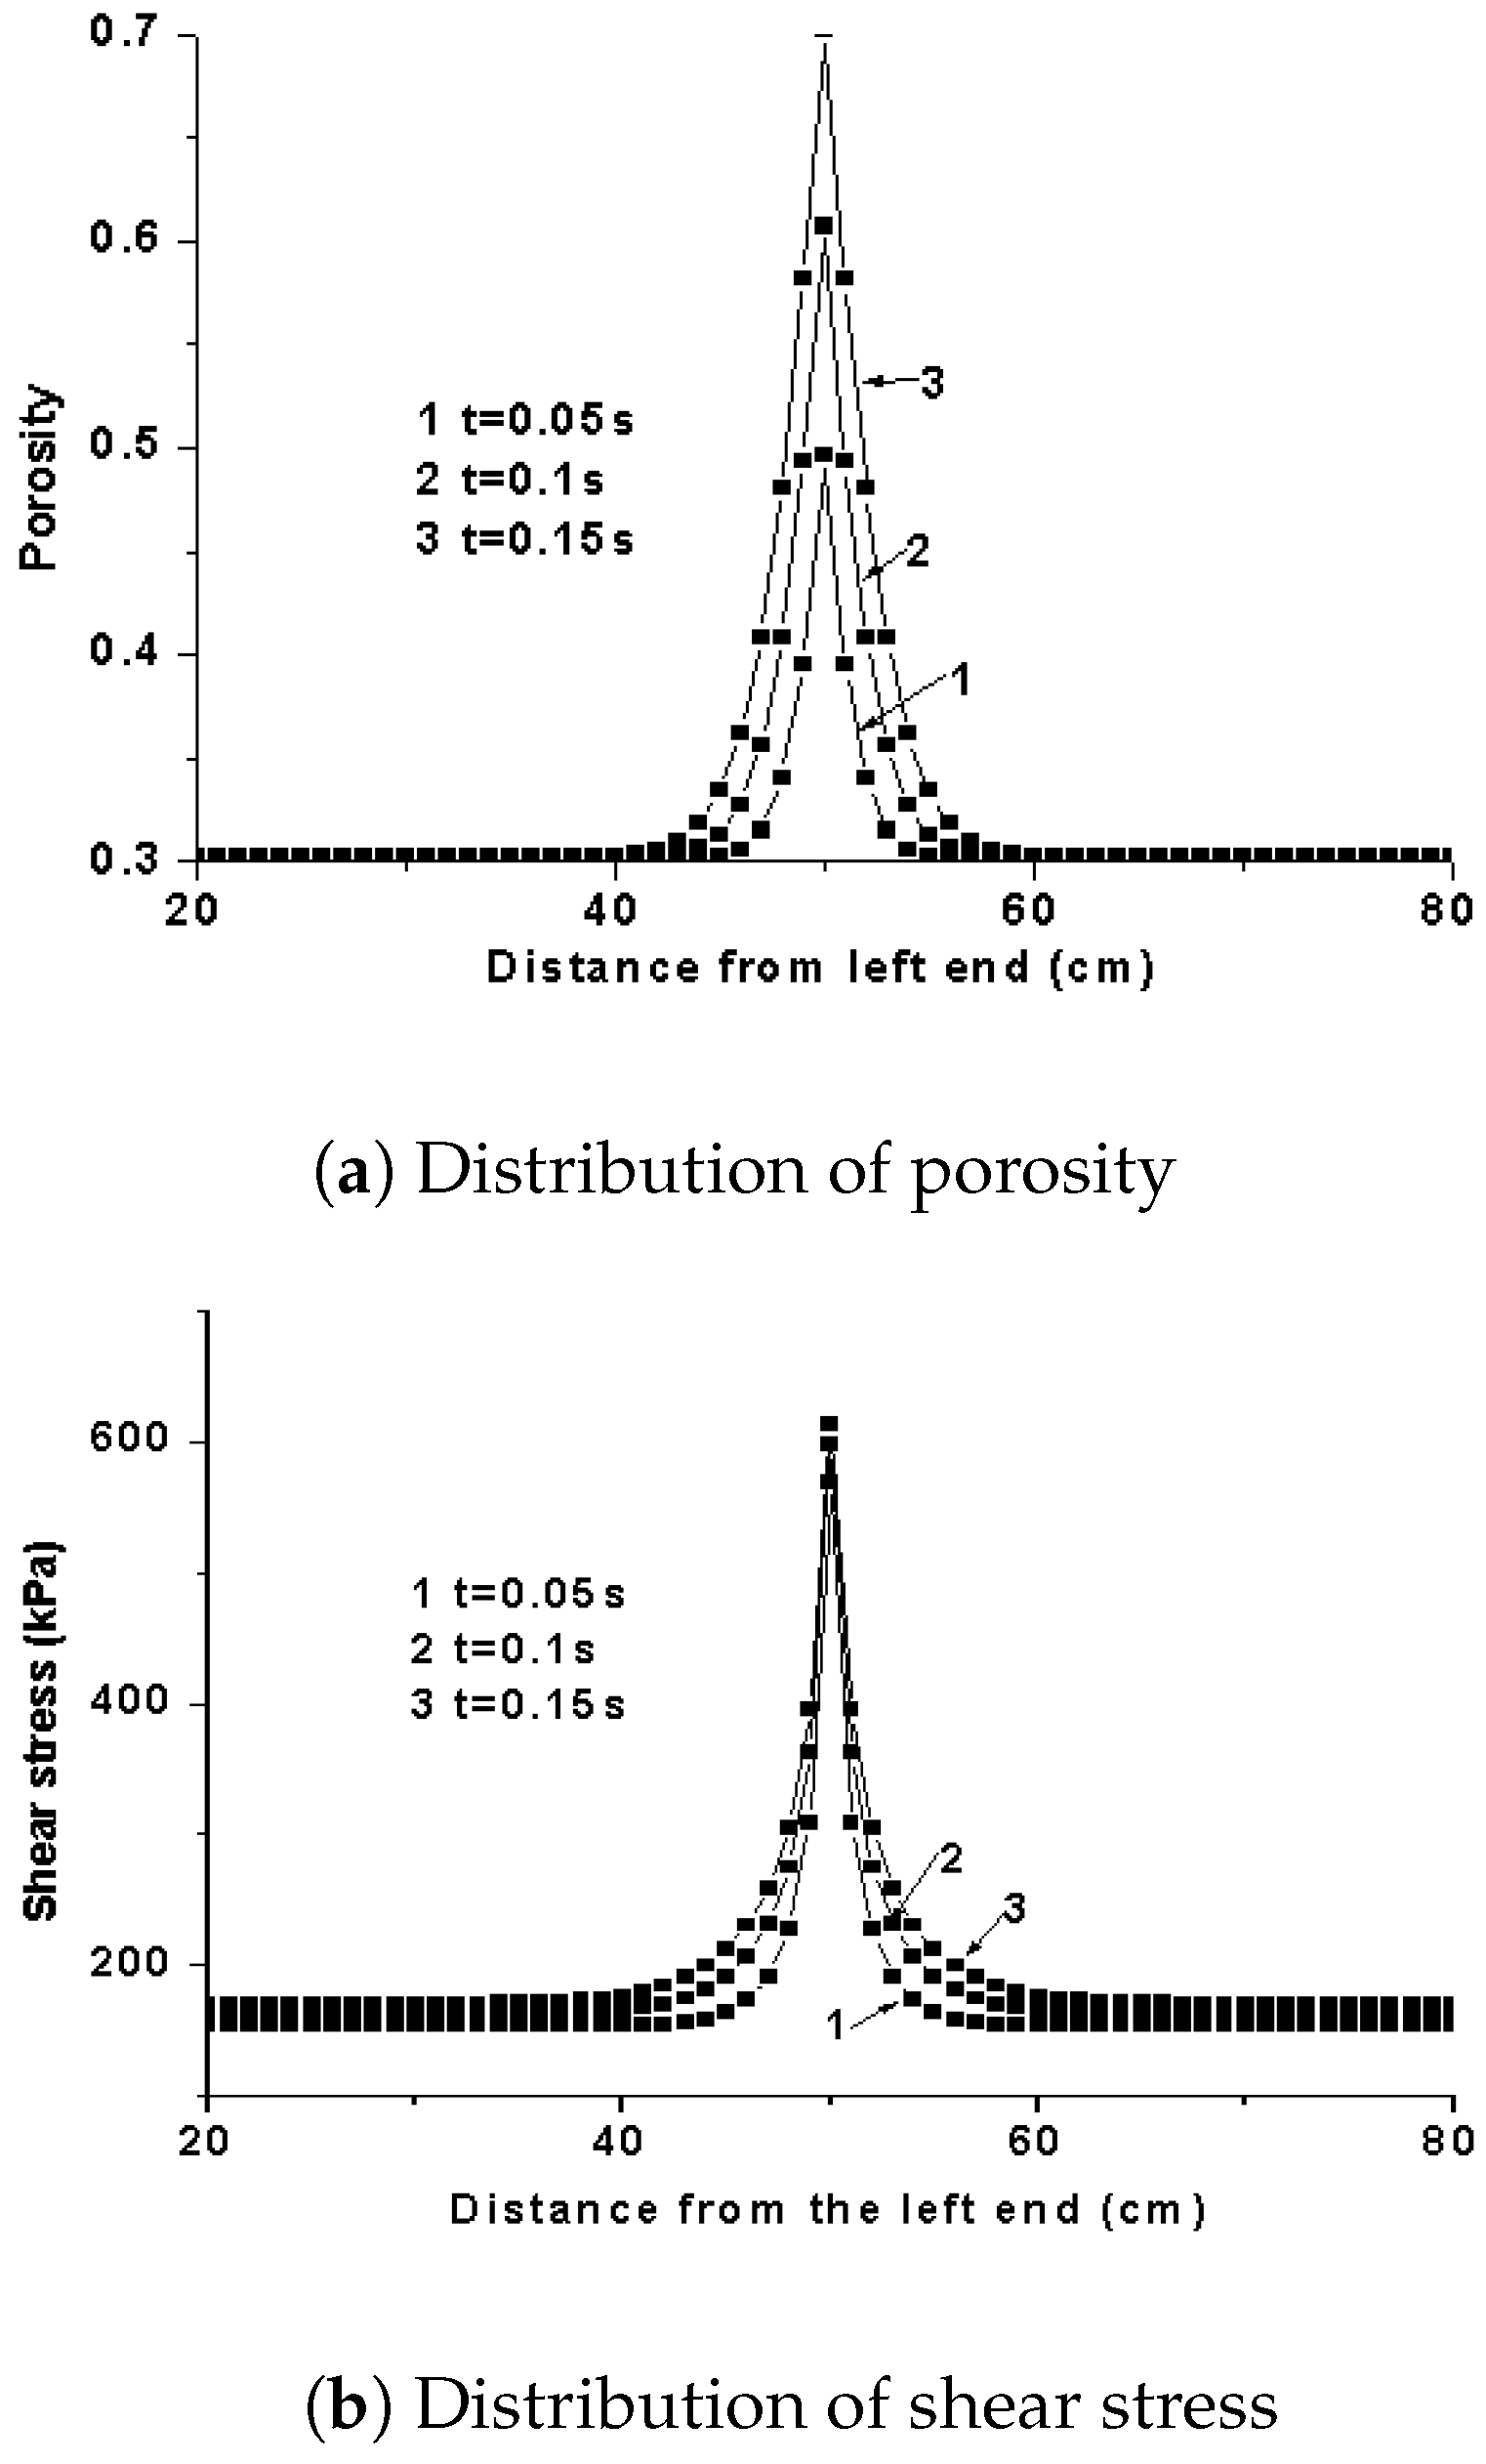
The finite difference method is used to calculate the above equation. The parameters used in the calculation are the aforementioned parameters. The shear stress, shear strain, and pore change are calculated by assuming that the initial strain at the center is 5% greater than that at other locations. First, we set the values of the parameters in the range of Equation (
19). It is shown that the shear stress and strain, as well as the porosity at the center, increase rapidly, which ultimately leads to localization. The localization area is less than 10% of the total area. The porosity in the center of the shear band is increased rapidly from 0.3 to 0.7 in 0.16 s, and the strain rate is increased 15 times (
Figure 8). Meanwhile, when the parameters do not meet Equation (
19), e.g., only the parameter
l in Equation (
25) is set to be
from
, the stress and porosity are time-homogenized (
Figure 9). In this case, the strain hardening is the controlling factor, and deformation such as the sliding and rotation of particles is limited, meaning that the deformation, porosity, and stress can be uniformly diffused without concentration.
Based on the above,
Figure 7 shows that the initiation of shear bands under simple shear conditions is accompanied by the excessive expansion of local pores. From a microscopic perspective, this can be explained by the main cause of shear band initiation being the expansion of local pore volume due to the rotational shear of particles. Meanwhile, the simulation results in
Figure 8 and
Figure 9 indicate that Formula (19) presented in this paper can be used to determine whether shear bands form under these conditions and their formation locations.
5. Conclusions
In this paper, the initiation of shear bands in sediments including GHBS is analyzed. First, a mathematical model considering the pore diffusion and stress conservation is established. The shear stress is considered to be related to the strain, strain rate, and porosity. Pore expansion (dilatation) leads to softening, and the strain and strain rate lead to hardening.
The perturbation method is used to analyze the initiation of shear bands. The results show that the main reason for the initiation of a shear band is the porosity-softening effect exceeding the strain-hardening effect. The initiation conditions under some special cases are also analyzed, such as strain softening.
Based on the established mathematical model, numerical simulation and finite difference calculation are performed. The results show that the critical conditions for shear bands are proven to be effective, and if the adopted parameters satisfy Equation (
19), the shear stress, strain, and porosity increase rapidly at the center of the calculation area if a 5% perturbation is applied, resulting in a localized shear band. Otherwise, if the adopted parameters do not satisfy Equation (
19), the shear stress, strain, and porosity will gradually develop uniformly. The numerical simulation verifies the results of the perturbation analysis.


 ,
, 

