1. Introduction
Fuzzy classifiers have been extensively studied and utilized for various applications in various fields such as medicine, economics, image processing, electronics, and others. The ease of designing and implementing a basic classification system using linguistic labels has led to its application as a foundation for more advanced developments in artificial intelligence, neuro-fuzzy networks, pattern recognition, and machine learning [
1,
2,
3]. In its simplest form, a fuzzy classifier operates using a training algorithm and input data. Once fully trained, the classifier can identify and categorize any input data. As a result, fuzzy classifiers must be able to process and classify large amounts of data, even if they are small and slightly varied.
In this sense, using chaotic maps to generate pseudorandom numbers could be an excellent source for representing a large amount of data with a high degree of random appearance. The study of these maps has been a subject of interest over the years, with special relevance in many fields of application such as statistics, noise study, communications, gambling, operations research, and information security, among others [
4,
5,
6]. For example, in cryptography, these pseudorandom number generators are essential in encryption and key generation. In such cases, pseudorandom number sequences must repeat when starting from the same initial conditions [
7]. Therefore, with this assumption, it could be possible to consider the use of chaotic maps to emulate the random characteristics of the target population, to define the crisp inputs of a fuzzy system, and, from their statistical distribution, to obtain a set of rules for the design of a classifier [
8,
9].
The population is more than just individuals; it refers to a comprehensive collection of observations about those individuals who share common traits. This collection, depicted as a dataset, can be statistically described to quantitatively examine its attributes using methods such as dispersion, deviation, and distribution. Given this premise, fuzzy classifiers must use population features as input datasets to perform classification. Statistics have not been widely used in the development of fuzzy classifiers. Between 2019 and 2024, some works incorporated statistical features, either to configure the input data for the system, propose novel design approaches, or acquire various metrics to compare the results.
In 2019 Hodashinsky and Sarin [
10] proposed an approach to feature selection by combining random and heuristic search strategies using a random population search with memory. Also in 2019, Rezaei and Rajabi [
11] used a fuzzy inference system and a multivariate regression model to investigate plastic zones around the caverns of the power plant through numerical analysis of a set of input data from the system. In 2020, Kalteh and Babouei [
12] used an effective set of shape and statistical features as input to the classifier to recognize patterns in the control graphs. They implemented an adaptive neuro-fuzzy inference system (ANFIS) trained using a chaotic whale optimization algorithm (CWOA). Similarly, in 2020, Yu et al. [
13] used statistical analysis to experimentally evaluate a proposed Takagi–Sugeno–Kang (TSK) fuzzy model to identify EEG signals from Alzheimer’s disease.
In addition, in 2021, Qin et al. [
14] proposed a fuzzy authentication system based on a neural network and extreme value analysis to authenticate people from their body movements using biometric gait information. Alternatively, Ontiveros-Robles et al. [
15] proposed in 2021 the use of integrated type-1 membership functions, statistical features, and optimization methods to generate type-2 fuzzy classifiers. In 2022, Salem et al. [
16] proposed a new method to generate a set of characteristics based on fuzzy information measures using descriptive statistical data instead of the original. They were able to reduce the consumption of resources, space, and time. On the other hand, in 2022, Ranjbar and Effati [
17] introduced a novel algorithm for classification through weighted decision-making. They used statistical tests to compare their proposal with five established classifiers. Previous analyses revealed that the main limitation in the proposals examined was the intricate design of the classifiers. In such an instance, the expertise of the designer could influence design time, proper selection of membership functions, establishment of the rule base, and achievement of the desired outcomes.
In 2023, Che-Ngoc et al. [
18] proposed an automatic classification algorithm applied to image data using fuzzy clustering techniques and the Vine Copula statistical method. Alternatively, in 2023, Mahfouz [
19] used a clustering technique that occupied the mean squared residual (MSR) and applied probabilistic techniques for membership computation, in a multiclass classification application for tumor classification and gene identification. More recently in 2024, Bai [
20] proposed a fuzzy statistical classifier to recognize motion intentions in the presence of noise using electromyography sensors. In the same year, Zhang et al. [
21] proposed a method to evaluate fuzzy preference competition using statistical conflict within the framework of evidence theory. This experiment consisted of eight steps and used the calculation of the curves of the probability distribution function of each attribute for the dataset.
The fuzzy c-means (FCM) algorithm has been widely used as a classifier in various studies. Although the algorithm has advantages in terms of execution speed, it has limitations such as sensitivity to initialization, a tendency to fall into local optima, and difficulty in handling data with high uncertainty [
22,
23]. Furthermore, its performance can be affected by the presence of noise or data at the edges of clusters, which requires additional techniques to improve accuracy [
23]. In contrast, the classifier proposed in this work avoids these issues by defining membership functions directly from the statistical distribution of the data, without requiring prior training or parameter adjustment, which represents a significant advantage in terms of simplicity and computational efficiency. This allows for a more straightforward and easier-to-interpret classification [
24], especially when dealing with populations with highly random or chaotic behavior, so that classification can be improved without the need for supervised training [
25]. Similarly, when using a Type-1 Mamdani system, implementation is facilitated, and design time is reduced, providing advantages over other methods that use iterative validation and being suitable for applications where model transparency is essential.
Some other studies previously reported in the literature has explicitly used statistics in the design of the fuzzy classifier and not only in the evaluation of results, for the selection of variables, definition of domains, adjustment of membership functions, and as training and optimization methods. This is the case of the study by [
26], which proposed a fuzzy classifier based on Mamdani’s fuzzy logic system, optimized using genetic algorithms. This study reported the use of statistics to determine the domain of the variables, selected the midpoints to partition the input space, and evaluated the performance of the classifier compared to other methods. Another work is that of [
27], in which Mamdani fuzzy logic was applied to detect the risk of breast cancer using a dataset. In this work, Linear Discriminant Analysis (LDA) was used as a statistical technique to select the most relevant variables before constructing the fuzzy system, and the centroid method was used for defuzzification. Finally, the work by [
28] compared two approaches to artificial intelligence (FIS and ANN) to map the susceptibility to landslides. In this work, the FIS is constructed from different data and an adaptive training method was used that includes the adjustment of membership functions based on quadratic errors. Although these three articles explicitly integrated statistics to improve the design of the fuzzy system, whether in variable selection, performance evaluation, or rule generation, they differ greatly from the proposal in this work, which has the following novelties:
- 1.
The statistical distribution of the characteristics of the population is used to design the fuzzy classifier. Unlike other studies that use statistics only to evaluate system performance, this study uses it as a basis for defining membership functions and the base rule of the Mamdani system. This turns statistics into a design tool, representing a significant change in the traditional way of constructing fuzzy classifiers.
- 2.
Chaotic maps are introduced as pseudorandom data generators to simulate the characteristics of a population. This technique allows large populations to be represented without the need for real data, which is especially useful in contexts where data are scarce, sensitive, or difficult to obtain. Statistical emulation using chaotic maps offers an innovative alternative for the design of intelligent systems.
- 3.
A systematic, visual, and replicable methodology is presented, facilitating the design of classifiers even for users with little experience in fuzzy logic. Observing statistical distributions and manually adjusting membership functions, an effective classification is achieved in just a few steps. This significantly reduces the adjustment time and allows for more accessible implementation without the need for complex optimization tools.
Furthermore, the investigated works did not utilize the statistical characteristics of the population as inputs for the system to define membership functions. As a result, this work presents the following contributions based on the previously reviewed studies.
- 1.
The design of the fuzzy classifier is simplified using the probability distribution function of the characteristics of the population. This design approach can effectively classify any input, regardless of the number of features, application, population type, or amount of information received.
- 2.
Three well-known chaotic maps are explored to model the target population being studied.
- 3.
To define the membership functions of the inputs and establish the rule base that defines the fuzzy system, the probability distribution function of three features of the target population is used. It simplifies the design of the fuzzy inference system (FIS) when a large amount of data is available.
The primary goal of this study is to develop a classifier using a Mamdani fuzzy inference system. This classifier utilizes the statistical distribution of three pseudorandom number sequences to represent three features of a hypothetical human population.
The remainder of this document is organized as follows.
Section 2 provides the design specifications of the fuzzy classifier and briefly explains the chaotic maps chosen to depict the statistical features of the target population.
Section 3 describes in detail the design of the proposed classifier, including the membership functions and the rule base.
Section 4 presents the case studies that were defined to demonstrate the capabilities of the developed classifier and presents the results of each experimental trial.
Section 5 provides a discussion that compares the findings of this study with other related works. Lastly,
Section 6 presents the conclusions drawn from the case studies defined and the experiments conducted.
2. Modeling the Target Population
For designing a fuzzy classifier, some features of the target population must be defined to generate the rule base and the set of membership functions. Suppose that the specific case in which a very large population of people aged 18 to 30 years should be classified according to their level of obesity into two groups: obese and non-obese. For each individual, it is assumed that the observed characteristics—weight, height, and waist circumference—are independent random variables with a particular statistical behavior for each of them. To emulate the statistical behavior of these random variables in the target population, three pseudorandom number generators based on chaotic one-dimensional maps were considered: logistic, Bernoulli, and tent maps. These maps generate pseudorandom number sequences whose statistical behavior follows specific probability distribution functions. Chaotic maps are mathematical functions that can generate large pseudorandom number sequences with a given probability distribution function from an initial seed [
29]. Due to their extreme sensitivity to initial conditions, resulting in distinct pseudorandom number sequences for any arbitrary changes to their initial conditions, chaotic maps are characterized by the avalanche effect. Therefore, it is assumed that the observed features of the population can be very well represented by the randomness generated by these maps. One of the most commonly used maps for statistical applications and the theoretical analysis of nonlinear systems is the logistic map.
The logistic map is one of the most widely used maps, is defined in
and is an iterated function described by Equation (
1).
where
and
and the variables are defined as follows:
: value in iteration n of the logistics map.
: value in the next iteration.
: logistics map control parameter, typically in the range [0, 4].
The Bernoulli map, also known as the dyadic transform, is defined in [0, 1]. Like the logistic map, it can be used for various applications, including cryptography, and it is an iterated function defined according to Equation (
2).
A modified version of the Bernoulli map can be defined according to Equation (
3).
where
and
and the variables are defined as follows:
: value in iteration n of the Bernoulli map.
: value in the next iteration.
: Bernoulli map control parameter, in the interval .
The tent map is another well-known chaotic map that can be used in a variety of applications including cryptography, image encryption, economics, and price risk management. This chaotic map is defined according to Equation (
4).
where
and
and the variables are defined as follows:
: value in iteration n of the tent map.
: value in the next iteration.
: tent map control parameter, in the range .
Tent, Bernoulli, and logistic maps are assumed to be related to each other in such a way that their behavior can be identical [
30]. Although it is technically possible to utilize any chaotic map to depict the values of the input features of the system, the selection of these three specific chaotic maps was made arbitrarily. They have been extensively studied and have demonstrated effective performance in the generation of pseudorandom numbers [
31]. It is assumed that it is possible to design the membership functions of the classifiers from the probability distribution associated with the attributes of the population of interest in the case study. The selection of these chaotic maps was suitable to emulate randomness in the characteristics of the target population.
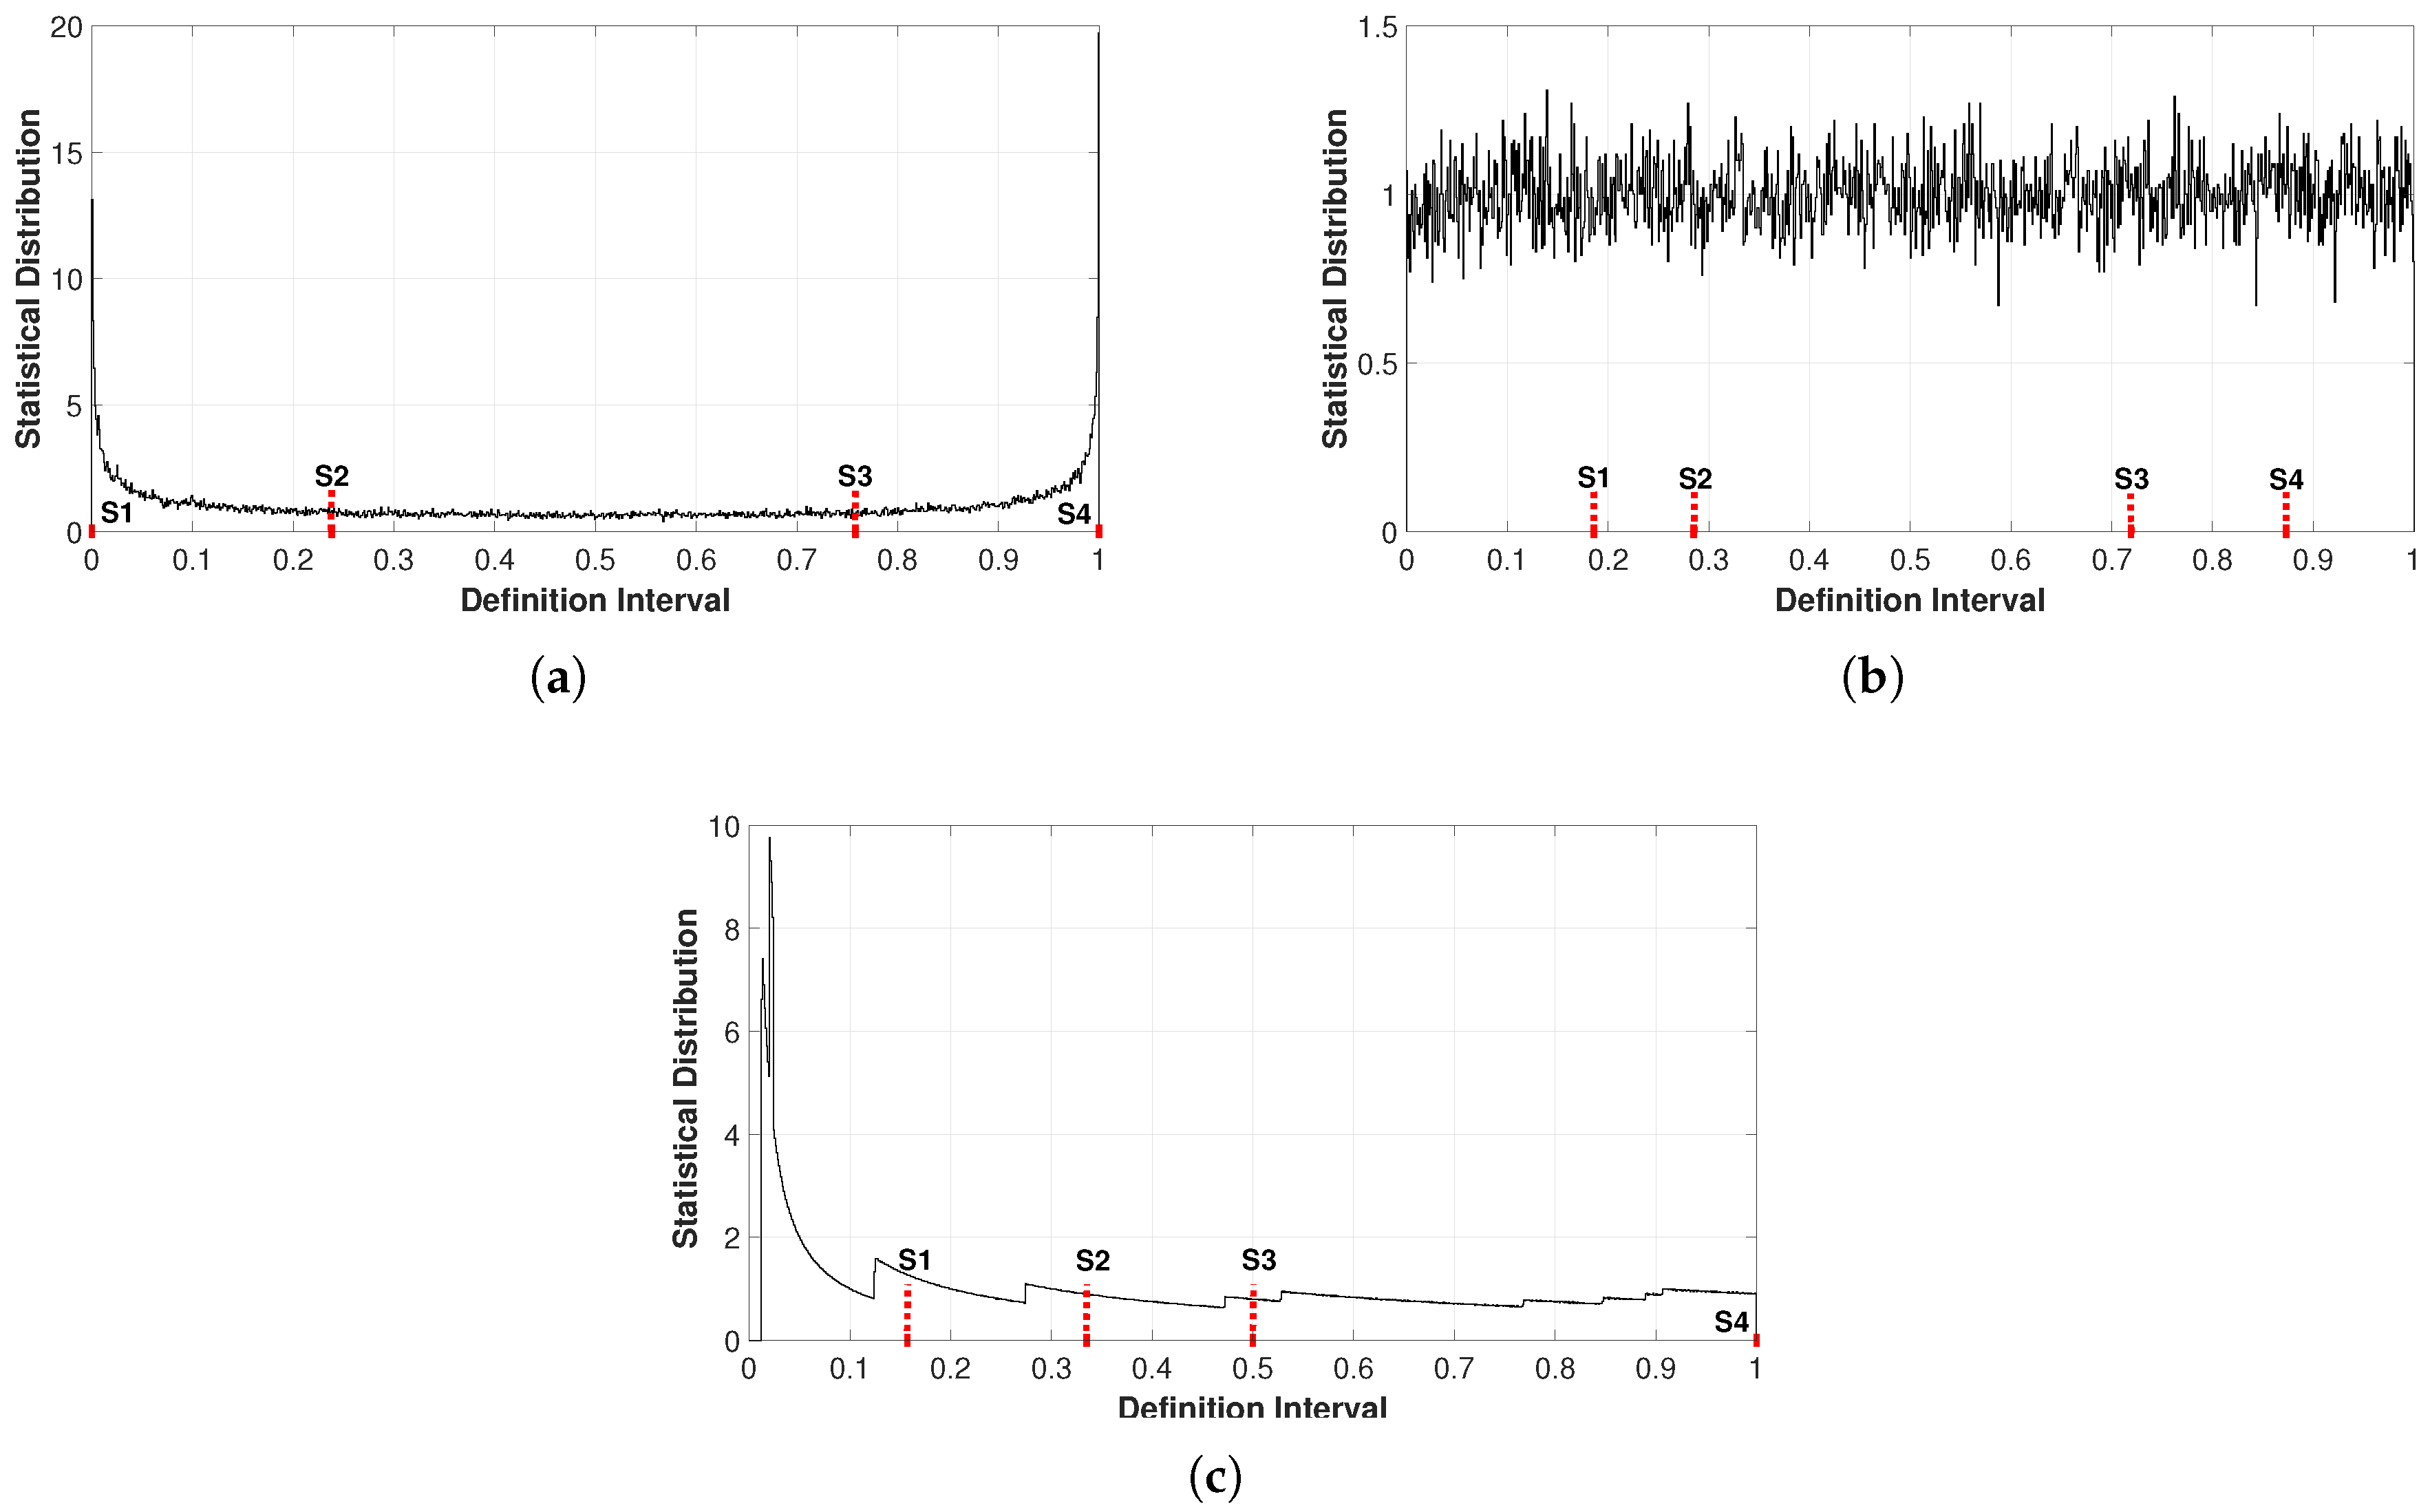
To set up the input data sources in the system, the probability distribution function of each of the three chaotic maps was obtained as shown in
Figure 1.
and
were used for the logistic map (INPUT1),
and
for the Bernoulli map (INPUT2), and
and
for the tent map (INPUT3). Note that the obtained graphs have been divided into four segments, marked in red and denoted with the literal S. The choice of segment points in each graph was made considering groups with a more marked statistical distribution, which is used as a visual reference to establish the membership functions in the fuzzy classifier design.
Figure 1a shows the graph of the probability distribution function obtained for the logistic map. For segments S1–S2 and S3–S4 it was considered this way because the shape of the statistical distribution has larger peaks, while in segments S2–S3 the statistical distribution has a flatter shape, with greater uniformity throughout the segment. Segmentation across all categories was carried out experimentally, without considering any supplementary parameters for the selection of numerical values. The aim was to create more distinct groups within the generated pseudorandom numbers, thus enhancing the fuzzy classification. In the same sense,
Figure 1b corresponds to the probability distribution function of the Bernoulli map and the segments into which it has been partitioned. In this case, by having a graph in which the result remains closer to 1, it was considered to have a larger segment in S2–S3, while the other segments were considered by observing slight variations below zero in 0–S1 and slightly above 1 in S4. The probability distribution function of the tent map is shown in
Figure 1c. The segment partition for this case was made considering that the statistical distribution remains uniform in the S3–S4 segment, while in the 0–S1 segment, there is a major peak with a very pronounced statistical distribution before the value of 0.1. Subsequent segments S1–S2 and S2–S3 are grouped indistinctly, considering that there is less uniformity in the distribution.
3. Proposed Fuzzy Classifier
Fuzzy systems, depending on their application, use fuzzy techniques to process and communicate information from various crisp inputs to crisp outputs [
32]. A typical fuzzy system scheme generally consists of four basic blocks: (1) fuzzifier, (2) fuzzy inference engine, (3) rule base, and (4) defuzzifier. When the fuzzifier receives a crisp input, it converts it into a fuzzy value using information from the knowledge base using some membership functions such as triangular, trapezoidal, and Gaussian, which are parametric functions. The fuzzy inference engine uses an IF–THEN rule base and OR–AND connectors to produce fuzzy output from the fuzzy inputs. The defuzzifier receives the values from the fuzzy inference engine and provides a crisp value of the true value that can be used by a control system, a computational system, or some other decision–making systems. The resulting membership functions were obtained from the union of the outputs of each of the rules. The combination of all these blocks for fuzzifying and defuzzifying precise data forms an FIS.
Although different approaches to fuzzy inference systems have been reported, two of the most widely used are the Mamdani FIS and the Takagi–Sugeno FIS, also known as Sugeno FIS, both of which can be Type-1 and Type-2. Although the use of both FIS is indistinct, each has certain characteristics that can make it suitable for one or another application, depending on the needs. The Mamdani FIS has wide acceptance and tends to be used mostly in less complex tasks, since having a more easily interpretable rule base makes it more intuitive to adapt to applications where it needs to interact with humans. Conversely, the Takagi–Sugeno FIS is recognized for its computational efficiency during the defuzzification process. It employs a weighted sum of several data points rather than calculating the centroid of a two-dimensional space, which guarantees continuity in the output surface and makes it appropriate for linear methods such as PID control. A Type-1 membership function has only one membership value, which only represents the degree of membership in a particular linguistic set, without considering its uncertainty. However, in a Type-2 membership function, the degree of membership can have multiple values and its uncertainty can be modeled in the membership function. For the development of the classifier proposal presented in this study, the use of a Mamdani Type-1 FIS was considered, since it is more intuitive and interpretable in evaluating the results, allowing an easy definition of the rule base [
33]. One advantage of the proposed design is that it reduces the time it takes designers to create rule bases and membership functions for fuzzy systems. That is, using this design methodology, the number of manual tests that have to be performed before achieving correct tuning of the system could decrease.
Mamdani FIS is based on linguistic rules established from the experience and knowledge of the human operators of the system and considering the fuzzy inputs established from linguistic variables. For Mamdani Type-1 FIS the methods of centroid, middle of maximum, smallest of maximum, bisector, and largest of maximum can be considered. It should be recalled that this study considered three inputs corresponding to three features of the target population, which were emulated using three pseudorandom number generators based on chaotic maps. In this way, the design of the fuzzy classifier was divided into the following four parts: (a) input membership functions, (b) FIS and output functions, (c) rule base from the IF–THEN conditional, and (d) defuzzification process.
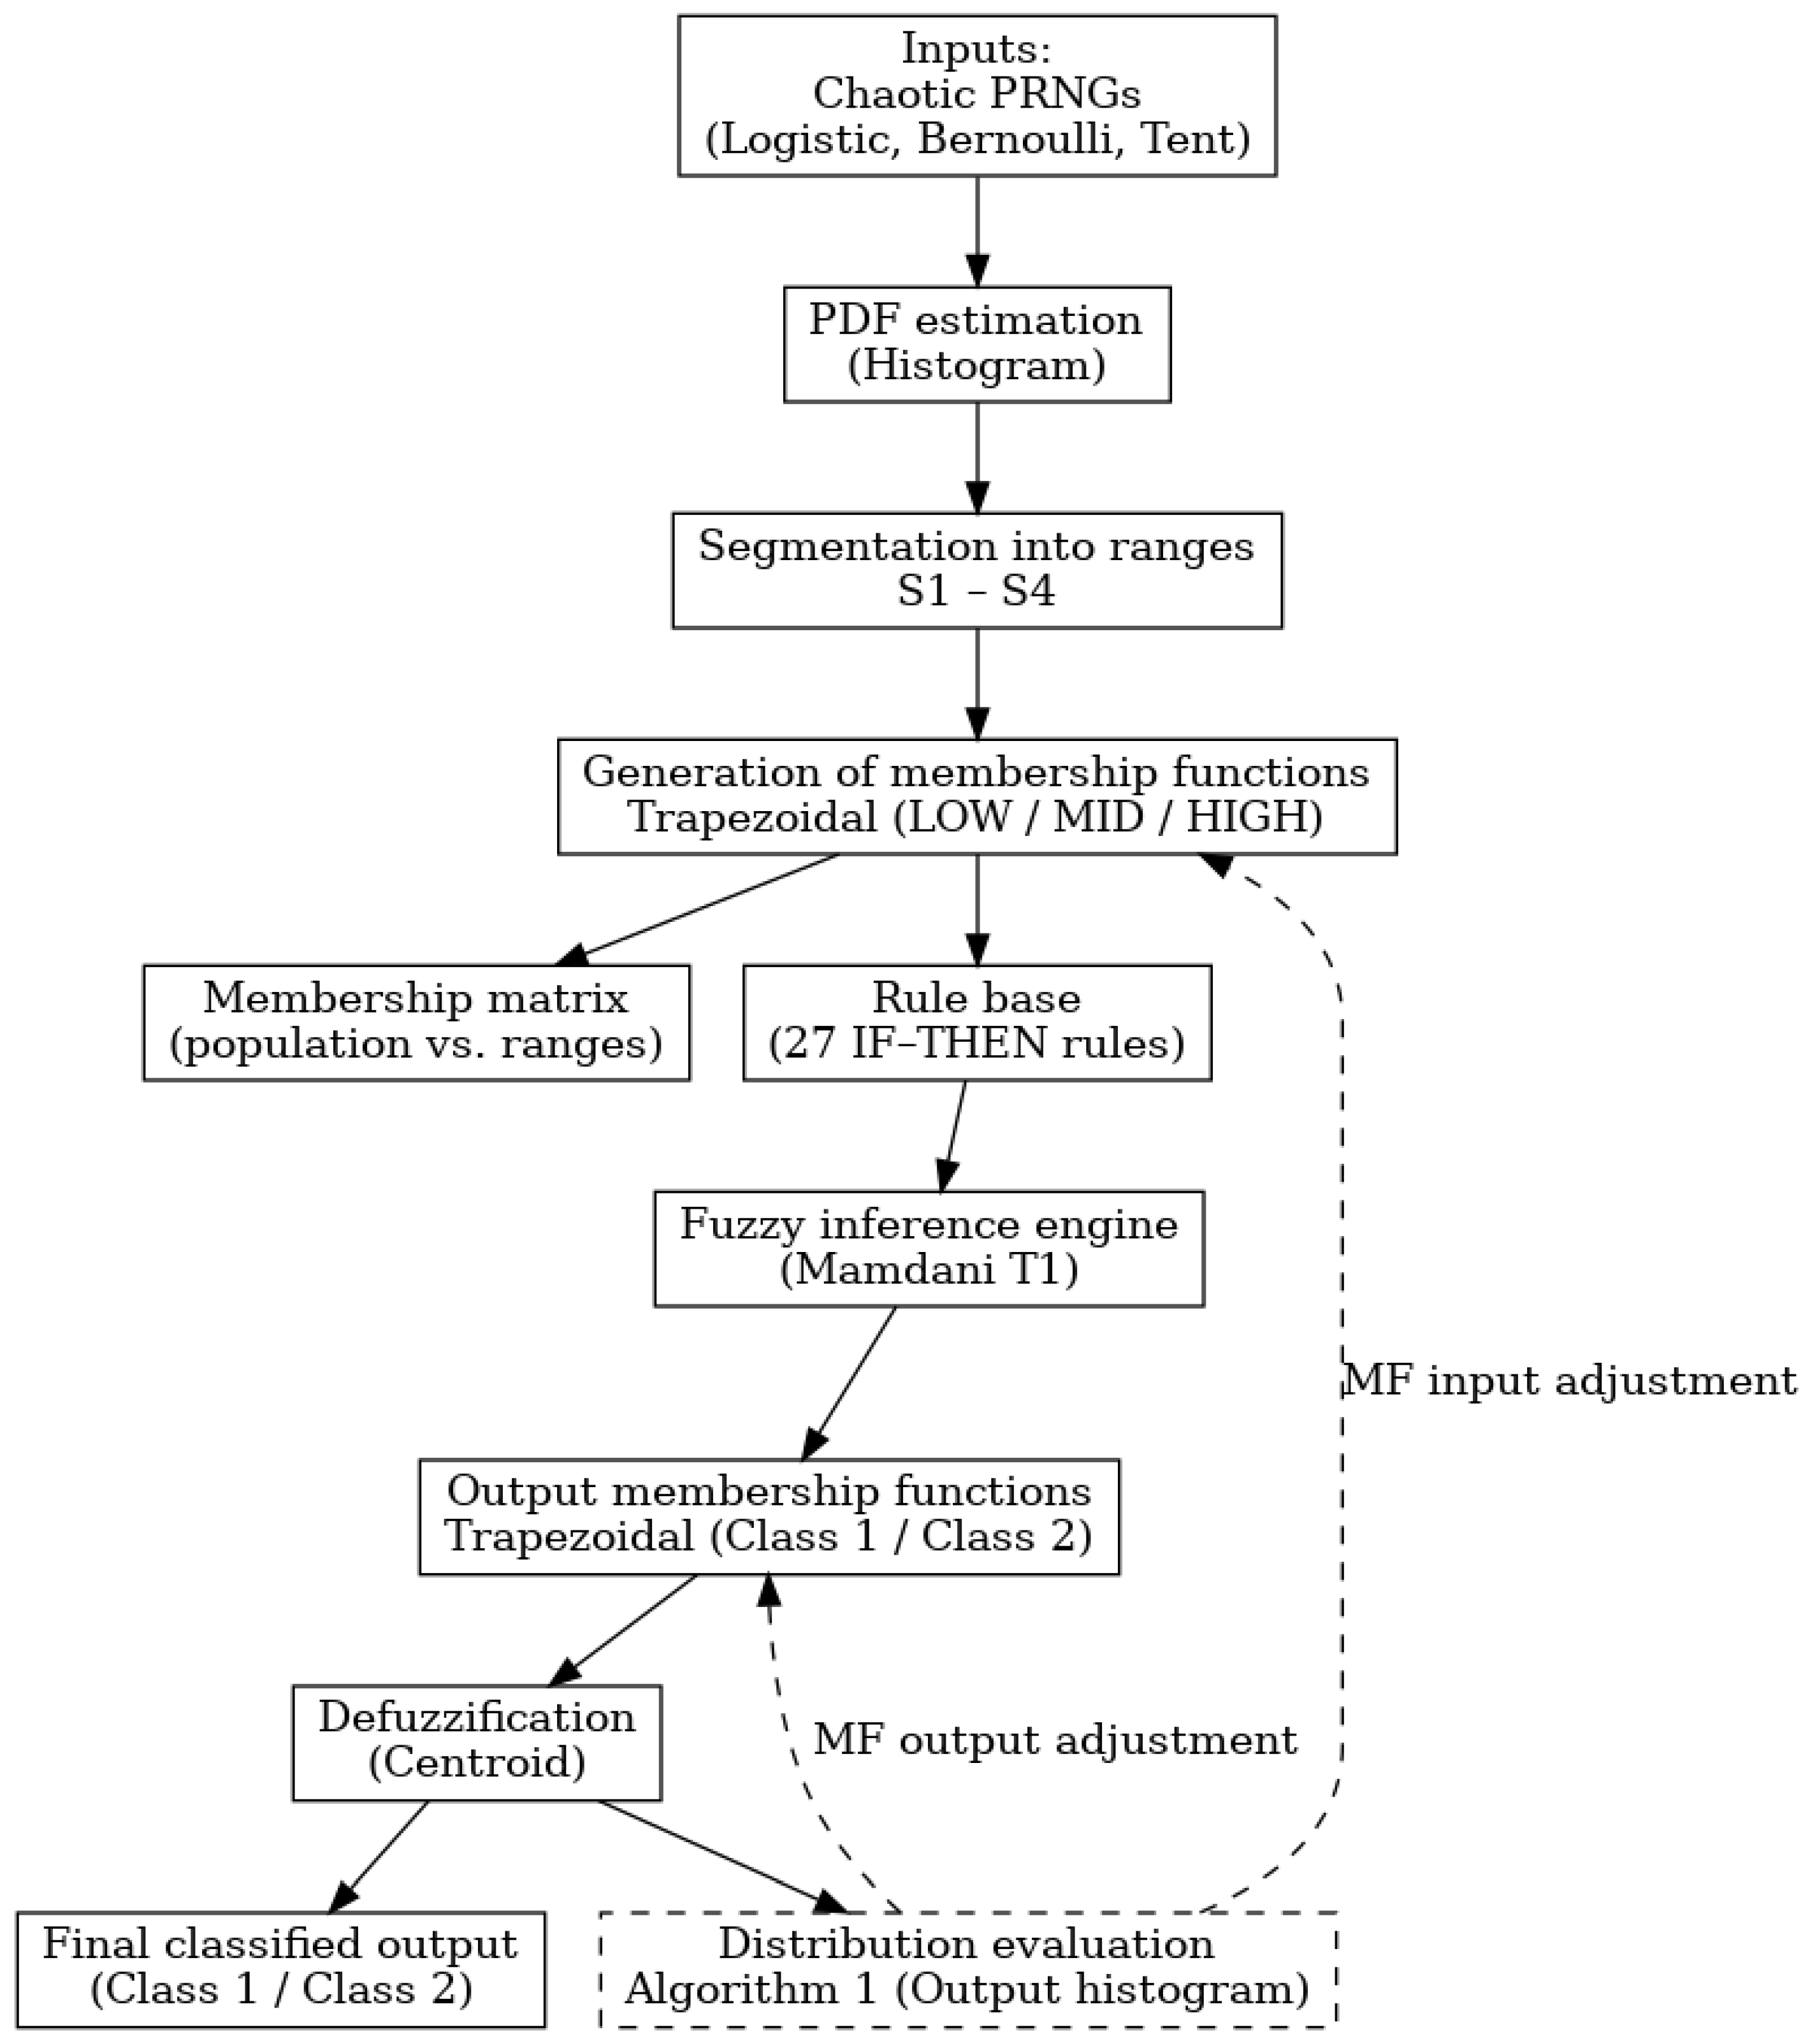
Figure 2 presents the architectural scheme of the proposed method. Chaotic pseudorandom number generators (logistic, Bernoulli, and tent maps) are used as input to emulate population features. Their probability distribution functions are estimated and segmented into four segments (S1–S4), which define trapezoidal membership functions and the corresponding membership matrix. A set of 27 IF–THEN rules constitutes the rule base of the Mamdani-type fuzzy inference engine. The outputs are trapezoidal membership functions representing Class 1 and Class 2, which are defuzzified using the centroid method to obtain the final classification. A feedback loop evaluates the output distribution and adjusts the parameters of the input and output membership functions to guarantee class symmetry and enhance the robustness of the method.
3.1. Input Membership Functions
The membership functions were defined using trapezoidal functions in all cases, considering the probability distribution function of the chaotic maps, since they are easy to represent and conceptualize. In addition, the use of trapezoidal membership functions allowed less resource usage in cases of hardware implementations, which can bring flexibility to the proposed design [
34,
35]. They were also better adapted to the definition of linguistic assignments of the characteristics of the target population. A trapezoidal function was defined by the conditions of Equation (
5), for which
A corresponds to the lower limit and
D to the upper limit, while the limits of
B and
C. They were the lower and upper bounds, respectively.
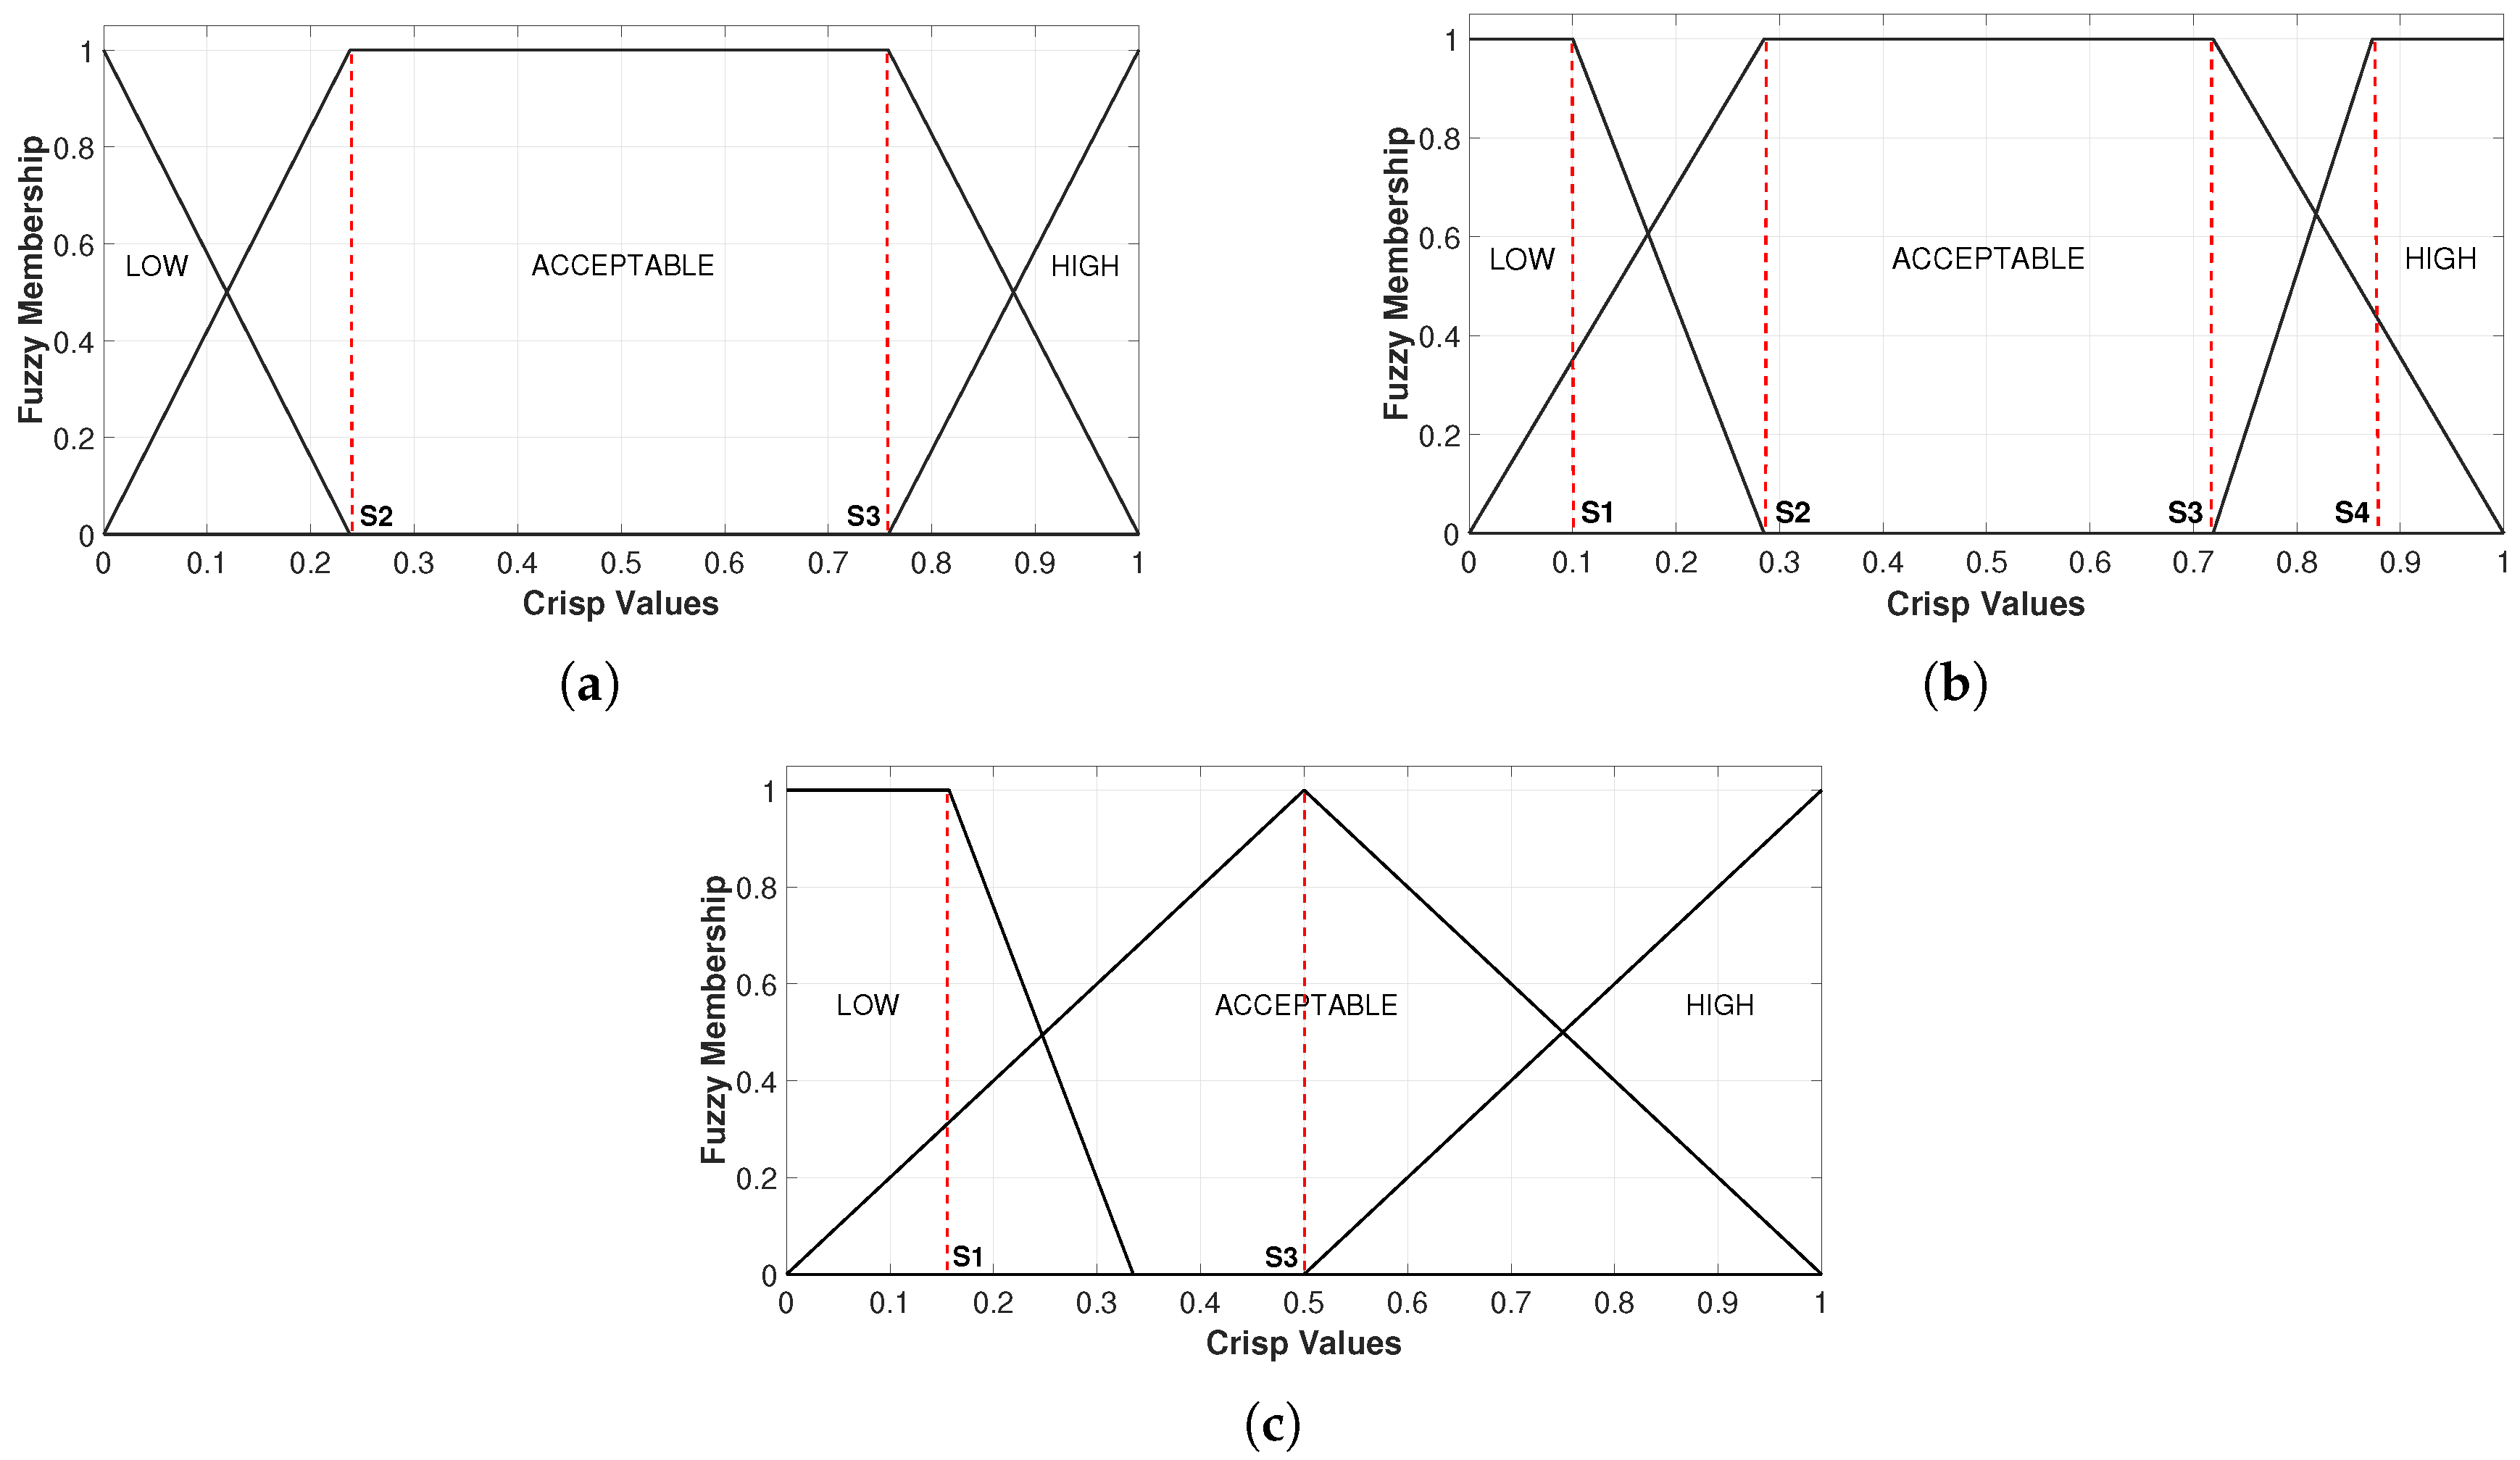
Therefore, considering three inputs to the system, where INPUT1 (logistic map) corresponds to feature 1, INPUT2 (Bernoulli map) corresponds to feature 2, and INPUT3 (tent map) corresponds to feature 3 of the target population, the segments established in
Section 2 and summarized in
Table 1 can be used for the definition of membership functions.
Since there were a total of four segments for each of the inputs and considering Equation (
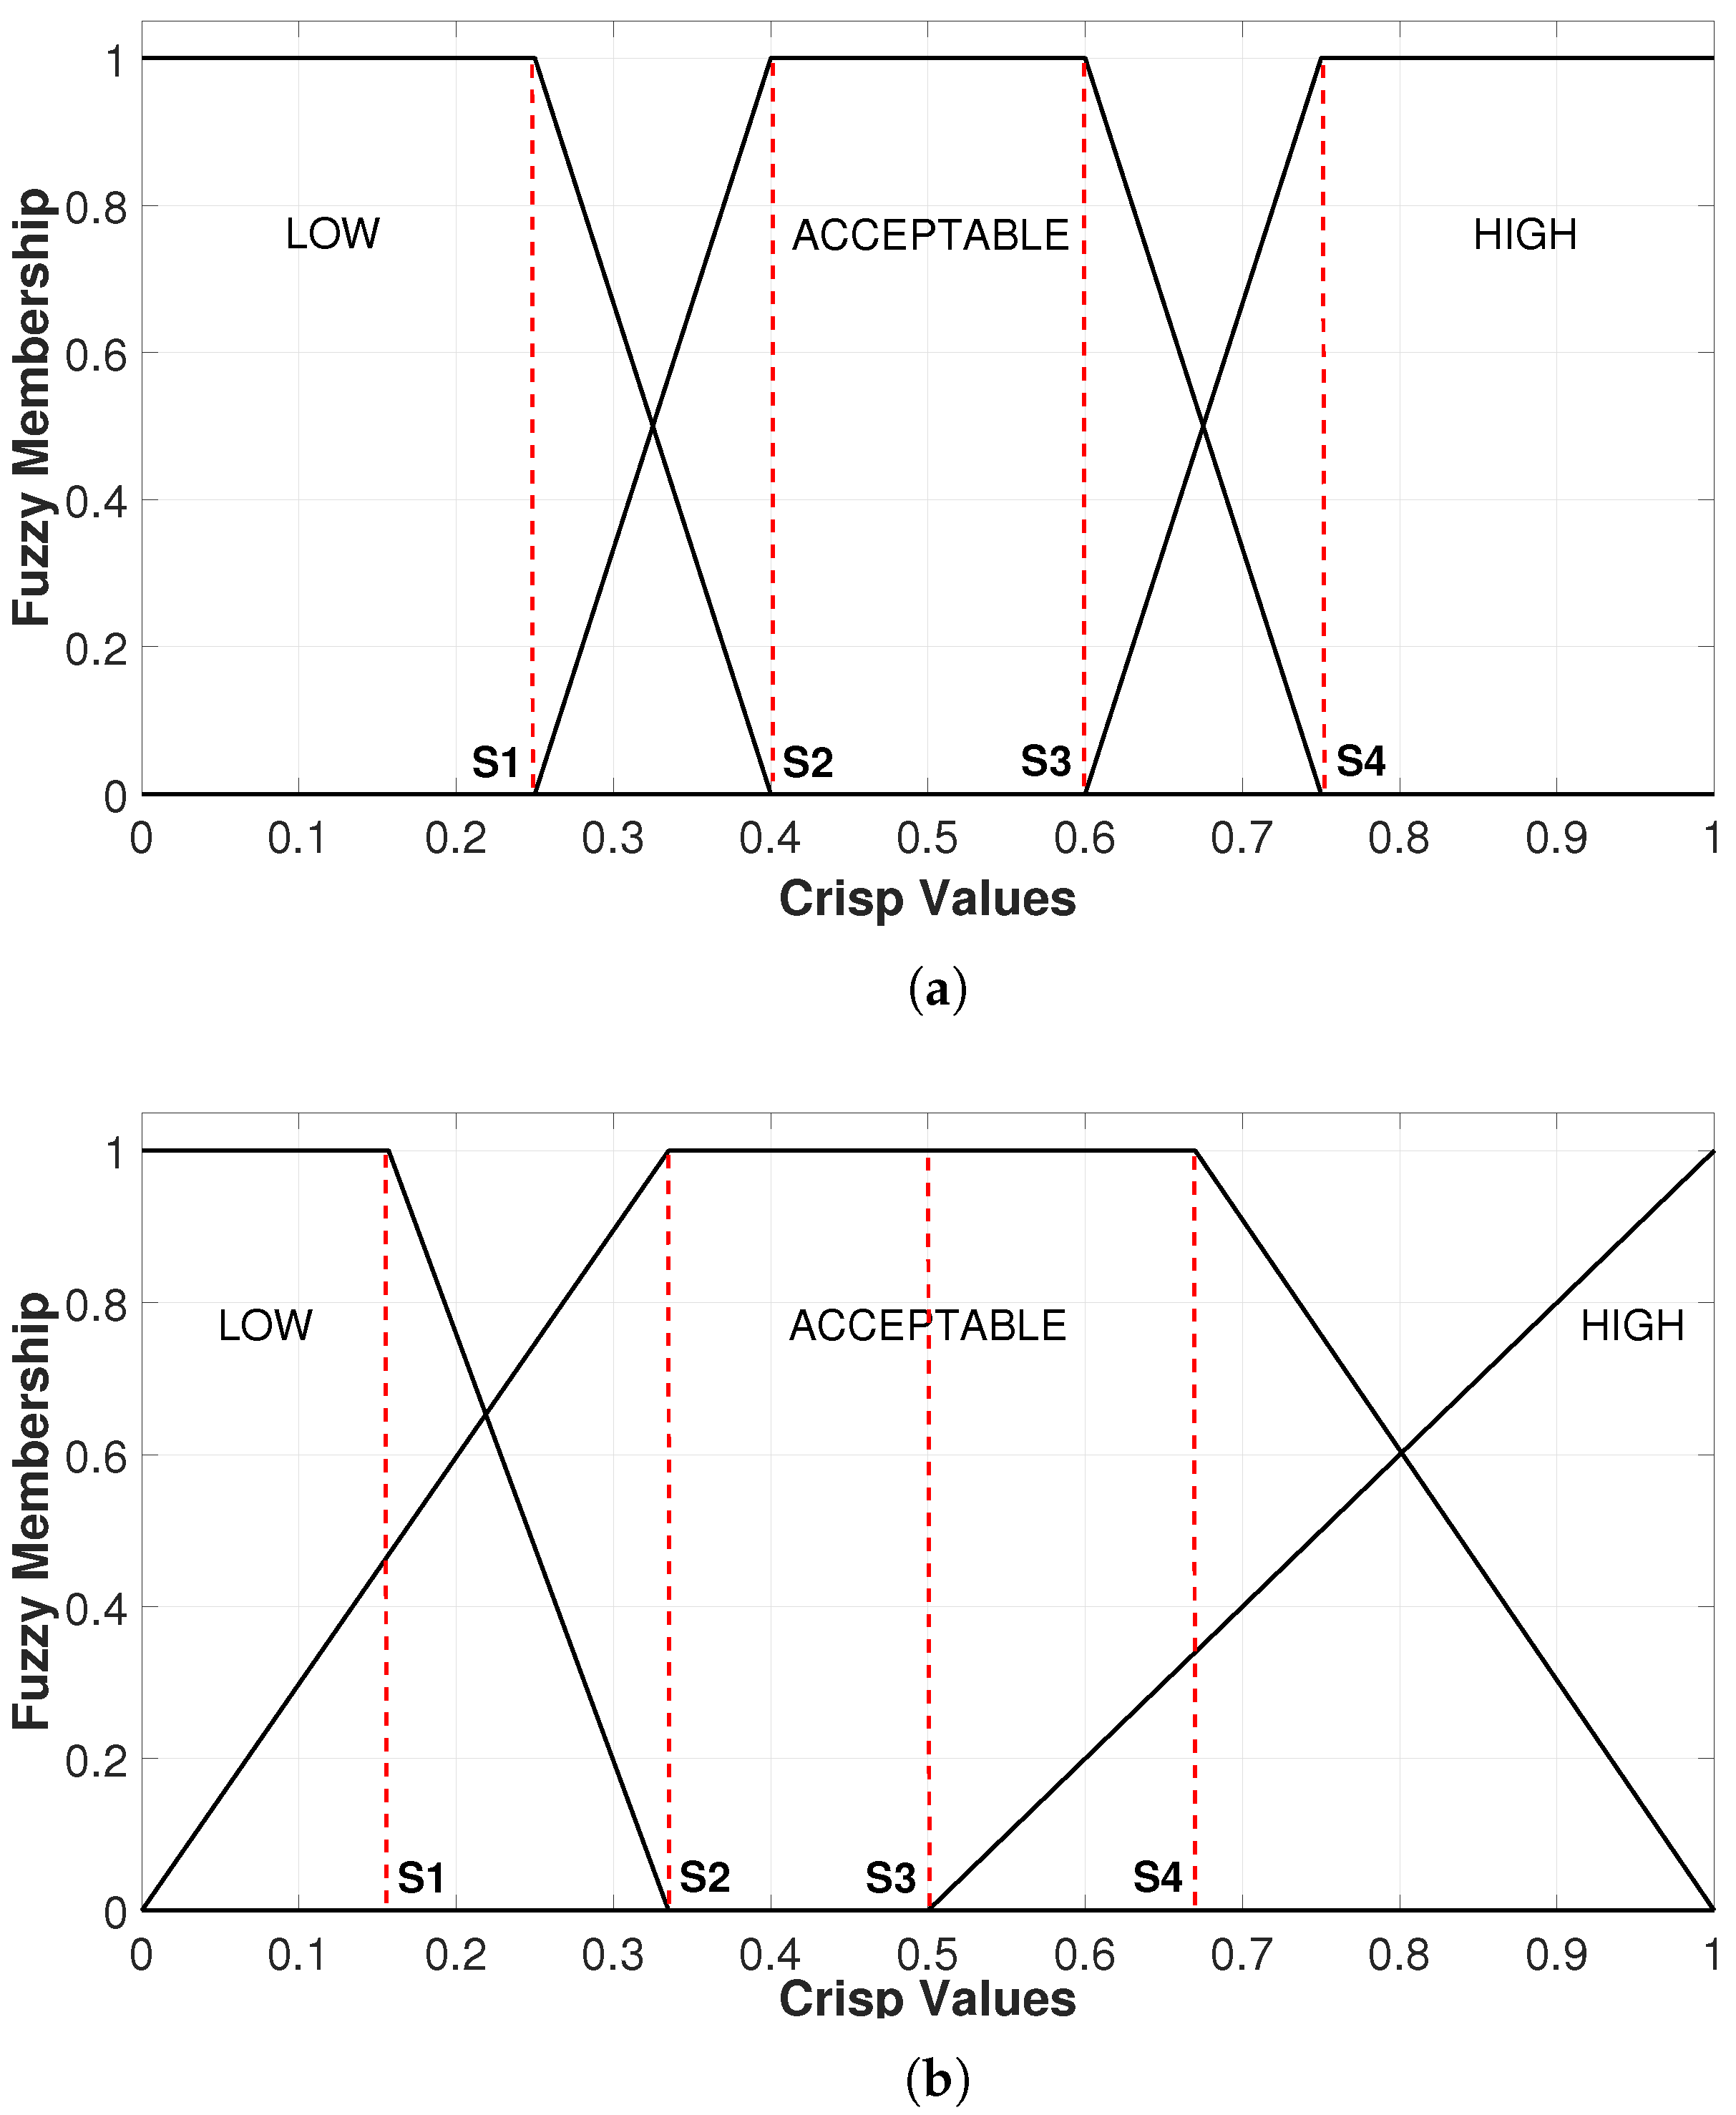
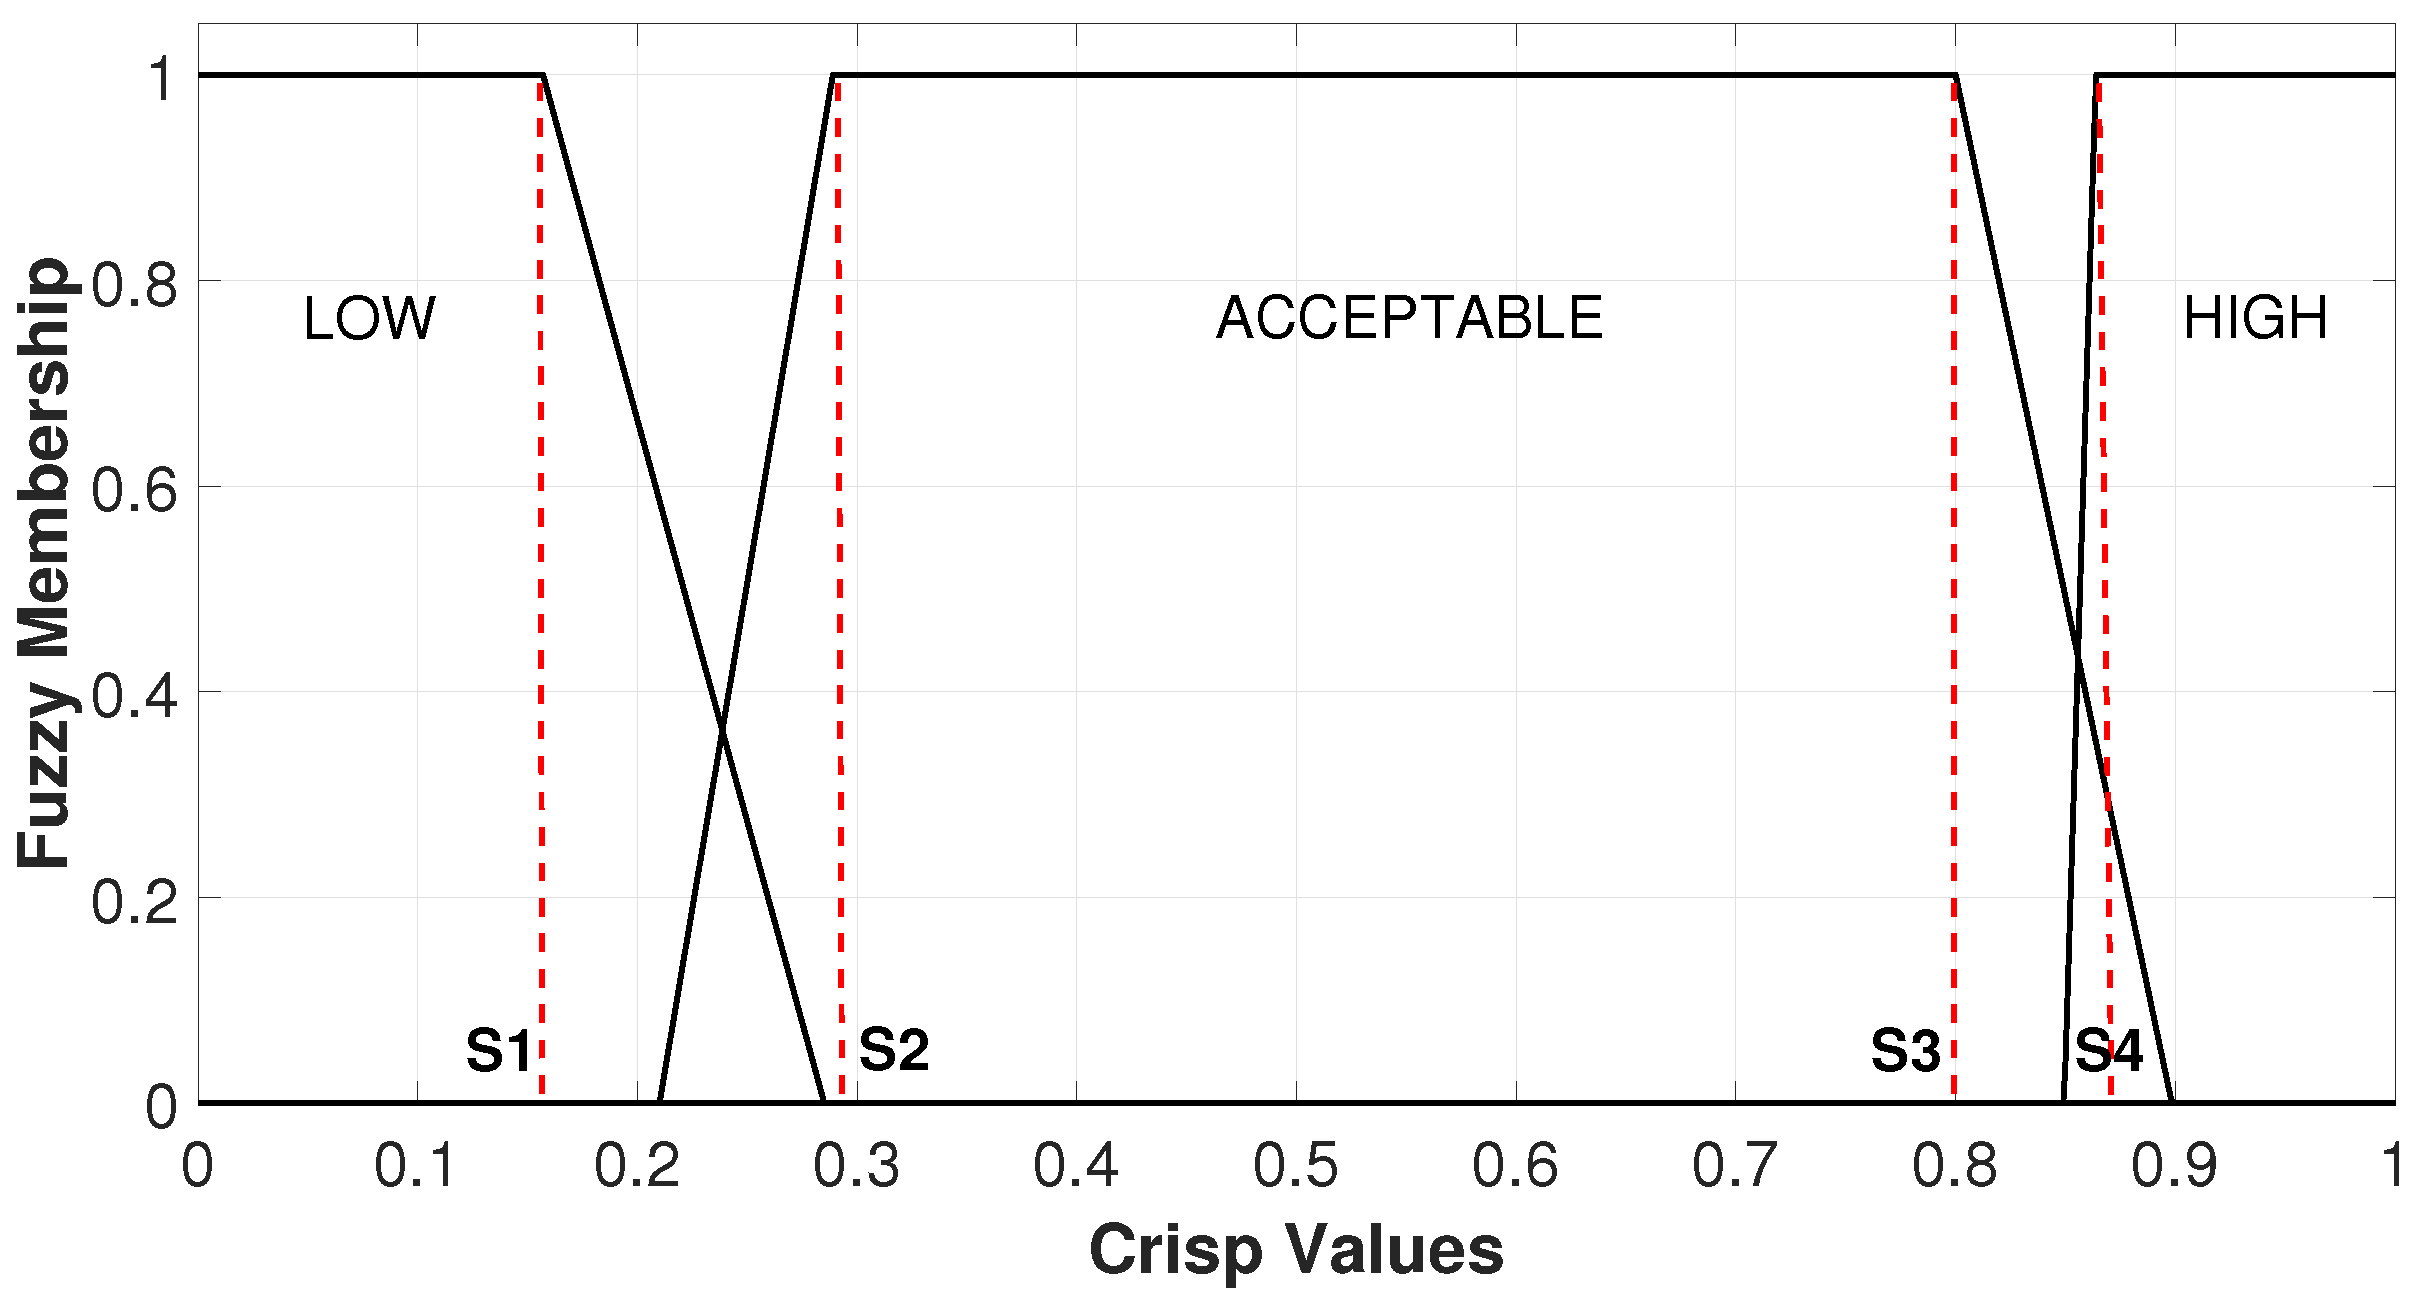
5), four points were required to define the trapezoidal function. Each numerical value in the segments (S) allowed the creation of three trapezoidal membership functions for each system input, which were defined by the following linguistic operators: LOW, ACCEPTABLE, and HIGH. These operators represented an interval within the definition domain of the statistical distribution that leads to the behavior of the selected chaotic map.
It is important to note that the choice of the membership functions was determined solely by examining the statistical distribution associated with each chaotic map. Consequently, this demonstrates that membership functions can be derived by analyzing the statistical features of an input dataset. This suggests that the design of this FIS is not universal; however, the methodology for its construction may be regarded universal. It can be applied based on the statistical distribution of any given population. In addition, the segmentation and the definition of the linguistic operators were defined arbitrarily, considering that there are three conditions for each feature. LOW, ACCEPTABLE, and HIGH. In this sense,
Figure 3a corresponds to the definition of the membership function for crisp values of INPUT1. Note that there was a membership value of 1 between the segments S2 and S3 corresponding to the category defined as ACCEPTABLE, which corresponded to the interval considered uniform in the probability distribution for the generator produced from the logistic map. Trying to differentiate a little the extremes corresponding to the category defined as LOW and HIGH, the membership value of 1 was only found in the right and left extremes, which was consistent with the information analyzed above regarding the respective chaotic map.
Figure 3b corresponds to the definition of the membership function for the crisp values of INPUT2.
It is important to observe that, based on the segmentation illustrated in the graph of the statistical distribution derived from the Bernoulli map, the lateral segments of the trapezoidal function exhibit a membership value of 1 for all crisp values in segments 0–S1 and S4–1, which are associated with the categories defined as LOW and HIGH, respectively. This finding aligns with the prior analysis conducted on this chaotic map. In the same sense, segment S2–S3 had a degree of membership of 1 for the category defined as ACCEPTABLE.
Figure 3c corresponds to the definition of the membership function of the crisp values of INPUT3. Note that the statistical distribution of the tent map reveals a nearly flat behavior across the segment from S1 to 1. Consequently, a membership level equal to 1 was established solely at the central point, corresponding to the crisp value of 0.5, designated as S3 within the category defined as ACCEPTABLE of the fuzzy membership function. Similarly, as in this same statistical distribution, there was a peak at the left end of the graph, a membership level equal to 1 was established for the entire region corresponding to the category defined as LOW in the 0–S2 segment of the fuzzy membership function. The HIGH category was defined only for the left end of the statistical distribution from S3 to S4.
It was useful to identify when the degree of membership in a segment is less than 1, considering that it is shared with another set of the class. The definition of the membership matrix and the membership functions were the reference points for defining the rule base and the output functions. It should be clarified that the design of the proposed system is not universal, so the membership functions and the rule base depended on the population to be observed. The membership matrix and the rule base must change as the population changes.
3.2. FIS and Output Functions
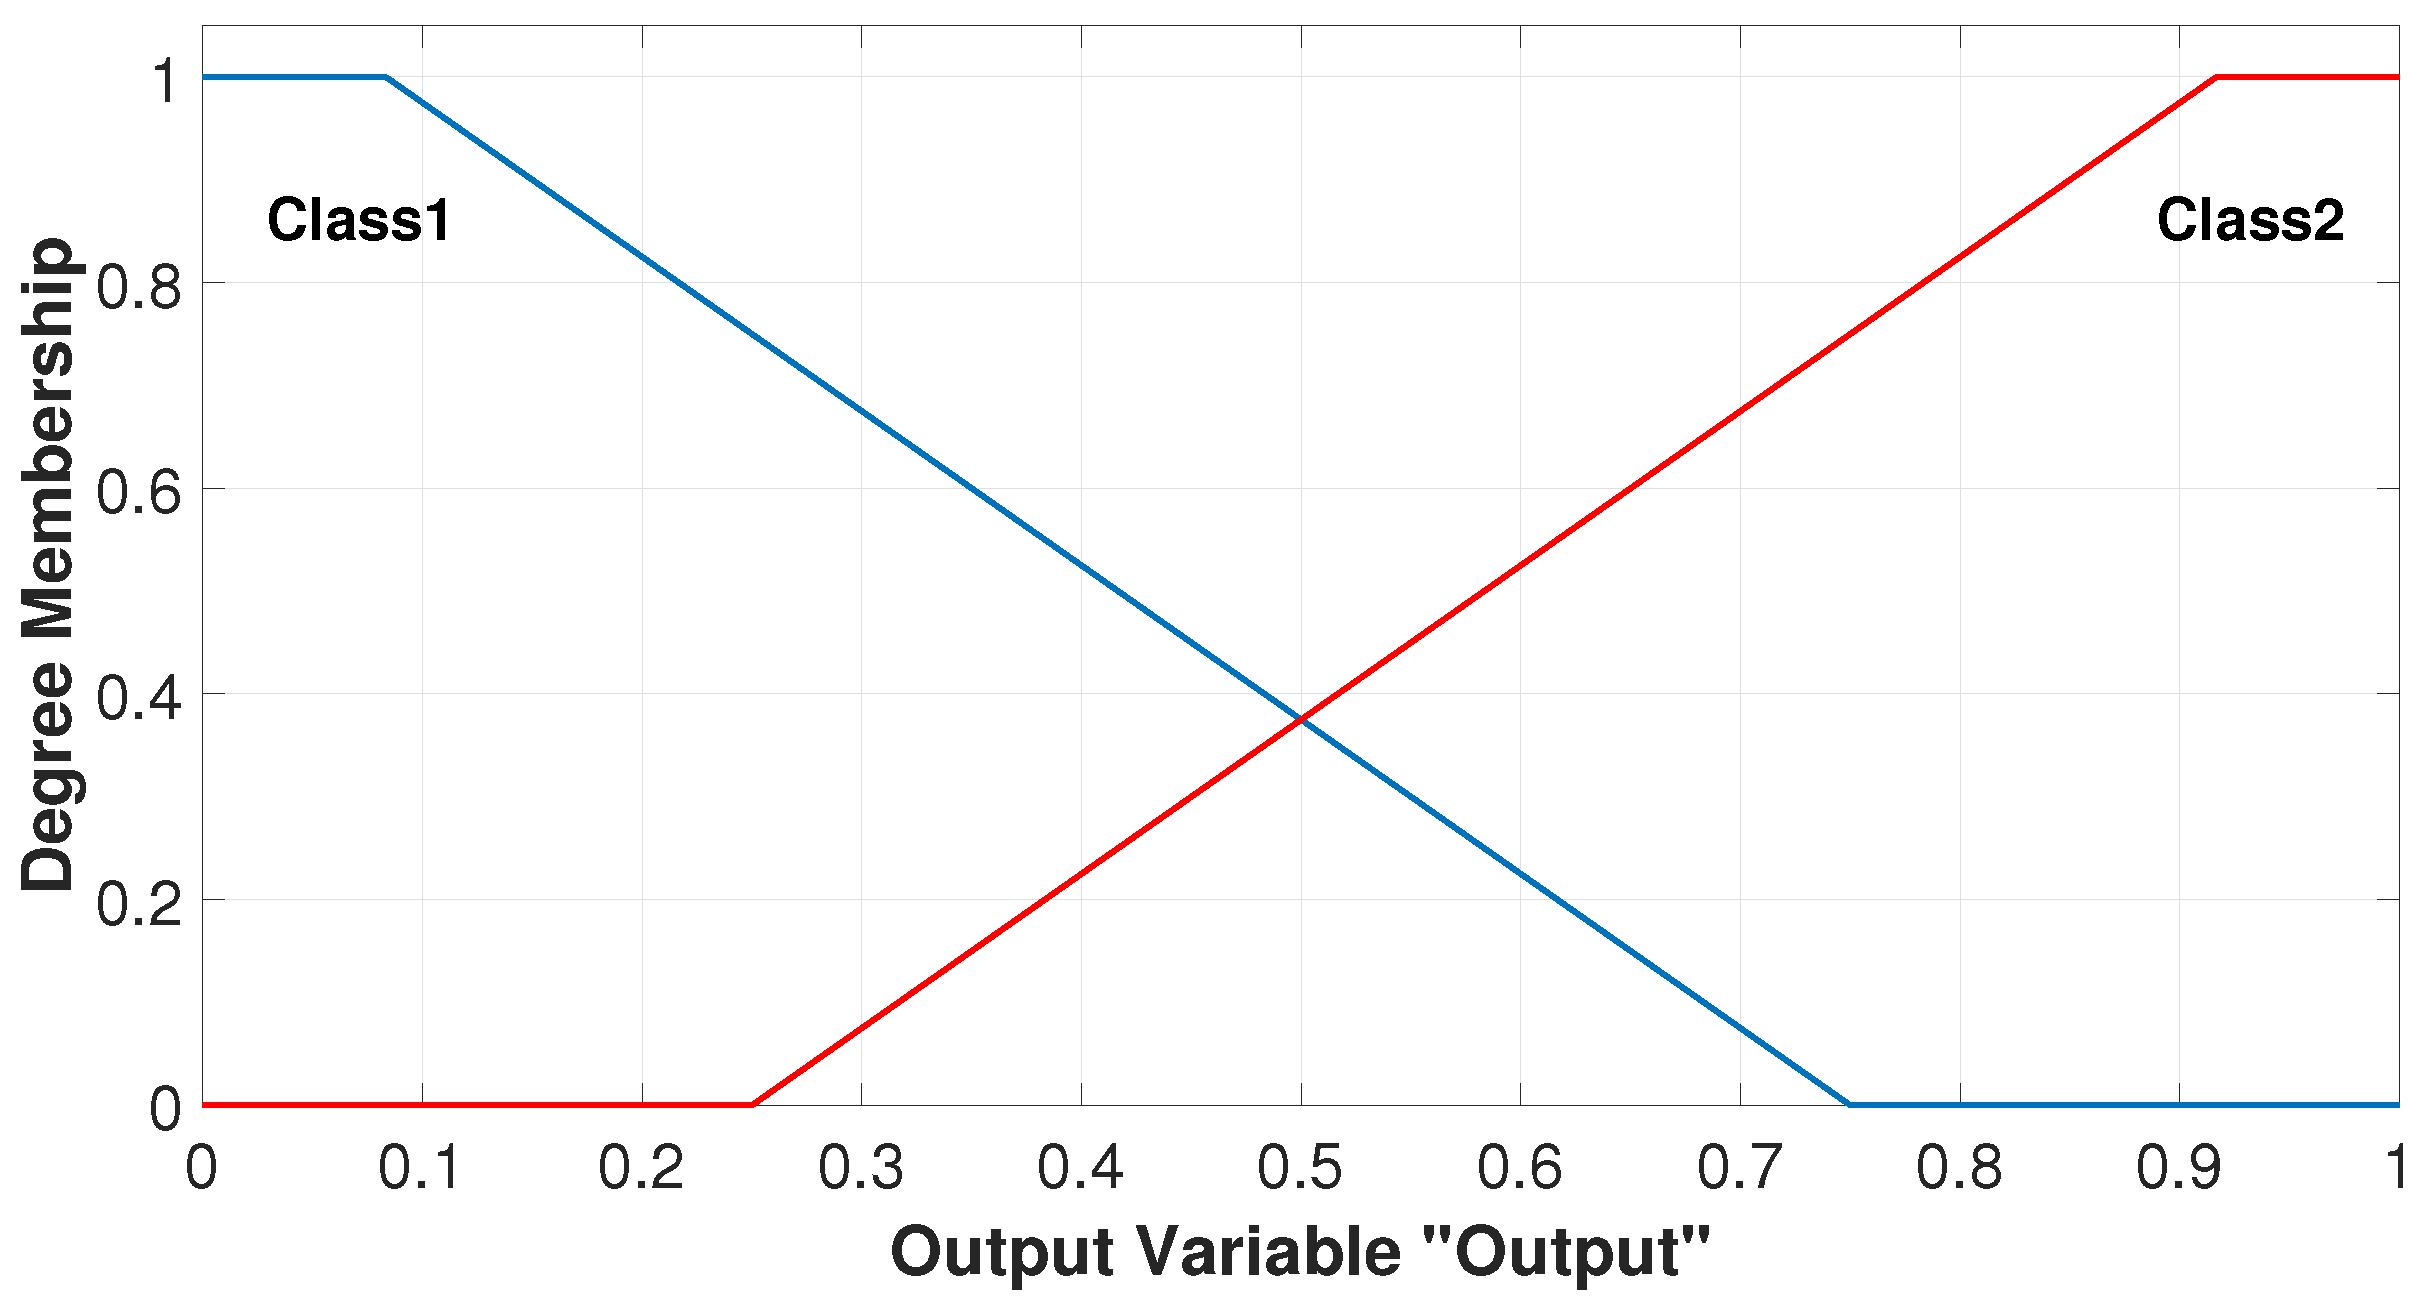
In developing the classifier proposed in this study, a Mamdani Type-1 FIS was utilized, featuring three inputs that align with the three membership functions previously described. The output of the system was defined using two trapezoidal functions, designated as Class 1 and Class 2 (see
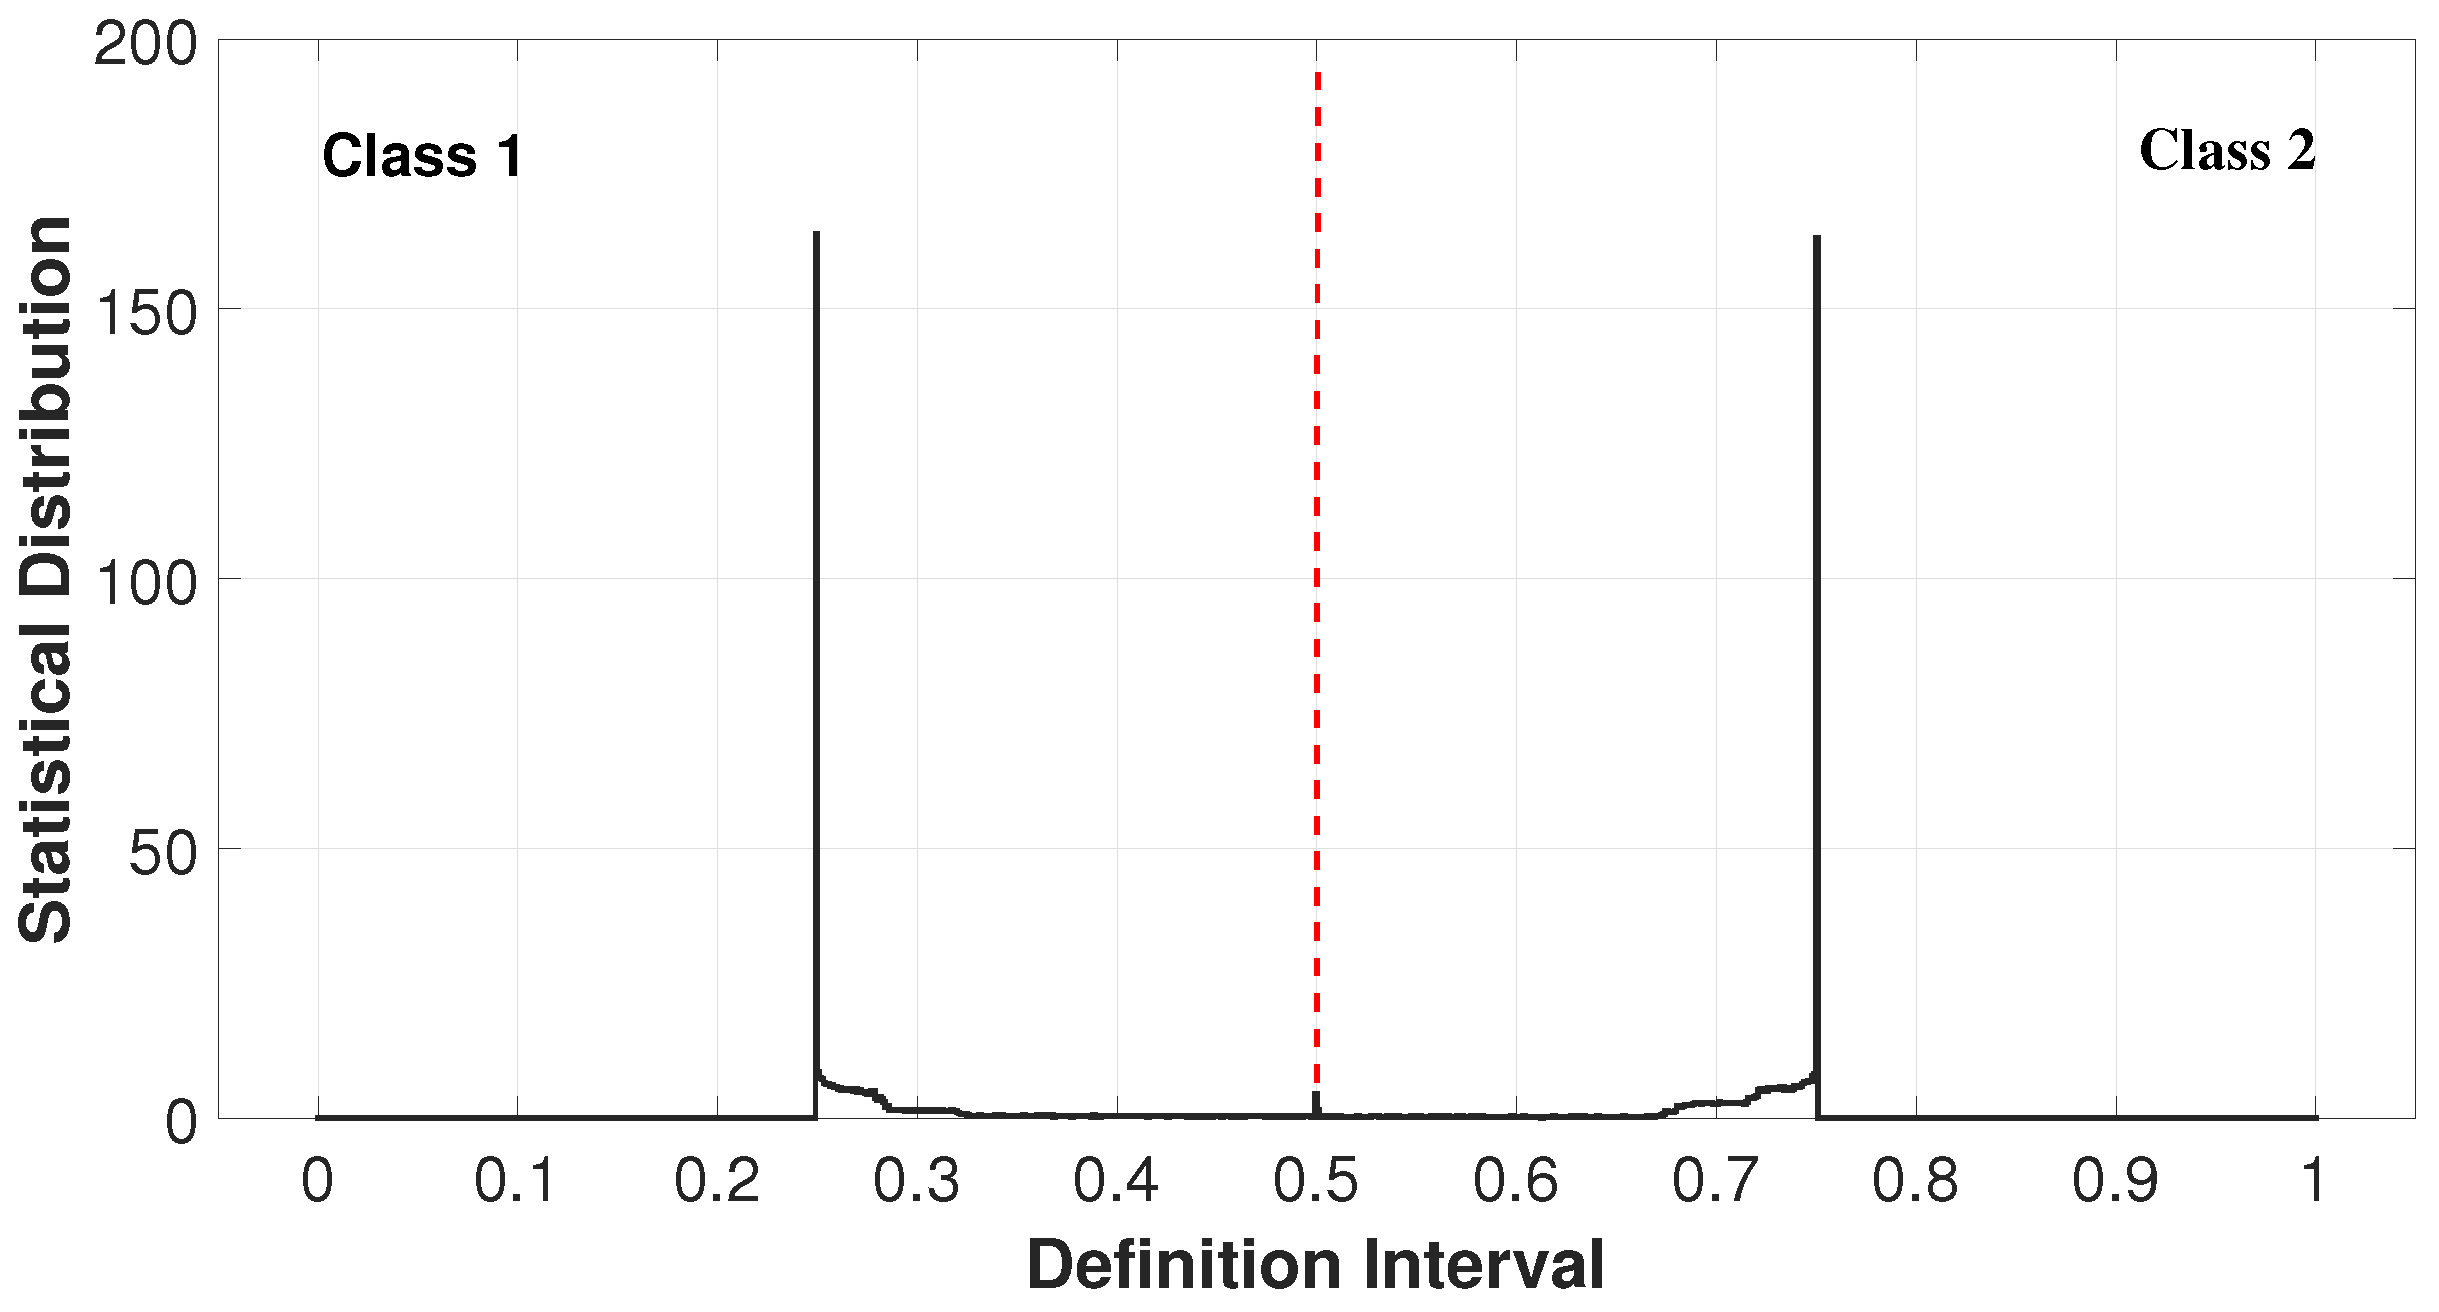
Figure 4). The parameters of the trapezoidal functions were selected to obtain symmetry. Considering that, when observing the probability distribution functions of each of the chaotic generators at the inputs, the salient peaks are at the ends. Therefore, the membership degree was set to 1 only for the left and right sides of the output variable. In this way, the classification of all the pseudorandom values that arrive at the FIS from the inputs are classified equally in the two classes, so that a symmetrical distribution can be obtained.
3.3. Rule Base from the IF–THEN Conditional
The rule base is the main part of the fuzzy inference engine, which allowed the system to decide to perform the classification according to the characteristics of each individual in the population. In this work, the rule base was defined from IF–THEN conditional sentences, and the AND operator was used. All rules were established from the experience of the authors for all possible combinations by observing the probability distribution function of each of the chaotic maps in the input to the system. It is crucial to observe that the result in the probability distribution function of the output exhibited symmetry, indicating that classes 1 and 2 can be divided into two equal segments. From the three established categories LOW, ACCEPTABLE, and HIGH, and the two output functions defined as Class 1 and Class 2, all possible combinations of INPUT1, INPUT2, and INPUT3 were made for each conditional. A total of twenty-seven rules were prepared, with fifteen belonging to Class 1 and twelve to Class 2. These rules were established considering the statistical behavior of each of the chaotic maps in the three inputs, seeking to divide the region of the peaks obtained in the probability distribution function of the most uniform region presented in each graph. Thus, the LOW category corresponds to the far left of the graph for each input, while the HIGH category corresponds to the far right. The flatter region in each input corresponds to the ACCEPTABLE category, which is generally located throughout the central region. Therefore, Class 1 should encompass all values in the high-peaks region or those exhibiting a higher probability distribution. In contrast, Class 2 should include all values found in the uniform region or those characterized by a lower probability distribution, specifically values where the ACCEPTABLE category is predominant according to the conditions established in the rule base. To create the rule base, a draft truth table with the logical values of the system was first built, and then the linguistic rule base was established, which is the rule base that was loaded into the system.
3.4. Defuzzification Process
For the defuzzifier, a code was developed to perform the classification from the Mamdani FIS generated and to obtain the two expected classes. The pseudocode generated for this process is shown in Algorithm 1. The file created for the design of the fuzzy system, which encompasses the membership functions and the rule base, allows the pseudocode to produce the distribution of the FIS based on the statistical distribution for the three chaotic maps utilized as input to the system. It is feasible to recognize that the pseudorandomly generated numbers can be viewed as data representing the three characteristics of the target population, thus facilitating the defuzzification process.
The computational complexity of Algorithm 1 is linear and represents the number of iterations of the main loop. In each iteration, three pseudorandom values are generated using chaotic maps, and the Mamdani fuzzy inference system is evaluated with these values as input. Since the operations involved are simple arithmetic and the evaluation of the FIS does not require optimization or learning processes, the computational cost per iteration remains constant.
The choice of 100,000 iterations responds to the need to obtain a sufficiently representative and stable statistical distribution in the system’s output histogram. This number was determined empirically, observing that with fewer iterations, the distribution presented significant variations that made it difficult to evaluate the behavior of the classifier. Starting with
iterations, a stationary distribution is achieved that allows the effects of the adjustments in the membership functions to be clearly observed, without compromising the computational performance of the system. The loop termination parameter set at
was selected with the objective of ensuring a sufficiently large sample size to clearly observe the statistical behavior of the fuzzy inference system. This number of iterations ensures that the values generated by the chaotic maps reach a stationary distribution, which is essential to evaluate the stability and symmetry of the proposed classifier.
| Algorithm 1 Pseudocode generated to obtain the statistical distribution in the FIS output. |
Read FIS file Logistic map parameters ; Bernoulli map parameters ; tent map parameters Histogram function (k) last element of last element of last element of FIS then else then end if and then else and then end if end if end if end for
|
5. Discussion
In the following a reflection on the experimental results obtained in
Section 4 is presented, highlighting how the adjustments made to the membership functions directly influenced the performance of the system. Similarly, a comparative discussion with related works is also provided, emphasizing the methodological differences and the role that statistical characteristics play in the design of fuzzy systems. These perspectives allow to validate the effectiveness of the proposed approach.
5.1. Interpretation of Experimental Results
The experimental results presented in
Section 4 demonstrate that adjusting the membership functions has a direct and measurable impact on the statistical output distribution of the classifier. In particular, the first experiment revealed that an insufficient definition of the LOW and ACCEPTABLE categories in INPUT1 and INPUT3 caused a biased classification toward Class 2. This result highlights the importance of carefully adjusting the membership functions based on the statistical behavior of the input data.
Subsequent experiments showed that modifying the trapezoidal segments of the membership functions, especially those associated with INPUT3, resulted in a more balanced classification. In Experiment 2, redistributing the crisp values improved the symmetry between classes, although a slight bias toward one extreme persisted. Experiment 3 confirmed that focusing adjustments on a single input can significantly improve the output distribution, while Experiment 4 achieved near-perfect symmetry by fine-tuning INPUT1 and INPUT3. These findings validate the effectiveness of the proposed design methodology, which relies on the observation of probability distribution functions rather than complex optimization algorithms.
5.2. Comparative Analysis with Related Works
Table 2 shows some works found in the literature that use statistics in the design of classification systems as previously described in
Section 1. The use of statistics can often be used in fuzzy systems to evaluate the performance of the classifier design considering some known metrics. However, it is unconventional to use it as a method in the fuzzy system design, whether it is a simple system or a more complex intelligent system. Analyzing
Table 2 in detail, it can be observed that there is no single methodology used for classifier design, although the use of the fuzzy clustering technique or fuzzy c-means (FCM) prevails, which could be due to the fact that the objects to be classified can be assigned to more than one cluster. This condition could be more advantageous in some applications such as image analysis or pattern recognition.
Contrariwise, techniques including the fusion recurrent neural network (FRNN) can be applied in various contexts that require improved learning responsiveness, such as in authentication processes. Fuzzy inference systems, based on fuzzy methodologies including Takagi–Sugeno (T-S), Takagi–Sugeno–Kang (TSK), adaptive neuro-fuzzy inference system (ANFIS), or Mamdani Type-1 (T1M), serve as excellent alternatives for classification scenarios where the input data are characterized by its statistical distribution. For example, in the case of electromyography sensors (sEMGs), their data could be represented numerically by chaotic maps, as presented in this work. Similarly, other alternative fuzzy methods, such as those based on feature selection (FS), crisp classification by weighted decision-making (CCW DM), fuzzy Bayesian clustering (FBC), or the K-nearest neighbor (KNN) algorithm, are alternatives with acceptable results for the classifiers design in different applications.
Regarding the dataset used in each design proposal, these depend on the application or target population, although applications with a medical focus, such as those related to cancer data, body movements, or Alzheimer’s disease, with a multichannel scalp-recorded electroencephalogram (AA–EEG) are generally recurrent. For experimental purposes in classifier design, it is common to use other data sources such as uniform random sampling with replacement (URSWR), benchmarks, image data, or data from the University of California Irvine database of machine learning (UCI MLR) or UCI and Kaggle MLR. This allows corroboration that the use of well-known chaotic maps, as proposed in this work, can be an alternative for the representation of large random datasets for the design of fuzzy classifiers with promising results.
Finally, considering the statistical approach used in each work, it can be noted that statistical techniques such as stochastic optimization (SO), descriptive statistics (DS), mean square residue (MSR), analysis of variance (ANOVA), joint probability distribution (JPD), or tests such as the Z-Test and Friedman test, multivariate regression (MVR) or extreme value analysis (EVA) have been interchangeably applied in the design of fuzzy inference systems for classification, prediction, or authentication. Some of these techniques may imply a certain degree of complexity in system design. It is important to note that recent research has focused on using the PDF of relevant data for population classification. This interest may stem from the fact that, in scenarios involving large datasets, deep-level distribution can facilitate system design.
Although conducting direct comparative experiments with other fuzzy classification algorithms such as Fuzzy C-Means (FCM), ANFIS, or Takagi–Sugeno models is important and necessary for a correct evaluation of the results, in this work, no comparative evaluations were carried out due to the complexity of performing their analysis and because it was not established in the scope, in addition to the fact that there are no fair comparison mechanisms that allow for an equitable comparison between the evaluation results. The different algorithms are considered to operate under different design paradigms, requiring specific input configurations and, in many cases, requiring training phases or optimization procedures in the design that are not compatible with the statistical approach proposed in this work. The presented Mamdani classifier was designed using statistical distributions derived from chaotic maps to define the membership functions and the rule base. This design proposal prioritizes interpretability, simplicity, and adaptability to random or chaotic data sources. Although it is clearly necessary to compare quantitatively using metrics such as precision and accuracy, datasets and characteristics are needed in the design that are beyond the scope of this study. Future work may consider implementing comparisons to validate the performance of the proposed method under controlled experimental conditions by comparing the evaluation results with other studies.
As presented in the method proposed in this work, it is possible to design a fuzzy inference system from the detailed observation of the behavior of the statistical distribution of the input data. In applications where there are multiple random or pseudorandom data, it may be possible to reduce the design time and the definition of the rule base, without being limited to the use of Mamdani’s FIS, but also with the possibility of being tested from the use of T-S fuzzy. Therefore, this work can be used in the future as a didactic method for the design of classifiers. It should be noted that this study presents a proposal for classifier design, in which the designer’s expertise in defining membership functions is enhanced by analyzing the statistical behavior of attributes within the target population. Consequently, it can be asserted that the establishment of membership functions is neither arbitrary nor random; rather, it is guided by a criterion rooted in the probability distribution function. Similarly, the application of chaotic maps may serve as a highly effective alternative to simulate the dataset in the inputs of any fuzzy inference system, particularly where the randomness of the values plays a vital role in its design.
6. Conclusions
In this work, a design approach for classifiers was presented considering that a hypothetical population should be divided into two groups. The classification method considered three population characteristics and applied a Mamdani FIS Type-1. With the proposed classifier design, it was demonstrated that it is possible to classify multiple random or pseudorandom data from different data sources regardless of the population size and the value of each population feature. Although a regular adjustment of the rule base is a well-known method to adjust the system output, in this work it was possible in very few tests to classify a specific population symmetrically into two groups by manually tuning the membership functions defined from the observation of the statistical behavior of the system inputs. This could significantly reduce design time, even for any designer with little experience in synthesizing and defining membership functions.
The straightforward nature of the Mamdani–based FIS facilitates the manual adjustment of the membership functions, enabling the execution of necessary tests with ease. However, in systems characterized by a greater number of inputs, it may be advantageous to consider alternative methods that support automated tuning. In contrast, chaotic maps are typically not employed in the development of fuzzifiers. Nonetheless, in this study, they served as a viable option to approximate the statistical behavior of certain variables that reflect the population characteristics processed within an FIS. This approach can be used in various contexts. For example, this approach can be used in medical or biological applications, where it is necessary to classify nanometer samples of any object. Moreover, the use of statistics can be a very useful tool in the design of future FIS for the evaluation of defuzzification results. Future work could consider the results of the tests performed to propose the design of fuzzy pseudorandom number generators to improve the statistical distribution of the classifier. Future studies could focus on improving the rule base or testing with other types of FIS such as Sugeno or neuro-fuzzy inference systems. These studies could allow adequate training of the system without the need for manual adjustments and could also obtain statistical metrics for comparison with other methods. The study of future fuzzy chaotic PRNGs could significantly contribute to strengthening cryptographic and information assurance tasks in communications.
Finally, in real-world applications, this work could be put to good use in the analysis of electromyographic signals or the classification of movement intentions in patients with smart prostheses. In these cases, the data exhibit highly random behavior and can be represented using chaotic maps, which would allow the design of fuzzy classifiers adapted to the statistical characteristics of each patient. This application could extend the present work to personalized medical assistance systems, where the classifier design automatically adjusts to the statistical distribution of biomedical data collected in real time. Similarly, another potential application of this approach may be related to the analysis of telecommunications network traffic, where data packets exhibit highly random and variable behavior in real time. In these environments, fuzzy classifiers designed from statistical distributions can dynamically adapt to traffic patterns, allowing anomalies, congestion, or suspicious behavior to be identified without the need for supervised training. This could lead to future intelligent network monitoring systems, where the classifier design automatically adjusts to the statistical variability of the data captured in real time.
