Abstract
High-performance sports cars rely on aerodynamics for stability and speed, but developing aero packages is challenging when wind tunnel testing is limited. In this study, we employed a simulation-guided design loop to maximize downforce and minimize drag on a sports car using Computational Fluid Dynamics (CFD). Thirteen aerodynamic modifications—including splitters, ducts, diffusers, and a Drag Reduction System (DRS)—were iteratively tested using CFD. To ensure numerical reliability, a mesh independence study and convergence analysis were performed, confirming stable aerodynamic predictions. The final configuration achieved an ~11× increase in downforce at 120 km/h (from about 320 N to 3588 N), meeting the design goal of roughly 2000 kg of downforce at 177 mph when scaled. This extreme downforce came with higher drag ( ≈ 0.83), so a dual-mode approach was developed: a DRS configuration provides moderate downforce with 50% less drag ( ≈ 0.41) for high-speed efficiency. A 1:12-scale wind tunnel test qualitatively supported the CFD predictions by visualizing wake narrowing and improved flow attachment. While quantitative force validation was not possible due to Reynolds mismatch and facility constraints, the qualitative results increased confidence in the CFD-based findings. Overall, the study demonstrates that substantial aerodynamic gains can be achieved under resource constraints, offering a practical framework for motorsport engineers and manufacturers to optimize aero kits when conventional full-scale testing is not accessible.
1. Introduction
In the realm of automotive engineering, aerodynamic performance is a critical factor influencing vehicle efficiency, stability, and overall performance. Computational Fluid Dynamics (CFD) has emerged as a pivotal tool in the aerodynamic design process, offering a cost-effective and flexible means to simulate airflow around vehicles and predict aerodynamic forces such as drag and lift [1]. The reliability of CFD simulations, however, is contingent upon validation against experimental data, typically obtained through wind tunnel testing. Wind tunnel experiments serve as a benchmark to assess the accuracy of CFD predictions and to calibrate simulation models [2,3,4,5]. Despite the importance of validation, practical constraints often limit the ability to perform comprehensive wind tunnel testing. Factors such as limited access to wind tunnel facilities, high costs associated with model fabrication, and time constraints can impede the validation process [6]. These limitations not only restrict the number of physical prototypes that can be tested but also increase reliance on CFD results even in scenarios where simulation fidelity is uncertain, especially in real-world driving scenarios.
Various studies have examined aerodynamic modifications focusing on components such as splitters, diffusers, and rear wings to enhance downforce and reduce drag [7]. However, these studies frequently lack experimental validation, particularly under dynamically similar test conditions [8], raising questions about the real-world effectiveness of simulated enhancements. Flow separation over the curved roof and rear deck continues to induce lift, and design concessions for pedestrian safety regulations (such as spoiler retraction or wing size limits) reduce the effectiveness of rear aerodynamic aids.
In the context of sports cars, aerodynamic enhancements are often designed using CFD simulations. Studies have analysed the effects of various components, such as rear wings and diffusers, on aerodynamic performance, demonstrating improvements in downforce and reductions in drag [7]. A roof wing is an aerodynamic device designed to reduce the lift generated by the curved roof, which causes flow to accelerate over it, creating low pressure by Bernoulli’s principle. This low pressure acts on the roof, which is oriented upwards, and so does the force. By placing another surface, a wing, above the roof, this low pressure then acts on both the upwards-facing roof and the downwards-facing surface of the wing. When aligned properly, these opposing forces can theoretically cancel each other out, reducing the lift. Diffusers generate downforce by creating suction below the car. As high-velocity air flows under the car, the diffuser provides a transition to atmospheric pressure at the exit, initiating pressure recovery and lowering the pressure under the car [9].
A double-element wing can be angled higher than a single-element wing without stalling. By energizing the boundary layer using the high-energy flow from the upper surface of the wing, the flow stays attached over the second element. A small spoiler placed underneath a wing also helps the flow stay attached to the wing, therefore helping create higher downforce [10]. The wing is one of the elements that has the largest effect on the aerodynamic parameters of the car. DRS (Drag Reduction System) from the Formula 1 race car can be implemented into the design to vary the aerodynamic parameters of the car in each driving situation by adjusting the wing’s elements to lower the drag, allowing the car to achieve better acceleration. DRS was introduced in Formula 1 in 2011 as part of the initiative to make Formula 1 eco-friendly and cut costs. The system allowed for the second element of the wing to rotate upwards, thereby reducing drag [11].
Splitters also play a crucial role in providing front downforce, balancing the downforce at the rear. By using the stagnant air formed at the front bumper, which creates high pressure, and by generating low pressure underneath the splitter, downforce increases as the splitter overhang increases up to 50 mm [12]. S-ducts have been found to reduce drag by reducing the high-pressure buildup at the front bumper, rerouting the air to an outlet located on the bonnet. A rectangular duct should be used with an outlet wider than the inlet and a low transition angle between the inlet and outlet [13]. Flaps installed at the rear of a square-back vehicle also reduce drag by tapering the wake and reducing its size. Elliptical flaps showed the highest reduction in drag compared to rectangular, triangular, and perforated flaps [14]. Fully covering the wheels using wheel covers reduces the drag by preventing flow from flowing through the rims and feeding the near-ground jetting vortices [15].
While CFD tools have transformed modern aerodynamic design workflows, over-reliance on them without sufficient experimental validation creates uncertainty in performance predictions. This is particularly problematic in cases where dynamic similarity is not preserved, leading to deviations in both qualitative flow features and quantitative force predictions. Given these limitations, a carefully controlled study that bridges the gap between simulation and limited physical validation can offer practical insights for both academic research and motorsport engineering.
Recent advances in motorsport aerodynamics increasingly emphasize simulation-guided design, yet accurate validation remains challenging in practical settings. Ref. [6] conducted systematic CFD and scaled wind-tunnel tests using a 1:4 DrivAer notchback model, providing insights into how mesh resolution, turbulence modeling, and computational settings affect aerodynamic prediction accuracy. Complementarily, Ref. [5] performed experimental validation on a Formula Student vehicle using tufts and aerodynamic balance measurements, highlighting that even detailed setups face limitations in reproducing unsteady flow intricacies. On the foundational side, Ref. [16] outlines the development of multi-element wings, diffusers, and drag-reduction systems in race cars, underscoring both opportunities and validation gaps in motorsport aero development [6]. More recently, Ref. [17] provided high-fidelity CFD data for 4000 industry-standard car configurations, including full 3D pressure, velocity, and wall-shear fields, enabling machine-learning models like RegDGCNN for rapid drag prediction and aerodynamic design exploration. These developments demonstrate the growing role of large-scale CFD datasets in supporting data-driven aerodynamic validation. Together with Ref. [16], a review of race-car aerodynamics, these works underscore both the promise and the gaps in coupling high-fidelity simulations with experimental testing, motivating frameworks that combine full-scale CFD with resource-limited validation methods for reliable performance assessment.
This study aims not only to explore aerodynamic enhancement possibilities but also to assess how far performance can be improved within realistic constraints, such as without altering the vehicle’s internal components. The design variations target meaningful reductions in aerodynamic drag while maximizing downforce generation, key factors for high-speed stability and cornering performance. In this study, eleven design variations were generated by systematically applying combinations of ten key aerodynamic modification strategies and evaluated using CFD simulations to optimize aerodynamic performance. Aerodynamic performance is characterized by using the drag coefficient CD and the lift coefficient CL, with negative CL values indicating downforce, a desirable effect for vehicle stability. In addition, the study also includes a qualitative study of the flow field of 3D-printed scale wind tunnel testing.
The remainder of this paper is structured as follows. Section 2 outlines the design objectives and physical constraints that guided the aerodynamic redesign considerations. Section 3 details the CFD-based development process, including the CAD model, mesh setup, aerodynamic variations, boundary conditions, and wind tunnel model fabrication. Section 4 presents simulation and experimental results, comparing aerodynamic performance across configurations and assessing agreement between CFD predictions and qualitative scaled wind tunnel tests. Section 5 discusses the effectiveness of simulation-led design, the limitations of scaled validation, and the broader implications for motorsport and resource-limited applications. Finally, Section 6 concludes the study by summarizing the key findings and offering recommendations for future work.
2. Design Objectives and Constraints
The aerodynamic evaluation in this study is based on a simplified yet aerodynamically faithful CAD model of the Porsche 911 (992), a rear-engine sports car renowned for its iconic fastback silhouette and motorsport lineage. The aerodynamic redesign was guided by two primary objectives: to maximize downforce during performance driving conditions and to minimize aerodynamic drag during high-speed straight-line motion. These dual goals correspond to typical demands in motorsport applications, where both cornering grip and top-speed efficiency are crucial.
To preserve realistic driving behaviour and maintain the car’s handling characteristics, the wheelbase and track width were kept constant across all design variants. However, moderate increases in overall length and width were allowed to accommodate the addition of aerodynamic components. Specifically, the total vehicle length was extended by 541 mm, from 4535 mm to 5076 mm, primarily due to an elongated front splitter and an extended rear wing. The width was increased by 100 mm, from 1900 mm to 2000 mm, to allow for wider wings as illustrated in Figure 1. These changes were limited to external bolt-on components and did not alter the internal vehicle structure except for the S-duct.
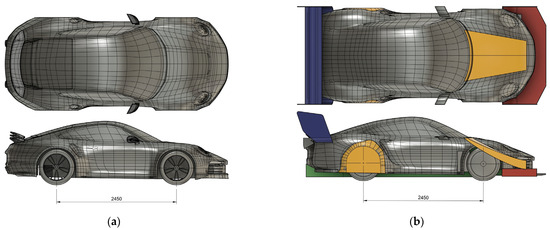
Figure 1.
Side view comparison of the model: (a) base model configuration and (b) final aerodynamic kit configuration U9.
As a performance benchmark, the Porsche 911 GT3 RS equipped with the Manthey Racing kit is known to generate approximately 1000 kg of downforce at 177 mph. The design target in this study was to double that value, achieving 2000 kg of downforce at the same speed in high downforce mode, while reducing the drag coefficient below 0.32, which corresponds to the unmodified base model. Although CFD simulations in this study were conducted at 120 km/h, target values were scaled to 177 mph based on the quadratic relationship between aerodynamic force and velocity (∝ V2). For instance, a configuration that produces approximately 800 N of downforce at 120 km/h would theoretically yield around 4500 N at 285 km/h (177 mph).
These targets served as performance constraints and design drivers throughout the iterative CFD-based development process. A total of ten design variants were generated by systematically combining eleven key aerodynamic modification strategies. The resulting configurations were evaluated based on their lift and drag coefficients. The results show that the performance-mode configuration (U9) approached the downforce target, and that while the drag-reduction configuration (U9.1) produced higher downforce than the baseline model, it failed to achieve a lower CD.
3. Methodology
3.1. CFD-Based Design Process:
3.1.1. Base CAD Model Description
The study is based on a simplified yet aerodynamically faithful CAD model of the Porsche 911 (992). The model preserves the essential geometric features of the 992-generation coupe, including the curved roofline, rear-engine profile, and pronounced wheel arches, elements that significantly influence airflow behaviour. To balance computational efficiency with aerodynamic accuracy, the model was moderately simplified. Non-essential components such as door handles, emblems, and intricate underbody details were omitted to reduce mesh complexity and focus on flow-driving geometries. Crucial aerodynamic features, including the front splitter, roof curvature, rear diffuser, and mounting areas for rear wings, were retained to allow meaningful performance analysis and targeted design modifications.
The base CAD model was developed using Autodesk Fusion 360. This base geometry served as the reference platform for systematically applying eleven key aerodynamic modifications across ten design variants (U1–U9.1) in the CFD simulations. For wind tunnel flow visualization experiments, a 1:12 scaled model, preserving geometric similarity, was employed.
3.1.2. Aerodynamic Design Variations
To explore the trade-offs between aerodynamic drag and downforce, ten design variants (U1–U9.1) were systematically and iteratively developed by applying combinations of eleven targeted aerodynamic modifications to a common base CAD model. Each modification was grounded in aerodynamic principles, particularly those used in motorsport vehicle optimization. The modifications are described below and are schematically shown in Figure 2.
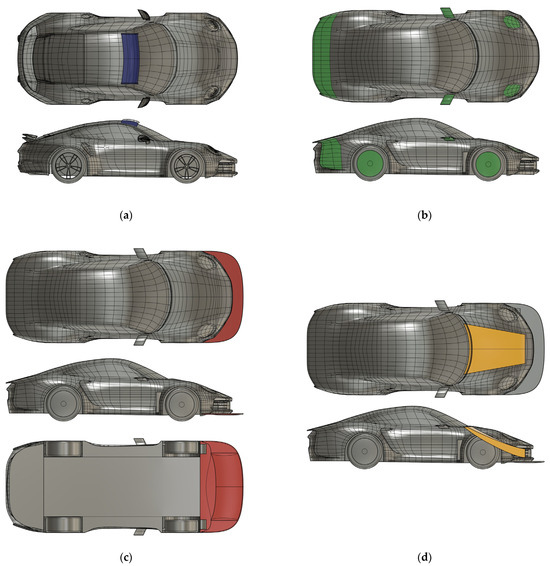
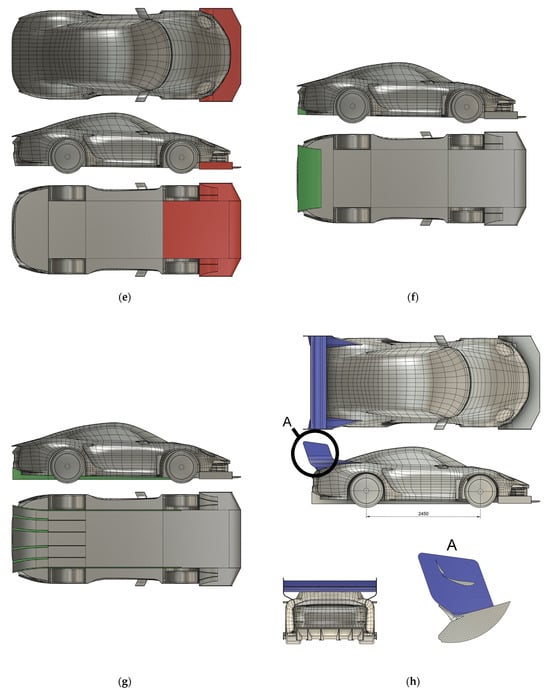
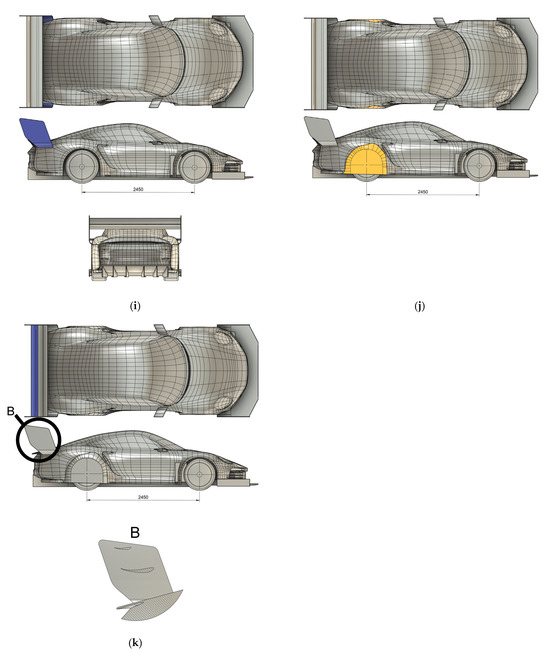
Figure 2.
Aerodynamic features: (a) roof Wing highlighted in blue, (b) streamlining highlighted in green, (c) splitter highlighted in red, (d) S-Duct highlighted in yellow, (e) new Splitter highlighted in red, (f) diffuser highlighted in green, (g) underfloor flow control vanes highlighted in green, (h) wing highlighted in blue and detail view A, (i) new wing support highlighted in blue, (j) rear wheel covers highlighted in yellow, and (k) wing with alternate angle of attack shown in detail view B.
Key Aerodynamic Modification Strategies
- Roof-Wing: A roof wing was added above the front portion of the roof to reduce the lift generated by the low-pressure region. By sandwiching the lower pressure between the roof and the bottom surface of the wing, the lift is expected to cancel out.
- Streamlining: This includes refinements of several bluff body components, such as the headlights, side mirrors, and rear corners. These adjustments aim to reduce the buildup of frontal pressure and form drag while promoting flow attachment. The shape of the headlights was changed to smooth the frontal part with the hood. The rear was also extended while maintaining the angle of the rear windshield and tapering inwards to decrease the wake size and prevent detached flow, causing turbulence in the region [14]. The original spoked wheels were covered with wheel covers to reduce drag [15].
- Splitter: A horizontal aerodynamic plate added under the front bumper to increase stagnation pressure on the upper surface and accelerate airflow below the car. This creates a low-pressure region under the front axle, enhancing front downforce [12].
- S-Duct: An internal channel that guides air from the lower front intake over the hood exit, reducing stagnation pressure at the bumper and improving flow attachment over the hood. The duct begins parallel to the ground and curves upwards to a maximum of 40° from horizontal, 10° steeper than the windshield. It is expected to decrease the front-end lift and delay separation [13].
- New Splitter: A variant of the front splitter. To increase splitter performance and prevent pressure leakage at the sides, endplates were added along the edges, and a ramp was installed in front of the wheel wells to create an air dam and accommodate the front diffusers. These features aim to maintain high pressure across the splitter’s top surface while minimizing spilling over to the low-pressure bottom side. Additionally, diffusers are added leading into the wheel well, generating more downforce at the front.
- Diffuser: The diffuser was designed to enhance underbody flow and generate rear downforce by using the diffuser pumping effect and keeping the upsweep and lateral expansion angles moderate to avoid flow separation [9].
- Underfloor Flow Control: Vertical fins and flow-directing plates under the vehicle that manage turbulent wake from the front wheels and keep clean flow through the diffuser.
- Wing with Spoiler: A two-element rear wing with a span of 2 m, allowing active adjustment of angle of attack [18], is introduced to increase rear downforce during cornering. The angle of attack (AoA) of the first element is set at 15° and 60° for the second element. Additionally, an area of body work under the wing was rotated up to 50°, acting as a spoiler.
- New Wing Support: Two different wing supports were tested. The first support curves inwards halfway between the wing’s first element and the body, while the second support remains vertical until turning horizontally to attach to the body.
- Rear Wheel Covers: Wheel covers were added to cover the rear wheels of the vehicle to reduce turbulence generated by the rear wheel wells by providing a smoother air streamline on the vehicle surface.
- DRS (Drag Reduction System) This configuration is like that described in item 8, above, except the angle of attack of every wing element and spoiler is set to 0°.
Figure 2a–k illustrates these key features in detail. Each figure highlights one of the eleven aerodynamic components as applied to the base model. Instead of displaying all U-variants, this figure set focuses on the modular building blocks that collectively form the optimized configurations. As a visual summary, Figure 3 presents the fully assembled configuration (U9). This model represents the final performance-optimized aerodynamic kit used in comparative CFD analysis.
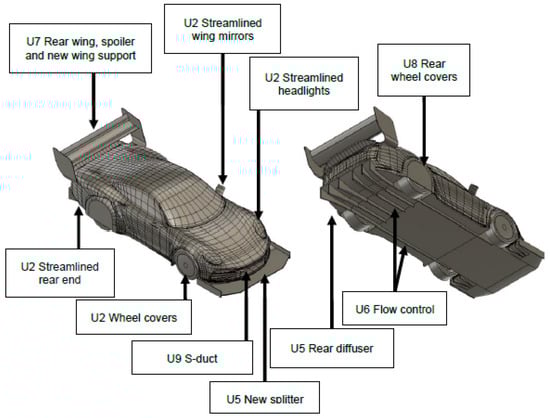
Figure 3.
U9 aerodynamic setup: final CFD design.
Configuration Matrix
Each of the ten configurations (U1–U9.1) represents a unique combination of these features, applied in a cumulative sequence. This strategy allows a step-by-step understanding of how each modification contributes to aerodynamic performance. The summary of the aerodynamic feature matrix for design variants is shown in Table 1.

Table 1.
Aerodynamic feature matrix for design variants U1–U9.1.
3.1.3. Governing Equations and Turbulence Model
The flow was modeled as incompressible, isothermal, and steady Reynolds-averaged. The governing equations are the incompressible Reynolds-averaged Navier–Stokes (RANS) equations:
Continuity:
Momentum (Boussinesq hypothesis):
where is the mean velocity components, is the density, is the dynamic viscosity, is the kinematic viscosity, is the turbulent (eddy) viscosity with the eddy (kinematic) viscosity, and absorbs the isotropic part of the Reynolds stress. The strain-rate tensor is .
Turbulence closure employed the SST k–ω model, which solves transport equations for turbulent kinetic energy (k) and specific dissipation rate (ω):
with , , and , denoting the blending functions. Model constants () follow the standard SST k–ω formulation. The production term may be written as . For the present steady RANS calculations, the temporal terms vanish, i.e., .
Boundary conditions used in this study are summarized as follows (details in Section 3.1.4): a uniform velocity inlet of 33.33 m/s; a pressure-outlet at the domain exit; a moving ground plane to represent road-relative motion; stationary no-slip walls for the vehicle body and aerodynamic components modeled as isothermal at ambient temperature; and moving side/top walls consistent with the freestream. Turbulence quantities at the inlet were specified according to the SST k–ω model practice for external automotive flows.
3.1.4. CFD Setup, Boundary Conditions, and Simulation Parameters
CAD geometry was exported in STEP (.stp) format and pre-processed in ANSYS SpaceClaim 2024 R2 to ensure watertight surfaces and eliminate non-manifold geometries. CFD simulations were performed using ANSYS Fluent 2024 R2. To minimize boundary effects on the vehicle and to observe the wake and freestream airflow, a large computational domain was defined. The car was positioned above a ground plane to reflect realistic ride heights. The domain clearance dimensions measured from the car were 3000 mm upstream, 12,000 mm downstream, 2000 mm laterally on each side, 2000 mm above, and 5 mm from the ground (Figure 4a). These dimensions ensured sufficient space for wake development and accurate pressure recovery.
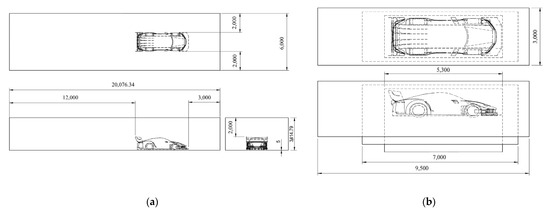
Figure 4.
(a) Dimensions of computational domain and (b) dimensions and element sizes of nested mesh refinement zones surrounding the vehicle.
Meshing was performed using a multi-zone refinement strategy. Three nested refinement boxes surrounded the vehicle, with decreasing element sizes of 0.1 m, 0.06 m, and 0.02 m toward the car. The outer enclosure box had a coarser element size of 0.2 m. A tetrahedral mesh with approximately 24 million cells was used in simulations. Moreover, local mesh refinements were added in regions of expected complexity, particularly near the front splitter, rear diffuser, rear wing, and wake zone, to accurately capture flow separation, shear layers, and vortex dynamics. As Figure 4b shows, the mesh was refined near the model successively to provide enough resolution needed near the car surface.
For turbulence modelling, the SST k–ω model was selected. A pressure-based steady-state solver with air as an incompressible fluid was used. This RANS formulation offers a suitable compromise between computational efficiency and performance for external automotive flows, especially in cases involving moderate separation and recirculation. Boundary conditions included a uniform velocity inlet of 33.33 m/s, stationary no-slip walls for the vehicle body and aerodynamic components. Although this differs from the 11.7 m/s velocity used in the wind tunnel tests, both conditions are within the fully turbulent regime, where aerodynamic coefficients are largely Reynolds-number independent. All vehicle surfaces were modelled as isothermal no-slip walls at ambient temperature, since thermal effects were not considered in the scope of this external aerodynamic study. A moving ground plane was applied to simulate road-relative motion. The side and top walls of the computational domain are also set as moving walls. A pressure-outlet boundary condition is used at the air exit. Residual plots and force coefficient histories were monitored to ensure convergence. The overall CFD setup followed established industrial best practices for vehicle aerodynamic simulations.
The simulations were conducted with a steady RANS framework using the SST k–ω model. This setup is widely applied in external automotive aerodynamics, where integrated forces are dominated by pressure drag. The objective of the present analysis is configuration-level comparison of global lift and drag forces, rather than detailed wall heat transfer or local skin-friction mapping. Mesh refinement was focused on regions of strong pressure gradients, such as the splitter, diffuser, rear wing, and wake.
3.1.5. Post-Processing and Evaluation Criteria
Post-processing of CFD simulation results was performed in ANSYS Fluent and ANSYS CFD-Post to extract key aerodynamic performance metrics and visualize flow characteristics. The primary evaluation criteria were aerodynamic force coefficients, pressure distribution, and flow behaviour in critical regions of the vehicle body.
The drag coefficient is defined as follows:
where is the drag force, is air density, is the inlet velocity, and is the frontal area of the vehicle. Similarly, the lift coefficients is defined as follows:
where is the vertical aerodynamic force. Negative values indicate downforce.
This metric was used to assess aerodynamic efficiency, particularly in configurations targeting high-speed performance. The effectiveness of each aerodynamic iteration was assessed in terms of the percentage change in and relative to the base model.
3.1.6. Mesh Independence Study
To ensure that the CFD predictions were not significantly influenced by the chosen grid resolution, a mesh independence study was performed. Three different mesh densities were generated for configuration U8 as a representative case: a coarse mesh ( cells), the baseline mesh ( cells), and a fine mesh ( cells), as shown in Figure 5. All other boundary conditions, turbulence model settings, and solver configurations were kept constant across the three cases.
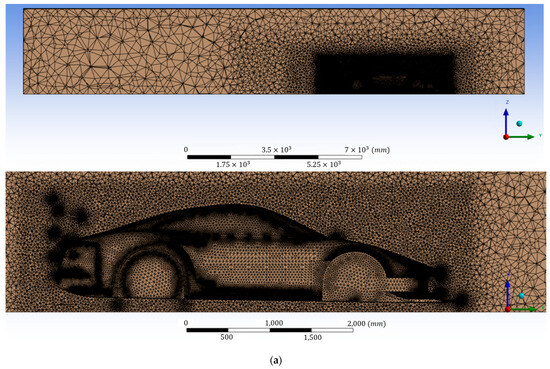
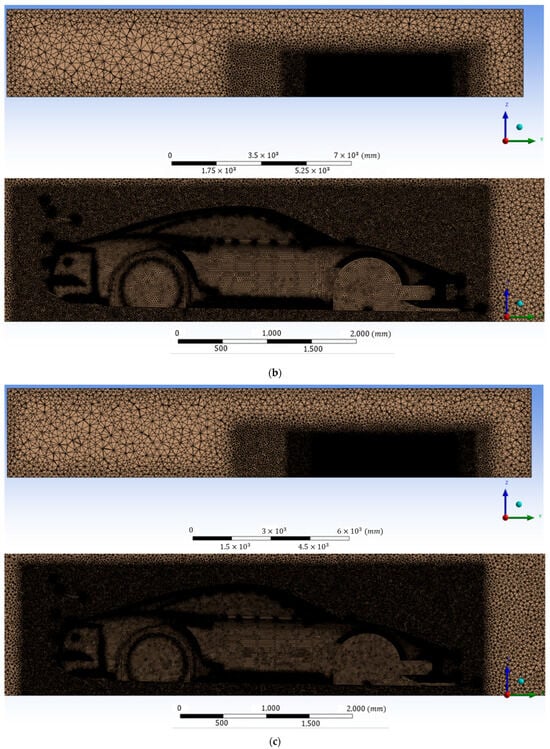
Figure 5.
Computational meshes with different grid densities: (a) coarse mesh (7 M cells), (b) baseline mesh (24 M cells), and (c) fine mesh (35 M cells).
Table 2 presents a comparison of the aerodynamic forces obtained from the three meshes. The results indicate that the variation in both lift and drag forces between the coarse and fine meshes was less than 7%, confirming that the selected 24 million cell mesh was sufficient to achieve mesh-independent solutions.
Table 2.
Comparison of lift and drag forces for different mesh densities.
In addition to aerodynamic forces, quantitative mesh quality metrics were extracted from ANSYS Mesher to ensure grid reliability. Table 3 summarizes the key values of skewness, orthogonal quality, and boundary layer y+ for coarse (7 M), medium (24 M), and fine (35 M) meshes. All meshes satisfied standard quality criteria (max skewness < 0.99, orthogonal quality > 0.15). The SST k–ω model is relatively insensitive to y+, and the obtained ranges fall within accepted practice for RANS external aerodynamics.
Table 3.
Mesh quality metrics for coarse, medium, and fine grids.
To provide further clarity, the full distributions of skewness and orthogonal quality for all three mesh levels are shown in Appendix A (Figure A1). These histograms confirm that the majority of cells lie within acceptable quality ranges, supporting the adequacy of the baseline (24 M) mesh for reliable CFD simulations.
Meshes were generated using ANSYS Mesher with unstructured tetrahedral elements in the domain interior. Local refinement was applied near aerodynamic surfaces, sharp edges, and wake regions to improve resolution of critical flow features, while the mesh was gradually coarsened toward the far field to reduce computational cost. Smooth transitions in element size were used to maintain numerical stability. Mesh quality was assessed using standard metrics, with skewness maintained within accepted limits and orthogonal quality above recommended thresholds. These criteria ensured that the generated meshes were adequate for stable convergence and reliable prediction of external automotive flows.
The relatively low sensitivity of the results to mesh refinement can be attributed to two main factors. First, the near-wall mesh resolution was sufficiently fine to capture boundary layer behavior and flow separation around the body surfaces. Second, the overall drag force is dominated by pressure drag rather than viscous drag; pressure drag is less sensitive to mesh density compared to viscous shear effects. Based on these observations, the baseline mesh with approximately 24 million cells was adopted for the remainder of the study, balancing accuracy and computational efficiency.
Across coarse (7 M), medium (24 M), and fine (35 M) meshes, variations in lift and drag remained within approximately 7%. This confirms that the 24 M cell grid yields mesh-independent global force predictions within typical RANS uncertainty ranges.
3.1.7. Convergence Analysis
To further verify the robustness of the CFD simulations, a convergence study was carried out by monitoring both residuals and aerodynamic force histories. Figure 6 presents the residual plots for continuity, momentum, and turbulence equations. The residuals decreased by over three orders of magnitude, indicating numerical stability. In some cases, the simulations were extended to as many as 6000 iterations to ensure convergence of the aerodynamic forces.

Figure 6.
Residual convergence histories (continuity, momentum, and turbulence).
Figure 7 shows the variation of lift and drag forces with iteration number. Oscillatory behavior was observed in the force histories, which is attributed to the formation of unsteady vortical structures in the wake region behind the vehicle. Such vortex shedding phenomena, similar to Kármán-type vortex streets observed behind bluff bodies, are inherently oscillatory even under steady-state RANS simulations. To capture this variability, error bars were included in the aerodynamic force results presented in Figures 11–18 in Section 5.
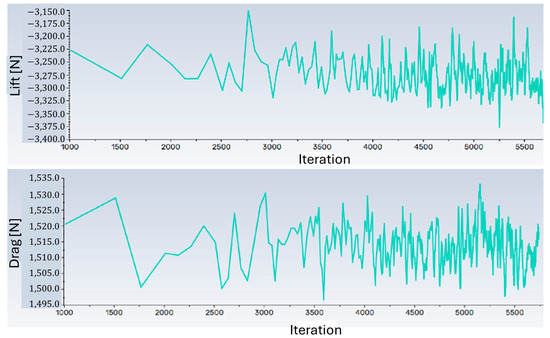
Figure 7.
Force coefficient histories (drag/lift vs. iterations).
These results confirm that the simulations reached a sufficiently converged state and that the reported aerodynamic forces are representative of the underlying flow physics.
3.1.8. Grid Convergence and Numerical Uncertainty (GCI)
To quantify mesh-induced numerical uncertainty using the three existing grids for configuration U8 (coarse: 7 million cells, medium: 24 million, fine: 35 million), a standard Grid Convergence Index (GCI) procedure is adopted. The representative grid size scales as . The refinement ratios are (medium→fine) and (coarse→medium). Based on the second-order spatial discretization of the steady RANS solver, a formal order (and a conservative ) is used with a safety factor .
For a generic quantity (lift or drag force), the Richardson-extrapolated value is
and the fine–medium GCI is
Using the U8 forces already reported in this work (fine: lift N, drag N; medium: lift N, drag N; coarse: lift N, drag N), the refinement ratio is . The fine–medium percentage changes are (lift) and (drag). The values are (lift) and (drag) for ; adopting yields and , respectively. The Richardson-extrapolated estimates are N (lift) and N (drag), with relative differences of and between (fine) and . These results indicate that the conclusions are not controlled by grid size within the reported uncertainty bounds, which are typical for steady external-aerodynamics RANS analyses. A quantitative mesh convergence analysis was performed using the Grid Convergence Index (GCI); the detailed results are summarized in Table 4.
Table 4.
Mesh-uncertainty summary for U8 (fine–medium pair shown).
The fine–medium GCI values for both lift and drag are small, indicating that the aerodynamic conclusions are not controlled by grid resolution. This supports the suitability of the chosen mesh density for RANS-based evaluation of global loads.
3.2. Wind Tunnel Model Fabrication and Testing Setup
To further understand the CFD findings and to gain some qualitative insight into the flow behaviour, especially when the DRS system is used, flow visualization tests were carried out in the sub-sonic wind tunnel at Chulalongkorn University. The open-circuit tunnel’s test section measures 300 mm × 300 mm × 600 mm, providing adequate clearance to avoid excessive blockage. A 1:12 scale model was 3D printed in ABS (Acrylonitrile Butadiene Styrene), with particular care taken to reproduce aerodynamically critical features such as the front splitter, rear diffuser, and the rear wing. Post-processing (sanding and primer) reduced surface roughness so that boundary-layer development would not be artificially disturbed. The tunnel air velocity was set at 11.7 m/s, resulting in a model Reynolds number of about 3 × 10⁸. Although lower than the full-scale vehicle Reynolds number (~1 × 10¹⁰ at 120 km/h), test conditions were chosen to achieve the highest possible Reynolds number. The model was installed in a level position with zero pitch and yaw angles to maintain a neutral baseline aerodynamic orientation.
Two configurations were tested: U9 representing the full aerodynamic package; and U9.1, with the rear wing set to 0° angle of attack (DRS mode). These two cases represent the extremes of the aerodynamic spectrum, allowing evaluation of both downforce-focused and drag-reduction-focused setups.
4. Results
4.1. CFD Simulation Results
The baseline mode is considered the one representing the factory-equipped setup. To systematically optimize the aerodynamic performance, each configuration was virtually tested by selectively adding aerodynamic elements. Ten core aerodynamic configurations (U1–U9.1) were then evaluated using steady-state CFD simulations to assess lift, drag, and the corresponding non-dimensional coefficients, and , and compared against the baseline mode. Table 5 outlines aerodynamic trends observed. The same results are also shown graphically in Figure 8. Some simulations showed oscillatory behavior of drag and lift forces; those values are indicated as error bars in Figure 8.
Table 5.
The aerodynamic forces and coefficients for each configuration.
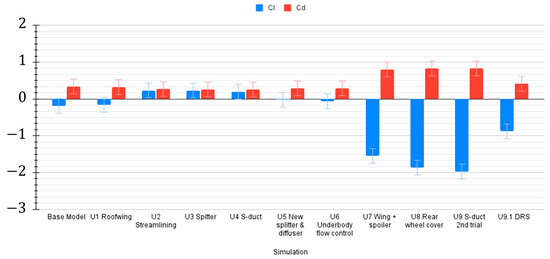
Figure 8.
Performance for each aerodynamic configuration. Error bars denote the larger of (i) the steady-RANS force-history variability caused by wake unsteadiness and (ii) the fine–medium GCI uncertainty.
Performance evolution
- U1 resulted in a small increase in CL and a small decrease in CD.
- U2 resulted in a large increase in CL, creating a net lift force over the vehicle and a moderate decrease in CD.
- U3 and U4 resulted in no noticeable change in both CL and CD.
- U5 resulted in a moderate decrease in CL, returning to a negative value signifying downforce is being generated, and a moderate increase in CD.
- U6 resulted in no noticeable change in both CL and CD.
- U7 resulted in the largest decrease in CL and CD.
- U8 resulted in a moderate decrease in CL and no noticeable change in CD.
- U9 again resulted in no noticeable change in both CL and CD. This configuration shows a 1024% increase in downforce along with a 176% increase in drag force from the base model. When scaled up to 177 mph, the model is predicted to produce up to 21,000 N of downforce, equivalent to 2140 kg, exceeding the project’s initial goal.
- U9.1 resulted in a significant increase in CL and a significant decrease in CD, showing that this final configuration can keep producing downforce while the drag force increased by 8.2% from the base model.
These results highlight the importance of both strategic component placement and holistic integration. While rear-mounted aero devices are critical for maximizing downforce, their associated drag penalties can outweigh benefits unless paired with drag-reduction mechanisms, such as the DRS in U9.1. The CFD-based approach not only identified performance-optimal setups but also revealed design inefficiencies early, offering a fast and cost-effective pathway for real-world aerodynamic development.
4.2. Wind Tunnel Flow Visualization Results
Figure 9a shows the smoke visualization of the base model configuration (Performance mode without DRS). Flow separation is evident at the rear windshield and over the wing surface, forming a wide and turbulent wake. These features correlate with the high drag and limited downforce as predicted by CFD for this setup. The smoke clearly detaches from the body near the rear windshield, indicating a large wake bubble. In Figure 9b, the visualization of the DRS-equipped variant (U9.1), rear airflow remains more attached, forming a narrower and more coherent wake, indicative of drag reduction. The streamlines stay closer to the vehicle surface until reaching the rear, affirming the improved aerodynamic efficiency as predicted by CFD.

Figure 9.
(a) Smoke visualization of the U9 configuration without DR, and (b) airstream visualization over the model in the U9.1 configuration with DRS (wings and spoiler AoA = 0°).
Figure 10 presents lateral views illustrating boundary layer development and flow progression along the roofline and rear windshield. The images clearly show a distinct difference in the deflection angle of the airflow after interacting with the rear wing, indicated by red arrows. When the DRS (Drag Reduction System) is activated, the airflow remains significantly more streamlined and continuous (Figure 10a) compared to the non-DRS condition (Figure 10b). This indicates a reduction in aerodynamic drag when DRS is engaged.
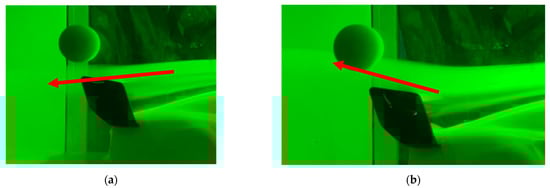
Figure 10.
(a) Flow direction visualization over the model in U9.1 configuration with DRS (wings and spoiler AoA = 0°), and (b) flow direction visualization of the U9 configuration without DRS. (The red arrows show the direction of the stream.).
4.3. CFD vs. Wind Tunnel Comparison
A direct quantitative comparison between CFD and wind tunnel results was limited by the lack of reliable force measurements in the facility. In fact, preliminary measurements were found to be inconsistent and unreliable, and thus, they were intentionally excluded from the analysis. Instead, only qualitative smoke visualization was retained to examine wake structures and flow attachment. While this prevents a direct quantitative validation of the CFD predictions, the qualitative agreement of wake narrowing and flow attachment trends between simulation and experiment provides confidence in the relative performance improvements observed across configurations.
It should be emphasized that the CFD simulations were deliberately performed at the full-scale Reynolds number to directly assess the aerodynamic performance of the real vehicle. As a result, a mismatch with the Reynolds number of the scaled wind tunnel tests was unavoidable. The experimental results were therefore intended only as qualitative supplements to visualize flow structures and confirm CFD-predicted trends, rather than to serve as direct quantitative validation.
Despite these limitations, the flow visualization results qualitatively supported CFD predictions. DRS mode (U9.1) exhibited a narrower, more attached wake in both CFD and smoke tests. U9 showed stronger separation and turbulent flow behind the vehicle, consistent with higher drag levels.
Observed Discrepancies and Their Causes
The experiments also revealed some qualitative differences, highlighting limitations in the wind tunnel setup:
- Lower Reynolds number in CFD (~1010 vs. ~108 in wind tunnel): promotes thicker boundary layers and earlier separation.
- Stationary tunnel floor: Unlike the moving-ground setup in CFD, the fixed floor increases underbody blockage and reduces the accuracy of wake and diffuser behaviour.
- Surface roughness: The 3D-printed model had imperfect finishes, especially at seams and layer lines, which likely altered boundary layer adherence.
It should be noted that the smoke visualization provides only qualitative confirmation of the flow structures and wake behavior. This approach cannot validate the absolute magnitudes of lift and drag predicted by CFD, but it does confirm the relative aerodynamic trends, such as wake narrowing in the DRS configuration.
4.4. Scope and Validation Strategy
This work targets full-scale predictive CFD at the vehicle-scale Reynolds number; the scaled wind-tunnel experiments are employed solely for qualitative flow visualization (wake width, attachment/separation, downwash) rather than for quantitative force matching. Direct quantitative validation in the available small open-circuit tunnel is intrinsically limited by Reynolds number disparity, absence of a moving ground, and surface-finish effects on the 3D-printed model. Accordingly, the validation claim is qualitative by design, while numerical credibility is quantified via a formal GCI analysis on the CFD side.
5. Discussion
5.1. Effectiveness of CFD-Guided Design
The simulation-led design methodology proved effective in rapidly identifying high-performance aerodynamic upgrades without requiring physical prototyping for every iteration. Starting from baseline modes, aerodynamic components were gradually introduced and analysed through CFD simulations. This approach allowed for immediate observation of their individual and combined effects on the flow behavior, pressure distribution, and aerodynamic forces. Figure 11, Figure 12, Figure 13, Figure 14, Figure 15, Figure 16, Figure 17 and Figure 18 provide visual comparisons of streamlines, velocity fields, and surface pressure distributions across configurations U1 through U9.1.
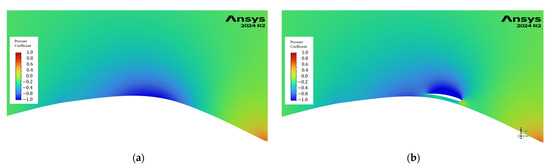
Figure 11.
Midplane flow fields: (a) pressure coefficient contour for Base Model, and (b) pressure coefficient contour for U1.

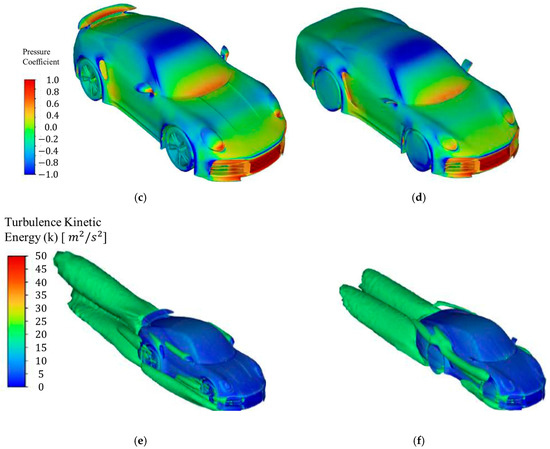
Figure 12.
Flow visualization for U2: (a) Velocity contour of midplane for Base model, (b) velocity contour of midplane for U2, (c) pressure coefficient contour for Base model, (d) pressure coefficient contour for U2, (e) turbulence kinetic energy iso-surface at 20 m2/s2 for Base model, and (f) turbulence kinetic energy iso-surface at 20 m2/s2 for U2.
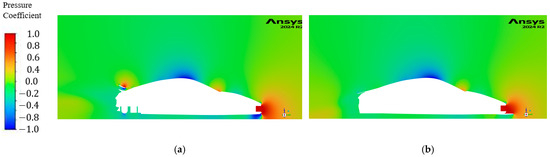
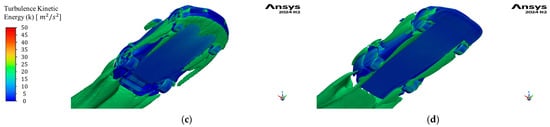
Figure 13.
(a) Pressure coefficient contour of midplane for Base model, (b) pressure coefficient contour of midplane for U3, (c) turbulence kinetic energy iso-surface at 20 m2/s2 for Base model, and (d) turbulence kinetic energy iso-surface at 20 m2/s2 for U3.

Figure 14.
Velocity vectors through midplane for U4.

Figure 15.
(a) Contours illustrating the pressure variation on the top and bottom surfaces of the wing, and (b) velocity vectors on the vertical center plane.
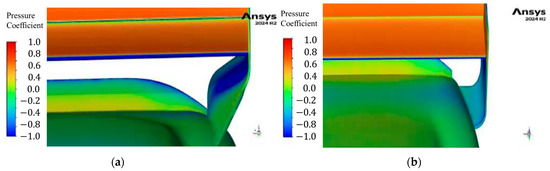
Figure 16.
(a) Contours illustrating the pressure variation on the top surfaces of the wing and the first support design, and (b) the second support design.
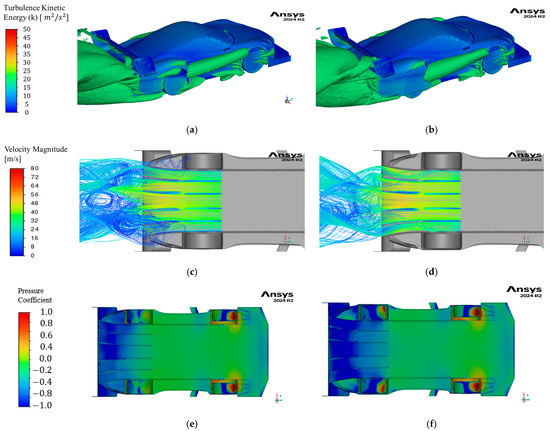
Figure 17.
(a) Iso-surface of turbulence kinetic energy at 20 m2/s2 U8, (b) iso-surface of turbulence kinetic energy at 20 m2/s2 U8, (c) pathlines of air entering the diffuser for U10, (d) pathlines of air entering the diffuser for U10, (e) pressure coefficient contour of U7, and (f) pressure coefficient contour of U8.
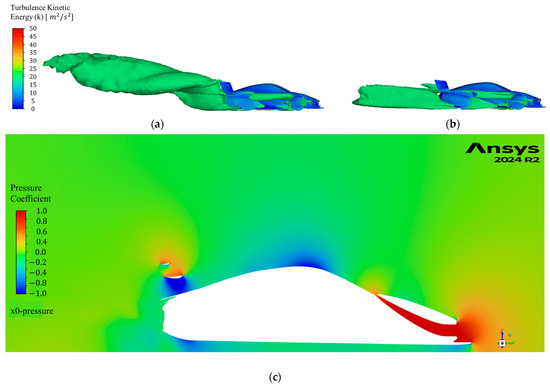
Figure 18.
(a) Iso-surface of turbulence kinetic energy at 20 m2/s2 U8, (b) iso-surface of turbulence kinetic energy at 20 m2/s2 U9, and (c) pressure coefficient contour of midplane for U9.
Pressure coefficient is defined as , where p is the static pressure at the point of evaluation, is the freestream static pressure, and U is the freestream fluid velocity.
Figure 11 (U1): Performance with the introduction of the front-mounted roof-wing is shown in Figure 11. Low pressure still forms on the curved top surface of the roof wing (Figure 11b) like the base model (Figure 11a), resulting in no change in downforce. Since this modification was unsuccessful in increasing downforce or reducing drag, it was excluded from successive variants. The gap between the wing and the roof, the longitudinal position of the wing, and the wing’s profile should be further studied.
Figure 12 (U2): The spoiler and wing on the Base model speed directs the wake behind the car upwards, shown by the low velocity region in Figure 12a, while without the spoiler and wing (U2), the wake is directed downwards and is smaller in size, as shown in Figure 12b. The high pressure created at the base of the headlights is of lower magnitude in U2 (Figure 12c,d). The turbulent kinetic energy plots indicate the extent to which turbulence still exists in the flow field (Figure 12e,f).
Figure 13 (U3): The splitter produced less low pressure (Figure 13a,b) and less turbulence (Figure 13c,d) under its lip compared to the base model.
Figure 14 (U4): To increase the airflow through the s-duct, the outlet should be increased in size, and the angle of the duct at the inlet should be steeper to avoid the recirculation zone inside the duct. The outlet angle should also be less steep to ensure that air exiting from the s-duct does not disturb the air flowing over the hood.
Figure 15 (U7): Higher pressure is generated on the top surface while low pressure is generated on the bottom surface of the wing (Figure 15a). The velocity vector plot indicates that the flow under the wing stays attached to both wing elements (Figure 15b).
Figure 16 (U7): Low pressure generated by the wing acts on a strip of the car’s body directly underneath the wing and the slanted part of the wing support (Figure 16a). In the second design, it is much lower (Figure 16b). Since the bottom surface of both supports sees roughly the same pressure, the lift force generated in this area by the second design is less than that of the first.
Figure 17 (U8): Turbulence generated around the rear wheel at the lower front of the wheel well is reduced, and the turbulence generated at the top of the wheel well is eliminated (Figure 17a,b). The flow in the outermost diffuser tunnels in U11 has a higher velocity than in U10 (Figure 17c,d). Therefore, the pressure under the diffuser is also lower than U10 and acts on a larger area, which contributes to the higher downforce observed (Figure 17e,f).
Figure 18 (U9.1): By turning the wing elements and spoiler to a lower angle of attack, the size of the wake generated behind the car (Figure 18a,b) is greatly reduced, as well as the high-pressure region above the wing (Figure 18c).
By simulating airflow interactions at each design stage, the CFD-guided workflow significantly reduced development time and cost, focusing experimental validation only on final candidates. This strategy underscores the utility of modular, simulation-first approaches in motorsport and high-performance automotive applications.
5.2. Implications for Automotive/Motorsport Applications
The findings of this study have several practical implications for motorsport teams and automotive OEMs, especially those operating under budgetary and time constraints. Key takeaways include the following:
- Simulation-first design reduces reliance on physical prototyping: By leveraging steady-state CFD in a modular design process, the number of required physical prototypes was significantly reduced. In this study, only the baseline and final (U9.1) configurations underwent wind tunnel testing, cutting down time and cost.
- Demonstrated high-impact results under resource limits: The study achieved a tenfold increase in downforce from ~300 N in the base model to over 3500 N in U9, validating the effectiveness of a CFD-led process even with limited experimental validation.
- Relevance to real-world motorsport and niche production: For low-volume performance cars, this approach provides a validated path to develop competitive aerodynamic packages without access to full-scale wind tunnel testing.
Overall, this work demonstrates that CFD-guided iterative design can overcome typical constraints in motorsport and performance vehicle development. As discussed in the introduction, the limited experimental resources were strategically compensated with targeted validation, showing that significant aerodynamic gains can still be achieved through smart integration of simulation and physical testing. It should also be acknowledged that the absence of quantitative experimental validation represents a limitation of this study. Force measurements from the scaled wind tunnel were excluded due to their lack of reliability, leaving only qualitative flow visualization to support the CFD findings. Importantly, the CFD simulations were deliberately conducted at the full-scale Reynolds number in order to capture real-vehicle aerodynamic behavior, rather than to replicate the reduced-scale tunnel conditions. Consequently, the wind tunnel experiments were intended solely as qualitative supplements to visualize flow structures and confirm CFD-predicted trends, rather than to provide direct quantitative validation. Nevertheless, the CFD predictions remain scientifically valuable when interpreted in terms of comparative trends between design variants. Such trend-based evaluation is consistent with industrial aerodynamic development practices, where CFD is routinely relied upon to assess incremental design improvements even in the absence of high-fidelity experimental data.
5.3. Comparative Analysis
Comparative visualizations of pressure, velocity, and turbulence are already provided across configurations U1–U9.1 (Figure 11, Figure 12, Figure 13, Figure 14, Figure 15, Figure 16, Figure 17 and Figure 18), which highlight the aerodynamic trends between CFD and experimental flow visualization. Given the limitations of the wind tunnel facility, only qualitative comparisons (wake narrowing, flow attachment) were feasible rather than direct overlays. These visualizations sufficiently demonstrate the consistency between CFD predictions and observed flow structures.
5.4. Limitations and Future Work
The Reynolds mismatch between full-scale CFD and the scaled tunnel prevents quantitative force comparison. The unequal refinement ratios make the GCI conservative; therefore, both GCI and fine–medium percentage changes are reported to provide transparent uncertainty bounds. Future work will include low-Re CFD under tunnel conditions and moving-ground experiments in a higher-fidelity facility to enable direct quantitative comparisons, complementing the full-scale predictive results presented here. The RANS approach with the SST k–ω model is suitable for predicting configuration-level aerodynamic loads in pressure-dominated regimes, but it is not intended to resolve near-wall skin-friction phenomena with high fidelity. Future extensions may include wall-resolved RANS or hybrid DES/LES in critical regions if local wall effects become the primary objective.
Although the meshes already satisfied industry-standard quality thresholds (max skewness < 0.99, minimum orthogonal quality > 0.15, and acceptable y+ ranges), further refinement with wall-resolved RANS or hybrid LES/DES may provide more accurate near-wall resolution if skin-friction effects become the primary focus of future investigations.
5.5. Computational Resources
All CFD simulations were performed on a workstation equipped with an Intel® Core™ i7-14700K processor (3.4 GHz, 20 cores) and 64 GB of RAM, running Windows 11 Enterprise (24H2). Each baseline case with the 24M-cell mesh required approximately 6–10 h of wall-clock time to converge to steady state. These specifications confirm that the methodology can be executed on accessible high-end desktop hardware, ensuring reproducibility and practical feasibility for motorsport-oriented aerodynamic studies.
6. Conclusions
This work illustrates that a simulation-first approach can yield significant aerodynamic improvements for high-performance vehicles, even with constrained testing resources. Through CFD-driven iteration, we realized a substantial increase in downforce by adding carefully chosen aerodynamic devices, while preserving the vehicle’s core geometry—most enhancements were external and bolt-on, respecting real-world constraints. A dual-configuration solution was developed: one setup (U9) prioritizes maximum downforce for cornering, and another (U9.1) employs a DRS to substantially reduce drag (by roughly 50% compared to the full-downforce kit) for high-speed runs, while still providing considerable downforce. This flexible aerodynamic package underscores the potential of multi-mode aero designs in sports cars.
To strengthen the reliability of the numerical methodology, a mesh independence study and convergence analysis were performed. These confirmed that the aerodynamic predictions were not sensitive to grid density and reached a converged solution despite oscillations in force histories caused by wake vortex shedding. Such verification increases confidence in the robustness of the CFD results.
Limited wind tunnel tests, conducted at a 1:12 scale, qualitatively supported the CFD results by visualizing wake narrowing and improved flow attachment in the DRS configuration. These tests also highlighted the challenges of scaled validation, including the mismatch in Reynolds number (3 × 10⁸ in the tunnel vs. 1010 at full scale) and the absence of a moving ground, which prevents direct quantitative comparison. Nevertheless, even qualitative flow visualization proved valuable in confirming CFD-predicted aerodynamic trends.
In summary, this study demonstrates that substantial aerodynamic gains can be achieved through CFD-guided design, with strategic use of limited experiments to verify critical flow features. While the absence of quantitative experimental validation remains a limitation, the CFD simulations were deliberately conducted at the full-scale Reynolds number to reflect real-vehicle performance. Within this context, the results remain scientifically and practically valuable when interpreted as comparative trends between design variants. For motorsport teams and low-volume manufacturers operating under budget or facility constraints, the proposed approach offers a practical template: use CFD to explore a wide design space, identify a few optimal configurations, and validate those cases qualitatively to ensure realism. Ultimately, our findings affirm that smart integration of CFD and targeted testing can overcome typical development constraints, delivering significant aerodynamic improvements in a cost-effective manner.
Author Contributions
Conceptualization, N.K., P.M., N.A., and P.D.S.; Data curation, N.K. and P.M.; Formal analysis, N.K. and P.M.; Funding acquisition, G.P.; Investigation, N.K. and P.M.; Methodology, N.K. and P.M.; Project administration, N.A. and G.P.; Resources, P.M., N.A., and P.D.S.; Software, N.K. and P.M.; Supervision, N.A., P.D.S., and G.P.; Validation, N.K. and P.M.; Visualization, N.A. and P.D.S.; Writing—original draft, N.A., P.D.S., and G.P.; Writing—review and editing, N.K., P.M., N.A., P.D.S., and G.P. All authors have read and agreed to the published version of the manuscript.
Funding
This research project is supported by the Thailand Science Research and Innovation Fund, Chulalongkorn University (IND_FF_68_007_2100_001).
Data Availability Statement
Any inquiry can be directly sent to the corresponding author.
Acknowledgments
We would also like to thank the Immersive Technology Laboratory (IMT Lab), Faculty of Engineering, Chulalongkorn University.
Conflicts of Interest
The authors declare no conflicts of interest.
Appendix A

Figure A1.
Histograms of mesh quality metrics for coarse (7 M), medium (24 M), and fine (35 M) grids. Sub-figures (a,c,e) show skewness distributions, while (b,d,f) show orthogonal quality distributions.
References
- Zhang, C.; Bounds, C.P.; Foster, L.; Uddin, M. Turbulence Modeling Effects on the CFD Predictions of Flow over a Detailed Full-Scale Sedan Vehicle. Fluids 2019, 4, 148. [Google Scholar] [CrossRef]
- Gebbink, R.; Wang, G.; Zhong, M. High-speed wind tunnel test of the CAE aerodynamic validation model. Chin. J. Aeronaut. 2018, 31, 439–447. [Google Scholar] [CrossRef]
- Kumar, R.B.; Varshan, N.M.; Kannan, T. Aerodynamic design optimization of an automobile car using computational fluid dynamics approach. Aust. J. Mech. Eng. 2019, 19, 495–501. [Google Scholar] [CrossRef]
- Lietz, R.; Pien, W.; Remondi, S. A CFD Validation Study for Automotive Aerodynamics; SAE Technical Papers on CD-ROM/SAE Technical Paper Series; SAE: Warrendale, PA, USA, 2000. [Google Scholar] [CrossRef]
- Pacheco, J.; Marta, A.C.; Eça, L. Wind tunnel testing of a Formula Student vehicle for checking CFD simulation trends. Proc. Inst. Mech. Eng. Part D J. Automob. Eng. 2023, 238, 4347–4363. [Google Scholar] [CrossRef]
- Qin, P.; Ricci, A.; Blocken, B. CFD simulation of aerodynamic forces on the DrivAer car model: Impact of computational parameters. J. Wind Eng. Ind. Aerodyn. 2024, 248, 105711. [Google Scholar] [CrossRef]
- Buscariolo, F.F.; Hoessler, J.; Moxey, D.; Jassim, A.; Gouder, K.; Basley, J.; Murai, Y.; Assi, G.R.; Sherwin, S.J. Spectral/hp element simulation of flow past a Formula One front wing: Validation against experiments. J. Wind Eng. Ind. Aerodyn. 2022, 221, 104832. [Google Scholar] [CrossRef]
- Elrefaie, M.; Morar, F.; Dai, A.; Ahmed, F. Drivaernet++: A large-scale multimodal car dataset with computational fluid dynamics simulations and deep learning benchmarks. arXiv 2024. [Google Scholar] [CrossRef]
- Ehirim, O.H.; Knowles, K.; Saddington, A.J. A review of Ground-Effect Diffuser Aerodynamics. J. Fluids Eng. 2018, 141, 020801. [Google Scholar] [CrossRef]
- Kurec, K.; Remer, M.; Mayer, T.; Tudruj, S.; Piechna, J. Flow control for a car-mounted rear wing. Int. J. Mech. Sci. 2018, 152, 384–399. [Google Scholar] [CrossRef]
- Bhatnagar, U.R. Formula 1 Race Car Performance Improvement by Optimization of the Aerodynamic Relationship Between the Front and Rear Wings. Masters’ Thesis, The Pennsylvania State University, University Park, PA, USA, 2014. [Google Scholar]
- Bhattacharjee, S.; Arora, B.; Kashyap, V. Optimization of Race Car Front Splitter Placement Using CFD; SAE Technical Papers on CD-ROM/SAE Technical Paper Series; SAE: Warrendale, PA, USA, 2019. [Google Scholar] [CrossRef]
- Callinan, J.; Boyle, F.J. Applicability of S-ducts for electric cars: A CFD investigation. J. Eng. 2025, 2025, e70046. [Google Scholar] [CrossRef]
- Altaf, A.; Omar, A.A.; Asrar, W. Passive drag reduction of square back road vehicles. J. Wind Eng. Ind. Aerodyn. 2014, 134, 30–43. [Google Scholar] [CrossRef]
- Brandt, A.; Berg, H.; Bolzon, M.; Josefsson, L. The effects of wheel design on the aerodynamic drag of passenger vehicles. SAE Int. J. Adv. Curr. Pract. Mobil. 2019, 1, 1279–1299. [Google Scholar] [CrossRef]
- Katz, J. Aerodynamics of race cars. Annu. Rev. Fluid Mech. 2006, 38, 27–63. [Google Scholar] [CrossRef]
- Elrefaie, M.; Dai, A.; Ahmed, F. Drivaernet: A parametric car dataset for data-driven aerodynamic design and prediction. J. Mech. Des. 2025, 147, 041712. [Google Scholar] [CrossRef]
- Chaiyanupong, J.; Khajorntraidet, C. Design and Analysis of Double Element Airfoil Using RANS. J. Res. Appl. Mech. Eng. (JRAME) 2024, 12, 1–9. [Google Scholar] [CrossRef]
Disclaimer/Publisher’s Note: The statements, opinions and data contained in all publications are solely those of the individual author(s) and contributor(s) and not of MDPI and/or the editor(s). MDPI and/or the editor(s) disclaim responsibility for any injury to people or property resulting from any ideas, methods, instructions or products referred to in the content. |
© 2025 by the authors. Licensee MDPI, Basel, Switzerland. This article is an open access article distributed under the terms and conditions of the Creative Commons Attribution (CC BY) license (https://creativecommons.org/licenses/by/4.0/).