Article

Optimal Configuration of Hydrogen Energy Storage Systems Considering the Operational Efficiency Characteristics of Multi-Stack Electrolyzers

1
National User-Side Energy Storage Innovation Research and Development Center, North China University of Technology, Beijing 100144, China
2
State Key Laboratory of Power System and Generation Equipment, Tsinghua University, Beijing 100084, China
3
State Power Investment Group Science and Technology Research Institute Co., Ltd., Beijing 102200, China
*
Author to whom correspondence should be addressed.
Modelling 2025, 6(3), 101; https://doi.org/10.3390/modelling6030101
Submission received: 14 July 2025 / Revised: 26 August 2025 / Accepted: 2 September 2025 / Published: 12 September 2025

Abstract

Enhancing the economics of microgrid systems and achieving a balance between energy supply and demand are critical challenges in capacity allocation research. Existing studies often neglect the optimization of electrolyzer efficiency and multi-stack operation, leading to inaccurate assessments of system benefits. This paper proposes a capacity allocation model for wind-PV-hydrogen integrated microgrid systems that incorporates hydrogen production efficiency optimization. This paper analyzes the relationship between the operating efficiency of the electrolyzer and the output power, regulates power generation-load mismatches through a renewable energy optimization model, and establishes a double-layer optimal configuration framework. The inner layer optimizes electrolyzer power allocation across periods to maximize operational efficiency, while the outer layer determines configuration to maximize daily system revenue. Based on the data from a demonstration project in Jiangsu Province, China, a case study is conducted to verify that the proposed method can improve system benefits and reduce hydrogen production costs.

1. Introduction

To cope with global climate change, the construction of a new type of power system, mainly based on RE, is a trend for future development [1]. However, RE, represented by wind power and PV, is characterized by intermittency, volatility, and uncertainty, negatively affecting power quality, the economy, and the stability of system operation [2,3,4]. Therefore, there is an urgent need to balance and buffer with the help of new energy storage and other technological means [5]. Hydrogen as an ideal clean energy carrier, has the advantages of low self-depletion rate, cross-seasonal storage, and high energy density [6]. It is a high-quality energy storage medium for achieving carbon neutrality [7,8,9].
The wind-PV-hydrogen integrated microgrid system utilizes hydrogen as an energy carrier, which represents an effective strategy for promoting RE consumption [10,11,12]. Reference [13] describes the construction of a hydrogen hybrid energy system that includes wind power, PV, electrolyzer, and FC. The performance of this integrated energy system in both on-grid and off-grid modes has been verified through simulation. Given the high configuration cost of hydrogen energy storage, determining the optimal capacity of the system to ensure reliable energy supply while maximizing benefits has become a focal point of current research [14]. References [15,16] focus on the operational economics of a wind-PV-hydrogen hybrid microgrid system and employ intelligent optimization algorithms to find the best capacity allocation; References [17,18] have developed a two-layer capacity optimization allocation model aimed at enhancing system operation scheduling and the economics of capacity allocation. Reference [19] constructed a multi-energy complementary microgrid containing pumped storage, wind energy, PV, and hydrogen production systems, and enhanced the utilization rate of RE by fine modeling and optimizing the configuration of each device, and proposed a judgement matrix method to effectively evaluate the system performance. However, these studies did not consider the impact of different operating modes of the equipment within the system.
AEL as the core equipment of the integrated wind-PV-hydrogen microgrid system [20,21]. Conversion of system surplus electrical energy into hydrogen energy and storage by hydrogen storage equipment [22], with the advantages of large single capacity and lower equipment cost, has good economy in the scale hydrogen production system [23]. Multiple small-capacity electrolyzer units are usually used to form an MES in practical engineering, which has good flexibility and operational reliability compared to the simple-to-operate large-capacity electrolyzer operation for hydrogen production [24]. Since MES is a multi-source system, the overall efficiency of the system is affected by the power allocation of each electrolyzer, the economic efficiency and operational efficiency of MES can be improved by a reasonable operation scheduling strategy [25]. Reference [26] optimized the electrolyzer operation mode through supercapacitors and segmented start-stop control strategies to enhance the hydrogen production and electrolyzer lifetime of the system; Reference [27] de-signed a power equalisation strategy and a rotation strategy for multi-stack electrolyzers to improve the operational efficiency and hydrogen production in alkaline electrolyzers; Reference [28] proposed a segmented fuzzy control based alkaline electrolyzer array efficiency improvement method to optimize the operating cost of the system to minimize the cost of hydrogen production. The above study is a switching strategy to change the operating state of the electrolyzer based on specific rules, but the operating characteristics of the electrolyzer are not sufficiently considered.
On this basis, Reference [29] constructed an electrolyzer model considering the variation of hydrogen production efficiency and the start-stop process, and proposed a rolling optimization strategy taking into account the constraints on the operating state of the electrolyzer, which improves the operating efficiency of the electrolyzer and the system economy; Reference [30] considers control strategies and capacity optimization methods for PV, battery storage and electrolyzer equipment state quantities to minimize the cost of hydrogen production from the electrolyzer; Reference [31] modeled and analyzed the life decay characteristics of the electrolyzer and optimized the scheduling with the objectives of the life of the electrolyzer and the gain of the system, which improved the life of the equipment and the system economics. Reference [32] proposes a hybrid electrolyzer hydrogen production system containing AEL and proton exchange membrane electrolyzer, and energy optimization algorithm based on bi-level variable-step fuzzy controller-genetic algorithm, and combines the two kinds of the characteristics of the two devices are combined to improve the solution speed and device lifetime of the hydrogen production system.
In addition, although the existing optimal scheduling strategies achieve the optimization of operation efficiency and hydrogen production cost, most of them assume that the power level, operation environment and performance of each electrolyzer in the MES are identical, so there is still a need to study the optimization method of MES operation efficiency in the presence of differences in the performance of electrolyzers. Rational configuration of hydrogen storage capacity can improve the economic performance of integrated wind-PV-hydrogen microgrid systems. Currently, most hydrogen production systems either use a single large-capacity electrolyzer for hydrogen production or operate multiple electrolyzers with simultaneous startup and shutdown. Research on the operation optimization of multi-electrolyzer systems remains limited, and most of the existing studies focus on rule-based switching strategies. To highlight the key research gaps in the existing literature, Table 1 presents a comparative taxonomy of different capacity configuration methods for hydrogen energy storage systems. Based on the literature review and this taxonomy table, the main research gaps identified in the literature are as follows:
To adapt to the volatility of RE, it is necessary to dynamically adjust the output power of the electrolyzer array, and this process requires accurate assessment of the expected benefits under different electrolyzer operating efficiencies. Therefore, taking the integrated wind-PV-hydrogen microgrid system as the research background, this paper comprehensively considers RE consumption, microgrid system configuration costs, and operating benefits of hydrogen storage equipment, and proposes a double-layer optimal configuration method that balances hydrogen production efficiency optimization.
The research findings of this paper will offer new insights and valuable guidance for future capacity allocation work in wind-PV-hydrogen microgrids. The main contributions of this paper are as follows:
  • In this paper, we optimize the power scheduling and allocation strategy to enhance the hydrogen production and system economic returns by fine-modeling the AEL and segmented linearized hydrogen production efficiency curves, and introducing the AEL life decay model into the hydrogen storage operation cost function;
  • To improve the wide power adaptability of the hydrogen production system, the system adopts electrolysis tanks of different power levels to form the MES, and proposes an optimized scheduling strategy based on GA, which, compared with the traditional power equalization strategy and Daisy-chain power allocation strategy, can improve the system economy while enhancing the efficiency of the system for hydrogen production, and achieve the reasonable distribution of AEL power and average the use of AEL’ loss, which provides a useful reference for the operation of MES in the actual large-scale off-grid wind power alkaline hydrogen production system;
  • In this paper, we propose a double-layer capacity allocation model considering the optimization of hydrogen production efficiency, where the inner layer optimizes the output power allocation of the AEL at each moment of a typical day to maximize the operating efficiency of the MES, and the outer layer optimizes the system’s maximum daily integrated net return, which reduces the capacity allocation cost of the system and significantly improves the economy and flexibility of the integrated wind-PV-hydrogen microgrid system.
The rest of this paper is organized as follows: Section 2 provides the capacity efficiency modeling of electrolyzer systems, while Section 3 provides a scene construction of wind-PV-hydrogen Integrated Microgrid System. Section 4 outlines the double-layer capacity allocation model. The results of the simulations are given in Section 5. Conclusions are drawn in Section 6.

2. AEL Modelling

2.1. AEL Operating Efficiency Model

Drawing on the electrolyzer standard adopted in Reference [31], and based on the working principle of the alkaline electrolyzer (AEL) as well as the relationship between hydrogen production and operating current density, this section models the operating efficiency of the AEL [33].
The formula for calculating the operating voltage of the electrolyzer is shown in Equation (1):
U i , t cell = U rev + k 1 i + k 2 l o g ( k 3 i + 1 ) U rev = a 1 a 2 K + a 3 K + a 4 K 2 K = T + 273.15
where U i , t cell represents the electrolyzer voltage at a specific current density i at time t; U rev represents the reversible voltage at moment t; T represents the operating temperature of the electrolyzer; K represents the thermodynamic temperature; a1, a2, and a3 represent empirical coefficients.
The operating power of the electrolyzer is:
P i , t EL = i U i , t cell A
where P i , t EL represents the operating power of the electrolyzer at the corresponding operating current density i at time t; A represents the membrane area of the electrolyzer.
The hydrogen production of the electrolyzer is:
h i , t = 3600 θ i , t F M H 2 i A 2 F
η i F = i 2 ( f 21 + f 21 T ) f 11 + f 12 T + i 2
where hi,t represents the amount of hydrogen produced at moment t; M H 2 represents the molar mass of hydrogen; θ i , t F represents the Faraday efficiency coefficient of the electrolyzer at the corresponding operating current density i at time t; f11, f12, f21, and f22 represent empirical factors [34].
The operating efficiency of the electrolyzer is:
η i , t EL = h i , t P i , t EL
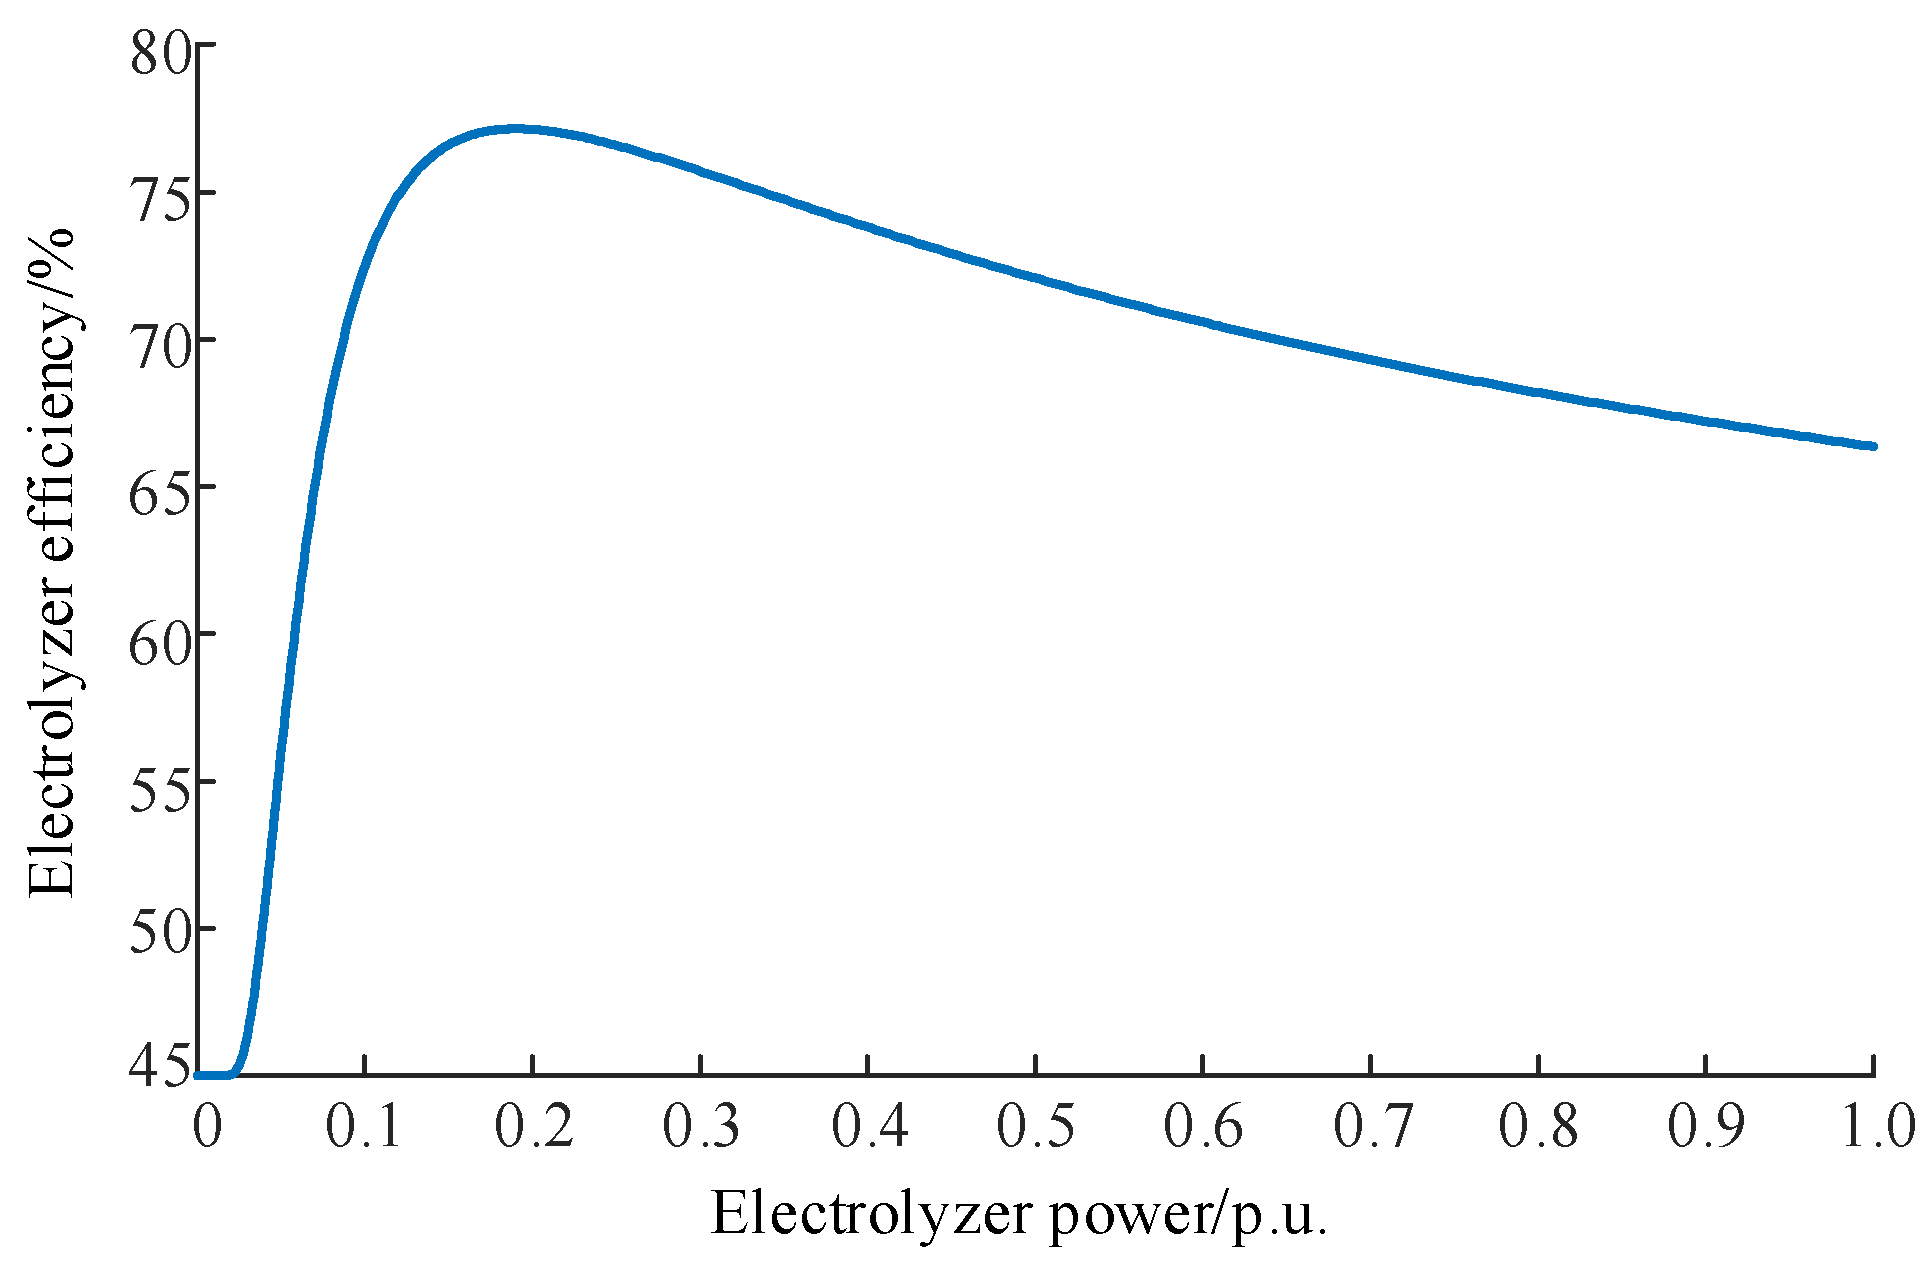
Equation (5) reflects the mathematical relationship between the input energy and output energy of the electrolyzer. By combining Equations (1)–(5) and conducting simulations in MATLAB 2020a, we can obtain the curve illustrating the variation of electrolyzer operating efficiency with output power, as presented in Figure 1. At low output power, the efficiency of the electrolyzer increases rapidly with increasing input power and decreases with increasing input power after reaching a maximum of about 0.18 per unit value. Therefore, the energy efficiency of the operation of the electrolyzer system is improved by rationally distributing the hydrogen production power of the electrolyzer so that the electrolyzer is operated in the power interval of higher efficiency.
The AEL operating efficiency is a non-linear equation, to improve the computational efficiency, segmented linearisation is used for the operational efficiency, Equation (6) represents the constraint between the actual AEL operating efficiency and the operating efficiency after segment linearization, and Equation (7) represents the operating efficiency of AEL after linearization can only be on one segment. Equation (8) represents the AEL power constraint under segment m.
η i , t EL = m 1 M η i , m , t EL Y i , m , t EL
m = 1 M Y i , m , t EL = 1  
m = 2 M P i , m 1 EL Y i , m , t EL P i , max EL < P i , t EL m = 1 M P i , m EL Y i , m , t EL P i , max EL

2.2. AEL Life Decay Model

The operation of the electrolytic cell will produce a certain life decay, the cur-rent research is mostly through the detection of the electrolytic cell voltage changes to characterize the life decay, it is difficult to accurately assess its life loss through mathematical models, when access to RE sources such as wind power, PV and other RE sources, the electrolytic cell operating power will fluctuate, so that its life decay accelerated. In addition, to maintain a constant hydrogen flow rate output, the system needs to maintain a stable electrolysis current by increasing the terminal voltage of the AEL, which indirectly increases the electrolysis power demand and reduces the electrolysis efficiency. The operation of the AEL will produce a certain amount of life decay, in this paper, AEL life decay assessment model is shown in Equations (9)–(13).
ε 1 , t EL = β 1 EL | P i , t EL P i , t 1 EL | / P i , max EL
ε 2 , t EL = β 2 EL ( S t o n + S t o f f )
ε EL = ( t = 1 ) T ( ε 1 , t EL Δ t + ε 2 , t EL )
N e q EL = ε EL / β r a t e EL
N r a t e EL = ( η r a t e EL η lim EL ) / β r a t e EL
where ε 1 , t EL , ε 2 , t EL represent the efficiency attenuation of the AEL during smooth operation and start-stop; ε EL , N e q EL represent the total AEL efficiency degradation and the total equivalent life degradation for one dispatch cycle of operation; N r a t e EL represents the rated operating life of the AEL.

3. Scene Construction

3.1. System Architecture

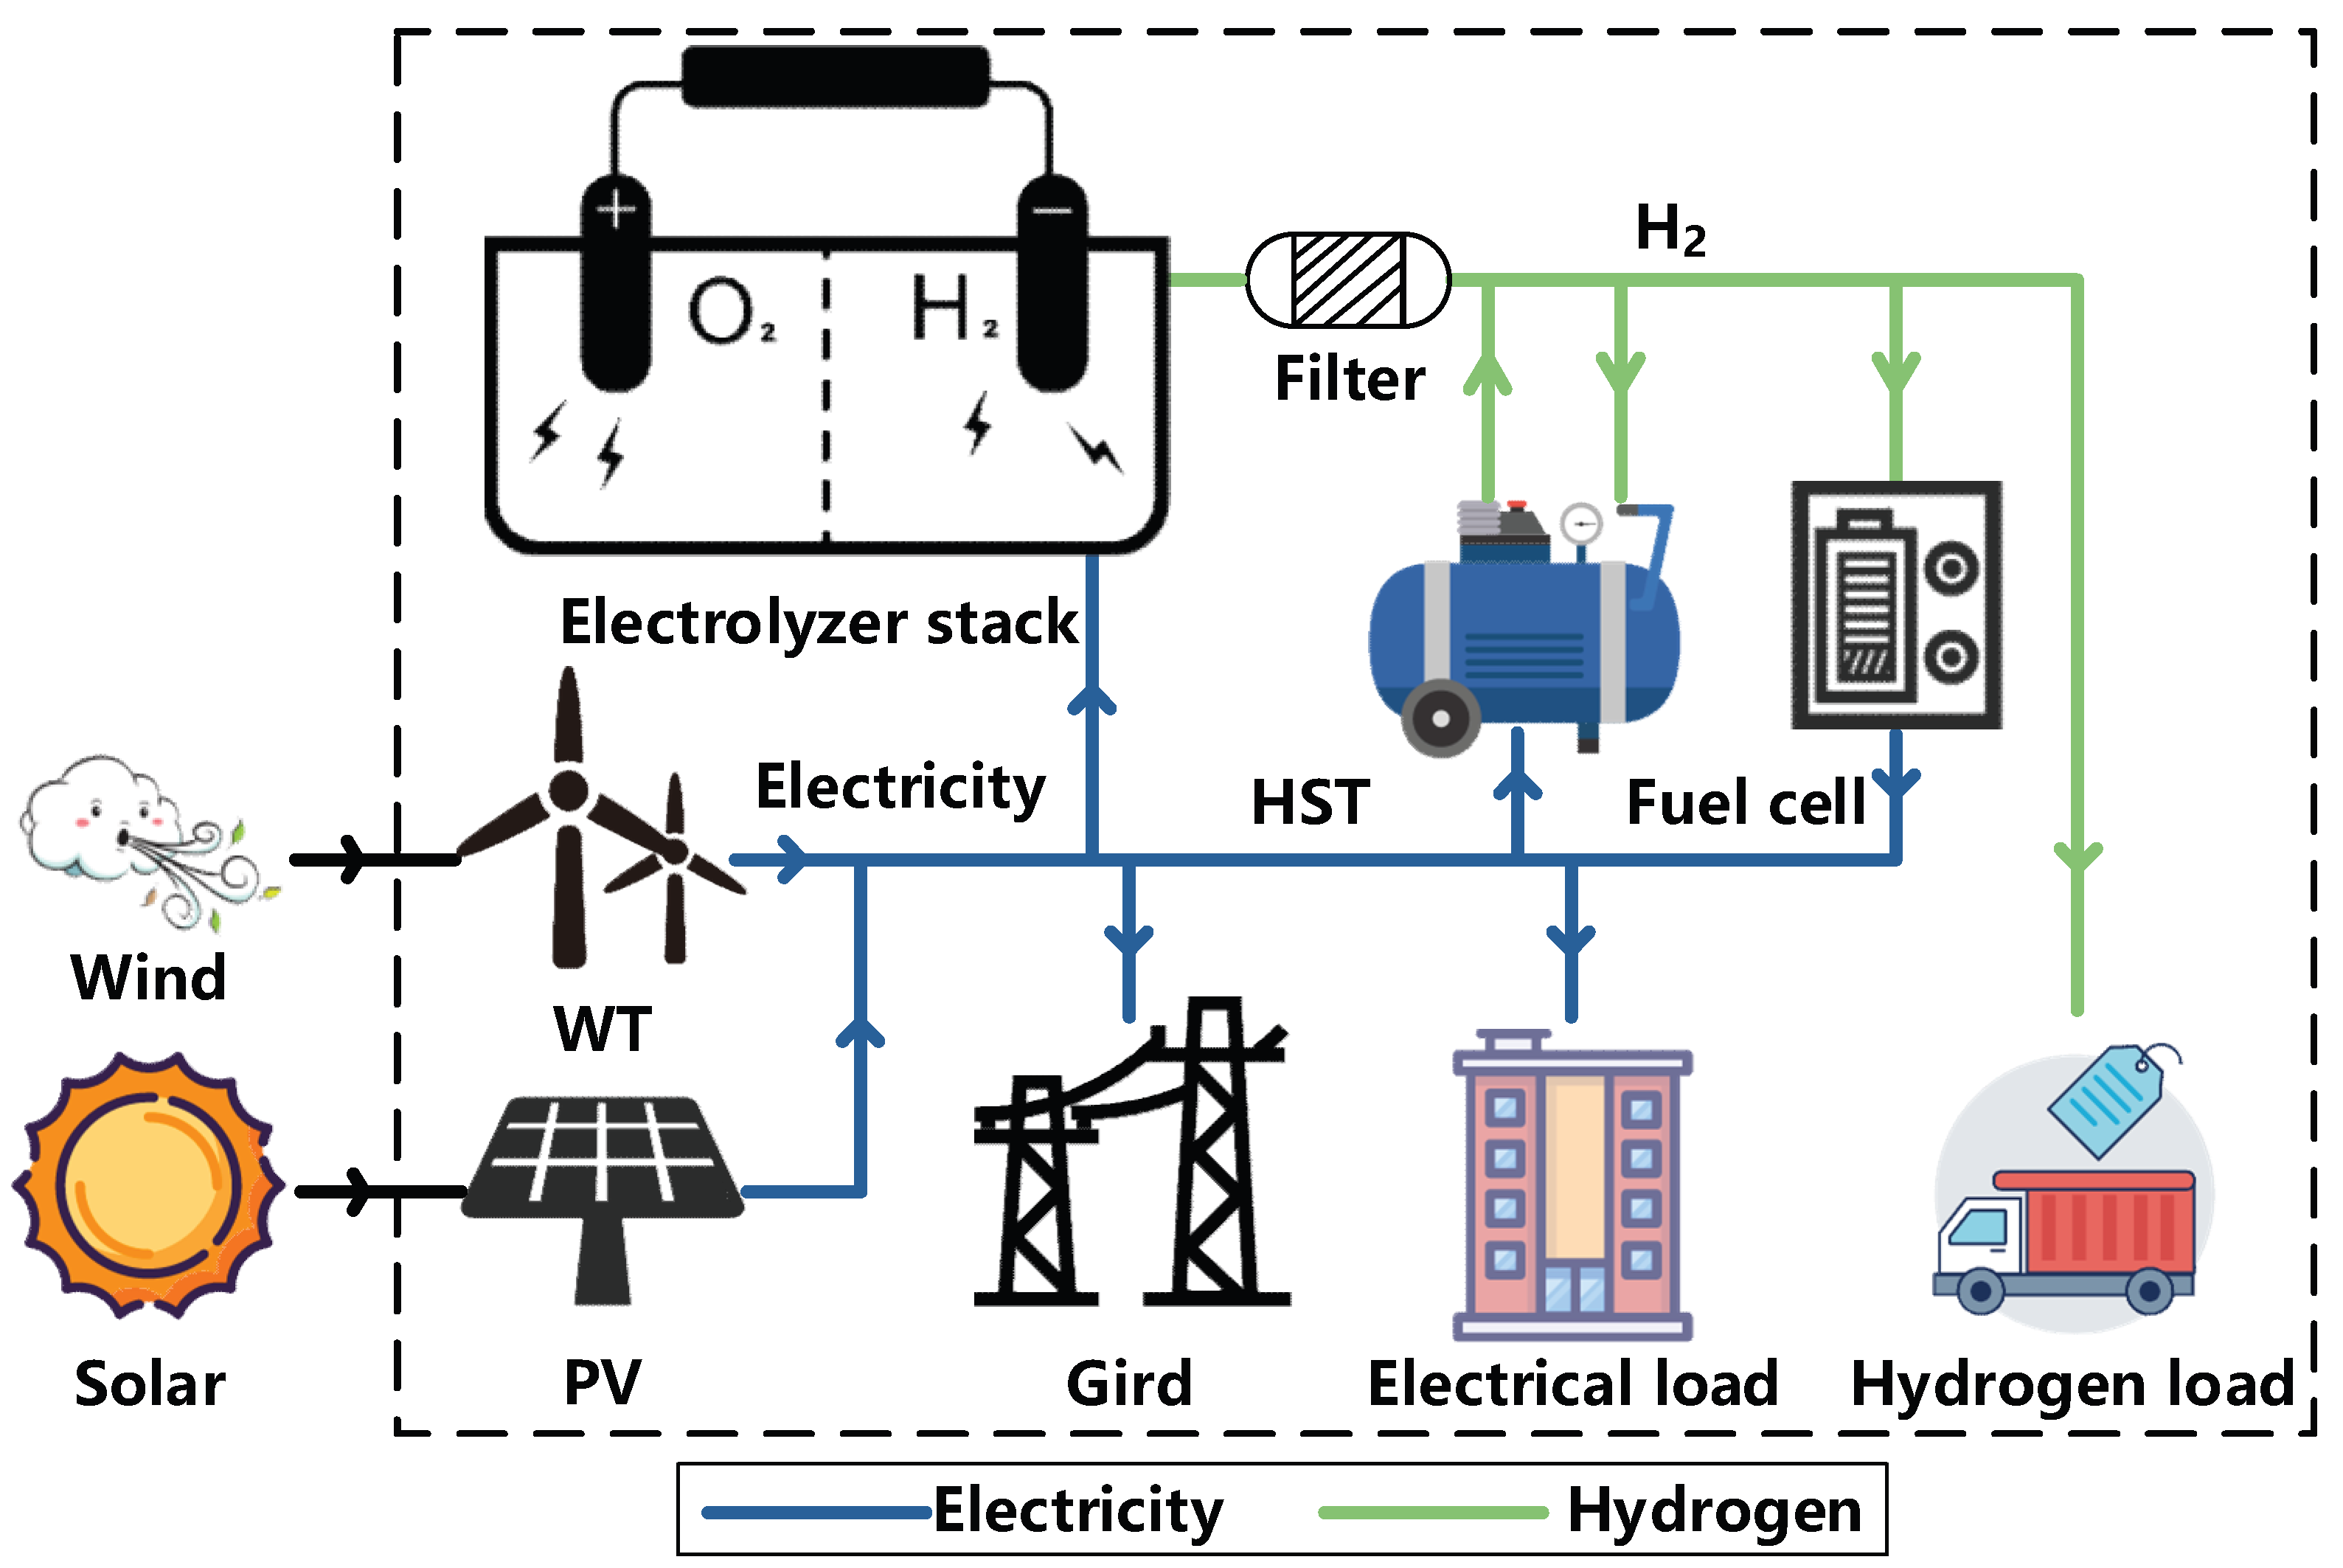
To realize the utilization of wind power and PV RE and the improvement of the efficiency of hydrogen storage equipment, this paper constructs a wind-PV-hydrogen integrated microgrid system, which consists of two parts: the RE power generation system and the HESS. The RE generation system includes wind turbines and PV arrays, and the hydrogen storage system includes AEL, FC, and HST, whose simplified structure is shown in Figure 2.
The wind-PV-hydrogen integrated microgrid system responds to the uncertainty of wind power, PV and load by real-time energy management, updating the power generated by wind turbines and PV arrays and the information on power load demand, and coordinating the output of electrolyzers and fuel cells. Hydrogen energy storage system absorbs power when renewable energy is sufficient and releases power when renewable energy output is low to maintain the normal operation of the microgrid. When the renewable energy unit generates surplus electricity, the electrolyzer uses the excess electricity to generate hydrogen, which is stored in the hydrogen storage equipment, realizing the “green electricity-green hydrogen” transformation; When the microgrid has a shortage of electricity or when the load peaks, the hydrogen fuel cell will convert hydrogen energy into electricity to make up for the power gap to meet the load demand, realizing the transformation of “Green Hydrogen-Green Electricity”. The integration of wind and solar power generation with hydrogen storage is beneficial in smoothing out the volatility of grid-connected power from renewable energy sources and supporting the consumption of a high percentage of wind and solar power.

3.2. RE Capacity Optimization Model

Optimizing installed wind and PV capacity by minimizing the total gap between RE sources and load, before optimizing the allocation of hydrogen storage capacity, the optimization ensures that the reserve capacity of RE is larger than the total load, regulates the mismatch between generation and load demand, and reduces the regulation pressure and investment cost of the hydrogen storage system. RE capacity optimization model is shown in Equations (14) and (15).
min f S 1 = t = 1 T P t L ( 1 + γ ) C W P t W C PV P t PV
t = 1 T C W P t W + C PV P t PV P t L ( 1 + γ ) 0 C W , C PV 0
where CW, CPV represent the installed capacity of wind power and PV; γ represents the RE reserve capacity factor; P t W , P t PV and P t L represent the load power, wind power, and PV power at moment t; T represents the annual optimized duration of RE, which is taken as 8760 h.

3.3. Typical Daily Data Generation for Wind and Photovoltaic

To avoid the problem of reduced accuracy due to the large amount of data to be processed for full-time simulation, in this paper, the K-means clustering method is selected to get the typical daily scenario of wind power and PV, and the raw data of wind power and PV output are normalized by great value, and K-means clustering method is selected to split the raw data of 12 months in a year into 8 classes of data clusters. Since the wind power and PV output is a skewed distribution, if the average value of the data is used as the typical scenario, it will produce extreme data leading to the distortion of the average, in this paper, the cumulative fluctuations of all the obtained scenarios are sorted to obtain the median, and the number of days opposite to the median is used as the typical day, which can reduce the influence of extreme data on the accuracy, and make the clustering of the typical day more convincing.

4. Double-Layer Optimal Configuration Model

4.1. MES Operational Efficiency Optimization Model

The control variables for the inner layer optimization operation are the output power values of each AEL for each period within a typical day, and the model takes the maximum MES operation efficiency as the optimization objective. In practice, power, operating conditions, and other factors will have an impact on the operating efficiency of the electrolysis tank, it is difficult to optimize the operating efficiency of all electrolysis tanks at the same time through a uniform value of power allocation, to further study the power output of each AEL when the MES is running at maximum efficiency, the objective function of the inner optimization model is defined as according to the efficiency characteristic curve of the AEL, taking the MES containing three electrolyzer as an example, see Equation (16) [35].
max f 1 = η MES = ( P 1 , t EL + P 2 , t EL + P 3 , t EL ) / ( P 1 , t EL η EL , 1 , t + P 2 , t EL η EL , 2 , t + P 3 , t EL η EL , 3 , t )
The constraints in the inner layer are the balance constraints of the electrolyzer, and the following hydrogen storage equipment operation strategy is set: when there is a surplus power within the microgrid system, the electrolyzer is allowed to produce hydrogen, and the fuel cell cannot discharge; when there is a power deficit, the fuel cell is allowed to discharge, and the electrolyzer is not allowed to produce hydrogen. Since there is energy loss in the hydrogen storage operation process, the operation state variables are set to constrain the equipment operation. When the electrolyzer is operated at low power, there is a risk of explosion of the resulting hydrogen-oxygen mixture and its performance is limited by the characteristics of the internal materials, so the electrolyzer must not be operated below a specific minimum threshold. This minimum power is usually 15% of the rated power of the electrolyzer. The established constraints for the operation strategy of the electrolyzer equipment are shown in the following equation:
y t EL + y t FC 1
y t EL δ ELmin C EL P t EL y t EL δ ELmax C EL
P t EL = i = 1 I P i , t EL
where y t EL represents the operating state variable of the electrolyzer; δ ELmax , δ ELmin represent the maximum and minimum output of the electrolyzer; I represents the number of electrolyzer runs.

4.2. Hydrogen Storage Capacity Allocation Model

The outer layer takes into account the economics of the microgrid system, and the optimal configurations of the electrolyzer, fuel cell, and hydrogen storage tank are used as optimized decision variables, the hydrogen storage capacity optimization allocation model was established with the maximum daily integrated net benefit of the microgrid system as the system capacity allocation evaluation objective:
max f 2 = I C INV C OM
where I represents the system’s daily consolidated return; CINV represents the daily investment cost; COM represents the daily operation and maintenance costs.
I = C SELL + C H 2 C BUY C BRE C HESS C WP
where CSELL represents the proceeds from the sale of electricity; C H 2 represents proceeds from the sale of hydrogen; CBUY represents the cost of purchased electricity; CBRE represents the cost of load interruption compensation; CHESS represents the cost of operating hydrogen energy storage system; CWP represents the wind and PV penalty charge.
C BUY = λ t BUY t = 1 24 P t BUY Δ t C SELL = λ t SELL t = 1 24 P t SELL Δ t
where λ t BUY represents the power purchase price of the system in period t; λ t SELL represents the price of electricity sold by the system in period t; P t BUY represents the purchased power of the system at period t; P t SELL represents the power sold by the system in period t; Δ t represents the time interval.
C BRE = t = 1 T K L P t L , pre P t L
where KL represents the load interruption compensation factor; P t L , pre , P t L represent the forecast demand and actual demand of the load at moment t.
Hydrogen energy storage generates a portion of energy conversion losses during operation and storage, and the cost of losses due to energy conversion should be considered in the optimization of the allocation, therefore, the operating cost of hydrogen energy storage includes loss cost and life decay cost:
C HESS = C HESS , loss + C HESS , life
C HESS , loss = γ ep t = 1 T P t EL ( 1 η t EL ) + P t FC ( 1 η t FC )
C HESS , life = ζ N e q EL
ζ = C INV , 3 / N r a t e EL
where CHESS,loss represents the cost of hydrogen energy storage losses; CHESS,life represents the lifetime decay cost of hydrogen storage; γep represents grid electricity prices; ζ represents electrolyzer depreciation factor.
C WP = C W + C PV
C W = t = 1 T K WP P t W , pre P t W
C PV = t = 1 T K WP P t PV , pre P t PV
where KWP represents the penalty factor for wind and PV abandonment; P t W , pre , P t W represent the predicted and actual output of the wind turbine at time t; P t PV , pre , P t PV represent the predicted and actual output of the PV array at time t.
C INV = i = 1 5 C INV , x r 1 + r m 1 + r m 1 / 365
C INV , x = C x e x
where CINV,x represents the investment cost of each piece of equipment C x represents the configured capacity of each piece of equipment; ex represents the cost per unit of capacity for each piece of equipment.
C OM = C INV ψ
where ψ represents the operation and maintenance cost factor.
The constraints of the outer problem are the operational constraints of the system, including the electric power balance constraints, the balance constraints of the hydrogen storage equipment, and the renewable energy operation constraints, as follows:
  • Electrical power balance constraints:
P t W + P t PV + P t FC + P t BUY = P t EL + P t L + P t SELL
2.
Power constraints in fuel cells:
y t FC δ FCmin C FC P t FC y t FC δ FCmax C FC
where y t FC represents the operating state variable of the fuel cell; δFCmin, δFCmax represent the maximum and minimum output of the fuel cell.
Constraints in hydrogen storage tank:
0 P t cha B t cha P cha _ max 0 P t dis B t dis P dis _ max m t HST = m t 1 HST + η t cha P t cha P t dis / η t dis B t cha + B t dis 1
where P t cha , P t dis represent the hydrogen storage and discharge power of the hydro-gen storage tank at time t; B t cha , B t dis represent the state variables of hydrogen storage and discharge; P cha _ max , P dis _ max represent the maximum and minimum hydrogen storage and discharge power of the hydrogen storage tank; m t HST , m t 1 HST represent the amount of hydrogen stored at moment t, t − 1; η t cha , η t dis represent the hydrogen storage and release efficiency of the hydrogen storage tank.
3.
Renewable energy unit operating constraints
0 P t W δ t W C W 0 P t PV δ t PV C PV
where δ t W , δ t PV represent the normalized power generation for wind power and PV.
4.
Purchasing and selling electricity constraints
0 P t buy α t buy P max gird 0 P t sell α t sell P max gird α t buy + α t sell 1
where α t buy , α t sell represent state variables for power purchase and sell; P max gird represents the upper limit of transmission line power.

4.3. Model Solution

In the scenario construction phase, the installed renewable energy capacity is first optimized to minimize the total gap between renewable energy and load, which is solved by Matlab CPLEX solver; Typical daily data for wind power and PV are generated by K-means clustering algorithm.
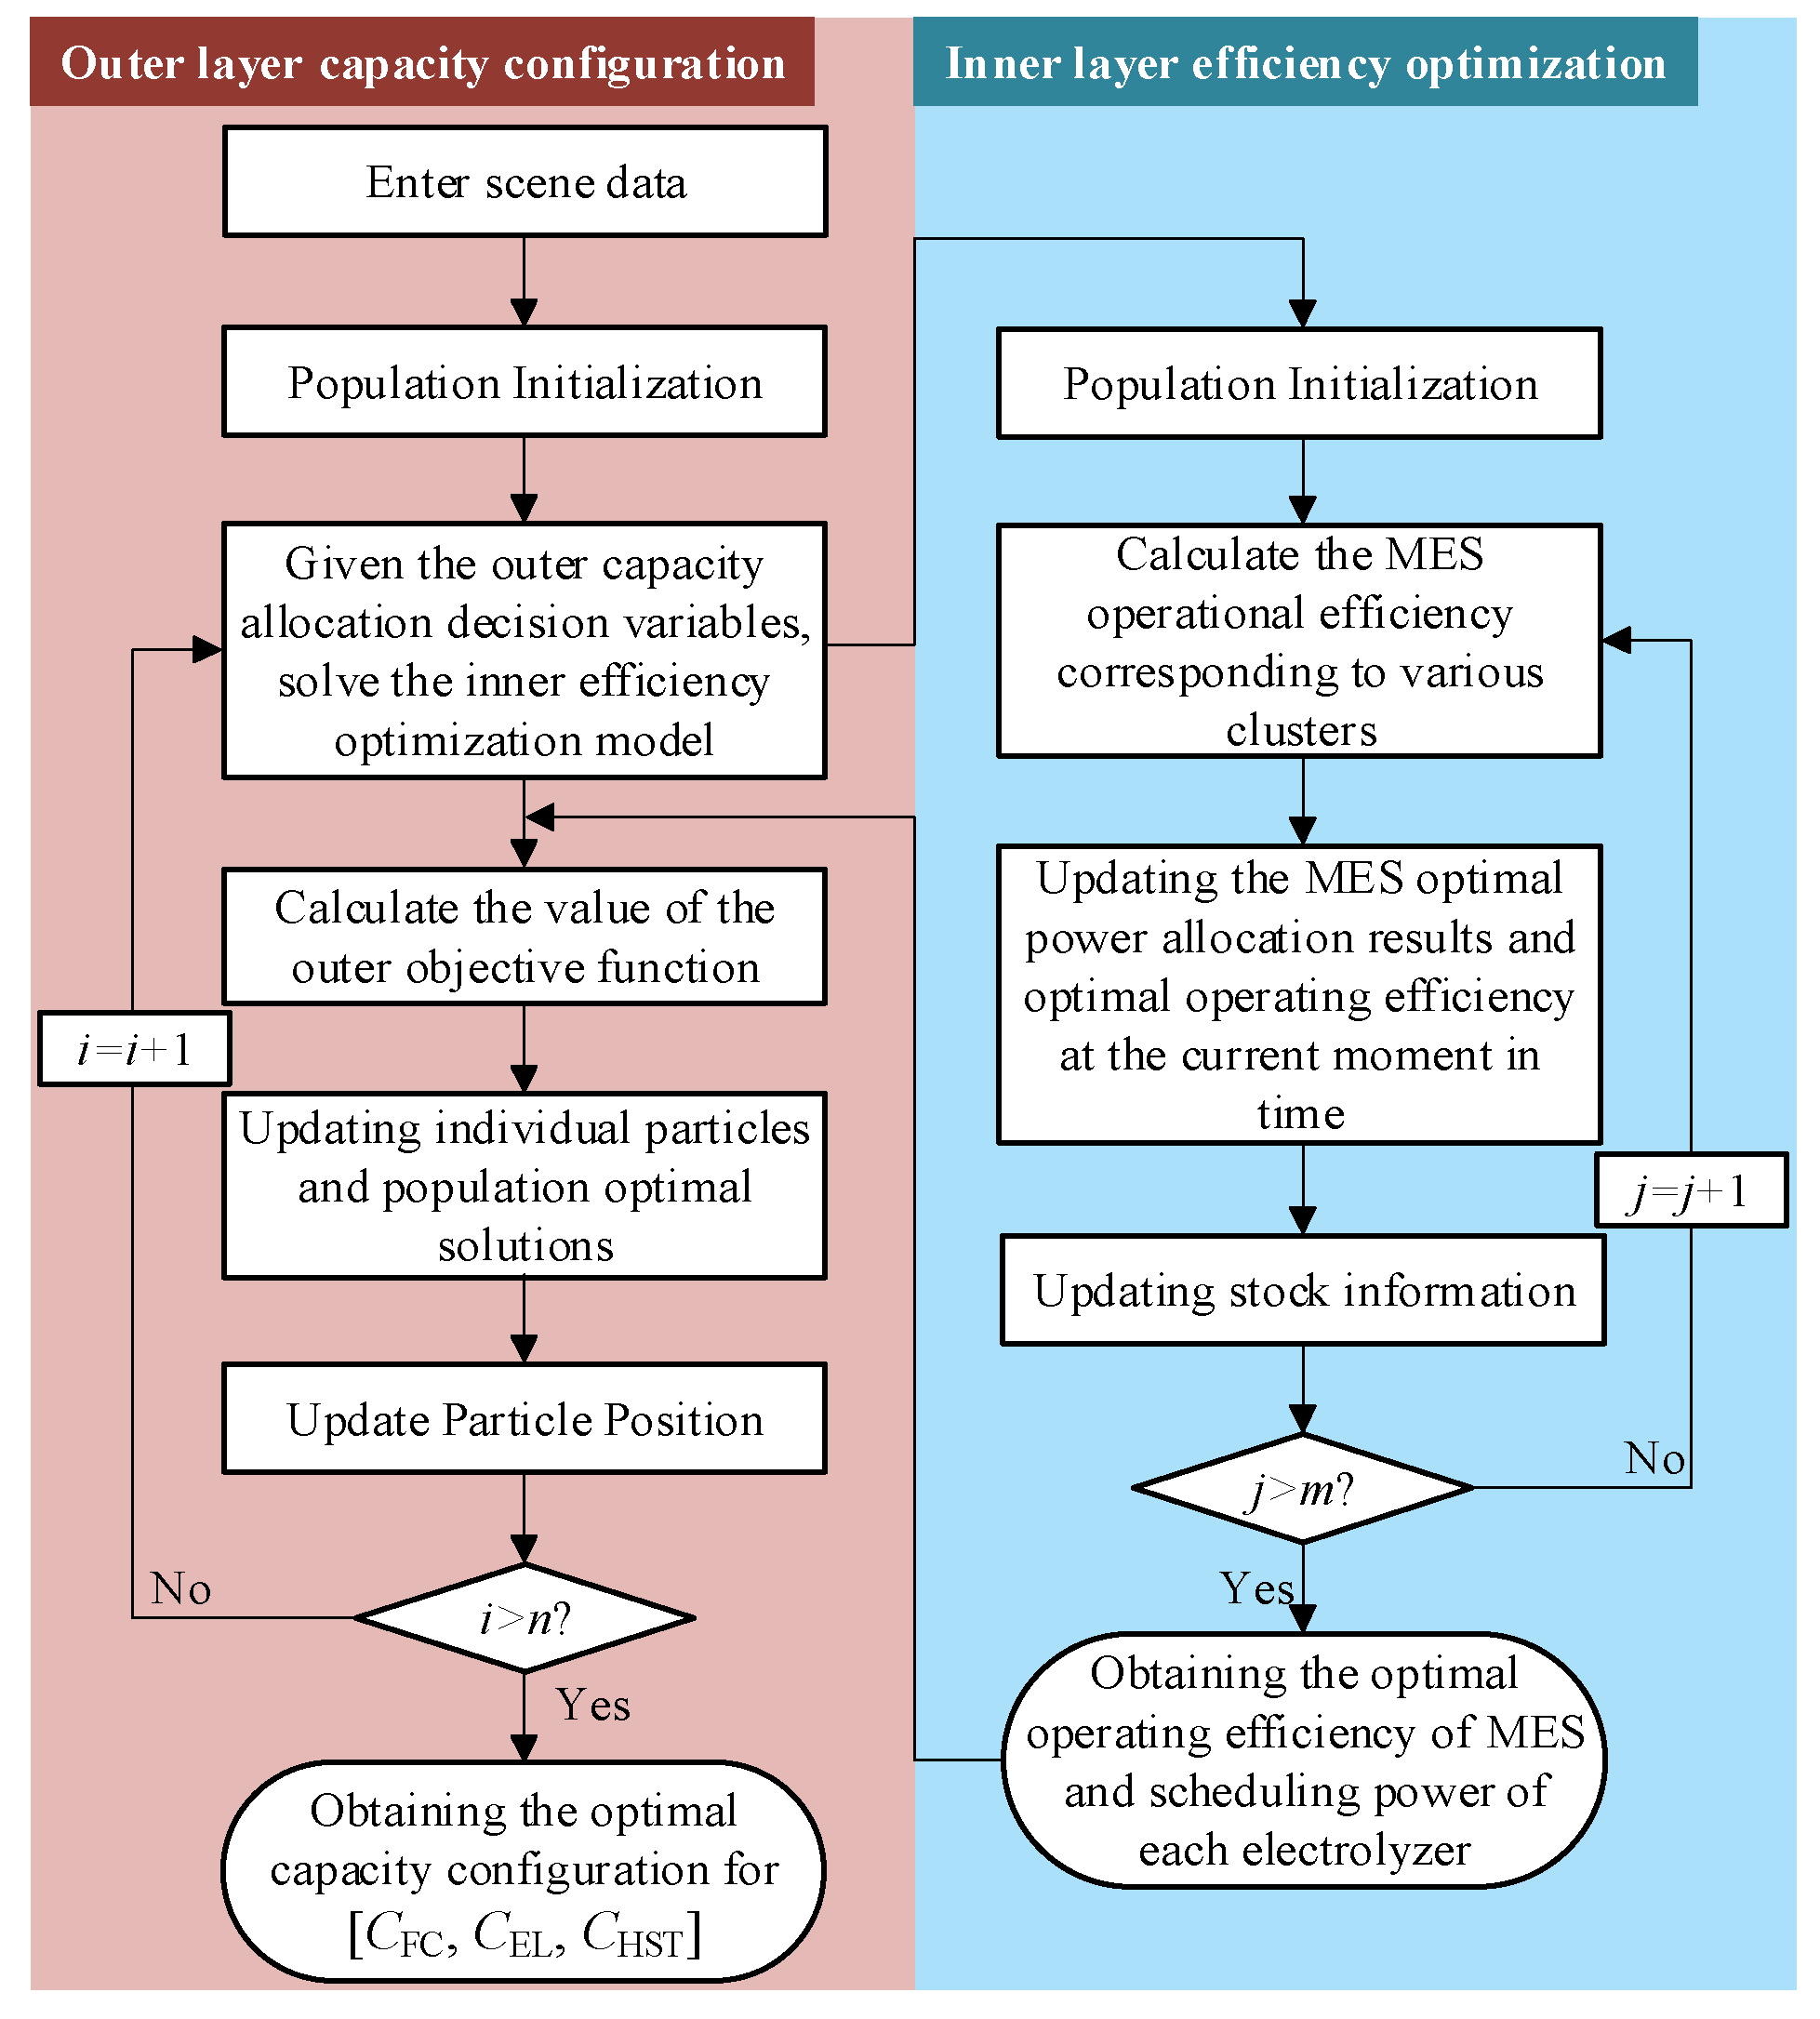
In the construction and solution stage of the double-layer capacity allocation model, the inner layer adopts the GA algorithm, which carries out a reasonable allocation of power among multiple electrolysis tanks by its advantage of strong global searching ability to achieve the optimization goal of maximum MES operation efficiency; The outer layer uses the optimal configurations of the electrolyzer, fuel cell and hydrogen storage tanks as decision variables to maximize the combined daily net gain of the system, which can be solved using the PSO algorithm. The results of the double-layer capacity allocation models interact with each other, and the flowchart for solving the double-layer capacity allocation model is shown in Figure 3.

5. Case Studies

5.1. Data Input

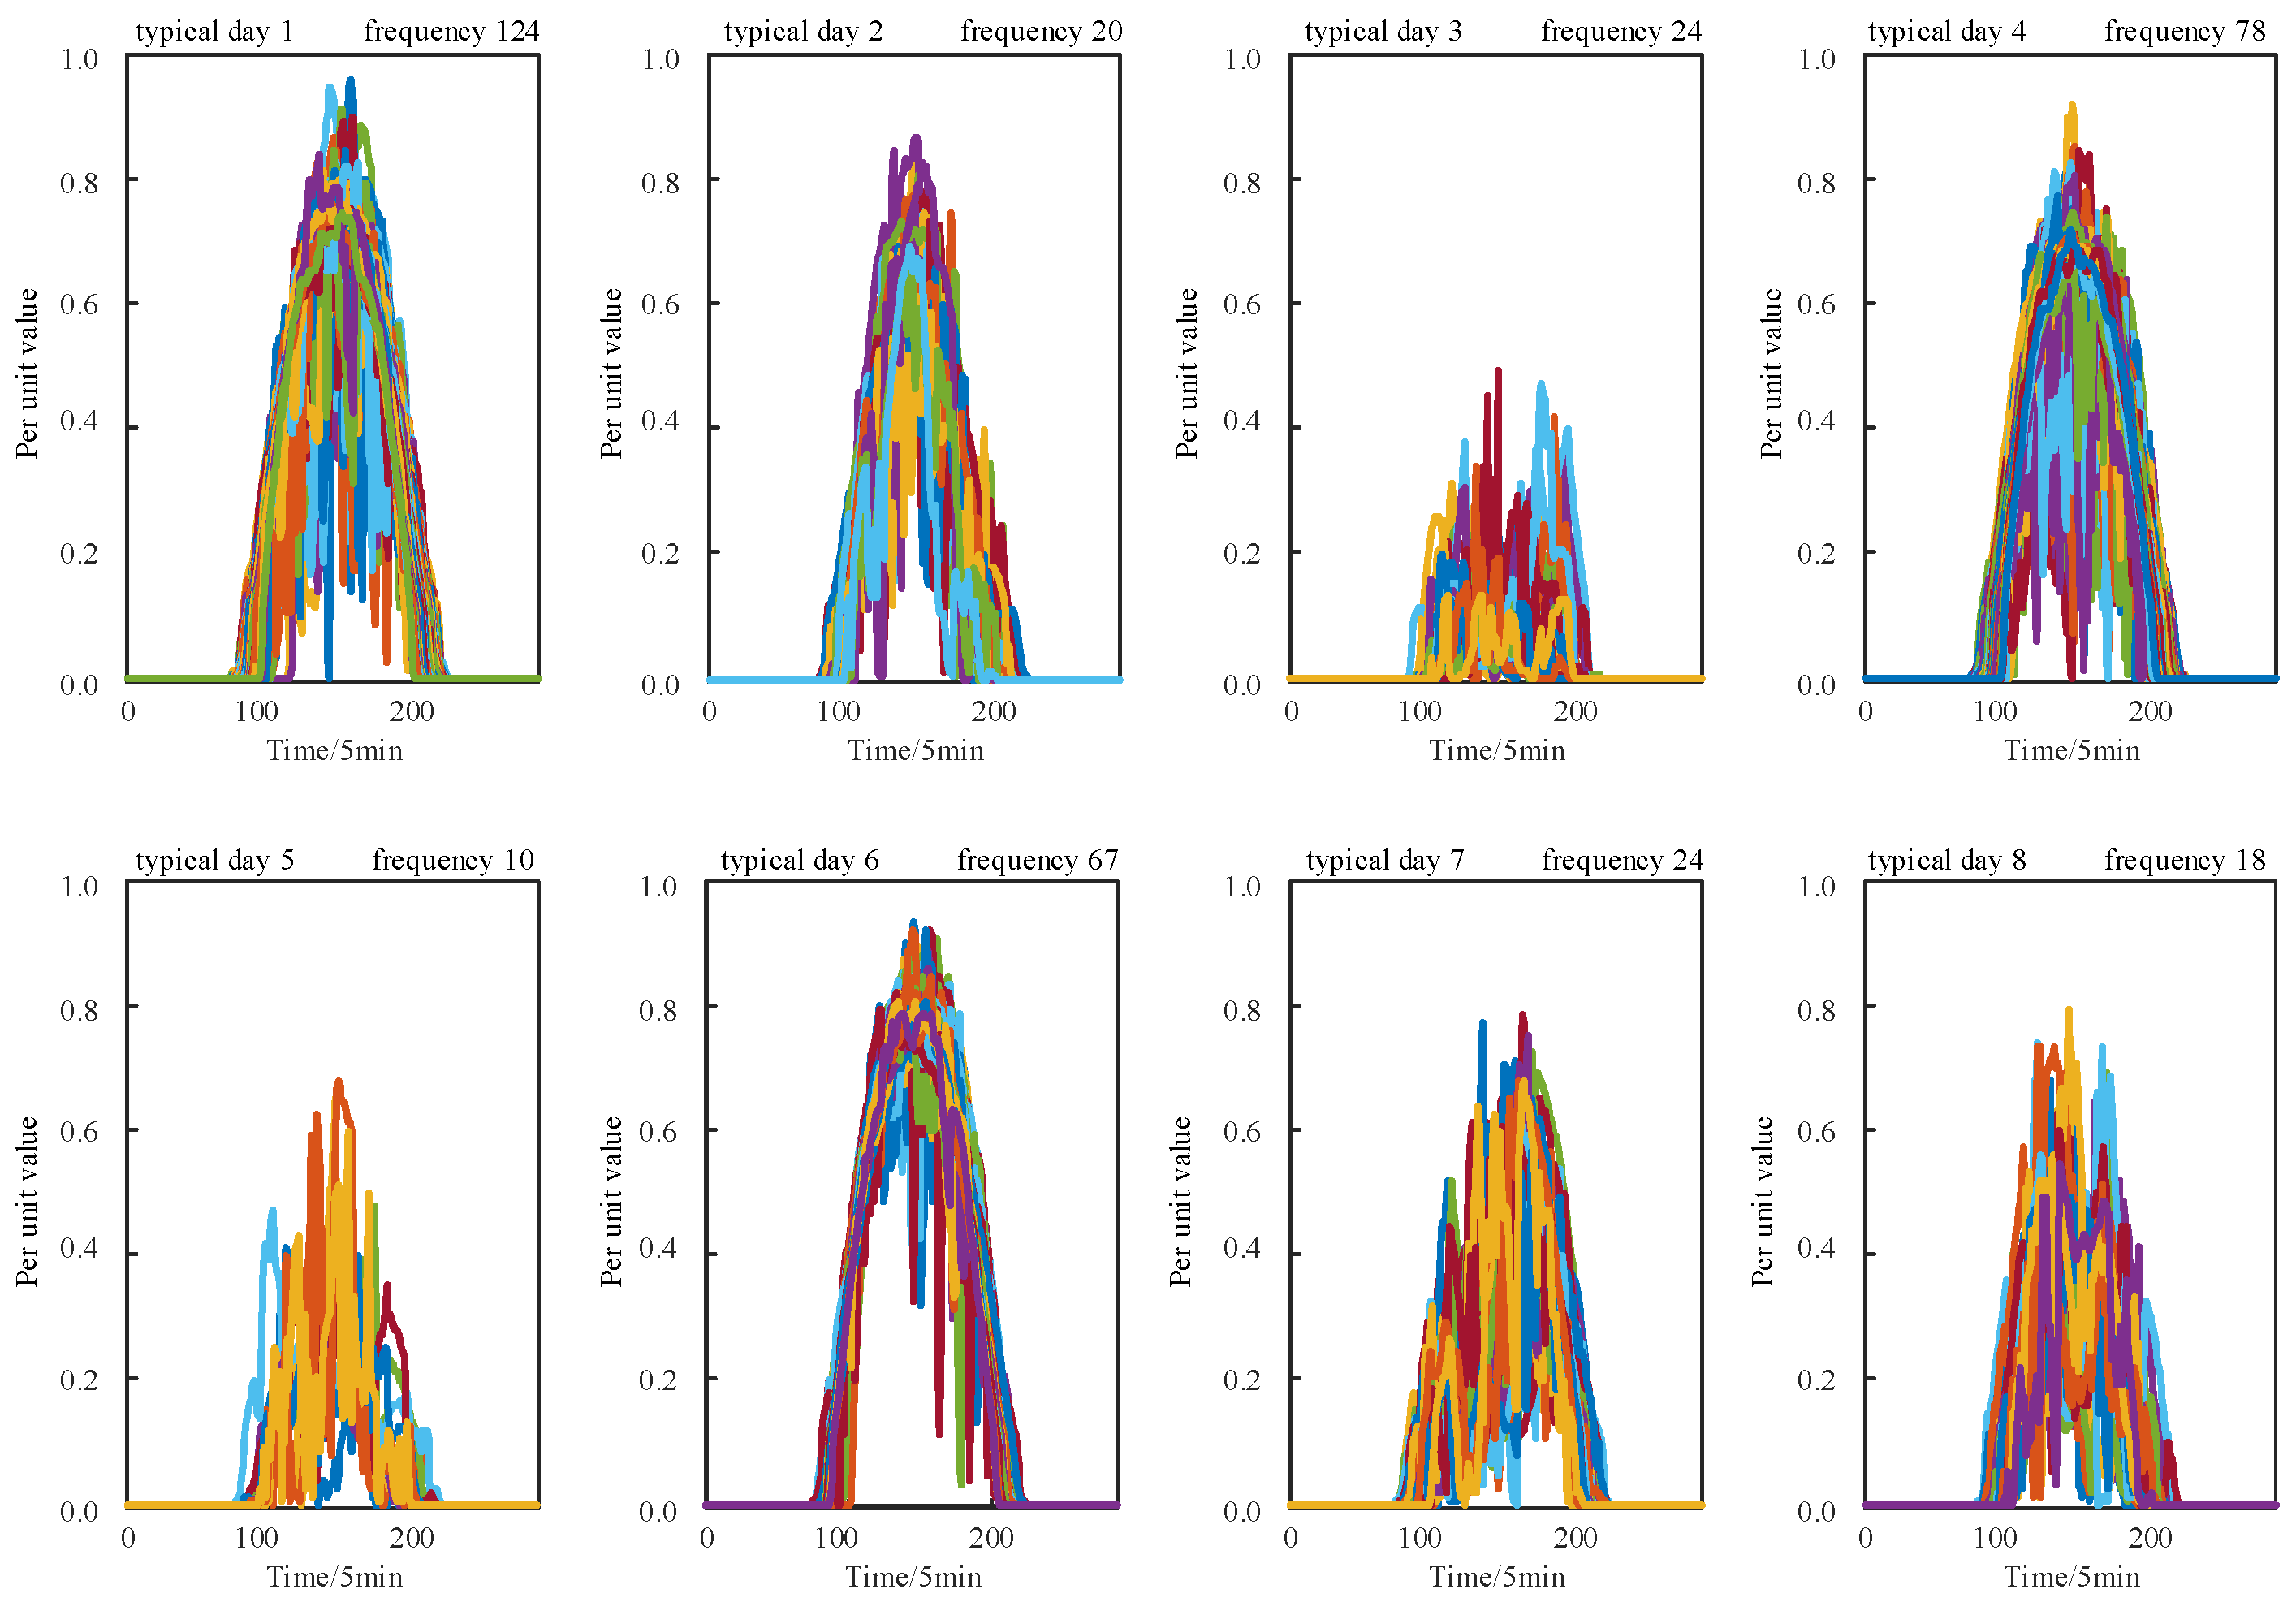
In this paper, a wind-PV-hydrogen demonstration project in Jiangsu Province, based on data for simulation, 5 min for a point to collect the local annual wind size and PV radiation intensity and standardized, resulting in the annual wind power, PV normalization curve shown in Appendix A Figure A1. To minimize the total net load, the optimal wind and PV capacities obtained by solving the optimization are 1.52 MW and 1.87 MW. The K-means algorithm is used to cluster the wind and PV power data throughout the year, from which eight typical scenarios for wind and PV and the number of days of occurrence can be obtained as shown in Appendix A Figure A2 and Figure A3. The system economic parameters, time-sharing tariff, hydrogen prices, and optimization parameters are shown in Table 2, Table 3 and Table 4.

5.2. Comparative Analysis of Optimized Configuration Results

To evaluate the effectiveness of the proposed configuration model, the following three scenarios are set up for comparative analysis: Case 1 involves a configuration where all electrolyzers operate at a fixed efficiency, and the configuration for multi-electrolyzer operation is not considered. Case 2 is a configuration that incorporates multi-electrolyzer operation, yet the electrolyzers still operate at a fixed efficiency. Case 3 adopts a configuration with multi-stack electrolyzers, while also taking into account the lifespan degradation of electrolyzers and their optimized operation for efficiency. The results of the optimized configuration under the three scenarios are shown in Table 5.
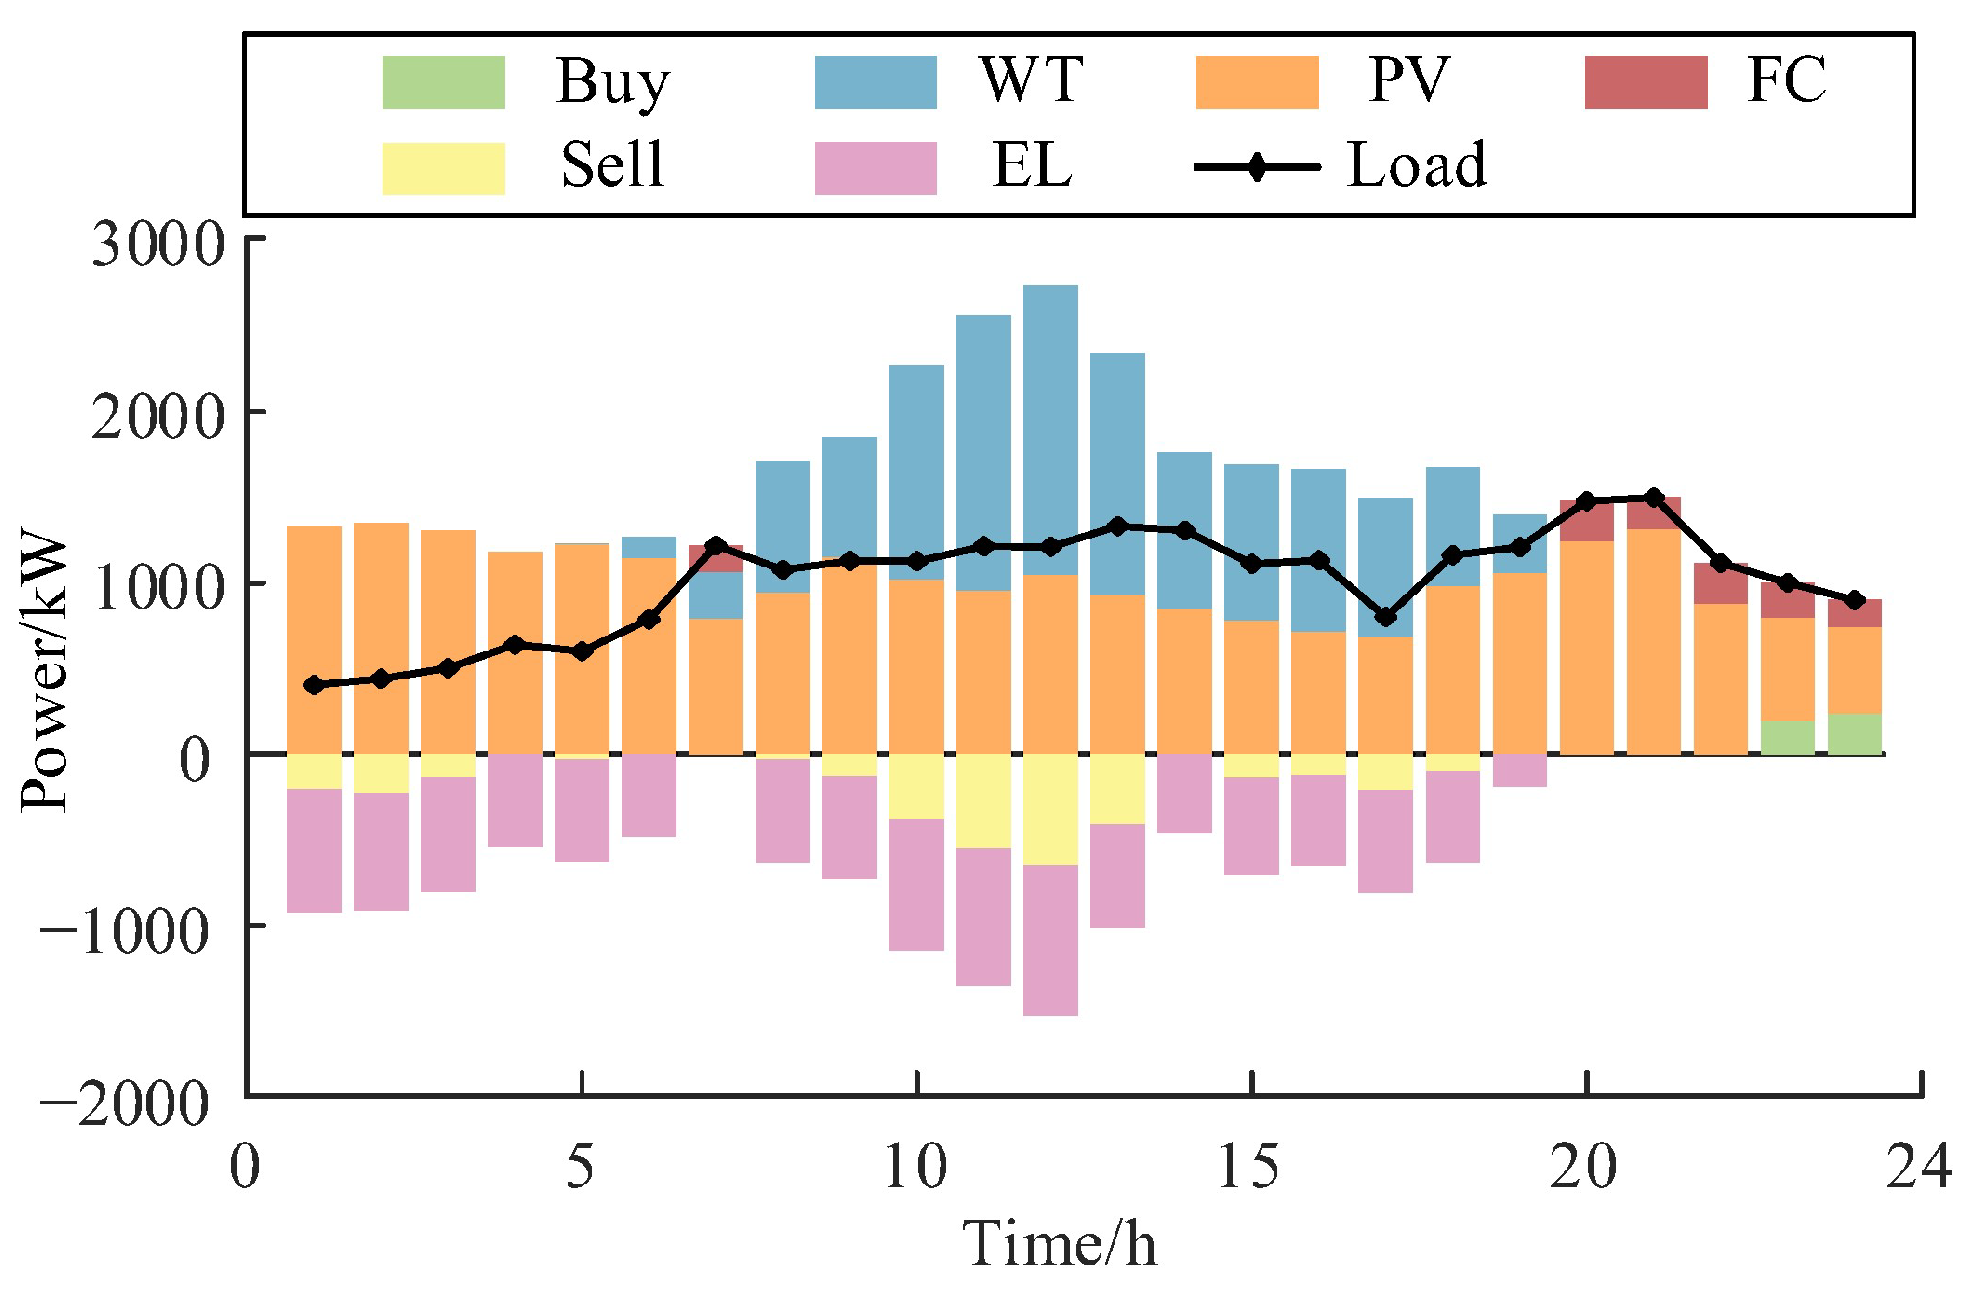
The results of the electric power balance for a typical day 6 with different strategies are shown in Figure 4 and Figure 5. As can be seen from Figure 4, during the operation of the system, compared to Case1 mainly the MES consumes excess renewable energy power to produce hydrogen, and to sell as much power as possible to the grid for profit under the premise of meeting the demand for hydrogen production in the electrolyzer.
As shown in Table 5, Case 1 operates with a single electrolyzer. Its low hydrogen production efficiency necessitates a larger electrolyzer capacity, thereby reducing the system’s daily comprehensive revenue. In contrast, a MES composed of multiple small–capacity electrolyzer units demonstrates superior operational scheduling capabilities, facilitating improved system operating revenue. To verify how MES operating efficiency influences the system’s capacity configuration, Case 2 and Case 3 were comparatively analyzed, with their power and energy balance results under typical day presented in Figure 4 and Figure 5. The system’s configuration strategy dictates that during peak–price periods, the microgrid prioritizes direct electricity sales for profit, while during valley–price periods, more electricity is allocated to electrolyzers for hydrogen production.
From Figure 4 and Figure 5, surplus power exists in the system during 0–6 h and 8–19 h of the typical day, which is directed to electrolyzers for surplus electricity–to–hydrogen conversion. While satisfying the electrolyzers’ hydrogen production requirements, maximum electricity is sold to the grid to optimize profits. Comparing Figure 3 and Figure 4 reveals that Case 3, leveraging the proposed MES efficiency optimization method, enhances hydrogen production efficiency. Under the identical wind-PV-load scenario, electrolyzers achieve the hydrogen production target with less electricity consumption, reducing the electrolyzer capacity by 12.86%. This not only cuts down the system’s configuration costs but also enables more surplus electricity to be sold, boosting revenue. Moreover, as Case 3 accounts for electrolyzer lifetime degradation, Figure 5 illustrates a more uniform distribution of electrolyzer hydrogen production power within a dispatch cycle, aiding in identifying and maintaining the MES’s optimal operating efficiency state.

5.3. Simulation Validation of the Proposed Efficiency Optimization Strategy

To further analyze the effectiveness of the proposed MES operation efficiency optimization method, based on the optimal configuration of Case3, alkaline electrolytic cells with different power ratings of 300 kW, 290 kW, and 320 kW were selected and the following three electrolytic cell operation strategies were set up to be verified by simulation:
  • strategy1: Daisy chained power allocation strategy. MES will be numbered and sorted, and started in sequence according to the serial number, when the system surplus power is greater than the rated operating power of electrolyzer 1, electrolyzer 2 will be started to dissipate the remaining system power, and so on, to realize the power dissipation of renewable energy units [18].
  • strategy2: Power equalization strategy. The system power is divided equally among the electrolyzer equipment according to the principle of equal distribution [30].
  • strategy3: The efficiency optimization method based on GA is proposed in this paper.
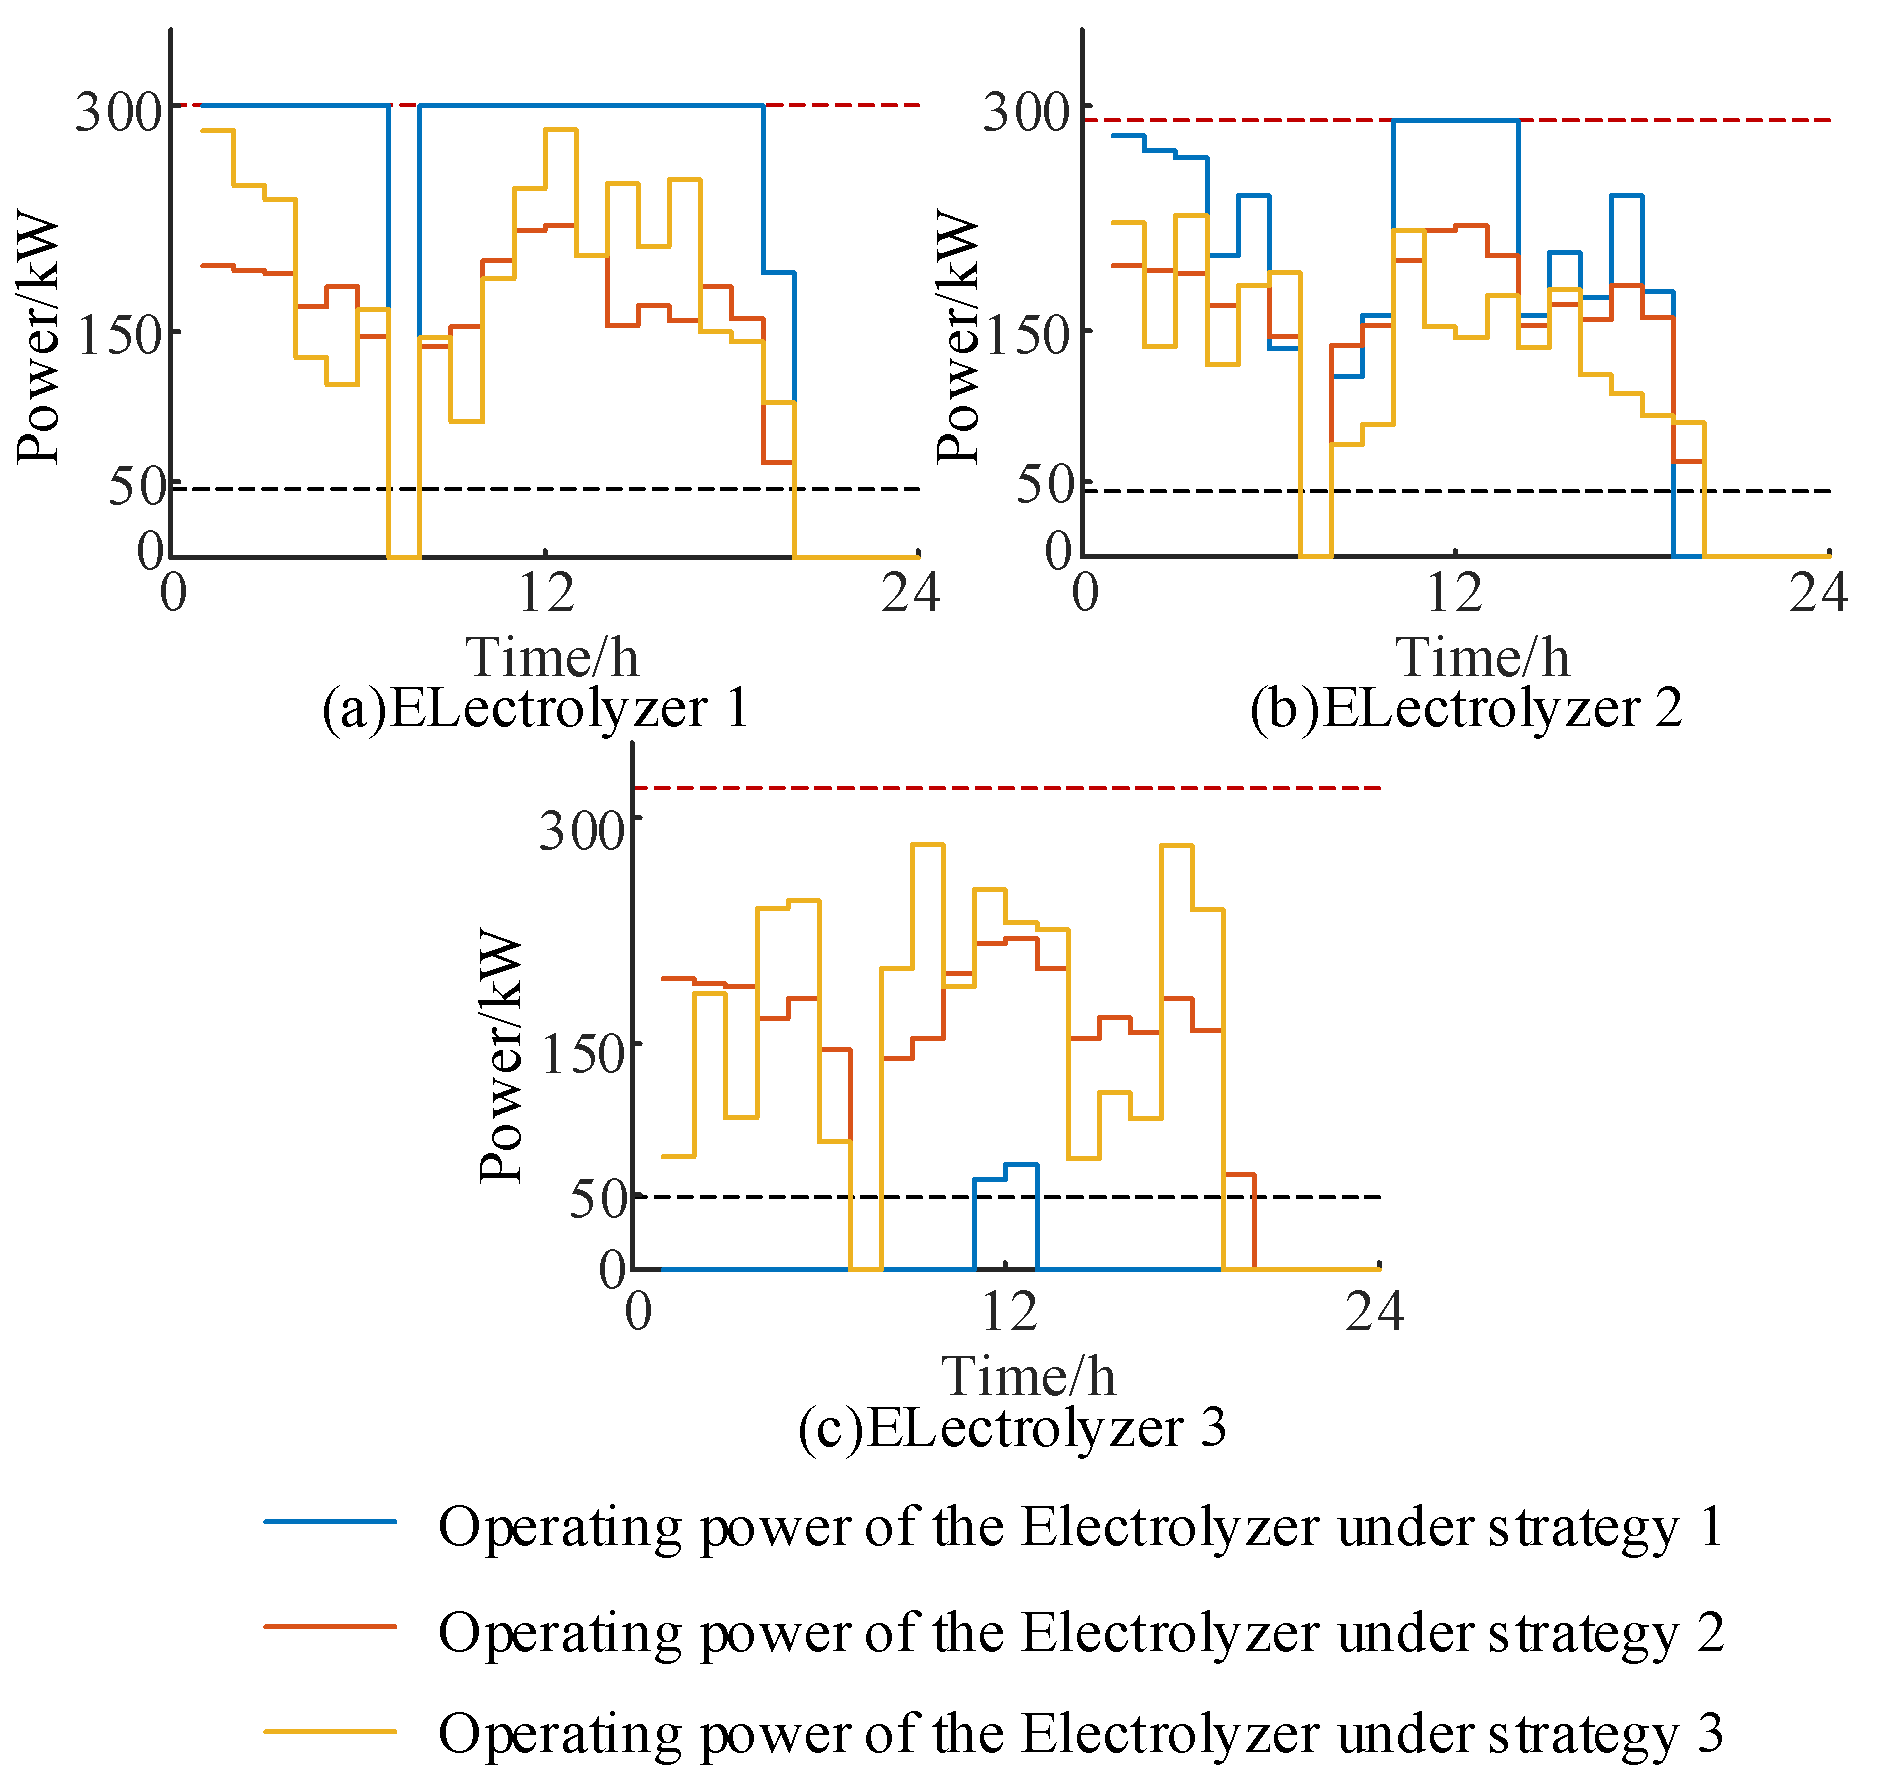
The results of the operation of each equipment of MES under a typical day 6 with different operation strategies are shown in Figure 6. The electrolyzer is sequentially scheduled under strategy 1, under which electrolyzer 1 is operated at rated power for a long period, under which the operating efficiency of the electrolyzer is not at a preferred level, and electrolyzer 3 is shut down for a long period and is operated at low power for only two periods of time, 11–12, with an unbalanced utilization rate of the electrolyzer, which leads to an increase in the operating cost of the system.
Figure 7 shows the results of MES operation efficiency with different power allocation strategies. When using power equalization and daisy chain power allocation methods to allocate power to hydrogen storage equipment, the power output of each electrolyzer within the MES is simply allocated based on system power only, without considering the overall operational efficiency, In actual operation, the operating efficiencies of the MES are all lower than the strategy proposed in this paper, resulting in the MES needing to consume more electrical energy to produce the same quality of hydrogen, all leading to an increase in the cost of hydrogen production in the system. Under the daisy chain power allocation method, the improvement of system efficiency is more significant for the operation in the low power interval, but with the increase of system power, after the equipment is started up step by step, the method is less effective for the improvement of efficiency, and due to the long-term use of the electrolyzer 1 to run at the rated power, which is prone to cause the loss of the equipment service life, which is not conducive to the stable operation of the hydrogen energy storage system. When operating with a power equalization strategy, the output power of the three equipment is the same, which tends to result in very low efficiency when the power to be dissipated is low.
The method proposed in this paper is to optimize the hydrogen production power of the electrolyzer equipment in real time using GA algorithms with the overall efficiency of the MES as the goal, to maintain the operation at the optimal efficiency point of the MES. As can be seen from Table 6, under the optimization of the strategy proposed in this paper, the operational efficiency of MES is significantly improved, which is 6.29% and 4.77% compared with Case1 and Case2, which verifies the reasonableness of the strategy proposed in this paper for the optimization of the operational efficiency of hydrogen energy storage system.
All the three strategies started to run at 50% of the initial capacity of the hydrogen storage tank, and as shown in Table 6, the hydrogen production of the MES for the three strategies after 24 h of operation was 125.73 kg, 128.13 kg, and 139.56 kg, in the case of meeting the discharge demand of the FC in the system, the excess hydrogen is sold for arbitrage, maintaining the capacity of the hydrogen storage tank in a stable state and improving the economic operation of the system. The method proposed in this paper optimizes the operating efficiency of the electrolyzer system in real-time, which has obvious advantages in improving both the operating efficiency of the electrolyzer and the amount of hydrogen production.

5.4. Sensitivity Analysis

From the above analysis, it can be seen that Case 3 can not only improve the operating efficiency of the electrolyzer system and optimize the output of each equipment, but also effectively improve the system economy so that the system can maximize the comprehensive benefits during the 24-h dispatch cycle. This section analyzes the impact of the configuration of the electrolyzer and fuel cell and the dispensing and hydrogen storage tanks on the combined daily gross revenue to further validate the economics of the Option 3 configuration results. The results of the sensitivity analysis are shown in Figure 8 and Figure 9.
As can be seen from Figure 8, when the optimal configuration of the electrolyzer and fuel cell is too small, it is not conducive to the normal operation of the system, which leads to a large number of electric purchases or abandonment of wind and PV in the system, which in turn affects the economic situation of the system, the phenomenon is most obvious when the electrolyzer capacity is configured too small and the fuel cell is configured too large. When both configuration capacities are large, over-allocation occurs, resulting in a gradual decline in the system’s daily combined net return beginning, which is not conducive to the system reaching eco-nomic optimization. Therefore, to make the system economically optimal, the capacity of both needs to be adjusted, where option 3 achieves the best capacity configuration for this device.
In the above wind-PV-hydrogen integrated microgrid system, the in-stalled capacity of the hydrogen storage equipment is related to the operating cost of the system, which in turn affects the comprehensive revenue of the whole system. As can be seen in Figure 9, the configured capacity of the electrolyzer and the configured capacity of the hydrogen storage tank show a similar positive proportional growth relationship, and when the configured capacity of the electrolyzer and the hydrogen storage tank are not appropriate, it will be accompanied by the emergence of abandoned/shortfalls of energy, which will lead to a lower comprehensive daily net gain of the system. After arriving at the configuration result of Case 3, only increasing the electrolyzer capacity will result in the hydrogen storage unit not being able to consume too much hydrogen to utilize the hydrogen sales arbitrage, and will be affected by the cost of the electrolyzer configuration, making the daily consolidated net income gradually decrease, which verifies the reasonableness of the configuration result of Case 3.

6. Conclusions

To improve the hydrogen production efficiency, the renewable energy consumption capacity, and the comprehensive benefits of system operation of the integrated wind-PV-hydrogen system, in this paper, proposes a double-layer capacity optimization configuration method considering MES operation efficiency, and launch the system optimization configuration research with typical scenarios, and get the following conclusions:
  • Combined with case studies showing better operational scheduling capabilities using an MES consisting of multiple small-capacity electrolyzer, the double-layer capacity optimization allocation method proposed in this paper reduces the allocation cost of MES by 12.86% through operational efficiency optimization, which can enhance the economy and flexibility of the wind-PV-hydrogen integrated microgrid system.
  • The operation method proposed in this paper considering the efficiency improvement of MES makes MES more flexible and efficient in consuming renewable energy by rationally adjusting the operation power allocation of multiple electrolyzers, compared with the traditional power equalization strategy and daisy chain power distribution strategy, the efficiency is improved by 4.91% and 6.39%, and the cost of hydrogen production is reduced by 5.37% and 6.67%, which avoids the electrolyzer from operating in a low-efficiency and high-power state, and achieves the maximum utilization of renewable energy.
  • After considering the life decay cost of the electrolyzer equipment, it makes the operation of MES smoother in a dispatch cycle, which can reduce the impact of the life decay of the electrolyzer equipment on the daily comprehensive income of the system, which is conducive to the long-term economic benefits of the wind-PV-hydrogen integrated microgrid system.
This study does not account for the start-stop constraints of electrolyzers or their dynamic efficiency characteristics, which results in limitations in the characterization of electrolyzer operating behavior. In our future work, we will conduct in-depth research on these characteristics and integrate the model predictive control (MPC) method to address the model’s limitations under dynamic load conditions. This will enable more accurate capacity configuration for wind-PV-hydrogen microgrid systems, thereby enhancing the flexibility and economic efficiency of the water electrolysis for hydrogen production process.

Author Contributions

Conceptualization, J.L. and Z.S.; methodology, J.L.; software, Z.S.; validation, Z.S., Y.Q. and X.J.; formal analysis, X.J.; investigation, Z.S.; resources, J.L.; data curation, Z.S.; writing—original draft preparation, Z.S.; writing—review and editing, Z.S.; visualization, Y.Q.; supervision, Z.S.; project administration, Z.S.; funding acquisition, J.L. All authors have read and agreed to the published version of the manuscript.

Funding

This research was funded by State Key Laboratory of Power System Operation and Control (SKLD24KZ03) and the National Nature Foundation of China (52277211).

Data Availability Statement

Data are contained within the article.

Conflicts of Interest

The authors declare no conflict of interest.

Abbreviations

The following abbreviations are used in this manuscript:
MESMulti-stack electrolyzer systems
GAGenetic algorithm
PSOParticle swarm optimization
HESSHydrogen energy storage system
PVPhotovoltaic
GGrid
RERenewable energy
AELAlkaline electrolyzer
FCFuel cell
HSTHydrogen storage tank
O&MOperation and maintenance
MOMFAMulti-objective modified firefly algorithm
LCOELevelized cost of energy
LPSPLoss of power supply possibility
PARPower abandonment rate
ABCArtificial Bee Colony algorithm
EAEvolutionary algorithm

Appendix A

Figure A1. Normalized curves for wind and PV for the whole year.
Modelling 06 00101 g0a1
Figure A2. Typical Scenario Output for Wind Power.
Modelling 06 00101 g0a2
Figure A3. Typical PV scenario output.
Modelling 06 00101 g0a3
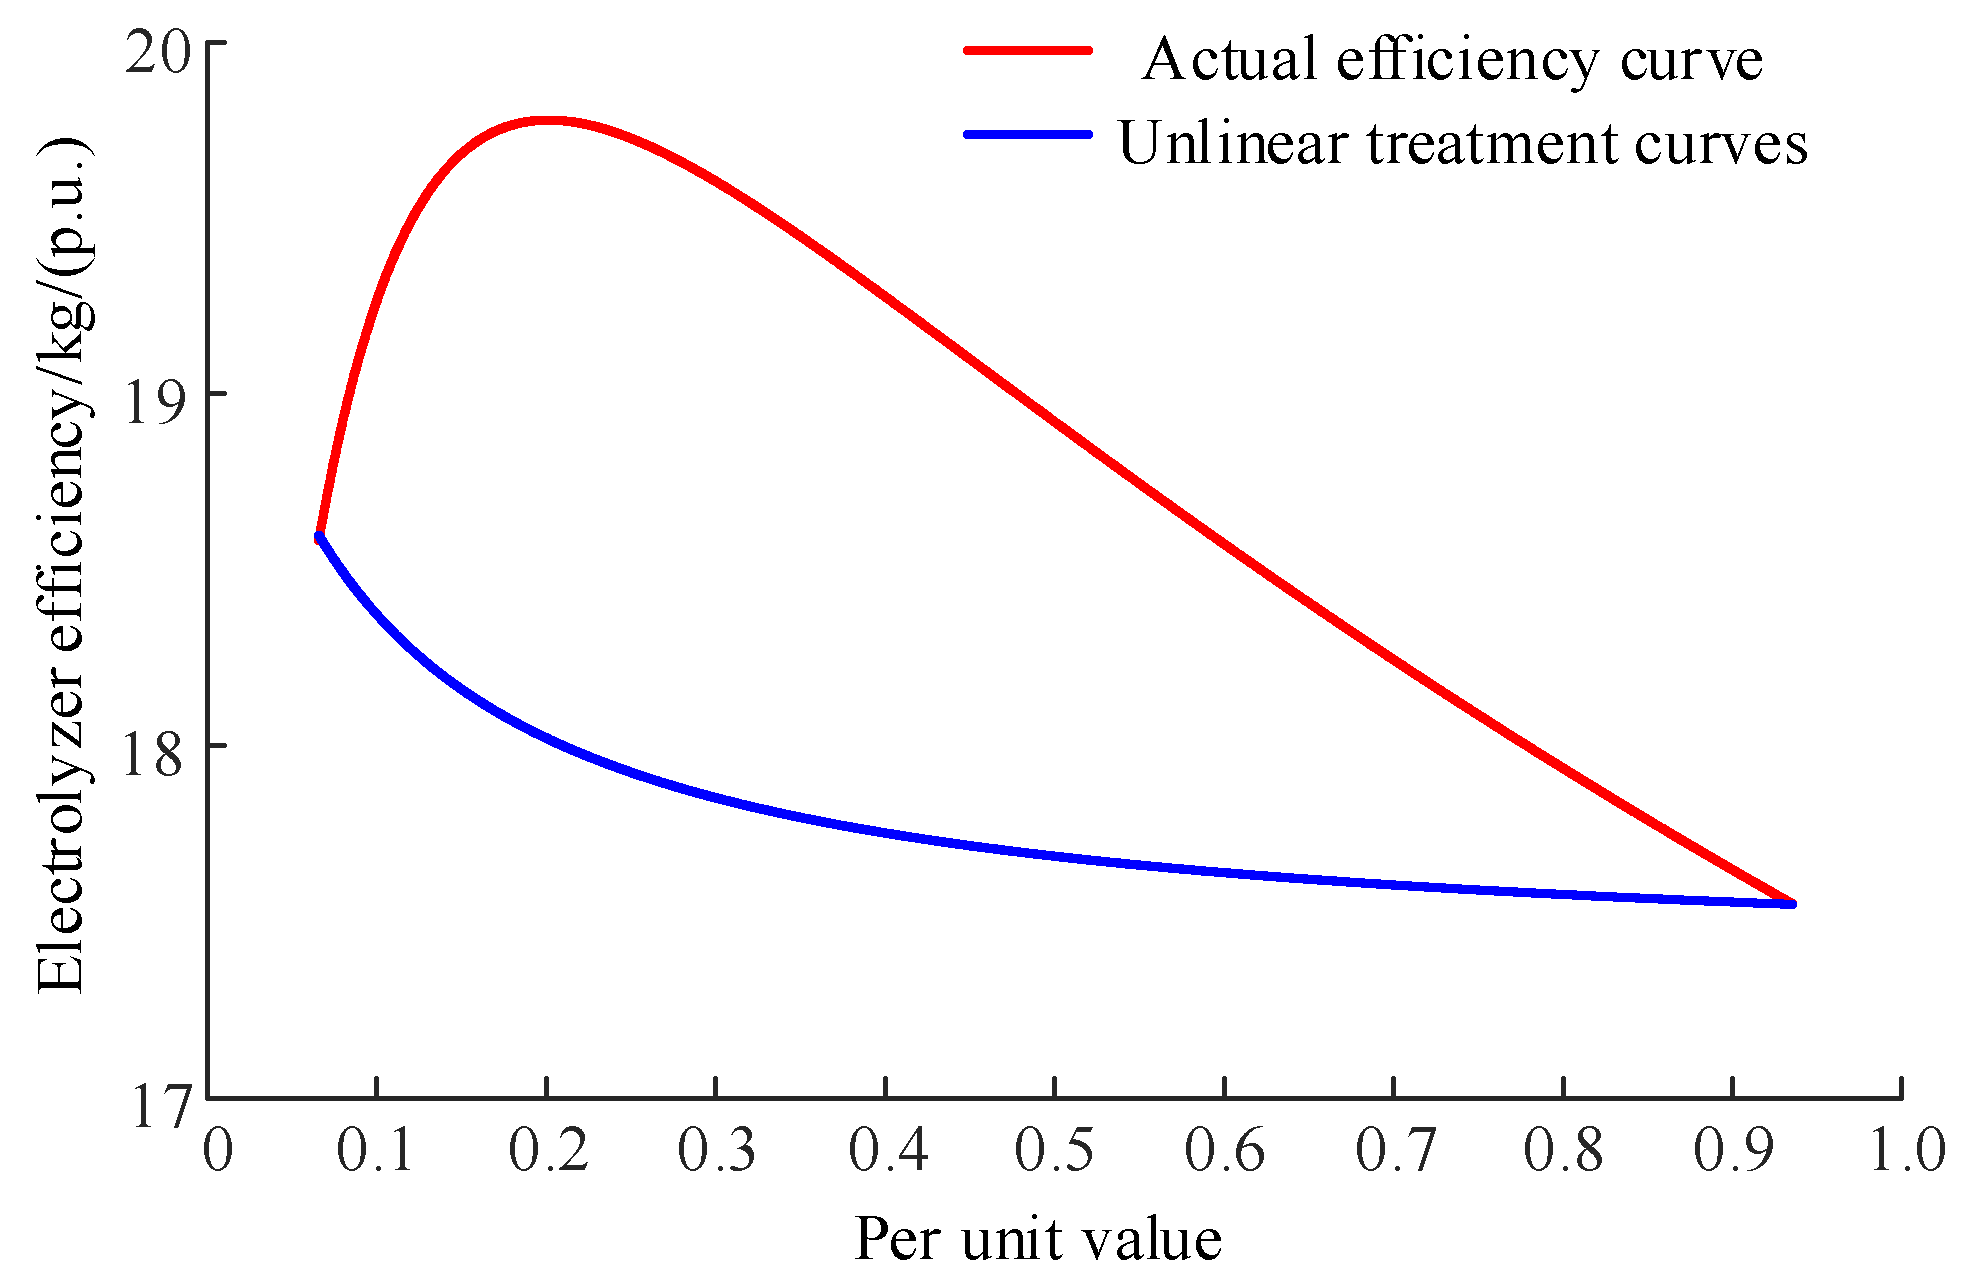
Figure A4. Efficiency Curve Comparison.
Modelling 06 00101 g0a4

References

  1. Wang, Q.; Dong, Z.; Li, R.; Wang, L. Renewable energy and economic growth: New insight from country risks. Energy 2022, 238, 122018. [Google Scholar] [CrossRef]
  2. Abdin, Z.; Mérida, W.A.W.M. Hybrid energy systems for off-grid power supply and hydrogen production based on renewable energy: A techno-economic analysis. Energy Convers. Manag. 2019, 196, 1068–1079. [Google Scholar] [CrossRef]
  3. Hajiaghasi, S.; Salemnia, A.; Hamzeh, M. Hybrid energy storage system for microgrids applications: A review. J. Energy Storage 2019, 21, 543–570. [Google Scholar] [CrossRef]
  4. Ceylan, C.; Devrim, Y. Green hydrogen based off-grid and on-grid hybrid energy systems. Int. J. Hydrogen Energy 2023, 48, 39084–39096. [Google Scholar] [CrossRef]
  5. Gao, X.; Wang, C.A.; Hou, Y.; Zhao, L.; Bai, W.; Che, D. Experimental study on characteristics and mechanism of hydrogen production from aluminium–water reaction for carbon-free power generation. Fuel 2025, 380, 133206. [Google Scholar] [CrossRef]
  6. Le, T.S.; Nguyen, T.N.; Bui, D.K.; Ngo, T.D. Optimal sizing of renewable energy storage: A techno-economic analysis of hydrogen, battery and hybrid systems considering degradation and seasonal storage. Appl. Energy 2023, 336, 120817. [Google Scholar] [CrossRef]
  7. Wang, L.; Liu, W.; Sun, H.; Yang, L.; Huang, L. Advancements and policy implications of green hydrogen production from renewable sources. Energies 2024, 17, 3548. [Google Scholar] [CrossRef]
  8. Xu, C.; Ke, Y.; Li, Y.; Chu, H.; Wu, Y. Data-driven configuration optimization of an off-grid wind/PV/hydrogen system based on modified NSGA-II and CRITIC-TOPSIS. Energy Convers. Manag. 2020, 215, 112892. [Google Scholar] [CrossRef]
  9. Wang, W.; Yuan, B.; Sun, Q.; Wennersten, R. Application of energy storage in integrated energy systems—A solution to fluctuation and uncertainty of renewable energy. J. Energy Storage 2022, 52, 104812. [Google Scholar] [CrossRef]
  10. Li, C.; Baek, J.B. The promise of hydrogen production from alkaline anion exchange membrane electrolyzers. Nano Energy 2021, 87, 106162. [Google Scholar] [CrossRef]
  11. Liang, T.; Chen, M.; Tan, J.; Jing, Y.; Lv, L.; Yang, W. Large-scale off-grid wind power hydrogen production multi-tank combination operation law and scheduling strategy taking into account alkaline electrolyzer characteristics. Renew. Energy 2024, 232, 121122. [Google Scholar] [CrossRef]
  12. Yang, B.; Zhang, Z.; Su, S.; Li, J.; Wang, J.; Zhang, R. Optimal scheduling of wind-PV-hydrogen system with alkaline and proton exchange membrane electrolyzer. J. Power Sources 2024, 614, 235010. [Google Scholar] [CrossRef]
  13. Hai, T.; Alenizi, F.A.; Mohammed, A.H.; Singh, P.K.; Metwally, A.S.M. Optimal design modeling of an energy system for a near-zero energy restaurant with green hydrogen energy storage systems. Fuel 2023, 351, 128896. [Google Scholar] [CrossRef]
  14. Kumar, K.; Alam, M.; Dutta, V. Energy management strategy for integration of fuel cell-electrolyzer technologies in microgrid. Int. J. Hydrog. Energy 2021, 46, 33738–33755. [Google Scholar] [CrossRef]
  15. HassanzadehFard, H.; Tooryan, F.; Collins E., R.; Jin, S.; Ramezani, B. Design and optimum energy management of a hybrid RE system based on efficient various hydrogen production. Int. J. Hydrog. Energy 2020, 45, 30113–30128. [Google Scholar] [CrossRef]
  16. Xu, C.; Wu, X.; Shan, Z.; Zhang, Z.; Zhang, Q. Bi-level configuration and operation collaborative optimization of shared hydrogen energy storage system for a wind farm cluster. J. Energy Storage 2024, 86, 111107. [Google Scholar] [CrossRef]
  17. Huo, Q.; Huo, Q.; Liu, Q.; Deng, H.; Wang, W.; Shi, C.; Wei, T. Research on Dual-Layer Optimization Strategy of Photovoltaic-Storage-Hydrogen System in Coal Chemical Industry Park. Renew. Energy 2024, 230, 120813. [Google Scholar] [CrossRef]
  18. Zhang, F.; Wang, B.; Gong, Z.; Zhang, X.; Qin, Z.; Jiao, K. Development of PV-electrolyzer-fuel cell system for hydrogen production and power generation. Energy 2023, 263, 125566. [Google Scholar] [CrossRef]
  19. He, M.; Nie, G.; Yang, H.; Li, B.; Zhou, S.; Wang, X.; Meng, X. A generic equivalent circuit model for PEM electrolyzer with multi-timescale and stages under multi-mode control. Appl. Energy 2024, 359, 122728. [Google Scholar] [CrossRef]
  20. Virah-Sawmy, D.; Beck, F.J.; Sturmberg, B. Ignore variability, overestimate hydrogen production–Quantifying the effects of electrolyzer efficiency curves on hydrogen production from renewable energy sources. Int. J. Hydrogen Energy 2024, 72, 49–59. [Google Scholar] [CrossRef]
  21. Flamm, B.; Peter, C.; Büchi, F.N.; Lygeros, J. Electrolyzer modeling and real-time control for optimized production of hydrogen gas. Appl. Energy 2021, 281, 116031. [Google Scholar] [CrossRef]
  22. Iyer, R.K.; Prosser, J.H.; Kelly, J.C.; James, B.D.; Elgowainy, A. Life-cycle analysis of hydrogen production from water electrolyzers. Int. J. Hydrogen Energy 2024, 81, 1467–1478. [Google Scholar] [CrossRef]
  23. Wang, X.; Huang, J.; Xu, Z.; Zhang, C.; Guan, X. Real-world scale deployment of hydrogen-integrated microgrid: Design and control. IEEE Trans. Sustain. Energy 2024, 15, 2380–2392. [Google Scholar] [CrossRef]
  24. Schrotenboer, A.H.; Veenstra, A.A.T.; uit het Broek, M.A.J.; Ursavas, E. A Green Hydrogen Energy System: Optimal control strategies for integrated hydrogen storage and power generation with wind energy. Renew. Sustain. Energy Rev. 2022, 168, 112744. [Google Scholar] [CrossRef]
  25. Boretti, A.; Castelletto, S. Hydrogen energy storage requirements for solar and wind energy production to account for long-term variability. Renew. Energy 2024, 221, 119797. [Google Scholar] [CrossRef]
  26. Fang, R.; Liang, Y. Control strategy of electrolyzer in a wind-hydrogen system considering the constraints of switching times. Int. J. Hydrogen Energy 2019, 44, 25104–25111. [Google Scholar] [CrossRef]
  27. Li, Y.; Deng, X.; Zhang, T.; Liu, S.; Song, L.; Yang, F.; Ouyang, M.; Shen, X. Exploration of the configuration and operation rule of the multi-electrolyzers hybrid system of large-scale alkaline water hydrogen production system. Appl. Energy 2023, 331, 120413. [Google Scholar] [CrossRef]
  28. Hong, Z.; Wei, Z.; Han, X. Optimization scheduling control strategy of wind-hydrogen system considering hydrogen production efficiency. J. Energy Storage 2022, 47, 103609. [Google Scholar] [CrossRef]
  29. Zheng, Y.; Huang, C.; Tan, J.; You, S.; Zong, Y.; Træholt, C. Off-grid wind/hydrogen systems with multi-electrolyzers: Optimized operational strategies. Energy Convers. Manag. 2023, 295, 117622. [Google Scholar] [CrossRef]
  30. Jahanbin, A.; Abdolmaleki, L.; Berardi, U. Cross-climate analysis of techno-economic metrics in bi-level electrical and hydrogen storage systems for off-grid electrification of buildings. J. Energy Storage 2025, 107, 114938. [Google Scholar] [CrossRef]
  31. Chen, Y.; Chen, J.; Zhang, W.; Ni, C.W.; Zhao, B. Optimal scheduling strategy of distributed electric-thermo-hydrogen system considering lifetime decay characteristics of electrolytic cell and battery. Electr. Power Autom. Equip. 2022, 43, 135–142. (In Chinese) [Google Scholar]
  32. Yu, B.; Fan, G.; Sun, K.; Chen, J.; Sun, B.; Tian, P. Adaptive energy optimization strategy of island renewable power-to-hydrogen system with hybrid electrolyzers structure. Energy 2024, 301, 131508. [Google Scholar] [CrossRef]
  33. Huang, S.; Yang, Z.; Li, Z. Analysis of optimization path of developing China’s hydrogen industry. Chem. Ind. Eng. Prog. 2024, 43, 882–893. [Google Scholar]
  34. Cao, W.; Geng, P.; Xu, X.; Guo, Y.; Ma, Z. A power allocation strategy for fuel cell ship considering fuel cell performance difference. Sci. Rep. 2023, 13, 9905. [Google Scholar] [CrossRef] [PubMed]
  35. Liu, Q.; Li, Q.; Wang, T.; Cai, L.; Chen, W. Efficiency Optimal Control Method of Multi-stack Fuel Cell System Based on Salp Swarm Algorithm. Proc. CSEE 2021, 41, 7730–7740. (In Chinese) [Google Scholar]
Figure 1. AEL power-efficiency curve.
Modelling 06 00101 g001
Figure 2. Schematic topology of wind-PV-hydrogen integrated microgrid system.
Modelling 06 00101 g002
Figure 3. Flowchart for solving the double-layer capacity allocation model.
Modelling 06 00101 g003
Figure 4. Electricity power balance results under Case2.
Modelling 06 00101 g004
Figure 5. Electricity power balance results under Case3.
Modelling 06 00101 g005
Figure 6. Operating results of each electrolyzer under different operating strategies.
Modelling 06 00101 g006
Figure 7. MES efficiency under different strategy operation.
Modelling 06 00101 g007
Figure 8. Impact of electrolyzer and fuel cell configuration results on system benefits.
Modelling 06 00101 g008
Figure 9. Impact of electrolyzer and hydrogen storage tank configuration results on system benefits.
Modelling 06 00101 g009
Table 1. Comparative assessment of various capacity allocation methods.
Ref, YearEnergy SourceOptimization
WPVHEGDouble-LayerCharacterizationSolver
[15], 2023Improved operational strategies of multi-electrolyzers systemsGUROBI
[16], 2023Utilized the optimised long-duration strategyMOMFA
[17], 2024Utilized the PV-storage-hydrogen energy management strategyGUROBI
[19], 2023Combined pumped storagePSO
[26], 2019Considered start-stop characteristics of ALEGUROBI
[27], 2023Utilized multi-electrolyzer arraysGUROBI
[28], 2022Considered hydrogen production efficiencyABC
[29], 2023Proposed rolling optimization based strategy and utilized multi-electrolyzer arraysGUROBI
[30], 2022Proposed finite-state machine strategyPSO, EA
[31], 2023Considered the life decay characteristics of AELGUROBI
[32], 2024Considered operational status changes of AELGA
Table 2. System economic parameters.
ParameterVariablesValue
Wind power cost (CNY/kW)eW4000
PV cost (CNY/kW)ePV2500
Fuel Cell Costs (CNY/kW)eFC4500
Electrolyzer costs (CNY/kW)eEL3000
Hydrogen storage tank costs (CNY/kg)eHST4500
Operation and maintenance cost factor (%)ψ2
Load interruption compensation costs (CNY/kW)KL0.9
Penalty Factors for Wind and Light Abandonment (CNY/kW)KWP0.3
Renewable energy reserve capacity factor (%)γ10
Transmission line power limit (kW) P max gird 1000
Table 3. Time-sharing tariffs and hydrogen prices.
Period/HourPrice/Unit
electricity price0:00–8:000.3 CNY/kW·h
8:00–13:00, 19:00–22:001.1 CNY/kW·h
13:00–19:00, 22:00–24:000.8 CNY/kW·h
hydrogen price0:00–24:0030 CNY/kg
Table 4. Optimization parameters [31].
ParameterVariablesValue
Temperature (°C)T70
Maximum current density (A/m2)i5000
Membrane area (cm2)A48
Smooth-running attenuation factor β 1 EL 2.75 × 10⁻⁷
Start-stop attenuation factor β 2 EL 5.5 × 10⁻⁶
Rated efficiency attenuation factor β r a t e EL 2.28 × 10⁻⁶
RE reserve capacity factorγ0.1
Table 5. Simulation results for different strategies.
Case1Case2Case3
Electrolyzer (kW)11301027910
Fuel Cell (kW)324324324
Hydrogen storage tank (kg)475469447
Comprehensive income per day (CNY)2737.143427.734172.19
Table 6. MES efficiency under different strategies.
Case1Case2Case3
maximum efficiency (%)66.9468.6775.83
minimum efficiency (%)62.9663.8267.25
average efficiency (%)64.5466.0270.79
hydrogen production (kg)128.73130.13139.56
Cost of hydrogen production (CNY/kg)36.1335.6933.87
Disclaimer/Publisher’s Note: The statements, opinions and data contained in all publications are solely those of the individual author(s) and contributor(s) and not of MDPI and/or the editor(s). MDPI and/or the editor(s) disclaim responsibility for any injury to people or property resulting from any ideas, methods, instructions or products referred to in the content.