Article

Joint Estimation of SOC and SOH Based on Kalman Filter Under Multi-Time Scale

1
The School of Mechanical and Electrical Engineering, Sanjiang University, Nanjing 210012, China
2
College of Engineering, China Agricultural University, Beijing 100083, China
*
Author to whom correspondence should be addressed.
Modelling 2025, 6(3), 100; https://doi.org/10.3390/modelling6030100
Submission received: 21 August 2025 / Revised: 31 August 2025 / Accepted: 2 September 2025 / Published: 9 September 2025

Abstract

Optimizing the accurate estimation algorithms for the State of Charge (SOC) and State of Health (SOH) of power batteries is crucial for improving the performance of electric vehicles. This paper takes lithium-ion batteries as the research object. The Singular Value Decomposition-Unscented Kalman Filter (SVDUKF) at a micro-time scale is used to estimate the battery’s State of Charge, and the traditional Extended Kalman Filter (EKF) at a macro-time scale is used to estimate impedance parameters and capacity. The two filters operate alternately, with the output of one serving as the input for the other, thereby establishing a joint estimation method for SOC and SOH based on the SVDUKF-EKF under a multi-time scale. The joint estimation method is verified under the Dynamic Stress Test (DST) condition and Federal Urban Driving Schedule (FUDS) condition. The results show that the SOH estimation error is within 2% under the DST condition and within 1% under the FUDS condition. The method exhibits high estimation accuracy and stability under both conditions.

1. Introduction

With the rapid development of electric vehicles, power batteries, as their core power source, have become increasingly critical [1]. The Battery Management System (BMS), which integrates battery state monitoring, protection, and control, is responsible for ensuring the safe, stable, and efficient operation of battery packs and constitutes a crucial link in achieving efficient battery management.
State estimation of batteries is one of the core functions of BMS. Accurate state estimation enables BMS to manage batteries in a more refined manner. It facilitates early warning for batteries, alleviates drivers’ range anxiety, reduces the operational risks of electric vehicles, extends battery service life, and also provides a foundation for the energy optimization of the entire vehicle. The estimation of battery State of Charge (SOC) and State of Health (SOH) is the foundation of battery state estimation [2]. SOC estimation directly affects State of Energy (SOE) estimation, and accurate SOC and SOH estimation is crucial for the prediction and control of State of Power (SOP). If the SOC is underestimated, the battery may enter the discharge phase in advance, leading to a decrease in SOP; conversely, the battery may fail to provide the required power output when needed. The accuracy of SOC estimation is heavily influenced by battery SOH. As batteries degrade, SOC estimation algorithms may produce large estimation errors. The inaccurate SOC estimations may mislead the battery SOH calibration. Therefore, simultaneous estimation of SOC and SOH is quite beneficial [3,4].
There are various forms of definitions for State of Charge (SOC), and the most widely used one is the ratio of the battery’s remaining capacity at the current moment to its total capacity [5], as shown in Equation (1).
SOC = Q c Q max
In the equation, Q c is the remaining capacity of the battery at the current moment, and Q max is the maximum available capacity of the battery when it is fully charged at the current moment.
SOC is related to factors of a battery such as its temperature, charge–discharge rate, number of cycles, and degree of degradation [6]. Currently, the commonly used SOC estimation methods are the direct method, model-based method, and data-driven method.
The direct method estimates the battery SOC by directly measuring parameters such as voltage, current, and temperature. It mainly includes the Open Circuit Voltage (OCV) Method [7,8], Impedance Spectroscopy [9], and Ah Integration Method [10]. This method is relatively simple and easy to implement.
Model-based methods mainly utilize the physical or chemical models of batteries [11]. By measuring parameters such as the battery’s voltage, current, and temperature, filtering algorithms are used to estimate the battery’s SOC in real-time. Common models include Electrochemical Models [12], Equivalent Circuit Models [13], and Black-box Models [14]. The residual between the measured terminal voltage and the terminal voltage of the established model is used as a feedback signal to realize closed-loop correction of SOC estimation. Commonly used estimation algorithms mainly include Kalman Filter-Based Algorithms [15,16], Particle Filter-Based Algorithms [17], Least Squares-Based Filters [18], H∞ Filters [19], State Observers [20], Luenberger Observers [21], etc.
Data-driven methods regard the interior of the battery as a black box, without focusing on its internal physical and chemical changes, and do not need to establish a specific battery system model. They only need to collect relevant data, such as current, voltage, and temperature during battery operation, and obtain the estimated value of battery SOC through training [22]. This method requires a large amount of experimental data, and the data quality directly affects the accuracy of the final SOC estimation. This method mainly includes neural network methods [23,24], support vector machines [25], machine learning [26], etc.
The SOH of a battery refers to the changes in performance parameters, such as capacity, internal resistance, and lifespan, during its service life. It reflects the degree to which the battery’s key parameters deviate from the set parameters and serves as a crucial indicator for evaluating battery performance and reliability. There are mainly two definitions of SOH. One is SOH characterized by capacity degradation, as shown in Equation (2); the other is SOH characterized by internal resistance increase, as shown in Equation (3). This paper adopts the SOH characterized by capacity degradation. Generally, a battery is considered to have reached the end of its life when its capacity degrades to 80% of the initial capacity [27].
SOH = C max C n
In the equation, C max is the maximum available capacity of the current battery, and C n is the nominal capacity of the battery.
SOH = R now R new R old R new
In the equation, R now is the ohmic internal resistance of the battery at the current moment, R old is the ohmic internal resistance of the battery at the end of its life, and R new is the initial ohmic internal resistance of the battery.
The estimation methods of SOH mainly include experimental analysis methods, model-based methods [28], and data-driven methods [29,30].
The experimental method directly or indirectly calculates SOH through experimentally measured data, such as OCV and impedance parameters. Although this method has a small amount of calculation, it requires experimental research on battery life, which takes a long time. It is difficult to implement in on-board BMS and is not suitable for online SOH estimation.
Model-based methods include the Kalman filter, particle filter, least squares method, and others. Model-based methods typically employ two alternately operating filters to perform joint estimation of SOC and SOH.
Data-driven SOH estimation methods mainly include artificial neural networks [31], Support Vector Machines (SVM) [32], Gaussian process regression [33], deep learning [34,35], etc.
Currently, the estimation of SOC and SOH primarily faces key challenges, such as insufficient model accuracy and parameter time-variability, which impact the reliability and precision of battery management systems. To further improve the estimation accuracy of battery SOC and SOH based on existing research, it is necessary to establish a more precise battery model with model parameters that can be updated online to adapt to various operating conditions and battery life stages. The future development trends mainly focus on aspects such as the integration of multiple methods, online update and adaptive algorithms, the application of big data and artificial intelligence, and multi-scale and multi-physics field coupling modeling [36,37,38,39,40].
To improve the accuracy and stability of SOC estimation, this paper, based on the traditional Unscented Kalman Filter (UKF), adopts Singular Value Decomposition (SVD) to replace Cholesky Decomposition, thereby developing the Singular Value Decomposition-Unscented Kalman Filter (SVDUKF).
Considering that battery capacity fading and parameter changes occur on a relatively long time scale, the Extended Kalman Filter (EKF) is used on the macro-time scale to estimate battery parameters that change slowly, including internal resistance, dual polarization impedance parameters, and current maximum available capacity. Considering that the change in SOC occurs on a short time scale, the Singular Value Decomposition Unscented Kalman Filter (SVDUKF) is used on the micro-time scale to estimate the SOC, which changes more rapidly. The two filters operate alternately, with the output of each serving as an input to the other.

2. Methods

This paper takes ternary lithium-ion power batteries for vehicles as the research object and conducts research on the joint estimation of battery SOC and SOH. Firstly, static capacity tests, aging cycle tests, and Hybrid Pulse Power Characteristic (HPPC) tests are carried out on the batteries through a lithium-ion battery test platform to establish the variation law of OCV with SOC and SOH. Secondly, a second-order RC model of the battery is established, and the Adaptive Forgetting Factor Recursive Least Square (AFFRLS) method is used to identify the battery parameters. Finally, a multi-time-scale joint estimation method for SOC and SOH based on the SVDUKF-EKF is proposed.

2.1. Lithium-Ion Battery Testing

This paper uses the ternary EVE-INR-18650/33V vehicle battery cell as the research object and employs the CT-4008Tn-5V12A charge–discharge tester to build a test platform. To study battery performance and establish a battery test database, static capacity tests, aging tests, and Hybrid Pulse Power Characteristic (HPPC) tests were conducted on the batteries under different aging degrees, providing data support for subsequent parameter identification and state estimation algorithms.

2.1.1. Static Capacity Test

Under a constant temperature of 25 °C, the battery was discharged at a 0.5 C rate until it reached the cut-off voltage. The discharge capacity of the single battery cell during the discharge process was recorded, and the average value of three discharge capacities was taken as the maximum available capacity of the single battery cell. Through the static capacity test, the initial maximum available capacity of the single battery cell was measured to be 3.1 Ah.

2.1.2. Battery Aging Cycle Test

To study the battery’s SOH and establish the dataset required for SOH estimation, the research team conducted an aging cycle test covering the full SOC range from 100% SOC to 0% SOC. Figure 1 shows the battery aging curve obtained from the test. The battery’s discharge capacity gradually decreases as the number of cycles increases. This phenomenon is mainly caused by the increase in internal resistance due to battery aging. The capacity degradation of a battery is not a smooth process. Local fluctuations in the curve occur due to capacity regeneration resulting from battery rest.

2.1.3. Hybrid Pulse Power Characteristic (HPPC) Test

To evaluate the dynamic performance of the battery, the research team conducted HPPC tests on lithium-ion batteries and obtained the external characteristics of the batteries under different depths of discharge.
By analyzing the HPPC test data at different battery aging stages, the corresponding SOC–OCV relationships at each aging stage were extracted. A 5th-order polynomial fitting method was adopted to generate the SOC–OCV curves under different aging degrees, as shown in Figure 2a. It can be seen from Figure 2a that there are significant differences in the SOC–OCV curves under different aging degrees. The maximum OCV difference at the same SOC between the SOH = 100% and SOH = 80% can reach 248 mV. This indicates that the impact of aging on the battery’s OCV cannot be ignored.
The voltage characteristic curves from HPPC tests under different aging degrees were analyzed, and a 6th-order polynomial surface fitting method was used to establish the relationship between OCV, SOC, and SOH, as shown in Figure 2b. The root mean square error (RMSE) of the fit is 0.0146 V.
A three-dimensional surface describing the variation of battery OCV with SOC and SOH was constructed using HPPC test data under different SOH conditions, laying a foundation for the joint estimation of battery SOC and SOH.

2.2. Mathematical Model of Lithium-Ion Batteries

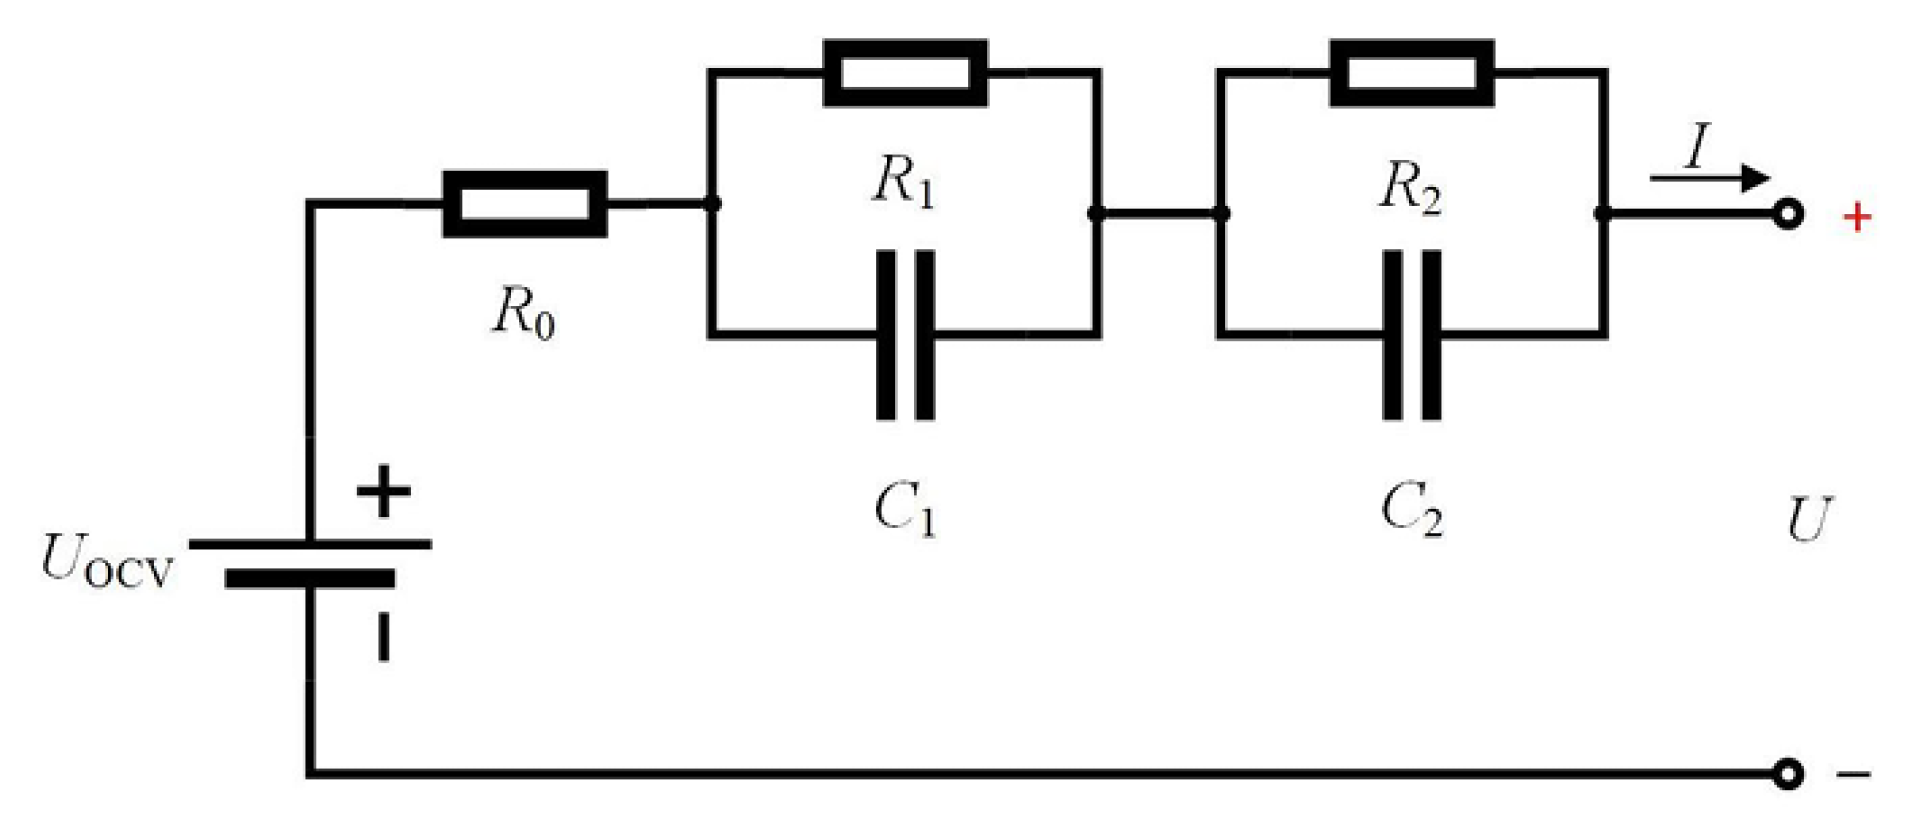
Figure 3 shows the second-order RC equivalent circuit model of lithium-ion batteries. The two RC components reflect the electrochemical polarization and concentration polarization inside the battery, respectively, and the corresponding mathematical model of this circuit model is given by Equation (4).
d U 1 ( t ) d t = 1 R 1 C 1 U 1 ( t ) + 1 C 1 I ( t ) d U 2 ( t ) d t = 1 R 2 C 2 U 2 ( t ) + 1 C 2 I ( t ) U ( t ) = U OCV ( t ) U 1 ( t ) U 2 ( t ) R 0 I ( t )
In the equation, U OCV is the nonlinear voltage source; R 0 is the ohmic internal resistance; R 1 and R 2 are the internal resistances of the two RC components, respectively; C 1 and C 2 are the capacitances of the two RC components, respectively; U is the terminal voltage of the model; U 1 is the voltage across R 1 C 1 ; and U 2 is the voltage across R 2 C 2 .
When using the SVDUKF method for battery SOC estimation, the most crucial step is to establish the state-space equations of the system. According to the Coulomb counting method (Ah Integration Method):
S O C k = S O C k 1 I k T Q n
In the equation, I k is the current at time k (with the current direction defined as negative for charging and positive for discharging), and Q n is the current maximum available capacity of the battery. Combined with the second-order RC model of the battery used in this study, its state-space equation can be expressed as Equation (6):
S O C k U 1 , k U 2 , k = 1 0 0 0 e T / τ 1 0 0 0 e T / τ 2 S O C k 1 U 1 , k 1 U 2 , k 1 + T / Q N R 1 1 e T / τ 1 R 2 1 e T / τ 2 I k U k = U O C V , k ( S O C ) U 1 , k U 2 , k R 0 I k
In the equation, T is the sampling period, R 0 is the ohmic internal resistance, R 1 is the electrochemical polarization resistance, τ 1 is the time constant, R 2 is the concentration polarization resistance, τ 2 is the time constant, U is the terminal voltage, U O C V is the open-circuit voltage, U 1 is the voltage across R 1 C 1 , and U 2 is the voltage across R 2 C 2 .

2.3. SVDUKF-EKF Joint Estimation Algorithm

The idea of joint estimation is to consider the influence of one state quantity in the estimation process of another, thereby enabling the two state quantities to iteratively operate alternately. Since battery capacity fading and parameter changes occur over a relatively long time scale, while SOC changes over a short time scale, parameters and capacity can be estimated in one filter, and SOC, which changes more rapidly, can be estimated in another filter. The two filters operate alternately, with the output of each serving as an input for the other.
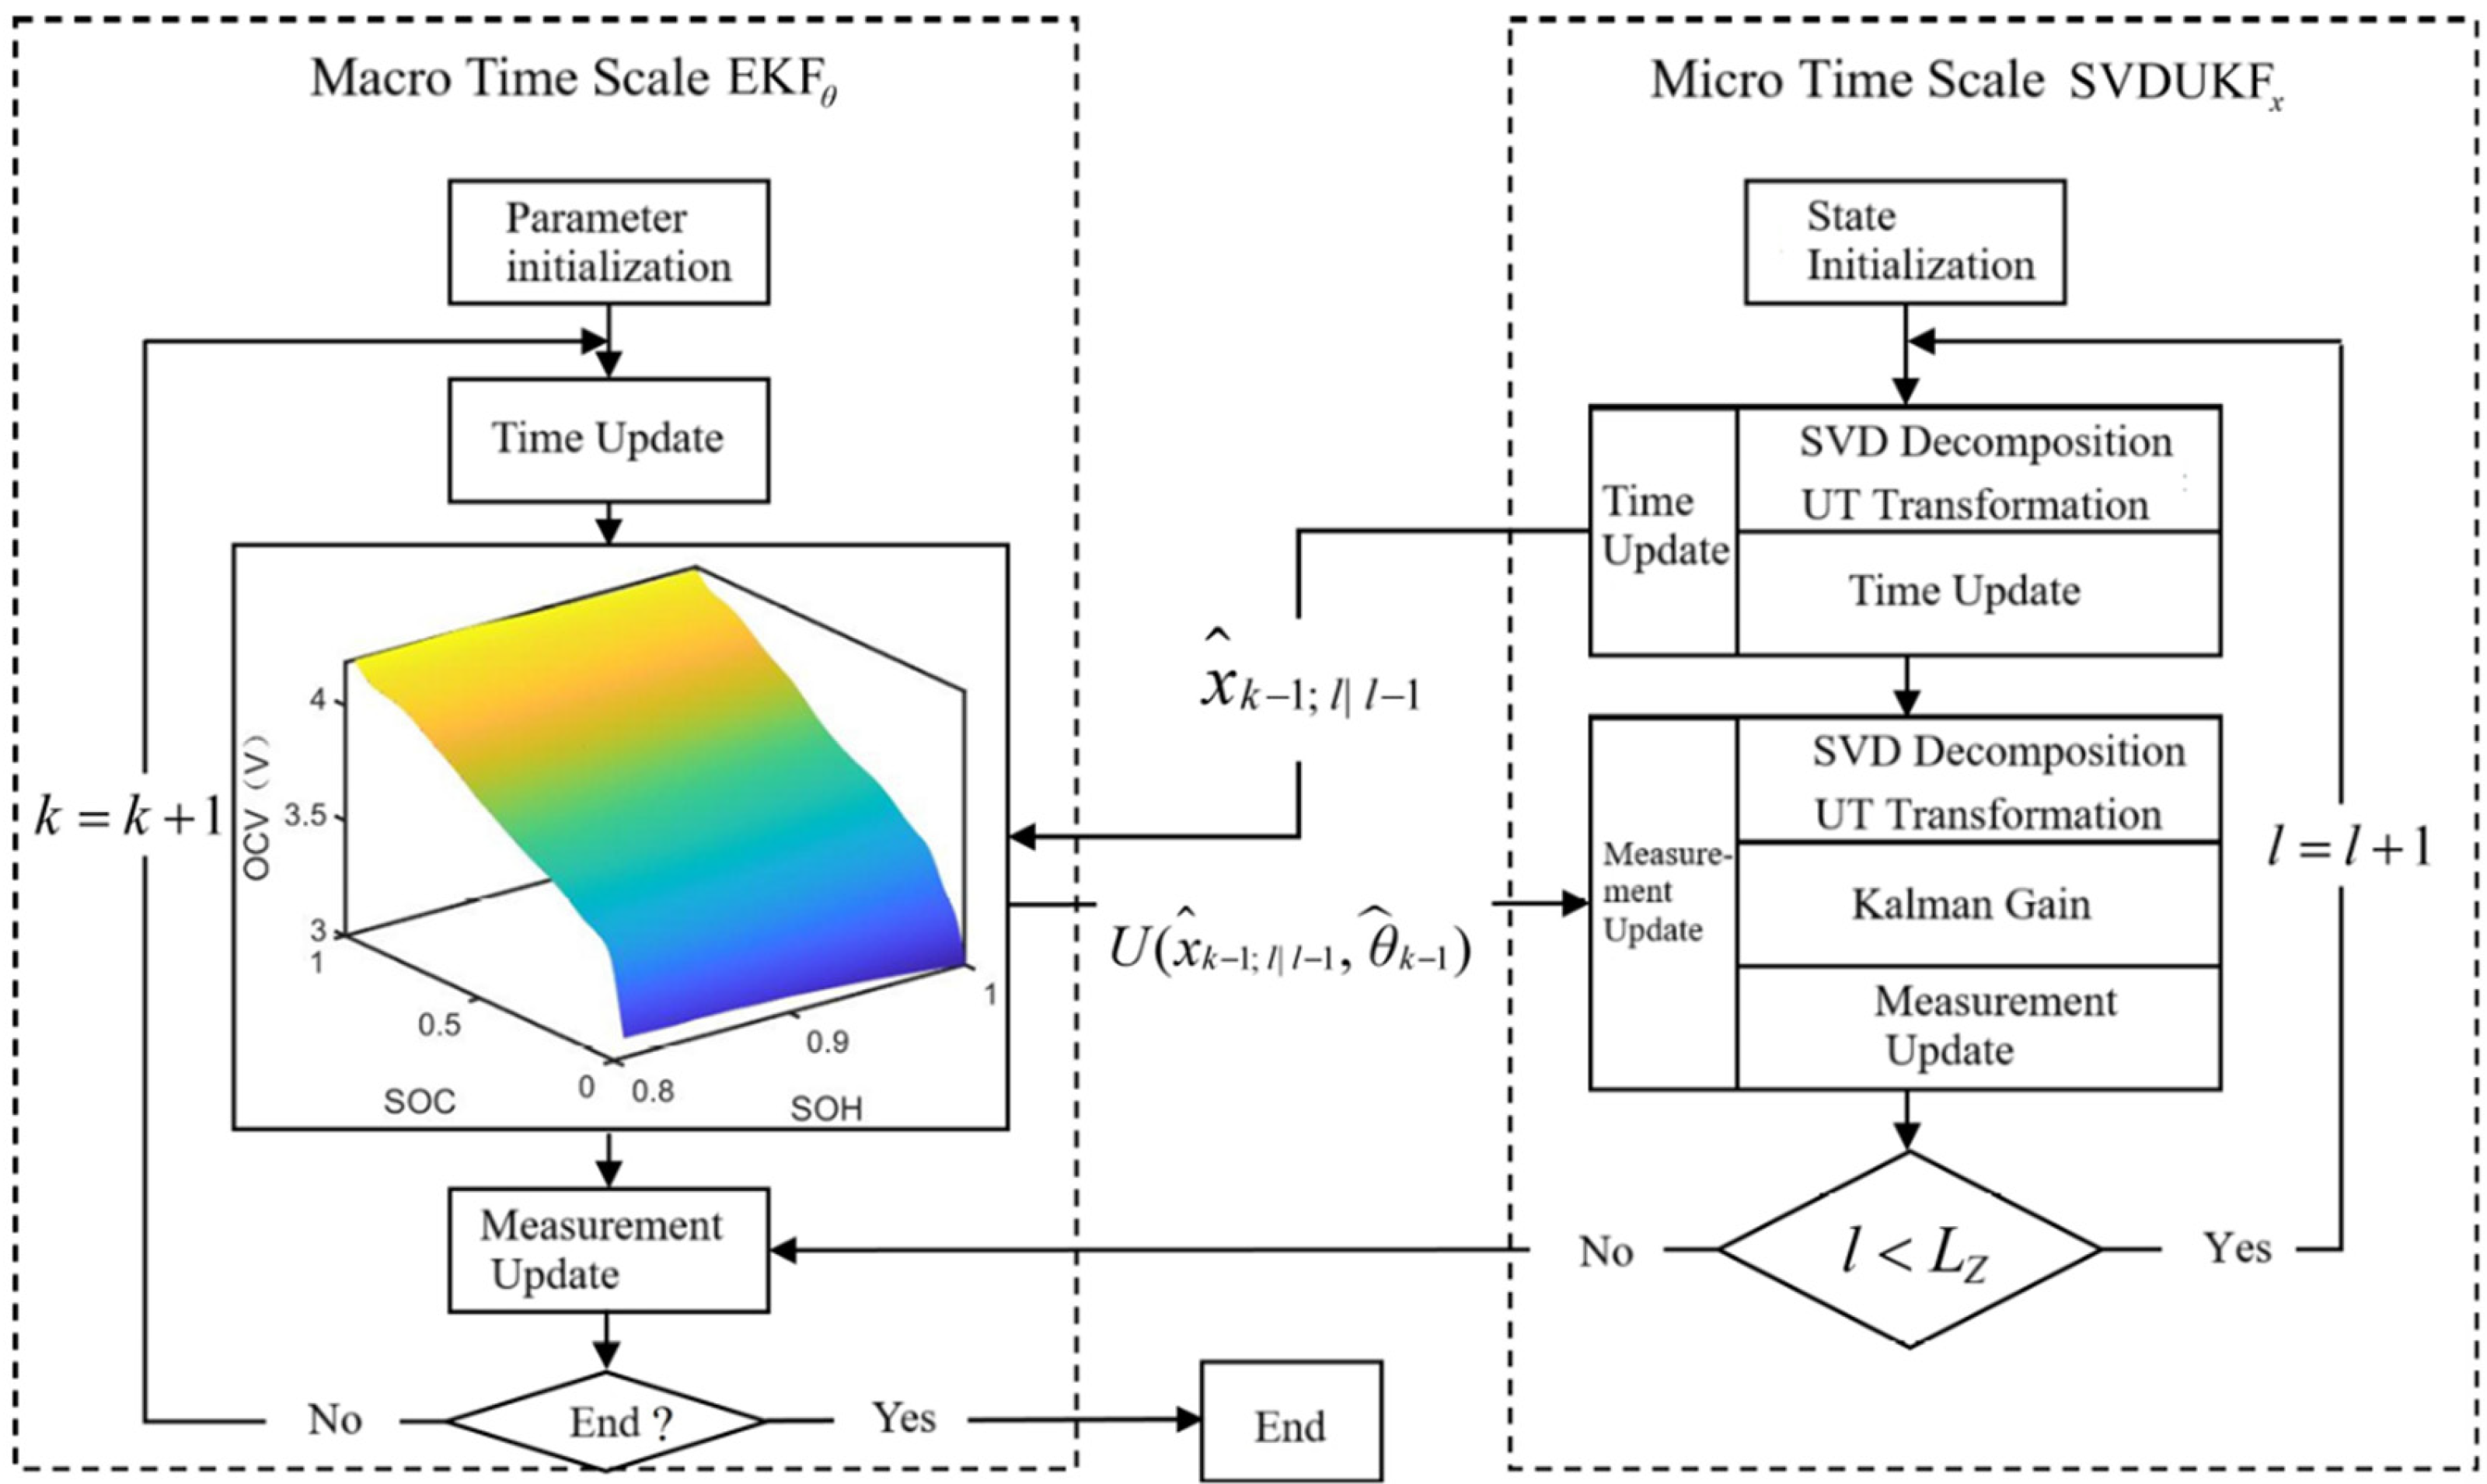
The changes in battery parameters and capacity are relatively slow, so they do not need to be updated as frequently as SOC. To reduce computational complexity, a multi-time-scale joint estimation method for SOC and SOH is adopted, which reduces the computational load while ensuring high estimation accuracy. The principle of joint estimation is illustrated in Figure 4, where x ^ represents the state, and θ ^ represents the parameter. The state filter and the parameter filter operate on time scales l and k , respectively, with l < k .
In a relatively short period of time, battery parameters change slowly, so the parameter estimate at the next moment can be considered as the estimate at the previous moment plus a small disturbance. To ensure the stability and convergence of the algorithm, the parameter estimator and the SOC estimator should share key information (e.g., terminal voltage, charge–discharge current, and prior estimation results). The state-space equation for the joint estimation of battery parameters and SOC can be expressed as (7):
x k , l = f ( x k , l 1 , θ k , u k , l 1 ) + w k , l 1 x θ k + 1 = θ k + w k θ y k , l 1 = g ( x k , l 1 , θ k , u k , l 1 ) + v k , l 1
In the equation, the subscripts k and l are the long time scale for Estimation θ and the short time scale for Estimation x , which satisfy t k , 0 = t k 1 , L Z , where L Z is the time conversion scale. x k , l is the state at time t k , l = t k , 0 + l × Δ t , ( 1 l L Z ) , θ k is the parameter state at time t k , and θ k is constant within a micro-time scale t k , 0 t k , l t k , L Z 1 ; u k , l 1 is the system input at time t k , l 1 ; y k , l 1 is the system observation output at time t k , l 1 ; w k , l 1 x and w k θ are the process noises with a mean of 0 for state estimation and parameter estimation, and their covariances are Q k , l 1 x and Q k , l 1 x , respectively; v k , l 1 is the measurement noise of the system with a mean of 0, and its covariance is R k , l 1 .
Combined with the nonlinear discrete system of power batteries established in Equation (6), Equation (7) can be rewritten as Equation (8).
x k , l = f ( x k , l 1 , θ k , u k , l 1 ) = 1 0 0 0 e T / τ 1 , k 0 0 0 e T / τ 2 , k x k , l 1 + T / Q n , k R 1 , k , l 1 e T / τ 1 , k R 2 , k , l 1 e T / τ 2 , k I k , l U k , l = g ( x k , l 1 , θ k , u k , l 1 ) = U O C V , k , l ( S O C k , l , Q n , k ) U 1 , k , l U 2 , k , l R 0 , k I k , l θ k + 1 = θ k
In the equation, I k , l is the input current, U k , l is the output terminal voltage, Q n is the maximum available capacity at the current moment, x k , l = S O C k , l U 1 , k , l U 2 , k , l T , θ k = [ R 0 , k R 1 , k C 1 , k R 2 , k C 2 , k Q n , k ] T , U OCV , k , l is the open-circuit voltage at time t k , l , U 1 , k , l is the voltage across the R 1 C 1 link, U 2 , k , l is the voltage across the R 2 C 2 link, τ 1 , k and τ 2 , k are the time constants of the two links R 1 C 1 and R 2 C 2 , τ 1 , k = R 1 , k C 1 , k , τ 2 , k = R 2 , k C 2 , k .
From this, the state transition matrix and measurement matrix of the SVDUKF-EKF algorithm are obtained:
A k , l 1 x = 1 0 0 0 e T / τ 1 , k , l 0 0 0 e T / τ 2 , k . l B k , l 1 x = T / Q n , k R 1 , k 1 e T / τ 1 , k R 2 , k 1 e T / τ 2 , k C k , l 1 x = U O C V , k , l ( S O C , Q n , k ) S O C S O C = S O C ^ k , l 1 1
A k θ = 1 B k θ = 0 C k θ = d g ( x k , 0 , θ , u k , 0 ) d θ θ = θ ^ k = g ( x k , 0 , θ ^ k , u k , 0 ) θ ^ k + g ( x k , 0 , θ ^ k , u k , 0 ) x k , 0 d x k , 0 d θ ^ k
Among them:
g ( x k , 0 , θ ^ k , u k , 0 ) θ ^ k = I k , 0 0 0 0 0 U O C V ( S O C , Q n ) S O C k , 0 S O C k , 0 Q ^ n , k g ( x k , 0 , θ ^ k , u k , 0 ) x k , 0 = C k , 0 x d x k , 0 d θ ^ k = 0 a 1 a 2 0 0 0 0 0 0 a 3 a 4 0 0 0 0 0 0 a 5 + A k 1 x d x k 1 , L Z 1 d θ ^ k
Among them:
a 1 = U 1 , k 1 , L Z 1 T R 1 , k 1 2 C 1 , k 1 e T τ 1 I k 1 , L Z 1 T R 1 , k 1 C 1 , k 1 e T τ 1 I k 1 , L Z 1 ( e T τ 1 1 ) a 2 = U 1 , k 1 , L Z 1 T R 1 , k 1 C 1 , k 1 2 e T τ 1 I k 1 , L Z 1 T C 1 , k 1 2 e T τ 1 a 3 = U 2 , k 1 , L Z 1 T R 2 , k 1 2 C 2 , k 1 e T τ 2 I k 1 , L Z 1 T R 2 , k 1 C 2 , k 1 e T τ 2 I k 1 , L Z 1 ( e T τ 2 1 ) a 4 = U 2 , k 1 , L Z 1 T R 2 , k 1 C 2 , k 1 2 e T τ 2 I k 1 , L Z 1 T C 1 , k 1 2 e T τ 2 a 5 = I k 1 , L Z 1 T ( Q ^ n , k ) 2
Based on the above derivation, a joint estimation method for SOC and SOH based on the SVDUKF-EKF under a multi-time scale is established. The steps within one cycle are as follows:
(1)
Initialize the states, parameters, and their corresponding error covariances:
θ ^ 0 = E ( θ 0 ) , P 0 θ = E [ ( θ 0 θ ^ 0 ) ( θ 0 θ ^ 0 ) T ] x ^ 0 , 0 = E ( x 0 , 0 ) , P 0 , 0 x = E [ ( x 0 , 0 x ^ 0 , 0 ) ( x 0 , 0 x ^ 0 , 0 ) T ]
(2)
At the macro-time scale, perform the one-step prediction for the parameters and their error covariance matrix using the EKF algorithm:
θ ^ k | k 1 = θ ^ k 1 P k | k 1 θ = P k 1 θ + Q k 1 θ
(3)
At the micro-time scale, perform the one-step prediction for the state and its error covariance matrix using the SVD-UKF algorithm:
(a)
Perform UT transformation using SVD decomposition to construct (2n + 1) Sigma points:
P k 1 , l 1 x = U k 1 , l 1 S k 1 , l 1 0 0 0 V k 1 , l 1 T
χ k 1 , l 1 0 = x ^ k 1 , l 1 χ k 1 , l 1 i = x ^ k 1 , l 1 + n + λ U k 1 , l 1 S k 1 , l 1 i , i = 1 , 2 , , n χ k 1 , l 1 i = x ^ k 1 , l 1 n + λ U k 1 , l 1 S k 1 , l 1 i , i = n + 1 , n + 2 , , 2 n
In the equation, n is the dimension of the state quantity, and λ is the scaling factor.
(b)
Calculate the mean and covariance of the one-step prediction of the state variables:
χ k 1 , l | l 1 i = f χ k 1 , l 1 i , u k 1 , l
x ^ k 1 , l | l 1 = i = 0 2 n ω m i χ k 1 , l | l 1 i P k 1 , l | l 1 x = i = 0 2 n ω c i χ k 1 , l | l 1 i x ^ k 1 , l | l 1 T + Q k 1 , l 1 x
(4)
Measurement update of the SVD-UKF algorithm under the micro-time scale:
(a)
Perform UT transformation again on the predicted mean and covariance using SVD decomposition to generate new (2n + 1) Sigma points:
P k 1 , l | l 1 x = U k 1 , l | l 1 S k 1 , l | l 1 0 0 0 V k 1 , l | l 1 T
χ k 1 , l | l 1 0 = x ^ k 1 , l | l 1 χ k 1 , l | l 1 i = x ^ k 1 , l | l 1 + n + λ U k 1 , l | l 1 S k 1 , l | l 1 i , i = 1 , 2 , , n χ k 1 , l | l 1 i = x ^ k 1 , l | l 1 n + λ U k 1 , l | l 1 S k 1 , l | l 1 i , i = n + 1 , n + 2 , , 2 n
(b)
Calculate the mean of the observation variables based on the (2n + 1) Sigma points obtained in step (a), and update the variance matrix:
y k 1 , l | l 1 i = g χ k 1 , l | l 1 i , u k 1 , l y ^ k 1 , l | l 1 = i = 0 2 n ω m i y k 1 , l | l 1 i
P y y x = i = 0 2 n ω c i y k 1 , l | l 1 i y ^ k 1 , l | l 1 y k 1 , l | l 1 i y ^ k 1 , l | l 1 T + R k 1 , l 1 x P x y x = i = 0 2 n ω c i χ k 1 , l | l 1 i x ^ k 1 , l | l 1 y k 1 , l | l 1 i y ^ k 1 , l | l 1 T
(c)
Calculate the Kalman gain, and update the system state and error covariance:
K k 1 , l x = P x y x P y y x
x ^ k 1 , l = x ^ k 1 , l | l 1 + K k 1 , l x y k 1 , l y ^ k 1 , l | l 1 P k 1 , l x = P k 1 , l | l 1 x K k 1 , l x P y y x K k 1 , l x
(d)
Repeat steps (a)–(c) in (4) until l = L Z , then exit the micro-time scale state estimation and set:
y ^ k , 0 = y ^ k 1 , L Z , x ^ k , 0 = x ^ k 1 , L Z
(5)
Measurement update of the EKF algorithm parameters and their error covariances under the macro-time scale:
y ^ k , 0 = g ( x ^ k , 0 , θ ^ k | k 1 , u k , 0 )
K k θ = P k | k 1 θ ( C k θ ) T ( C k θ P k | k 1 θ ( C k θ ) T + R k 1 θ )
θ ^ k = θ ^ k | k 1 + K k θ ( y k , 0 y ^ k , 0 )
P k θ = ( I K k θ C k θ ) P k | k 1 θ
(6)
Set k = k + 1 , then continue the iteration starting from step (2) until completion.

3. Results

Based on the established lithium-ion battery model and the aforementioned multi-time-scale SVDUKF-EKF joint estimation method, a joint estimation model was built in Matlab/Simulink (R2021a) to estimate SOC and SOH. The overall flow of the algorithm is shown in Figure 5. The joint estimation uses the SVDUKF on a micro-time scale to estimate the battery SOC, and the EKF on a macro-time scale to estimate battery parameters, including internal resistance, dual polarization impedance parameters, and current maximum available capacity. The two filters serve as inputs for each other and operate alternately, forming the SVDUKF-EKF algorithm.
Under the Dynamic Stress Test (DST) and Federal Urban Driving Schedule (FUDS) conditions, the proposed SVDUKF-EKF joint estimation algorithm was compared with the dual Extended Kalman Filter (EKF-EKF) method. The time conversion scale of both the EKF-EKF algorithm and the SVDUKF-EKF algorithm was set to 60 s.

3.1. DST Operating Condition Verification

To verify the multi-time-scale SVDUKF-EKF joint estimation algorithm under the DST condition, the initial SOC of the state estimators in both the SVDUKF-EKF and EKF-EKF algorithms is set to 80% (true SOC value: 100%), and the initial values of the parameter estimators are as follows: θ 0 = 0.028 0.049 3527.2 0.0058 255.1508 2.9 T . The impedance parameters are obtained through the AFFRLS method, with the initial value of the maximum available capacity set to 2.9 Ah (actual value: 2.9588 Ah). The simulation results are shown in Figure 6 and Figure 7.
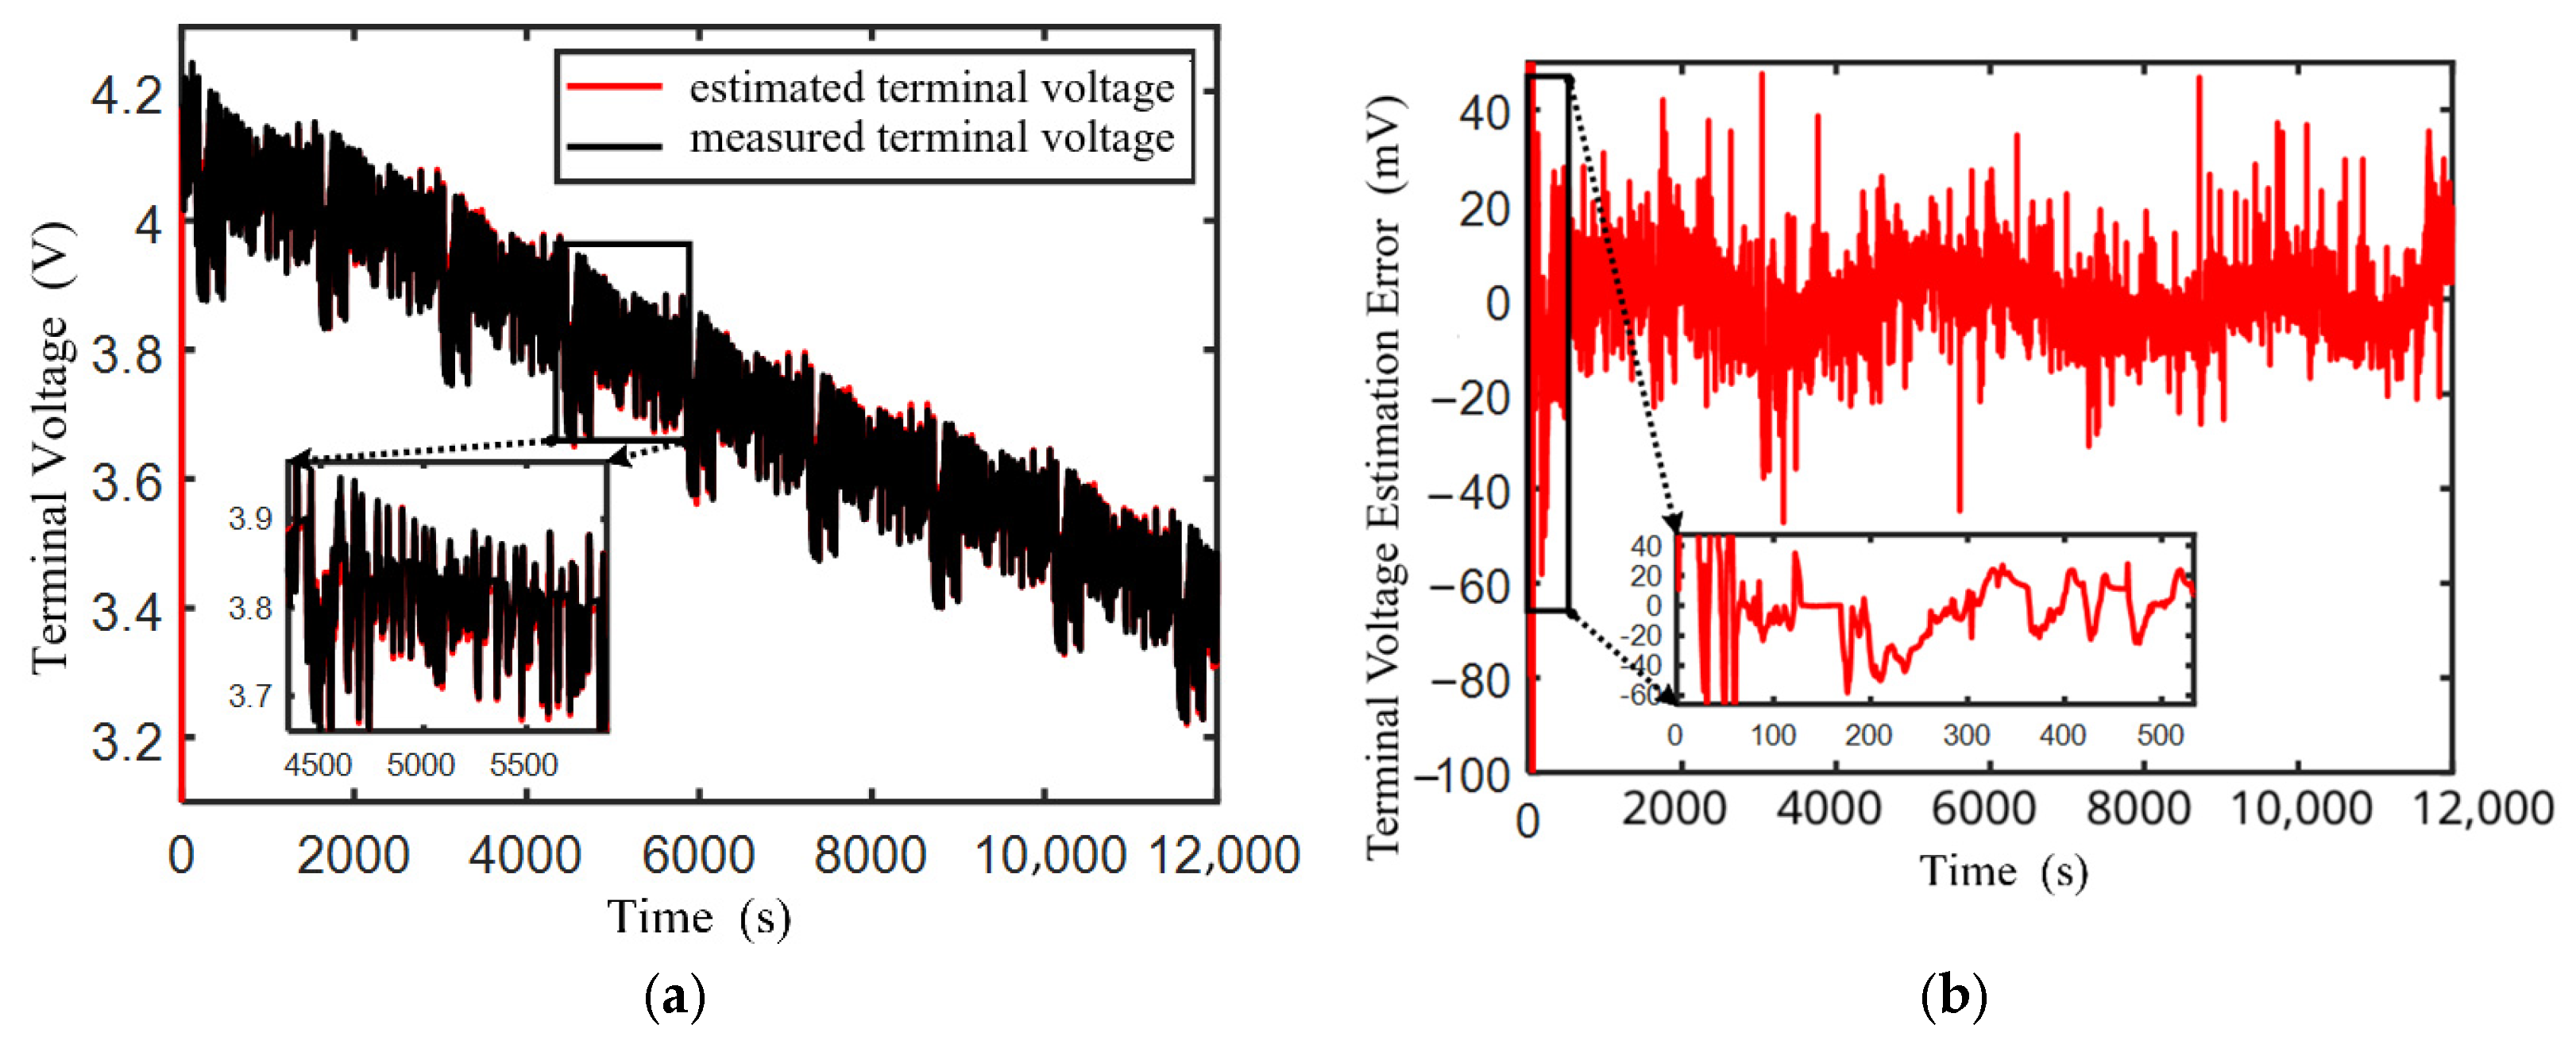
Figure 6 shows the terminal voltage estimation and its error of the multi-time-scale SVDUKF-EKF. It can be seen from the figure that under the DST condition, the algorithm can converge within 100 s, and the terminal voltage estimation error is basically within 50 mV. After 12,000 s, the terminal voltage error increases because the internal chemical reaction of the battery becomes intense when the SOC is lower than 20%.
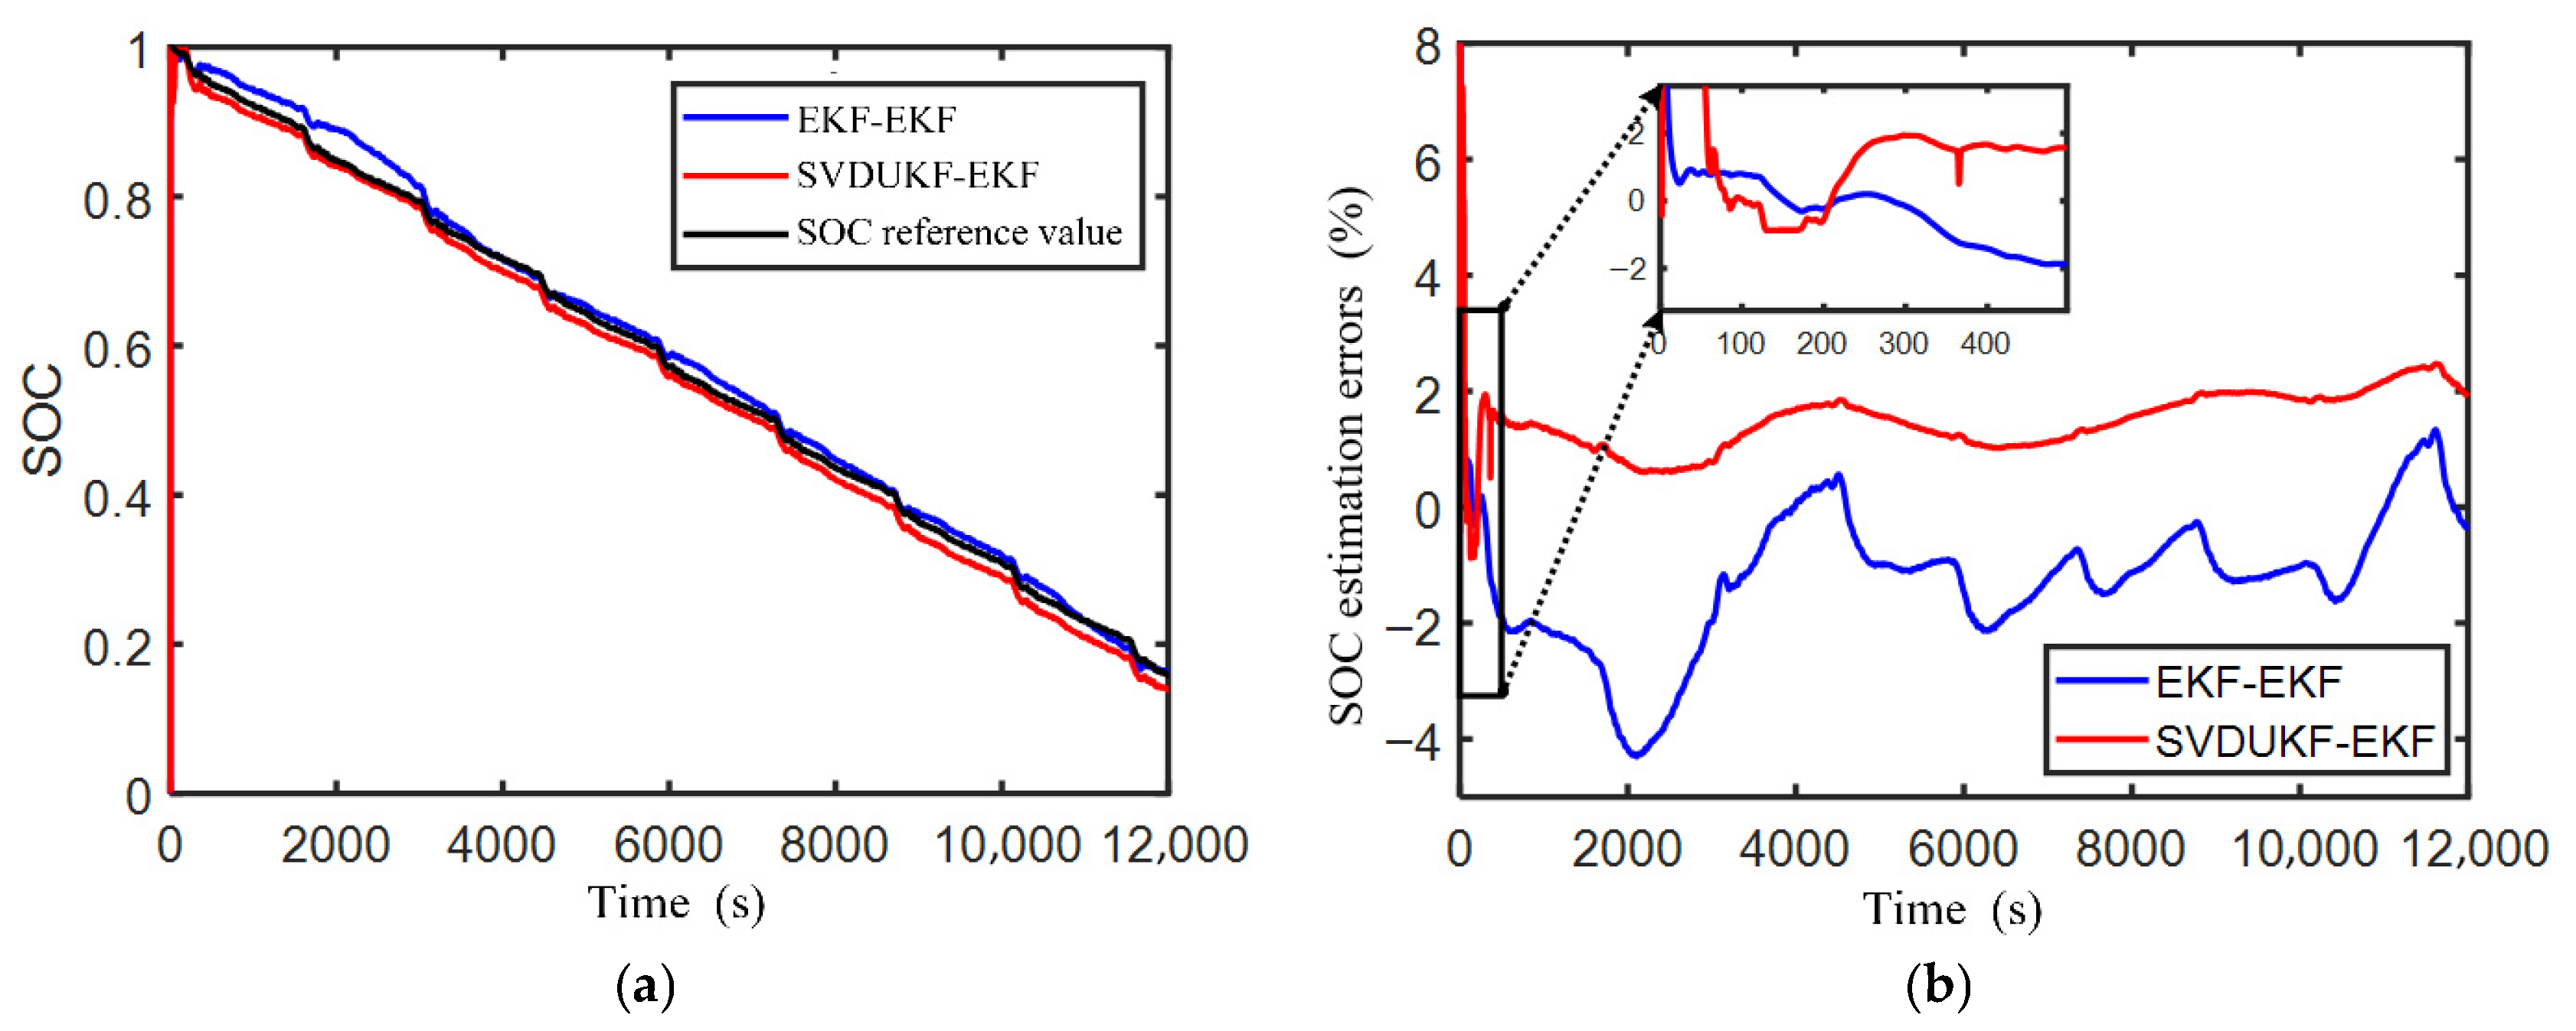
Figure 7 presents a comparison of SOC estimation between the multi-time-scale EKF-EKF and SVDUKF-EKF. After convergence, the Root Mean Square Error (RMSE), Mean Absolute Error (MAE), and maximum absolute error of SOC estimation for the two methods are listed in Table 1.
As can be seen from Figure 7 and Table 1, both the multi-time-scale SVDUKF-EKF and EKF-EKF can converge within 100 s. However, the SOC estimation accuracy of the SVDUKF-EKF is higher than that of the EKF-EKF, and its RMSE, MAE, and maximum absolute error are all lower than those of the EKF-EKF.
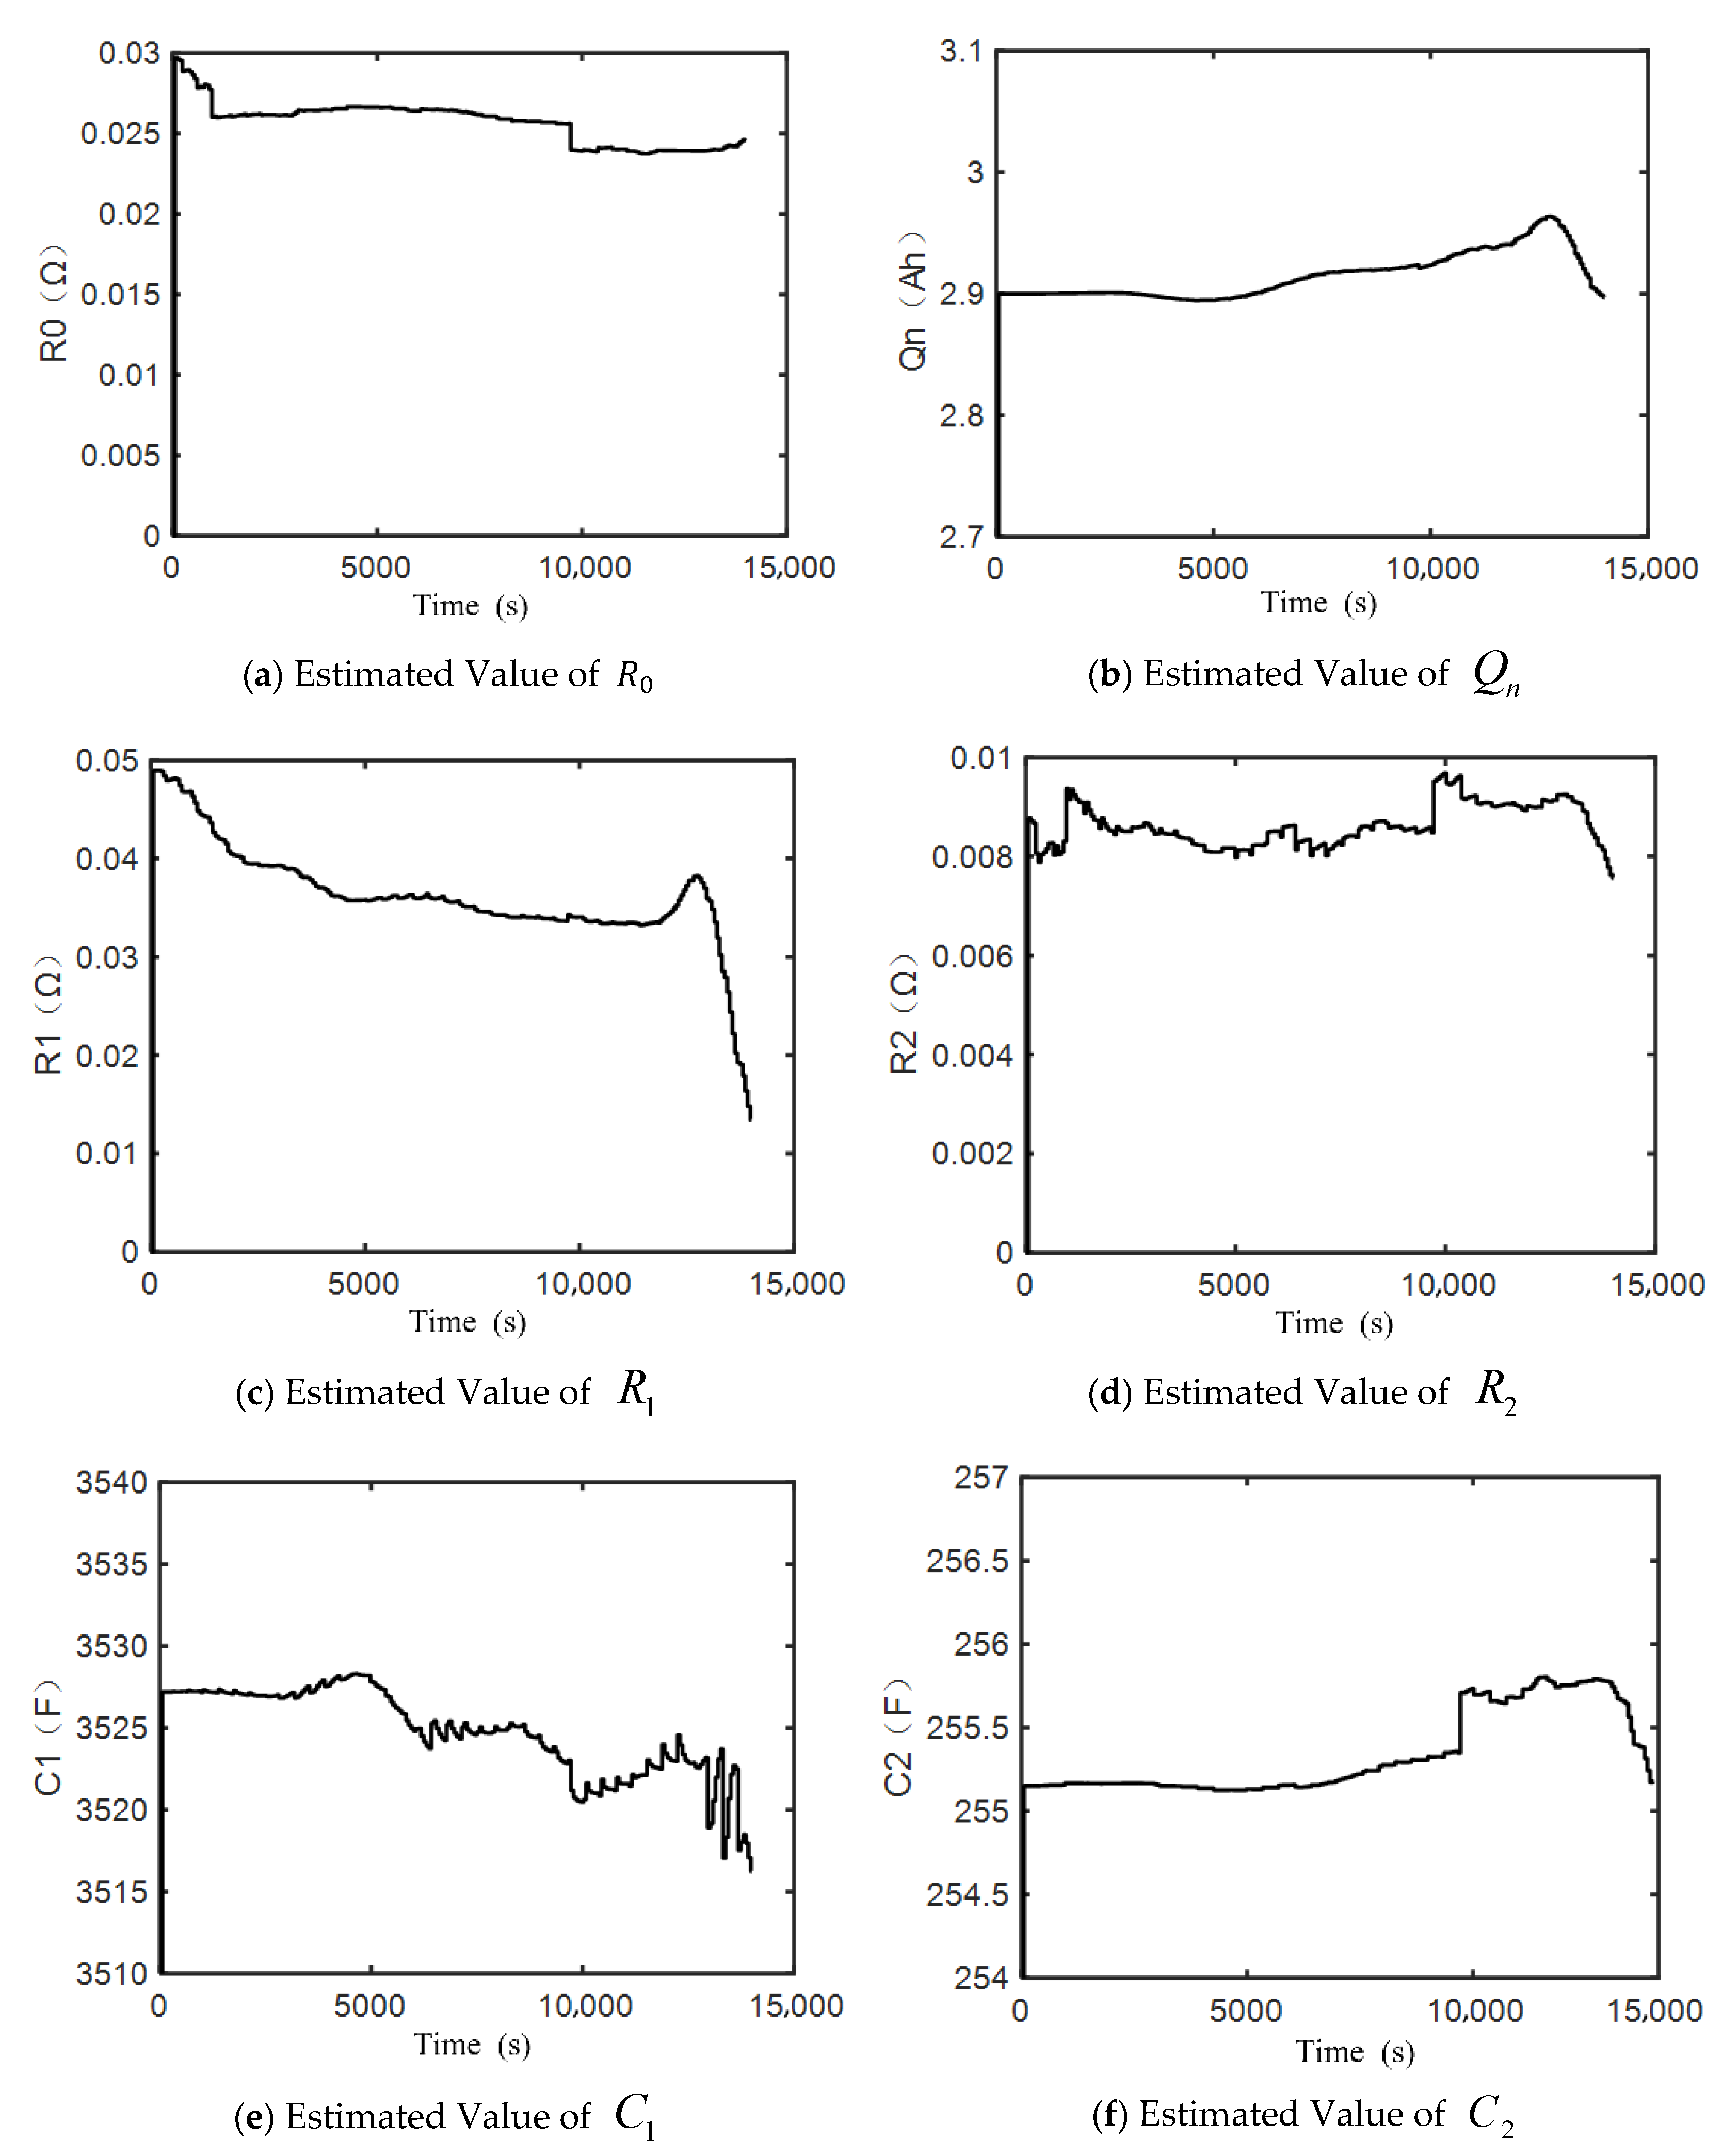
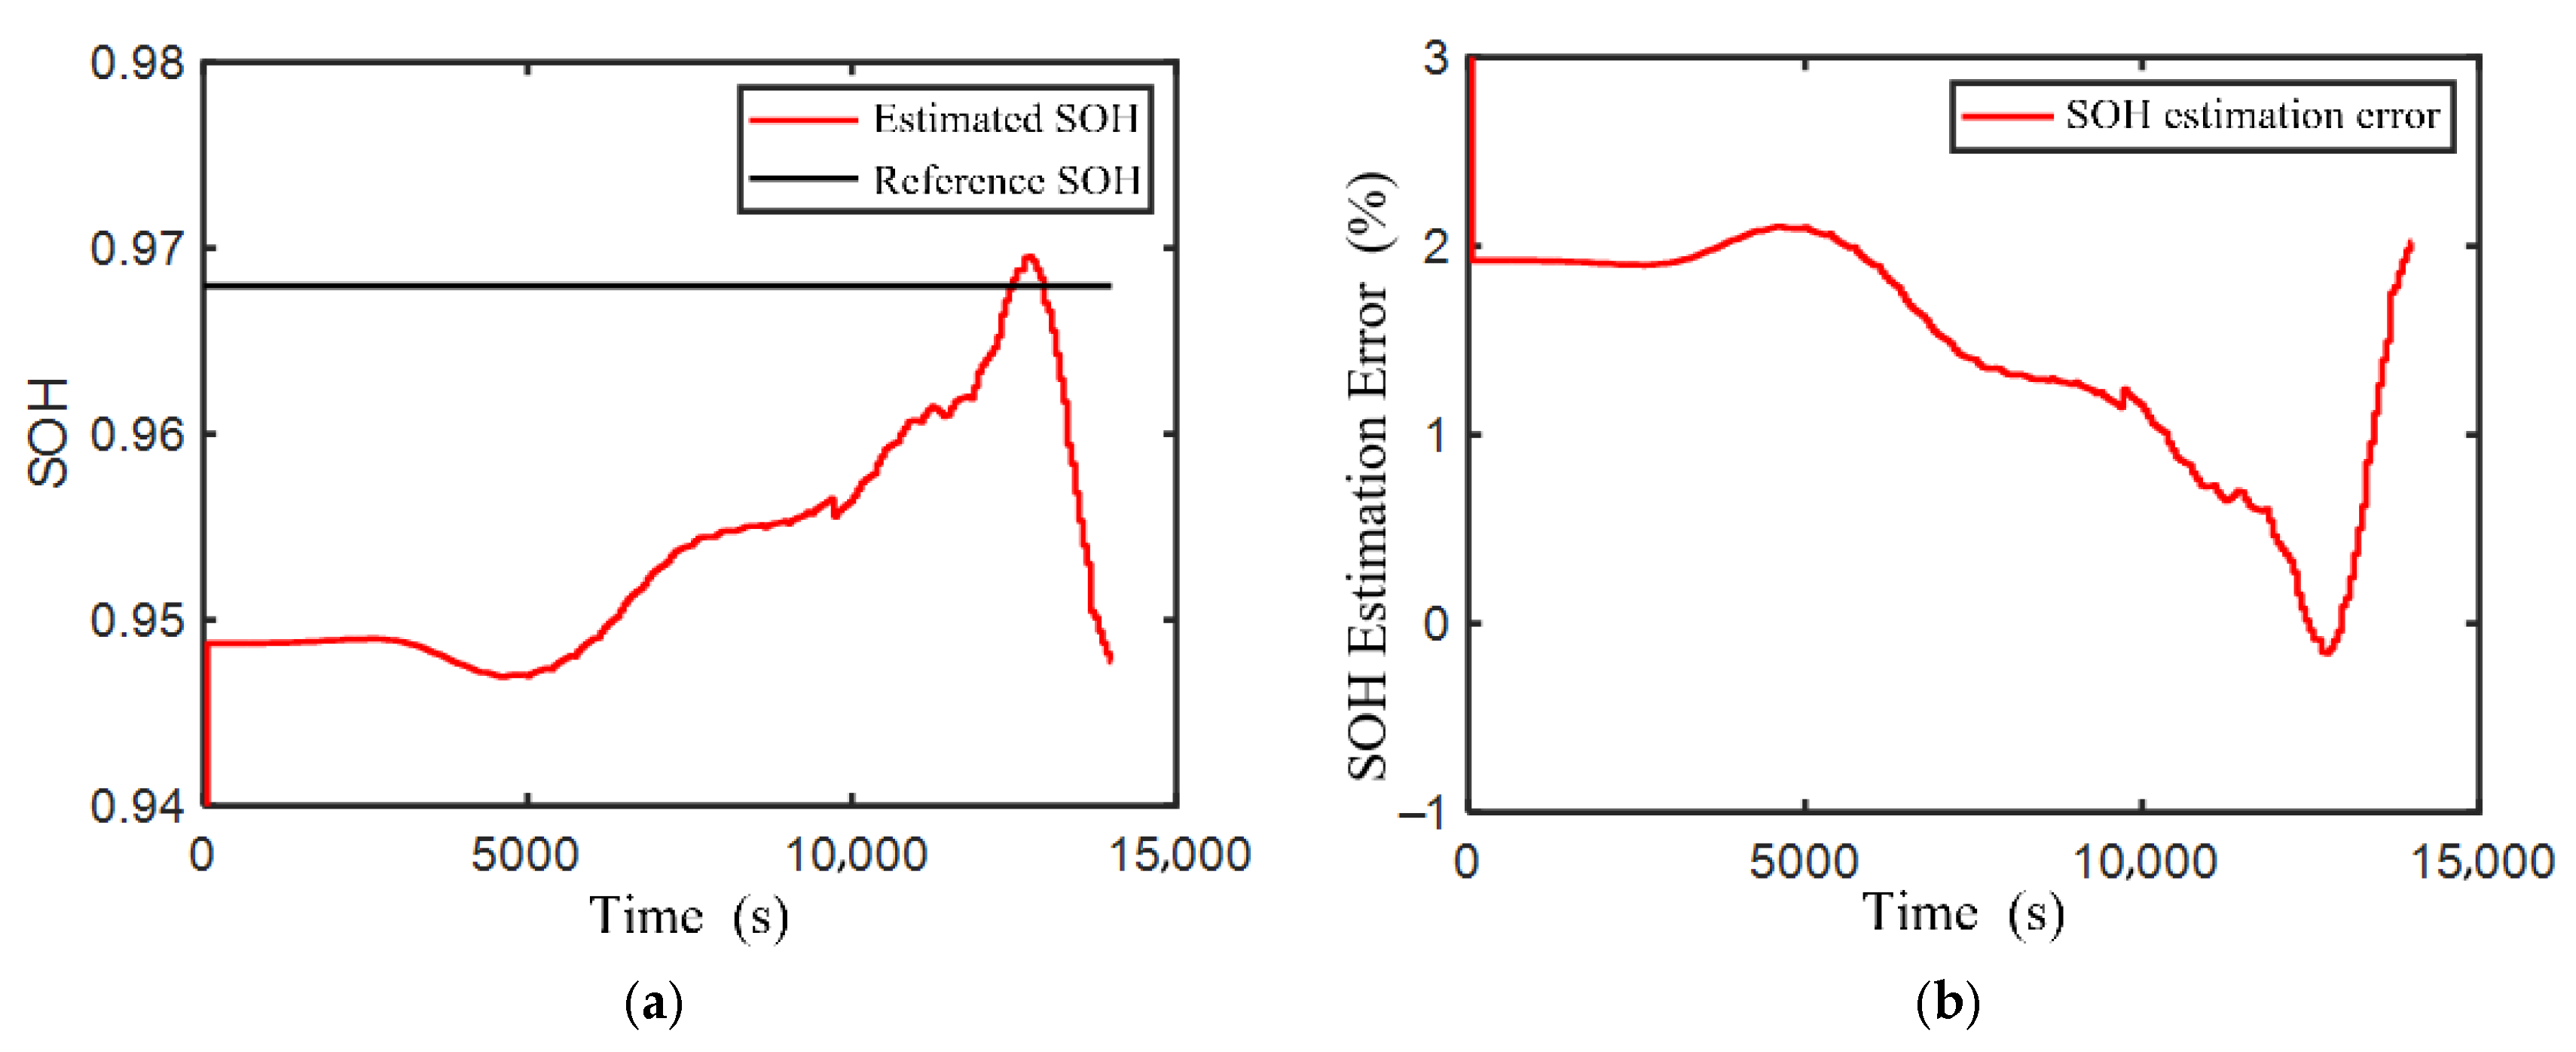
Figure 8 and Figure 9 show the parameter estimation and SOH estimation results of the SVDUKF-EKF algorithm when the initial capacity is set to 2.9 Ah. The SOH is obtained by dividing the estimated capacity by the initial capacity. It can be seen from Figure 9b that the SOH estimation error gradually decreases. After 12,000 s, due to the large deviation of the battery model caused by the low SOC, the SOH estimation error increases. However, the overall error remains within 2%, which confirms the effectiveness of the algorithm.

3.2. Validation Under FUDS Operating Condition

Similar to Section 3.1, to verify the accuracy of the algorithm under the FUDS operating condition, the initial SOC of the state estimator and the initial values of the parameter estimator are set to be consistent with those under the DST operating condition (with a true capacity of 3.0993 Ah). The simulation results are shown in Figure 10 and Figure 11.
Figure 10 shows the terminal voltage estimation and estimation error of the SVDUKF-EKF algorithm. It can be seen from the figure that under the FUDS operating condition, the terminal voltage estimation value of the multi-time-scale SVDUKF-EKF algorithm can converge within 100 s, and the terminal voltage estimation error generally does not exceed 40 mV, indicating high accuracy and a fast convergence speed. Figure 11 presents a comparison of SOC estimation results between the EKF-EKF and SVDUKF-EKF methods under the multi-time scale. After convergence, the Root Mean Square Error (RMSE), Mean Absolute Error (MAE), and maximum absolute error of the SOC estimation for the two methods are listed in Table 2. It can be concluded from Figure 11 and Table 2 that both the multi-time-scale SVDUKF-EKF and EKF-EKF algorithms can achieve SOC estimation convergence within 100 s. Compared with the EKF-EKF algorithm, the RMSE of the SOC estimation of the SVDUKF-EKF algorithm is reduced by 7.02%.
Figure 12 shows the SOH estimation results of the SVDUKF-EKF algorithm. At this time, the reference SOH is 100%, and the initial SOH is 93.57%. It can be seen from the figure that the SOH estimation error gradually decreases and can quickly converge to near the true value within 400 s. This indicates that the algorithm can quickly correct the initial SOH error, and the stabilized SOH estimation error is within 1%, which proves the effectiveness of the algorithm under the FUDS operating condition.

3.3. Robustness Verification

To verify the robustness of the SVDUKF-EKF algorithm, different initial SOC values were set, and a comparison was conducted between the SVDUKF-EKF algorithm and the EKF-EKF algorithm. The SOC estimation results of the two algorithms under the DST condition are shown in Figure 13 and Figure 14. Under the DST condition, when there is an error in the SOC, both algorithms can converge within 400 s. However, in general, the SVDUKF-EKF algorithm has a faster convergence speed and better robustness than the EKF-EKF algorithm.

4. Conclusions

During the battery aging process, changes in model parameters and capacity affect SOC estimation over the long term. Inaccurate estimation of SOC can lead to overcharging and over-discharging of the battery pack, thereby affecting the battery’s SOH. This paper establishes a joint estimation method for SOC and SOH based on the SVDUKF-EKF under a multi-time scale. It uses a SVDUKF on a micro-time scale to estimate the battery’s SOC and an EKF on a macro-time scale to estimate impedance parameters and capacity. The two filters operate alternately, with the output of each serving as an input to the other. The joint estimation method directly handles the dynamic relationship between SOC and SOH simultaneously at the model or algorithm level, enabling real-time interaction and update between the two. The joint estimation method was validated under DST and FUDS conditions, and the results show that it has high estimation accuracy and stability under both conditions.

Author Contributions

Conceptualization, H.Q.; methodology, H.Q.; software, K.L.; validation, K.L. and S.W.; investigation, S.W.; data curation, K.L.; writing—original draft preparation, H.Q.; writing—review and editing, F.J.; supervision, F.J.; project administration, F.J. All authors have read and agreed to the published version of the manuscript.

Funding

This research received no external funding.

Conflicts of Interest

The authors declare no conflict of interest.

References

  1. Zhou, N.; Wu, Q.; Hu, X. Research on the Policy Evolution of China’s New Energy Vehicles Industry. Sustainability 2020, 12, 3629. [Google Scholar] [CrossRef]
  2. Zhao, X.; Li, M.; Yu, Q.; Ma, J.; Wang, S. State Estimation of Power Lithium Batteries for Electric Vehicles: A Review. China J. Highw. Transp. 2023, 36, 254–283. [Google Scholar] [CrossRef]
  3. Zou, Y.; Hu, X.; Ma, H.; Li, S.E. Combined State of Charge and State of Health estimation over lithium-ion battery cell cycle lifespan for electric vehicles. J. Power Sources 2015, 273, 793–803. [Google Scholar] [CrossRef]
  4. Zeng, J.; Liu, S. Research on aging mechanism and state of health prediction in lithium batteries. J. Energy Storage 2023, 72, 108274. [Google Scholar] [CrossRef]
  5. Hannan, M.A.; Lipu, M.S.H.; Hussain, A.; Mohamed, A. A review of lithium-ion battery state of charge estimation and management system in electric vehicle applications: Challenges and recommendations. Renew. Sustain. Energy Rev. 2017, 78, 834–854. [Google Scholar] [CrossRef]
  6. Zhang, R.; Xia, B.; Li, B.; Cao, L.; Lai, Y.; Zheng, W.; Wang, H.; Wang, W. State of the Art of Lithium-Ion Battery SOC Estimation for Electrical Vehicles. Energies 2018, 11, 1820. [Google Scholar] [CrossRef]
  7. He, J.; Wan, K.; Lu, L.; Yu, M. An Online OCV Calibration-Based Adaptive SOC Estimation Approach for Lithium Battery. In Proceedings of the 2023 8th International Conference on Power and Renewable Energy (ICPRE), Shanghai, China, 22–25 September 2023. [Google Scholar] [CrossRef]
  8. Zhang, C.; Jiang, J.; Zhang, L.; Liu, S.; Wang, L.; Loh, P. A Generalized SOC-OCV Model for Lithium-Ion Batteries and the SOC Estimation for LNMCO Battery. Energies 2016, 9, 900. [Google Scholar] [CrossRef]
  9. Rodrigues, S.; Munichandraiah, N.; Shukla, A.K. A review of state-of-charge indication of batteries by means of a.c. impedance measurements. J. Power Sources 2000, 87, 12–20. [Google Scholar] [CrossRef]
  10. Chen, D.; Gao, W.; Zhang, C.; Chen, L. SOC estimation of lithium battery based on double modified ampere-hour integral method. In Proceedings of the 2022 37th Youth Academic Annual Conference of Chinese Association of Automation (YAC), Beijing, China, 19–20 November 2022. [Google Scholar] [CrossRef]
  11. Gao, Y.; Plett, G.L.; Fan, G.; Zhang, X. Enhanced state-of-charge estimation of LiFePO4 batteries using an augmented physics-based model. J. Power Sources 2022, 544, 231889. [Google Scholar] [CrossRef]
  12. Jokar, A.; Rajabloo, B.; Désilets, M.; Lacroix, M. Review of simplified Pseudo-two-Dimensional models of lithium-ion batteries. J. Power Sources 2016, 327, 44–55. [Google Scholar] [CrossRef]
  13. Zhao, X.; Sun, B.; Zhang, W.; He, X.; Ma, S.; Zhang, J.; Liu, X. Error theory study on EKF-based SOC and effective error estimation strategy for Li-ion batteries. Appl. Energy 2024, 353, 121992. [Google Scholar] [CrossRef]
  14. Hong, S.; Qin, C.; Dai, H.; Lai, X. SOC estimation of lithium-ion batteries based on the condition of vessels. In Proceedings of the 2022 5th International Conference on Data Science and Information Technology (DSIT), Shanghai, China, 22–24 July 2022. [Google Scholar] [CrossRef]
  15. Yan, W.; Zhang, B.; Zhao, G.; Tang, S.; Niu, G.; Wang, X. A Battery Management System with a Lebesgue-Sampling-Based Extended Kalman Filter. IEEE Trans. Ind. Electron. 2019, 66, 3227–3236. [Google Scholar] [CrossRef]
  16. Plett, G. Extended Kalman filtering for battery management systems of LiPB-based HEV battery packs: Part 1. Background. J. Power Sources 2004, 134, 252–261. [Google Scholar] [CrossRef]
  17. Ye, M.; Guo, H.; Xiong, R.; Yu, Q. A double-scale and adaptive particle filter-based online parameter and state of charge estimation method for lithium-ion batteries. Energy 2018, 144, 789–799. [Google Scholar] [CrossRef]
  18. Kim, T.; Wang, Y.; Sahinoglu, Z.; Wada, T.; Hara, S.; Qiao, W. State of Charge Estimation Based on a Real-time Battery Model and Iterative Smooth Variable Structure Filter. In Proceedings of the 2014 IEEE Innovative Smart Grid Technologies—Asia (ISGT ASIA), Kuala Lumpur, Malaysia, 20–23 May 2014. [Google Scholar] [CrossRef]
  19. Yu, Q.; Xiong, R.; Lin, C.; Shen, W.; Deng, J. Lithium-Ion Battery Parameters and State-of-Charge Joint Estimation Based on H-Infinity and Unscented Kalman Filters. IEEE Trans. Veh. Technol. 2017, 66, 8693–8701. [Google Scholar] [CrossRef]
  20. Du, J.; Liu, Z.; Wang, Y.; Wen, C. An adaptive sliding mode observer for lithium-ion battery state of charge and state of health estimation in electric vehicles. Control Eng. Pract. 2016, 54, 81–90. [Google Scholar] [CrossRef]
  21. Hu, X.; Sun, F.; Zou, Y. Estimation of State of Charge of a Lithium-Ion Battery Pack for Electric Vehicles Using an Adaptive Luenberger Observer. Energies 2010, 3, 1586–1603. [Google Scholar] [CrossRef]
  22. Lipu, M.S.H.; Hannan, M.A.; Hussain, A.; Ayob, A.; Saad, M.H.; Karim, T.F.; How, D.N. Data-driven state of charge estimation of lithium-ion batteries: Algorithms, implementation factors, limitations and future trends. J. Clean. Prod. 2020, 277, 124110. [Google Scholar] [CrossRef]
  23. Yang, F.; Li, W.; Li, C.; Miao, Q. State-of-charge estimation of lithium-ion batteries based on gated recurrent neural network. Energy 2019, 175, 66–75. [Google Scholar] [CrossRef]
  24. Feng, F.; Teng, S.; Liu, K.; Xie, J.; Xie, Y.; Liu, B.; Li, K. Co-estimation of lithium-ion battery state of charge and state of temperature based on a hybrid electrochemical-thermal-neural-network model. J. Power Sources 2020, 455, 227935. [Google Scholar] [CrossRef]
  25. Zhang, Z.; Cao, R.; Zheng, Y.; Zhang, L.; Guang, H.; Liu, X.; Gao, X.; Yang, S. Online state of health estimation for lithium-ion batteries based on gene expression programming. Energy 2024, 294, 130790. [Google Scholar] [CrossRef]
  26. Vidal, C.; Malysz, P.; Kollmeyer, P.; Emadi, A. Machine Learning Applied to Electrified Vehicle Battery State of Charge and State of Health Estimation: State-of-the-Art. IEEE Access 2020, 8, 52796–52814. [Google Scholar] [CrossRef]
  27. Wittman, R.M.; Fresquez, A.; Chalamala, B.; Preger, Y. Update on Systematic Cycle and Calendar Aging of NMC and NCA 18650 Li-Ion Batteries. ECS Meet. Abstr. 2022, MA2022-02, 228. [Google Scholar] [CrossRef]
  28. He, J.; Meng, S.; Li, X.; Yan, F. Partial Charging-Based Health Feature Extraction and State of Health Estimation of Lithium-Ion Batteries. IEEE J. Emerg. Sel. Top. Power Electron. 2023, 11, 166–174. [Google Scholar] [CrossRef]
  29. Sun, R.; Chen, J.; Li, B.; Piao, C. State of health estimation for Lithium-ion batteries based on novel feature extraction and BiGRU-Attention model. Energy 2025, 319, 134756. [Google Scholar] [CrossRef]
  30. Deng, Y.; Ying, H.; E, J.; Zhu, H.; Wei, K.; Chen, J.; Zhang, F.; Liao, G. Feature parameter extraction and intelligent estimation of the State-of-Health of lithium-ion batteries. Energy 2019, 176, 91–102. [Google Scholar] [CrossRef]
  31. Zhang, S.; Zhai, B.; Guo, X.; Wang, K.; Peng, N.; Zhang, X. Synchronous estimation of state of health and remaining useful lifetime for lithium-ion battery using the incremental capacity and artificial neural networks. J. Energy Storage 2019, 26, 100951. [Google Scholar] [CrossRef]
  32. Fahmy, H.M.; Hasanien, H.M.; Alsaleh, I.; Ji, H.; Alassaf, A. State of health estimation of lithium-ion battery using dual adaptive unscented Kalman filter and Coulomb counting approach. J. Energy Storage 2024, 88, 111557. [Google Scholar] [CrossRef]
  33. Zheng, X.; Deng, X. State-of-Health Prediction For Lithium-Ion Batteries with Multiple Gaussian Process Regression Model. IEEE Access 2019, 7, 150383–150394. [Google Scholar] [CrossRef]
  34. Zhang, Y.; Wang, Y.; Xia, Y.; Chen, W. A deep learning approach to estimate the state of health of lithium-ion batteries under varied and incomplete working conditions. J. Energy Storage 2023, 58, 106323. [Google Scholar] [CrossRef]
  35. Wang, S.; Wang, P.; Wang, L.; Li, K.; Xie, H.; Jiang, F. An enhanced deep learning framework for state of health and remaining useful life prediction of lithium-ion battery based on discharge fragments. J. Energy Storage 2025, 107, 114952. [Google Scholar] [CrossRef]
  36. Liu, X.; Li, S.; Tian, J.; Wei, Z.; Wang, P. Health estimation of lithium-ion batteries with voltage reconstruction and fusion model. Energy 2023, 282, 128216. [Google Scholar] [CrossRef]
  37. Feng, X.; Weng, C.; He, X.; Han, X.; Lu, L.; Ren, D.; Ouyang, M. Online State-of-Health Estimation for Li-Ion Battery Using Partial Charging Segment Based on Support Vector Machine. IEEE Trans. Veh. Technol. 2019, 68, 8583–8592. [Google Scholar] [CrossRef]
  38. Li, X.; Yuan, C.; Li, X.; Wang, Z. State of health estimation for Li-Ion battery using incremental capacity analysis and Gaussian process regression. Energy 2020, 190, 116467. [Google Scholar] [CrossRef]
  39. Fan, Y.; Xiao, F.; Li, C.; Yang, G.; Tang, X. A novel deep learning framework for state of health estimation of lithium-ion battery. J. Energy Storage 2020, 32, 101741. [Google Scholar] [CrossRef]
  40. Shen, J.; Ma, W.; Shu, X.; Shen, S.; Chen, Z.; Liu, Y. Accurate state of health estimation for lithium-ion batteries under random charging scenarios. Energy 2023, 279, 128092. [Google Scholar] [CrossRef]
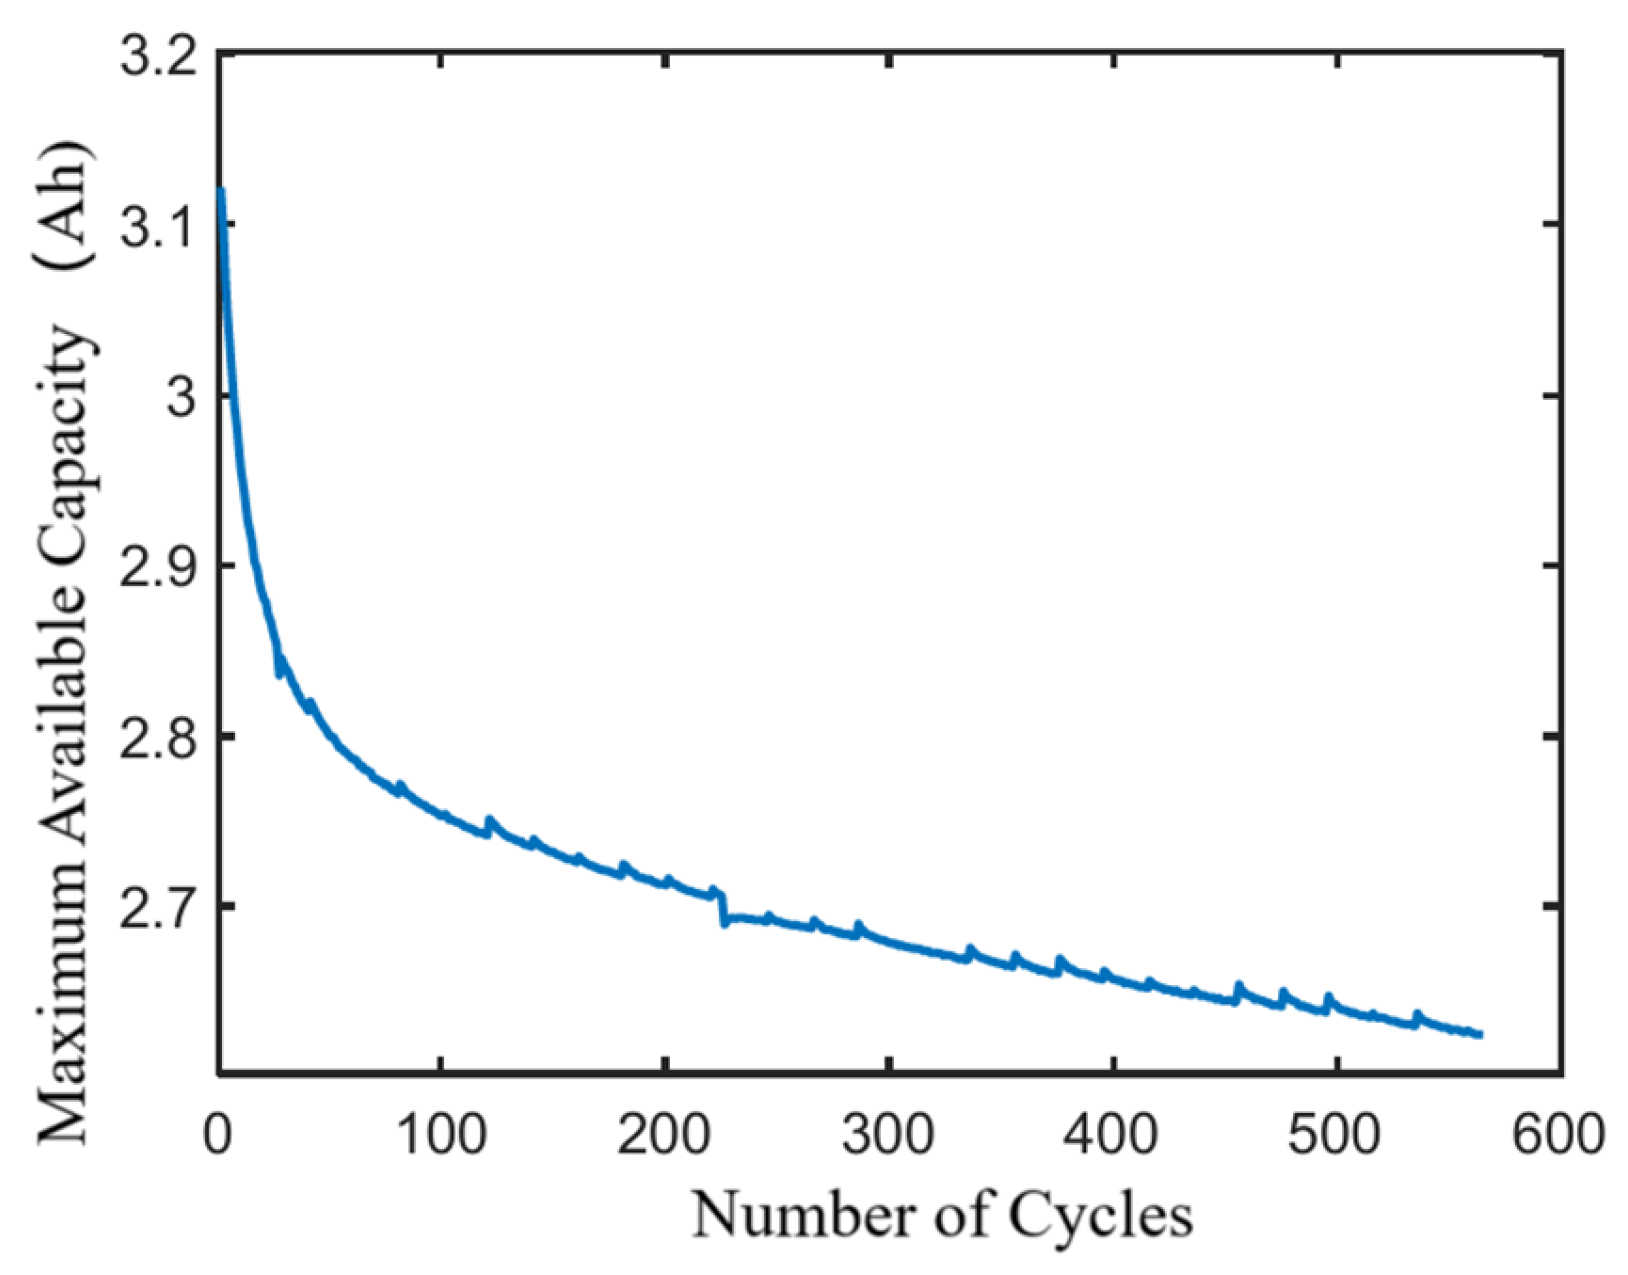
Figure 1. Battery Aging Curve.
Modelling 06 00100 g001
Figure 2. Relationship Diagram of OCV, SOC, and SOH. (a) SOC–OCV Curves Under Different Aging Degrees; (b) SOC–SOH–OCV Relationship Diagram.
Modelling 06 00100 g002
Figure 3. Second-Order RC Equivalent Circuit Model of Lithium-Ion Batteries.
Modelling 06 00100 g003
Figure 4. Principle of Multi-Time-Scale Joint Estimation.
Modelling 06 00100 g004
Figure 5. Joint Estimation of SOC and SOH Based on Multi-Time-Scale SVDUKF-EKF.
Modelling 06 00100 g005
Figure 6. Variations of terminal voltage and its error estimated by multi-time-scale SVDUKF-EKF under DST condition: (a) Comparison between estimated terminal voltage and measured terminal voltage; (b) Terminal voltage estimation error.
Modelling 06 00100 g006
Figure 7. SOC estimation results of EKF-EKF and SVDUKF-EKF under multi-time-scale DST condition: (a) Comparison between SOC estimates from the two methods and the reference value; (b) SOC estimation errors of the two methods.
Modelling 06 00100 g007
Figure 8. Parameter Estimation Results of SVDUKF-EKF Under Multi-Time-Scale DST Condition.
Modelling 06 00100 g008
Figure 9. SOH Estimation Results of SVDUKF-EKF Under Multi-Time-Scale DST Condition: (a) Comparison between SOH Estimate of SVDUKF-EKF and Reference Value; (b) SOH Estimation Error of SVDUKF-EKF.
Modelling 06 00100 g009
Figure 10. Variations of terminal voltage and estimation error from multi-time-scale SVDUKF-EKF joint estimation under FUDS operating condition: (a) Comparison between estimated terminal voltage and measured terminal voltage; (b) Terminal voltage estimation error.
Modelling 06 00100 g010
Figure 11. SOC estimation results of EKF-EKF and SVDUKF-EKF methods under multi-time scale in FUDS operating condition: (a) Comparison between SOC estimation values and reference values of the two methods; (b) SOC estimation errors of the two methods.
Modelling 06 00100 g011
Figure 12. SOH estimation results of the SVDUKF-EKF method under multi-time scale: (a) Comparison between SOH estimation and reference value of SVDUKF-EKF; (b) SOH estimation error of SVDUKF-EKF.
Modelling 06 00100 g012
Figure 13. Comparison of SOC Estimation Between the Two Methods Under Multi-Time-Scale Framework with Different Initial SOC Values.
Modelling 06 00100 g013
Figure 14. Comparison of SOC Estimation Errors Between the Two Methods Under Multi-Time-Scale Framework with Different Initial SOC Values.
Modelling 06 00100 g014
Table 1. Comparison of SOC Estimation Errors Between the Two Algorithms Under DST Condition.
EKF-EKFSVDUKF-EKF
RMSE (%)1.90071.0531
MAE (%)1.71670.9710
Maximum Absolute Error (%)2.95131.7862
Table 2. Comparison of SOC Estimation Error Indicators Between the Two Algorithms Under FUDS Operating Condition.
EKF-EKFSVDUKF-EKF
RMSE (%)1.67891.5611
MAE (%)1.37231.4899
Maximum Absolute Error (%)4.30172.4738
Disclaimer/Publisher’s Note: The statements, opinions and data contained in all publications are solely those of the individual author(s) and contributor(s) and not of MDPI and/or the editor(s). MDPI and/or the editor(s) disclaim responsibility for any injury to people or property resulting from any ideas, methods, instructions or products referred to in the content.