Article

Seismic Resilience of Emergency Departments: A Case Study

1
UNESCO Office, Ministero dei Beni e delle Attività Culturali e del Turismo, 00186 Rome, Italy
2
Department of Architecture (DiDA), University of Florence, 50121 Firenze, Italy
*
Author to whom correspondence should be addressed.
Modelling 2024, 5(1), 315-338; https://doi.org/10.3390/modelling5010017
Submission received: 3 January 2024 / Revised: 9 February 2024 / Accepted: 20 February 2024 / Published: 22 February 2024

Abstract

:
In this work, the seismic resilience of the Emergency Department of a hospital complex located in Tuscany (Italy), including its nonstructural components and organizational features, has been quantified. Special attention has been paid to the ceilings, whose potential damage stood out in past earthquakes. A comprehensive metamodel has been set, which can relate all the considered parameters to the assumed response quantity, i.e., the waiting time of the yellow-code patients arriving at the Emergency Department in the hours immediately after the seismic event. The seismic resilience of the Emergency Department has been measured for potential earthquakes compatible with the seismic hazard of the area.

1. Introduction

The analysis of communities’ resilience has been widely investigated in recent years [1,2,3,4,5,6]. Resilience, despite including the proper contents of a risk mitigation analysis, extends its investigation to the capacity of a system to recover its properties and its functionality after a catastrophic event. Resilience analysis, therefore, represents a comprehensive approach to measuring the reliability of a system for a variety of possible risks and recovering its functionality.
Healthcare facilities are typical systems to represent through a resilience analysis due to their strategic role in their communities’ functionality, especially in case of emergency. Their capacity to recover satisfactory functionality after a catastrophic event depends on many factors, such as the interruption of utility systems (e.g., power and communication), damaged facilities (e.g., the collapse of the ambulance bay), fluctuating staff, and even the patients’ perception regarding the building’s safety. A resilience analysis of a care facility, therefore, must include many different issues [7], which can involve the health system’s organizational assets at the regional scale [8,9,10,11,12].
Most analyses, however, focus on specific aspects. Contributions devote most of their analysis to the structure [13,14], including eventually the nonstructural components [15,16,17,18,19,20,21]. Also, the behavioral “human” issues, in turn, have been the object of specific studies. In particular, the Institute of Medicine [22], e.g., the Office of the Assistant Secretary for Preparedness and Response [23], found some of the key vulnerabilities that can also affect a hospital’s functionality in case of emergency. A social network analysis focusing on the coordination between the emergency departments of different hospitals was used by Hossain and Kit [24] to examine the effect of group interaction on patients’ treatment. Fawcett and Oliveira [25] studied the impact of emergency organizations on the patients’ response.
The most recent contributions combine information coming from different areas [26,27,28,29,30], involving reliability analysis [31,32,33,34], Leontief model input-output analysis [35,36], network flow modeling [37], and dynamic simulations [38]. The Hugo framework [15] includes strategies and guidelines for mitigating the impact of disasters. It has achieved interesting results involving structural, nonstructural, and administrative vulnerability of hospitals by using the health facility vulnerability evaluation (HVE). Yavari et al. [39] proposed a metric for assessing post-disaster functionality based on four major interacting systems of hospitals: structural, nonstructural, lifelines, and personnel. Due to the lack of available data, however, the Authors did not include the personnel system in their case study.
The analysis proposed by Miniati and Iasio [18] accounts for damage to structural and nonstructural systems, as well as organizational factors (i.e., staffing levels, emergency plans, redundancies in equipment, etc.); the interdependencies among the involved subsystems, however, are based on experts’ opinions and not validated by real earthquakes yet. McCabe et al. [40] describe the “ready, willing, and able” framework, which, however, does not take into account physical damage. The first integration of “organizational resources” was introduced at the Multidisciplinary Centre for Earthquake Engineering Research [8].
The first quantitative evaluation of hospitals’ functionality was proposed by Cimellaro et al. [41], who described the quality of service as the sum of all the partial functionalities within the facility. The functionality is described as a function of the patient’s waiting time and the outcomes of their treatments. This approach was further developed in 2010 [3] with a performed-based metamodel, including both physical and organizational aspects. The correlation between these two fields is obtained by introducing proper “penalty factors” (PFs), defined after the conditional probabilities to have certain levels of damage. The total penalty factor affecting the organizational parameters results from a linear combination of the individual PFs, whose weight depends on the ratio between the cost of each component and the overall cost of the building.
Another approach to relate empirical data and functionality loss was suggested by Jacques et al. [28], who proposed a fault tree analysis based on three main contributing factors—staff, structure, and stuff—and three different kinds of events (top, basic, and intermediate ones). Each branch is associated with a subsystem representing a part of the total loss. The branches associated with staff include the availability of medical staff, support staff, and backup plans for staffing during an emergency. The branches associated with the structure account for damage to all physical spaces and support infrastructures associated with critical hospital services (power, water, inpatient wards, means of egress, etc.). Finally, the branches associated with stuff account for loss of supplies and damage to equipment.
The recovery process is oversimplified by using recovery functions that can fit the more accurate results obtained with the model by Miles and Chang [42]. The result is a complicated multidimensional performance limit state function that aims to provide a quantitative definition of resilience in a rational way based on an analytical function that can fit both technical and organizational aspects.
This study is based on the resilience definition proposed for the most challenging issues of this research, where the functionality of the system is represented through only one response parameter, which must be time-variable and representative of the quality of the whole system. The representative response quantity should be related to all the factors affecting the system. Therefore, the first step in a resilience analysis of a complex system is defining all its parts and relating their functionality to one of the whole systems. Each subsystem may require a different response quantity; in these cases, a common property to measure must be found, or at least a correlation among all the response quantities must be defined in order to control the system’s functionality through only one parameter.
Using the above framework, this work proposes an analysis of the resilience of the Emergency Department of the Sansepolcro Hospital (EDSH). The approach proposed by Bruneau et al. [8] has been selected, which describes resilience as the ability of the system to reduce the chances of a shock, to absorb a shock if it occurs (like an abrupt reduction of performance), and to recover quickly after a shock (to reestablish its normal performance). A prior work by the Authors [43] described the main systems introduced for representing the EDSH, together with the tools adopted for their quantification.
In that study, functionality was quantified in terms of waiting time (WT), i.e., the time patients spent in the emergency department waiting for rescue, which is a function of the EDSH’s organization and can be assessed with reference to ordinary and emergency conditions. The emergency was represented by an earthquake consistent with the area’s seismic hazard. In [43], a seismic event was considered to increase the arrival of patients and to induce a change in the EDSH’s organization. However, the effects of the earthquake on the seismic response of the building were not investigated, and the consequences of the damages suffered by the building on the rescue activity were not considered either.
This work analyzes the seismic response of the building, including both the structure, i.e., a 3D reinforced concrete frame, and some nonstructural constructive components, such as the ceilings and the cabinets, along with the effects of the seismic response of the building that has a direct impact on the functionality of the Emergency Department since some of its rooms can be rendered out of service, reducing the operational area. The work combines the effects of the assumed ground motions in terms of both the EDSH’s organization and the seismic response and measures the loss of functionality in terms of resilience.
The metamodel used to perform the analysis, described in Section 2, has been set and validated based on comprehensive information collected through 100 days of monitoring of the emergency department, which is a unique feature of the project.
The assumed seismic emergency is described in Section 3. The structural response of the structure is found by performing an Incremental Dynamic Analysis (IDA) and expressed through fragility curves. The seismic response of the nonstructural components is assessed in terms of the seismic acceleration measured at the floors where they are placed. The effects of the emergency on the organizational system, already presented in [43], are briefly summarized.
Finally, Section 4 presents the metrics assumed for the resilience assessment and shows the results obtained in the current analysis. The functionality of the EDSH when a catastrophic seismic event occurs has been checked by performing a Monte Carlo simulation, and the recovery of the functionality has been correlated to the assumed response parameter (WT).

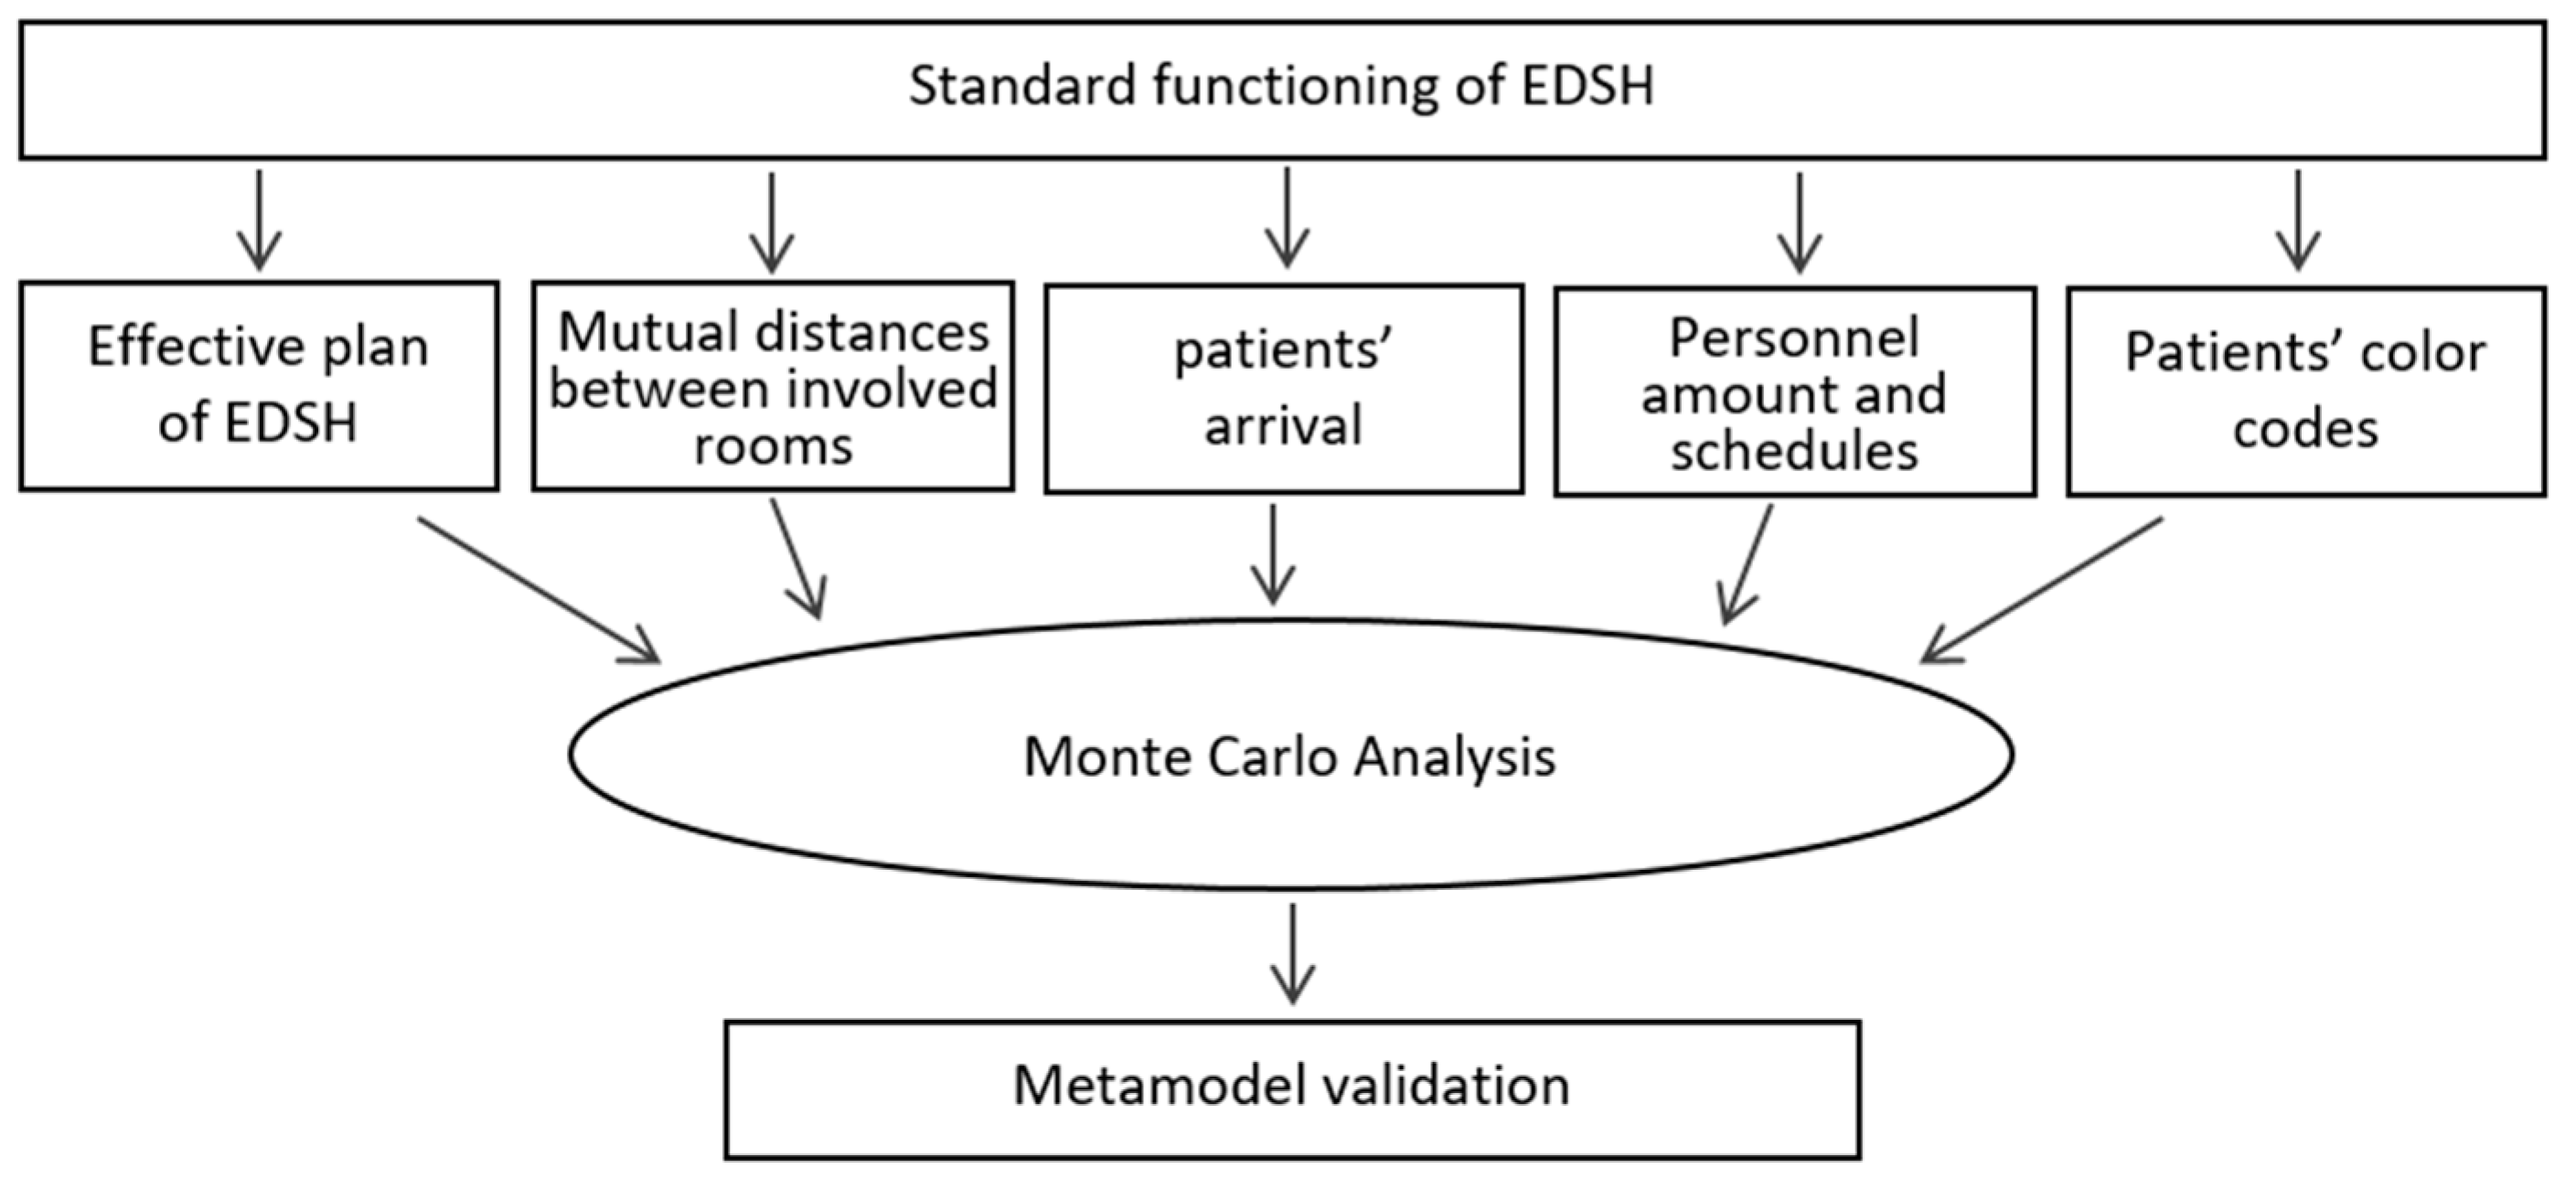
2. Proposed Metamodel and Edsh Functionality

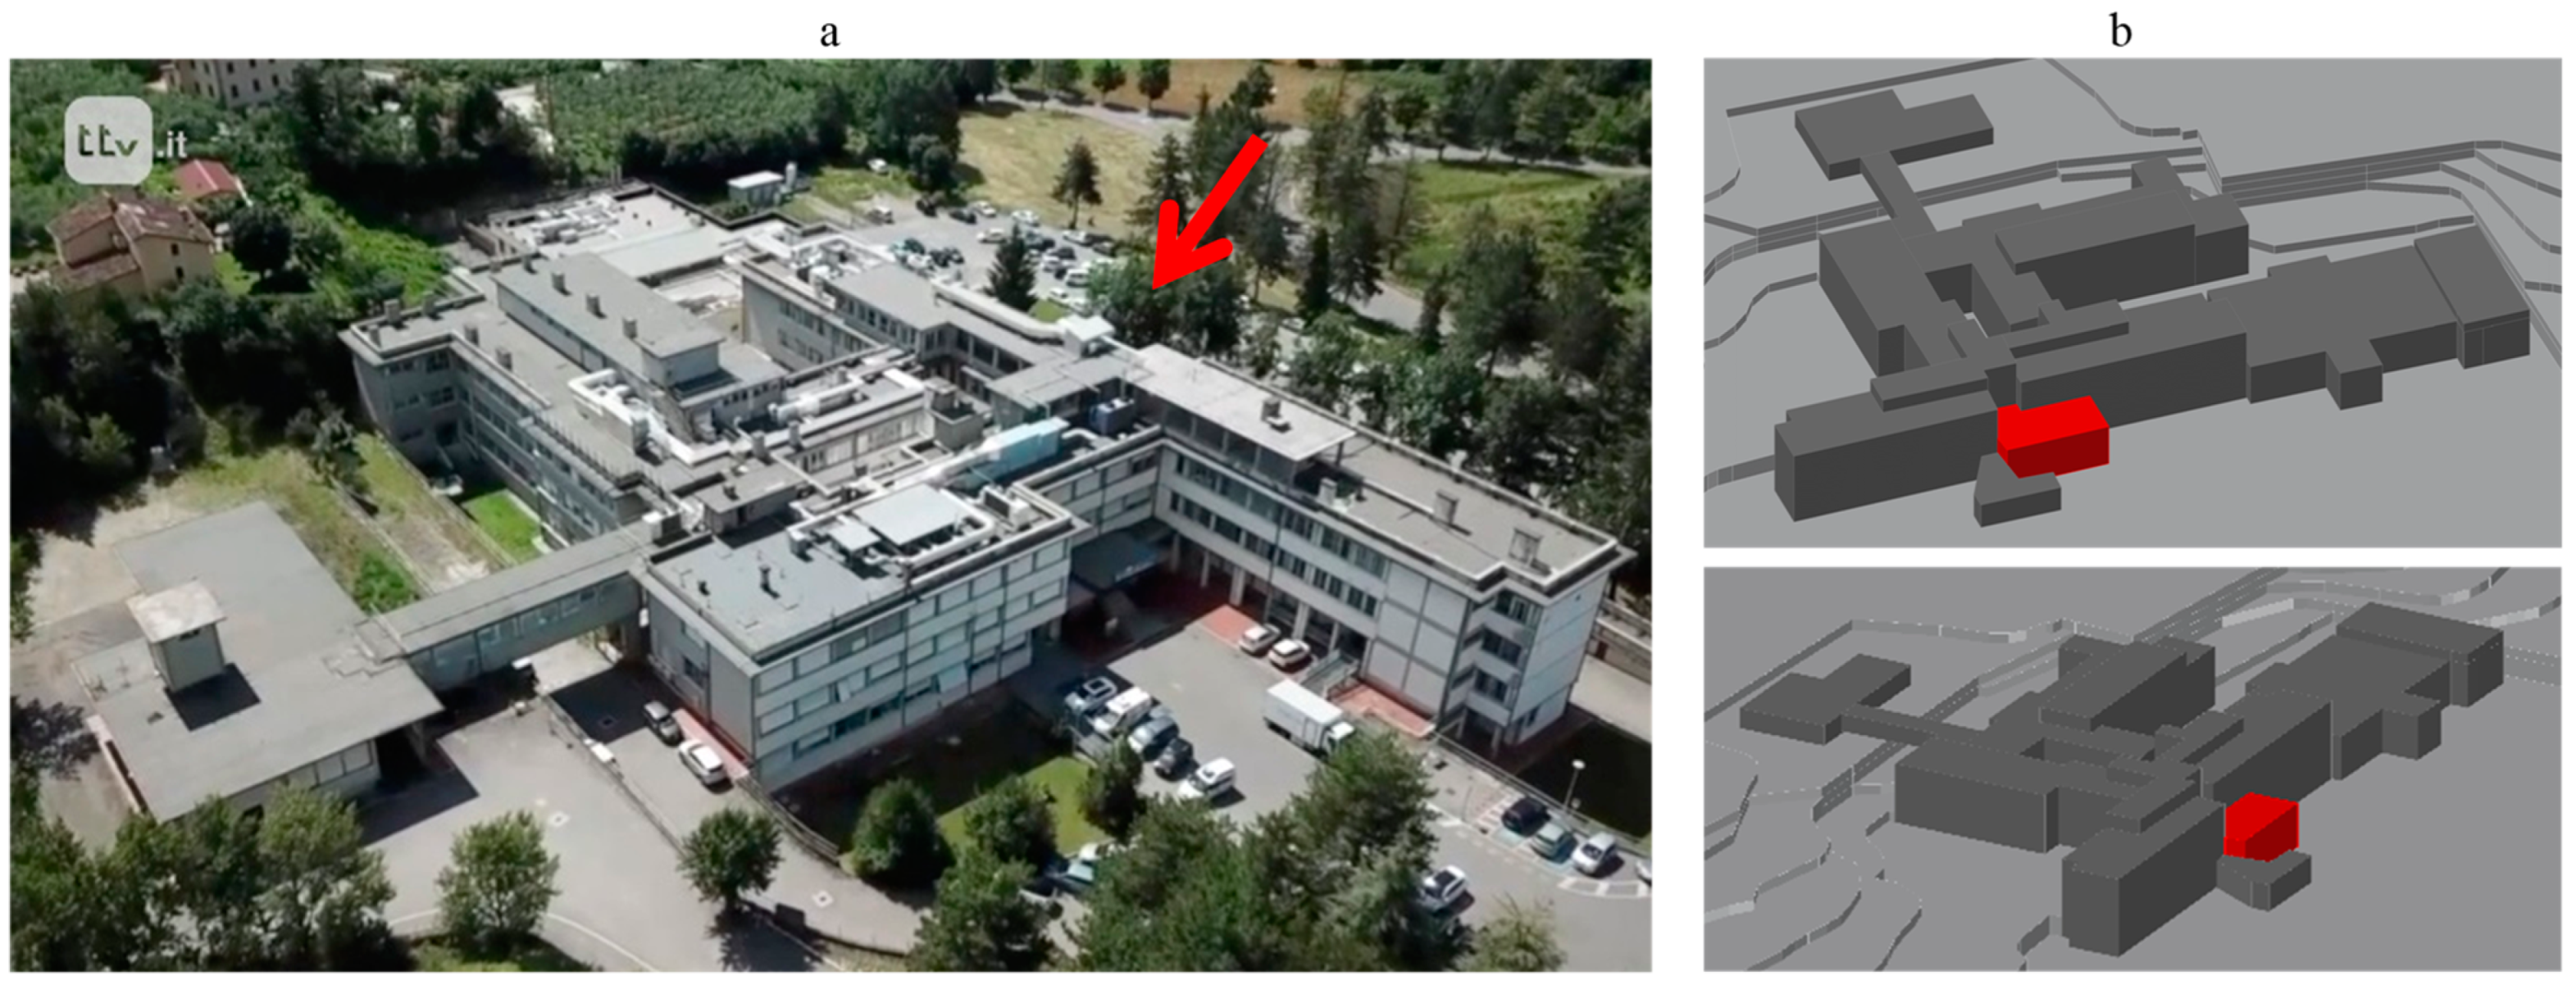
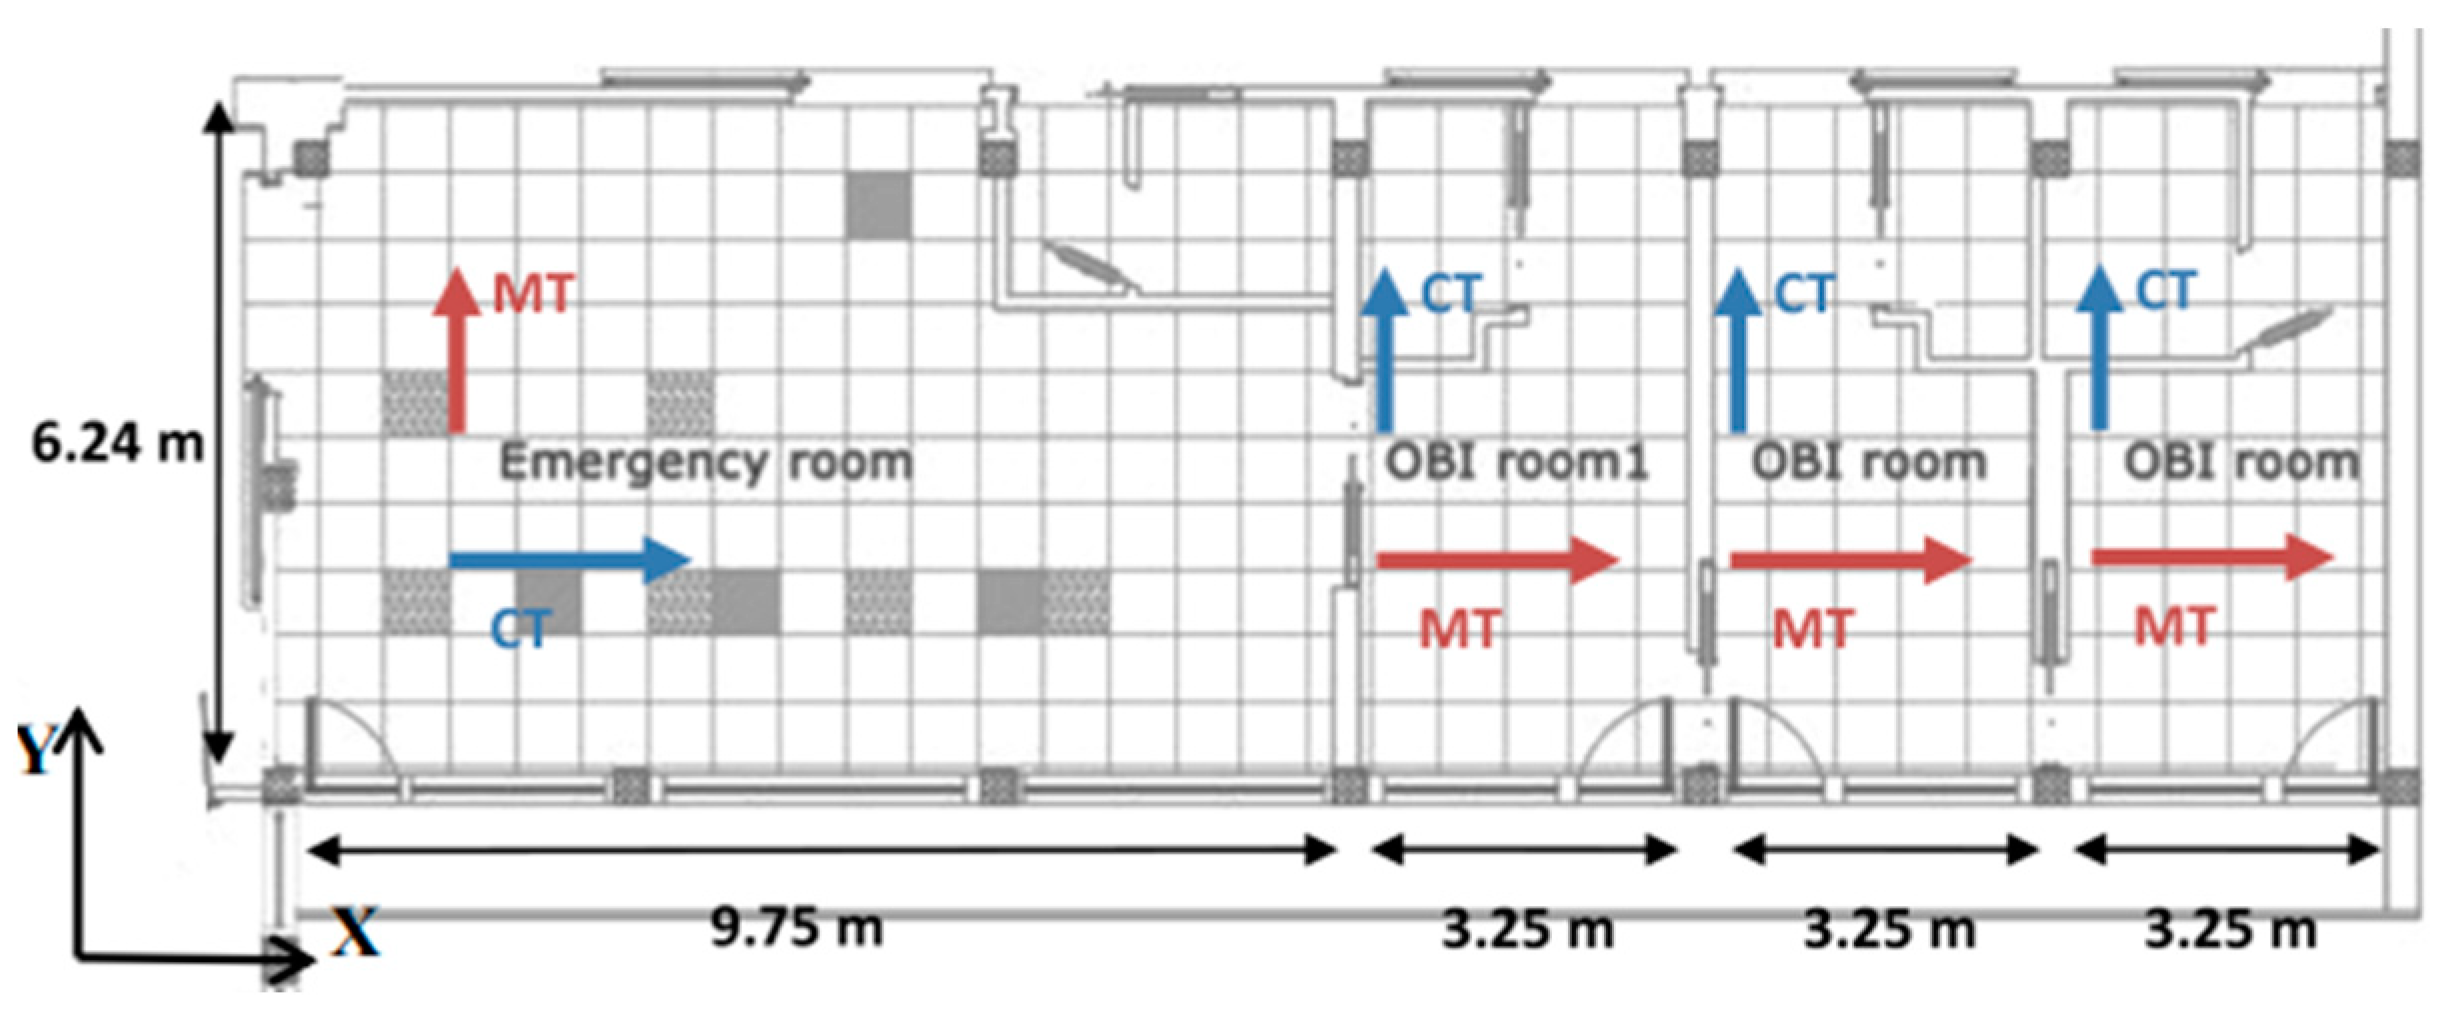
2.1. Case Study: Emergency Department of the Sansepolcro Hospital (EDSH)

The Sansepolcro Hospital, shown in Figure 1, is located in the area of Arezzo, in Tuscany (Italy), and it was constructed between 1962 and 1979, i.e., before the introduction of the modern seismic Codes, even if various restorations have been made successively. The hospital comprises 18 independent structural units, separated by structural construction joints with a thickness of about 10 cm.
Most of the units, such as the ones hosting the EDSH, are made of reinforced concrete. The building hosting the EDSH consists of a 2-storey RC framed structure. Additional construction details are available in [43].

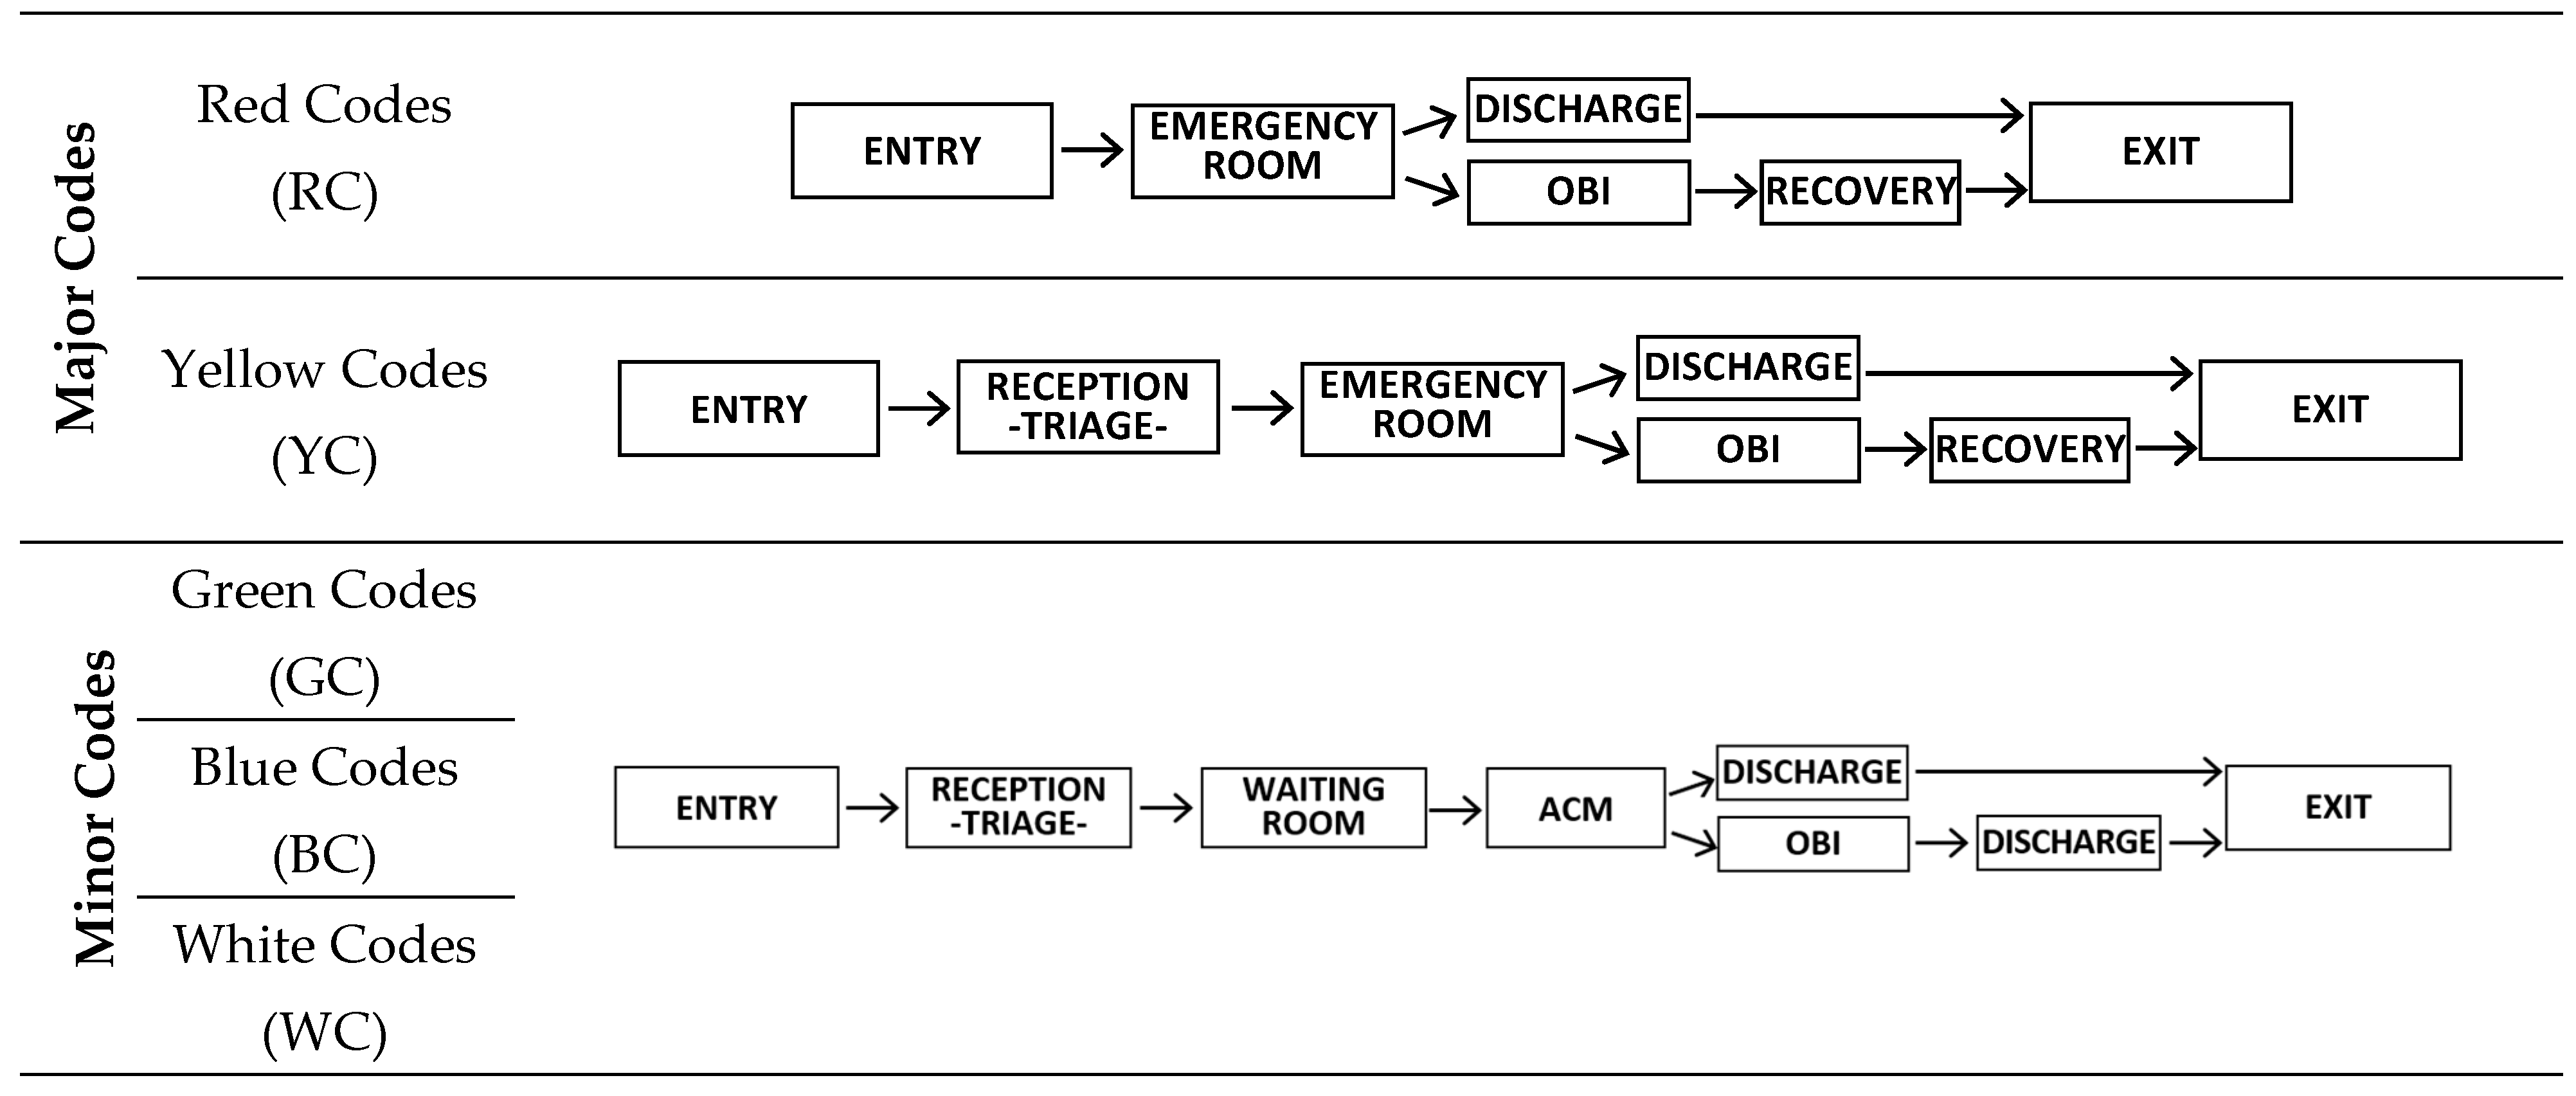
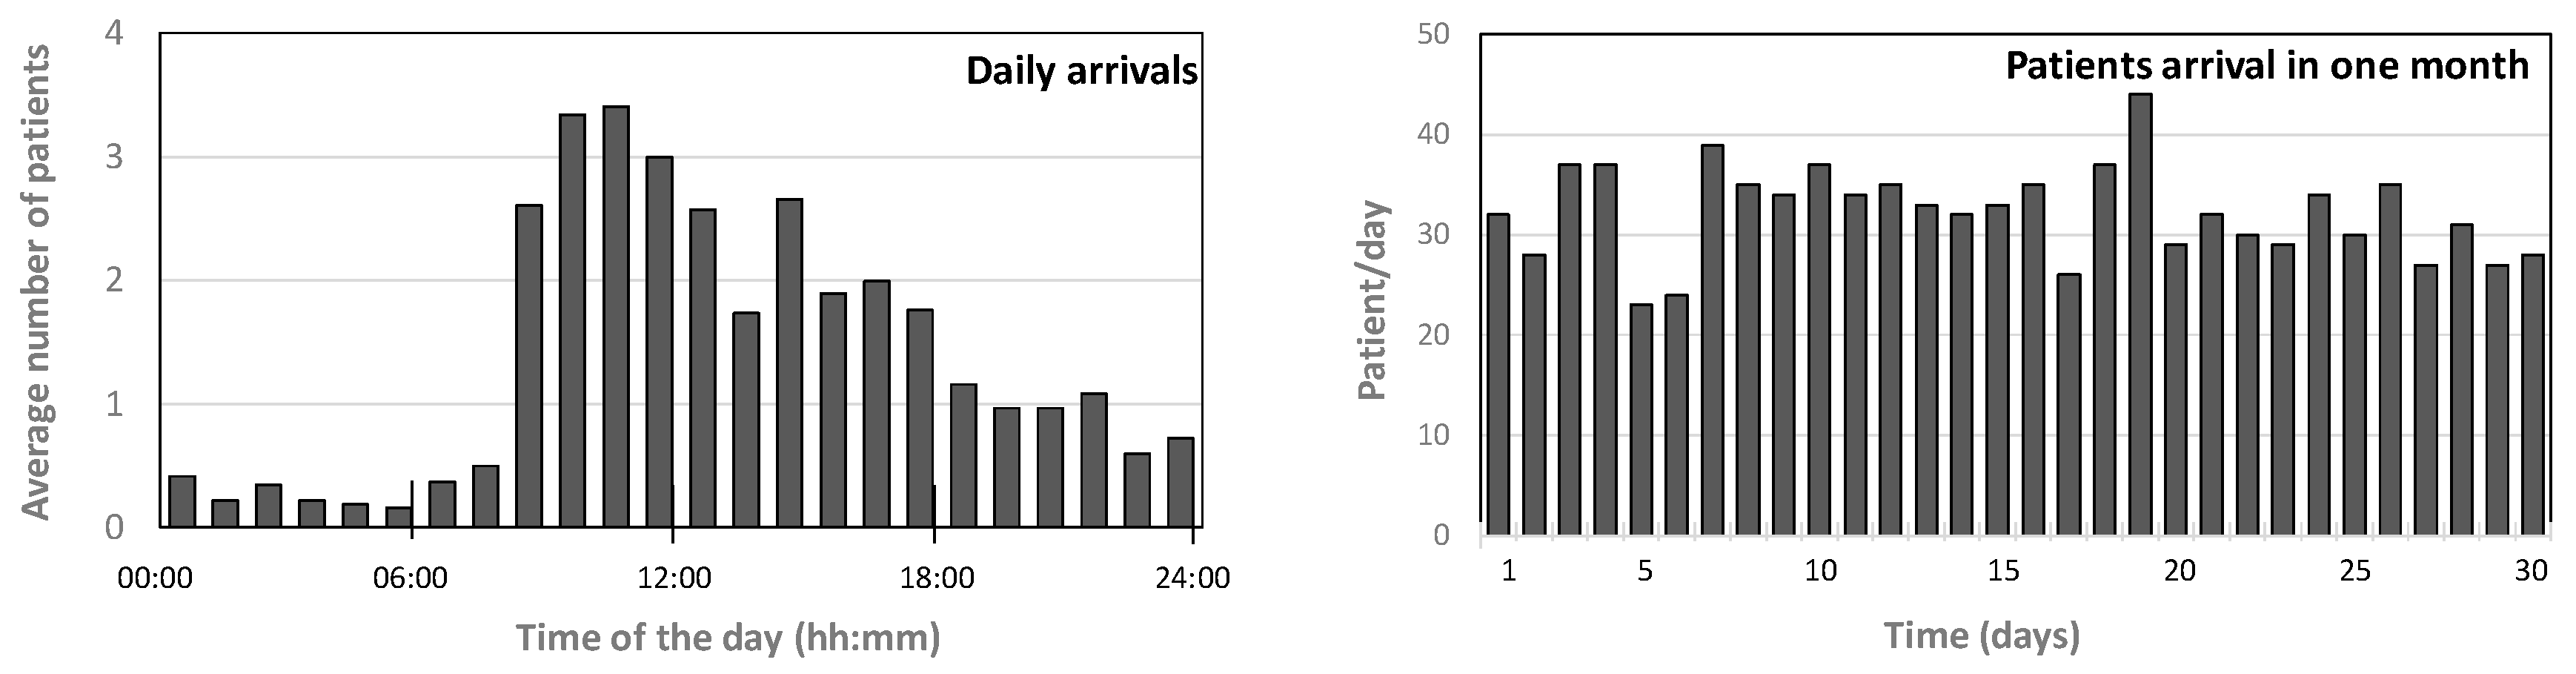
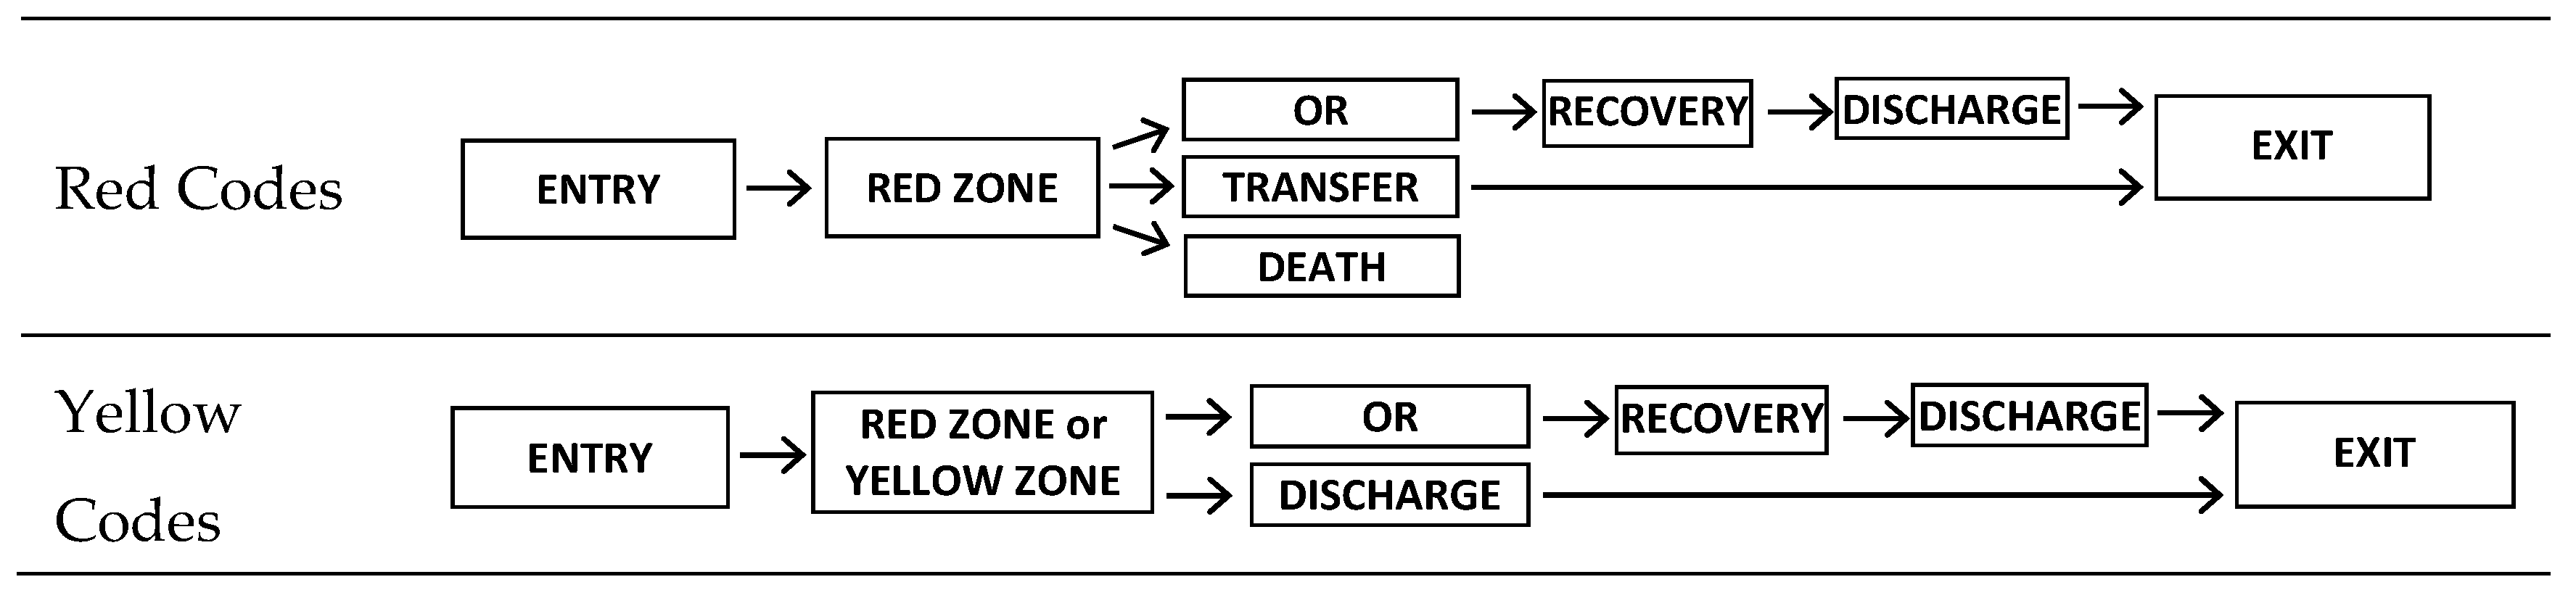
2.2. The EDSH Functions and Selection of Response Parameter

The EDSH’s annual volume of work is about 13,000 patients. The rescue service is provided to the patients based on the “triage” practice, which combines the arrival time with the severity of their needs. Upon arrival at the EDSH, patients receive a “color code” indicating their urgency level, and they must follow a specific protocol accordingly.
The most severe cases, defined as “Major Codes”, can be red (emergencies) and yellow (urgencies), while “Minor Codes” include green (deferrable urgency) and white (no-urgency). Tuscany adopted an additional code, blue, whose priority level is between the green and the white.
Depending on their code classification, the patients receive specific care procedures, which involve different rooms and medical personnel (see Figure 2). The rooms involved in the rescue care are:
-
Reception (REC), where the patients arrive;
-
Waiting Room (WR), where patients classified as “Minor Codes” wait for assistance.
-
Minor Codes Ambulatory (ACM), where patients classified as “Minor Codes” are visited.
-
Short Intensive Observation (OBI), where the patients are left to check their response to the treatment.
-
Emergency Room (ER), where patients classified as “Major Codes” receive the first rescue.
-
Recovery, where patients classified as “Major Codes” are recovered.
In this study, the EDSH functionality is measured in terms of waiting time (WT), defined as the time spent by the patients in the emergency department before receiving their first medical treatment, i.e., not including the time spent for the triage. Indeed, WT represents one of the most comprehensive factors describing the functionality of emergency departments since it is applicable in both normal and emergency conditions [44]. In normal conditions, it allows measuring the patients’ satisfaction [45,46], including those housed in the hospital [47]. Even in emergencies, WT is a consistent parameter [3] since the emergency service is directly correlated with the number of treated outpatients. This work focuses on the WT of the yellow-codes patients, i.e., the time from their arrival to the EDSH and the beginning of their treatment.

2.3. Systems Affecting the EDSH’s Functionality

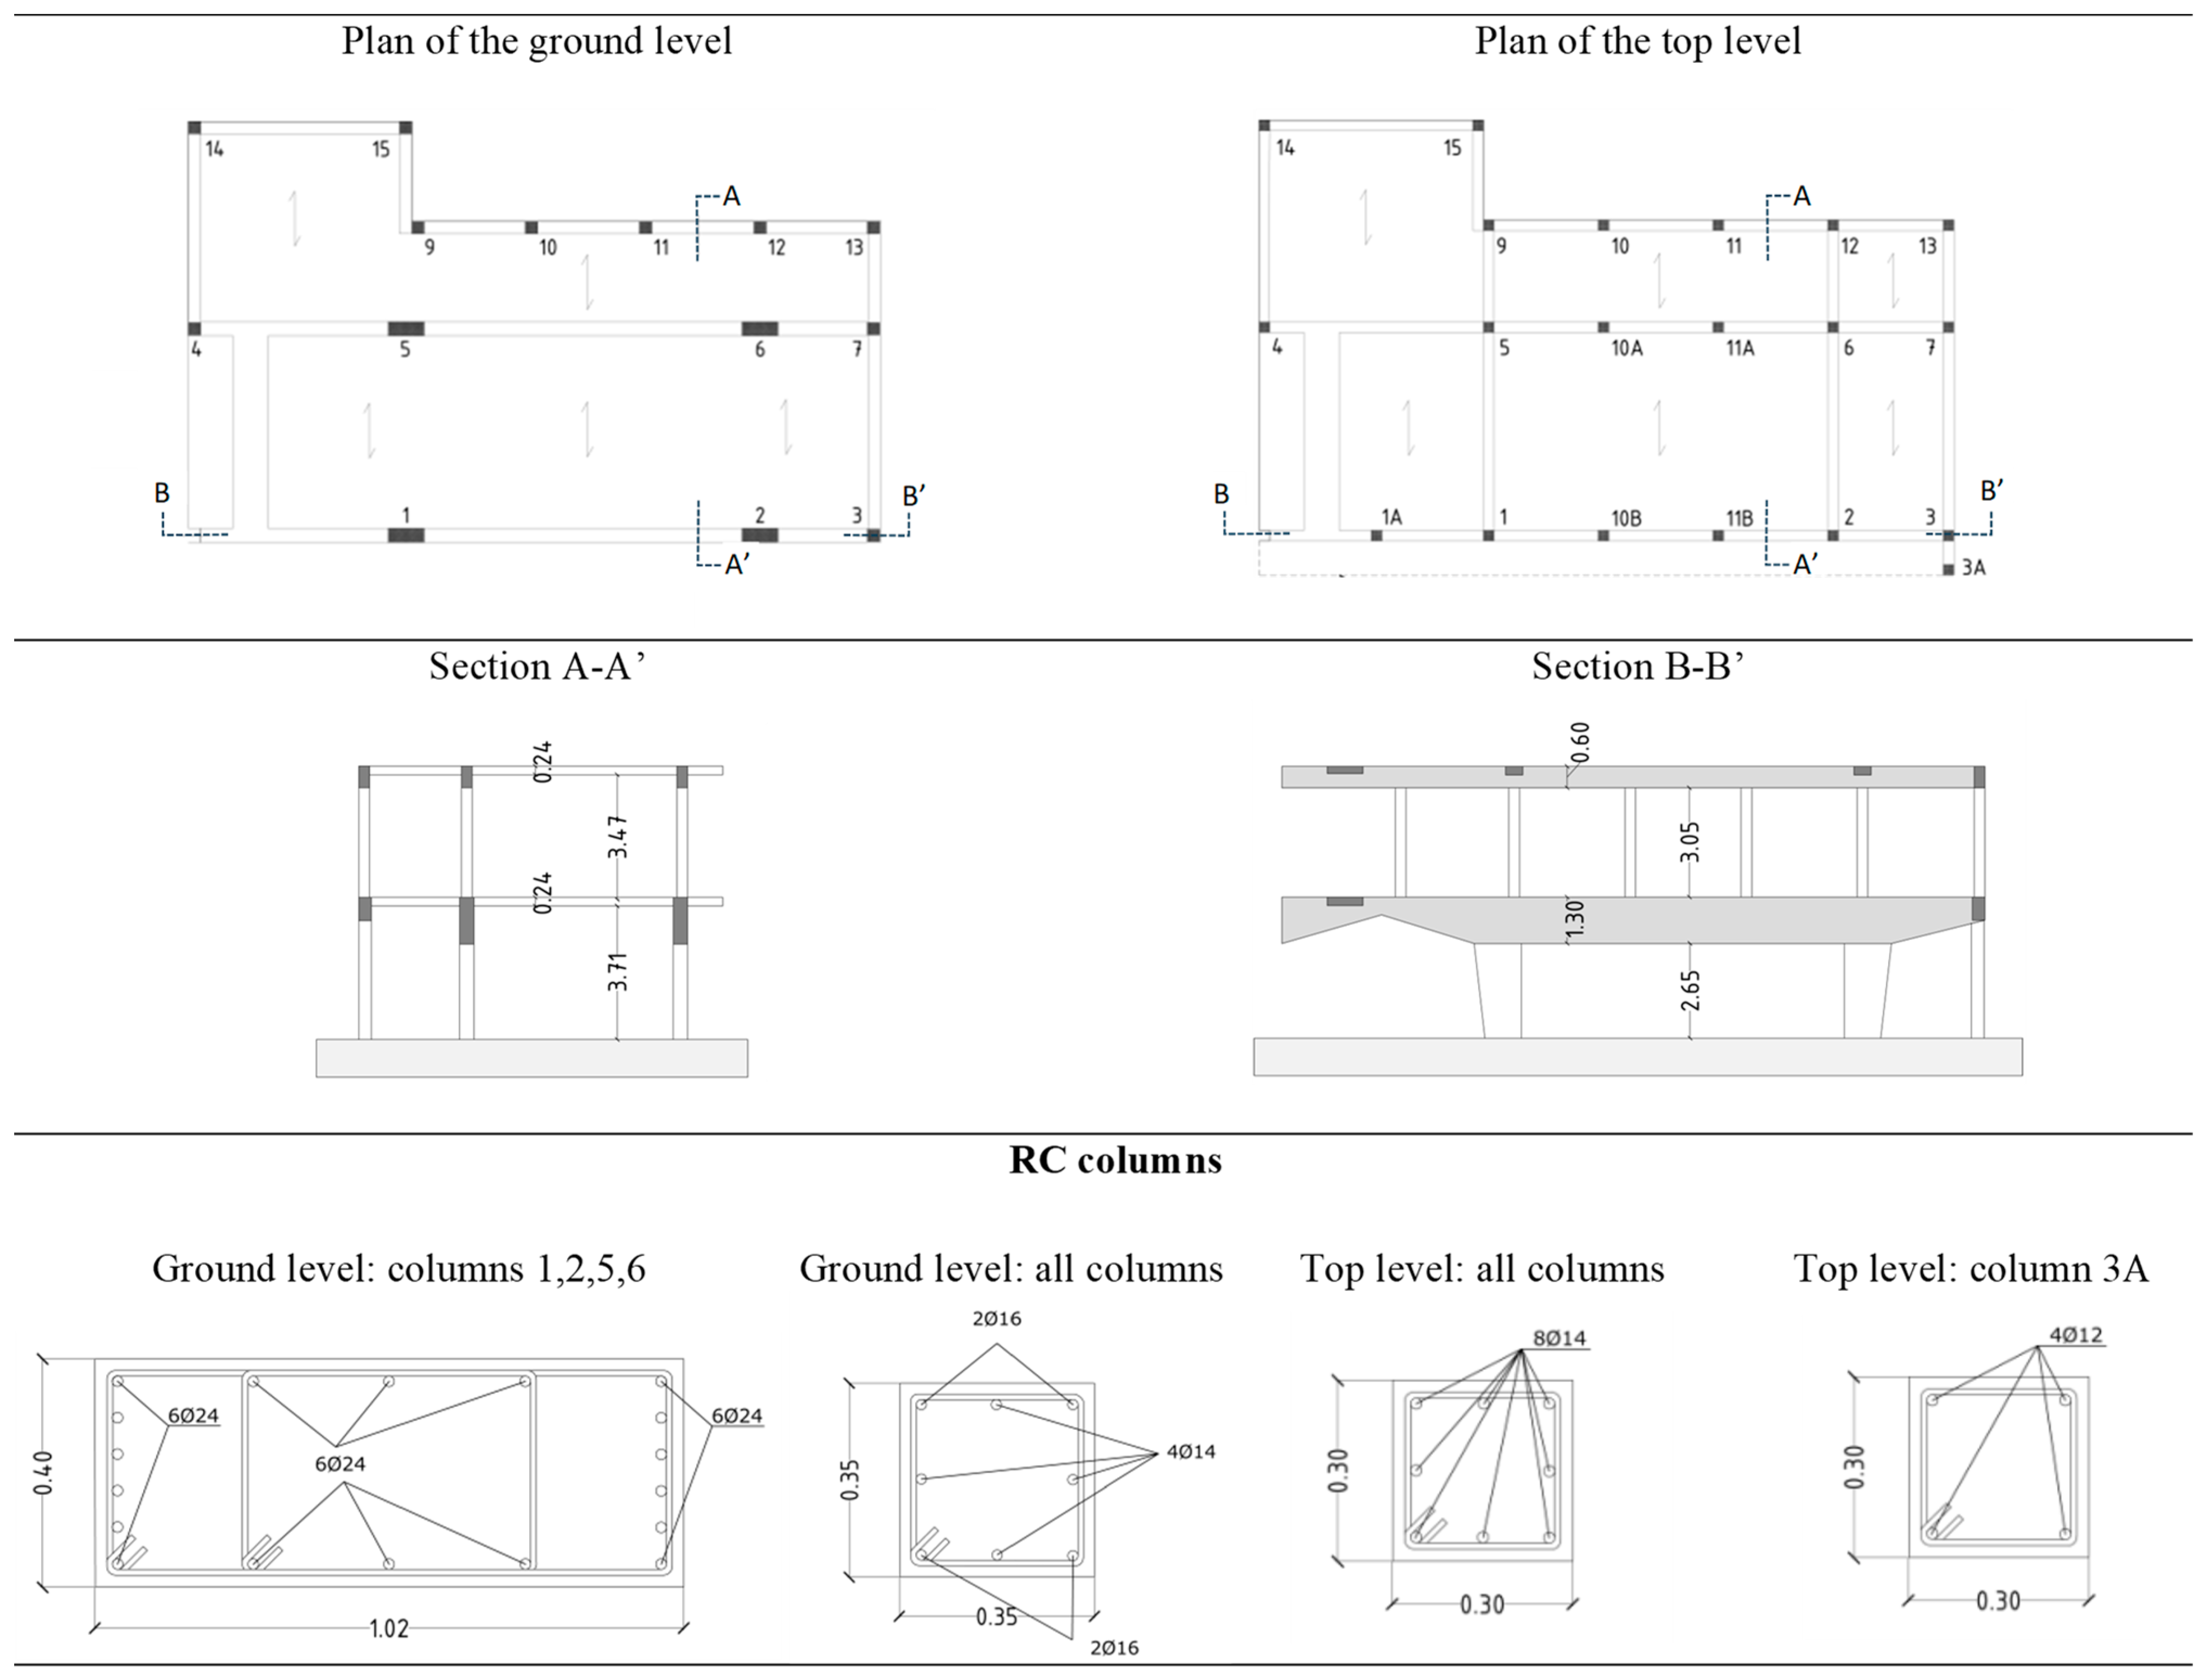
2.3.1. The Structure

The plan of the EDSH, shown in Figure 3, has a rectangular shape with a small jetty on the longitudinal side. The structure, i.e., the 3D reinforced concrete frame, is very irregular since the columns at the ground level have different spacing and features from the ones on the top story. The big columns at the ground level have been represented through equivalent rectangular sections, whose measures can be found in Figure 3, together with those of the other square columns.
Even the beams are different at the two levels: those of the ground level have a variable height, while those of the top story have a regular rectangular section. At the ground level, the deeper longitudinal beams have a base of 40 cm and a variable height ranging between 60 cm and 130 cm, while the other beams have a base of 35 cm and a height of 60 cm. The longitudinal beams on the top level have rectangular 30 cm × 60 cm sections. All the beams along the transverse direction have the same height as the slab floor, equal to 20 cm. The transverse reinforcement for the beam and column members varies in size from 6 mm to 10 mm, with a spacing of 20 cm. The concrete cover to the longitudinal bars is 40 mm for the columns and 30 mm for the beams [48]. The structure features a hollow-brick slab on the two levels. The slabs were constructed in situ with the beam elements.
The concrete has a mean strength equal to 35.7 MPa. Concrete compression strength was determined through both destructive (crushing cylindrical core samples) and non-destructive (ultrasonic) tests. The steel yield stress was assumed to be 412 MPa based on tensile tests of bar samples. Testing procedures were performed according to the Italian standard [49]. Further information can be found in Przelazloski (2014) [48].

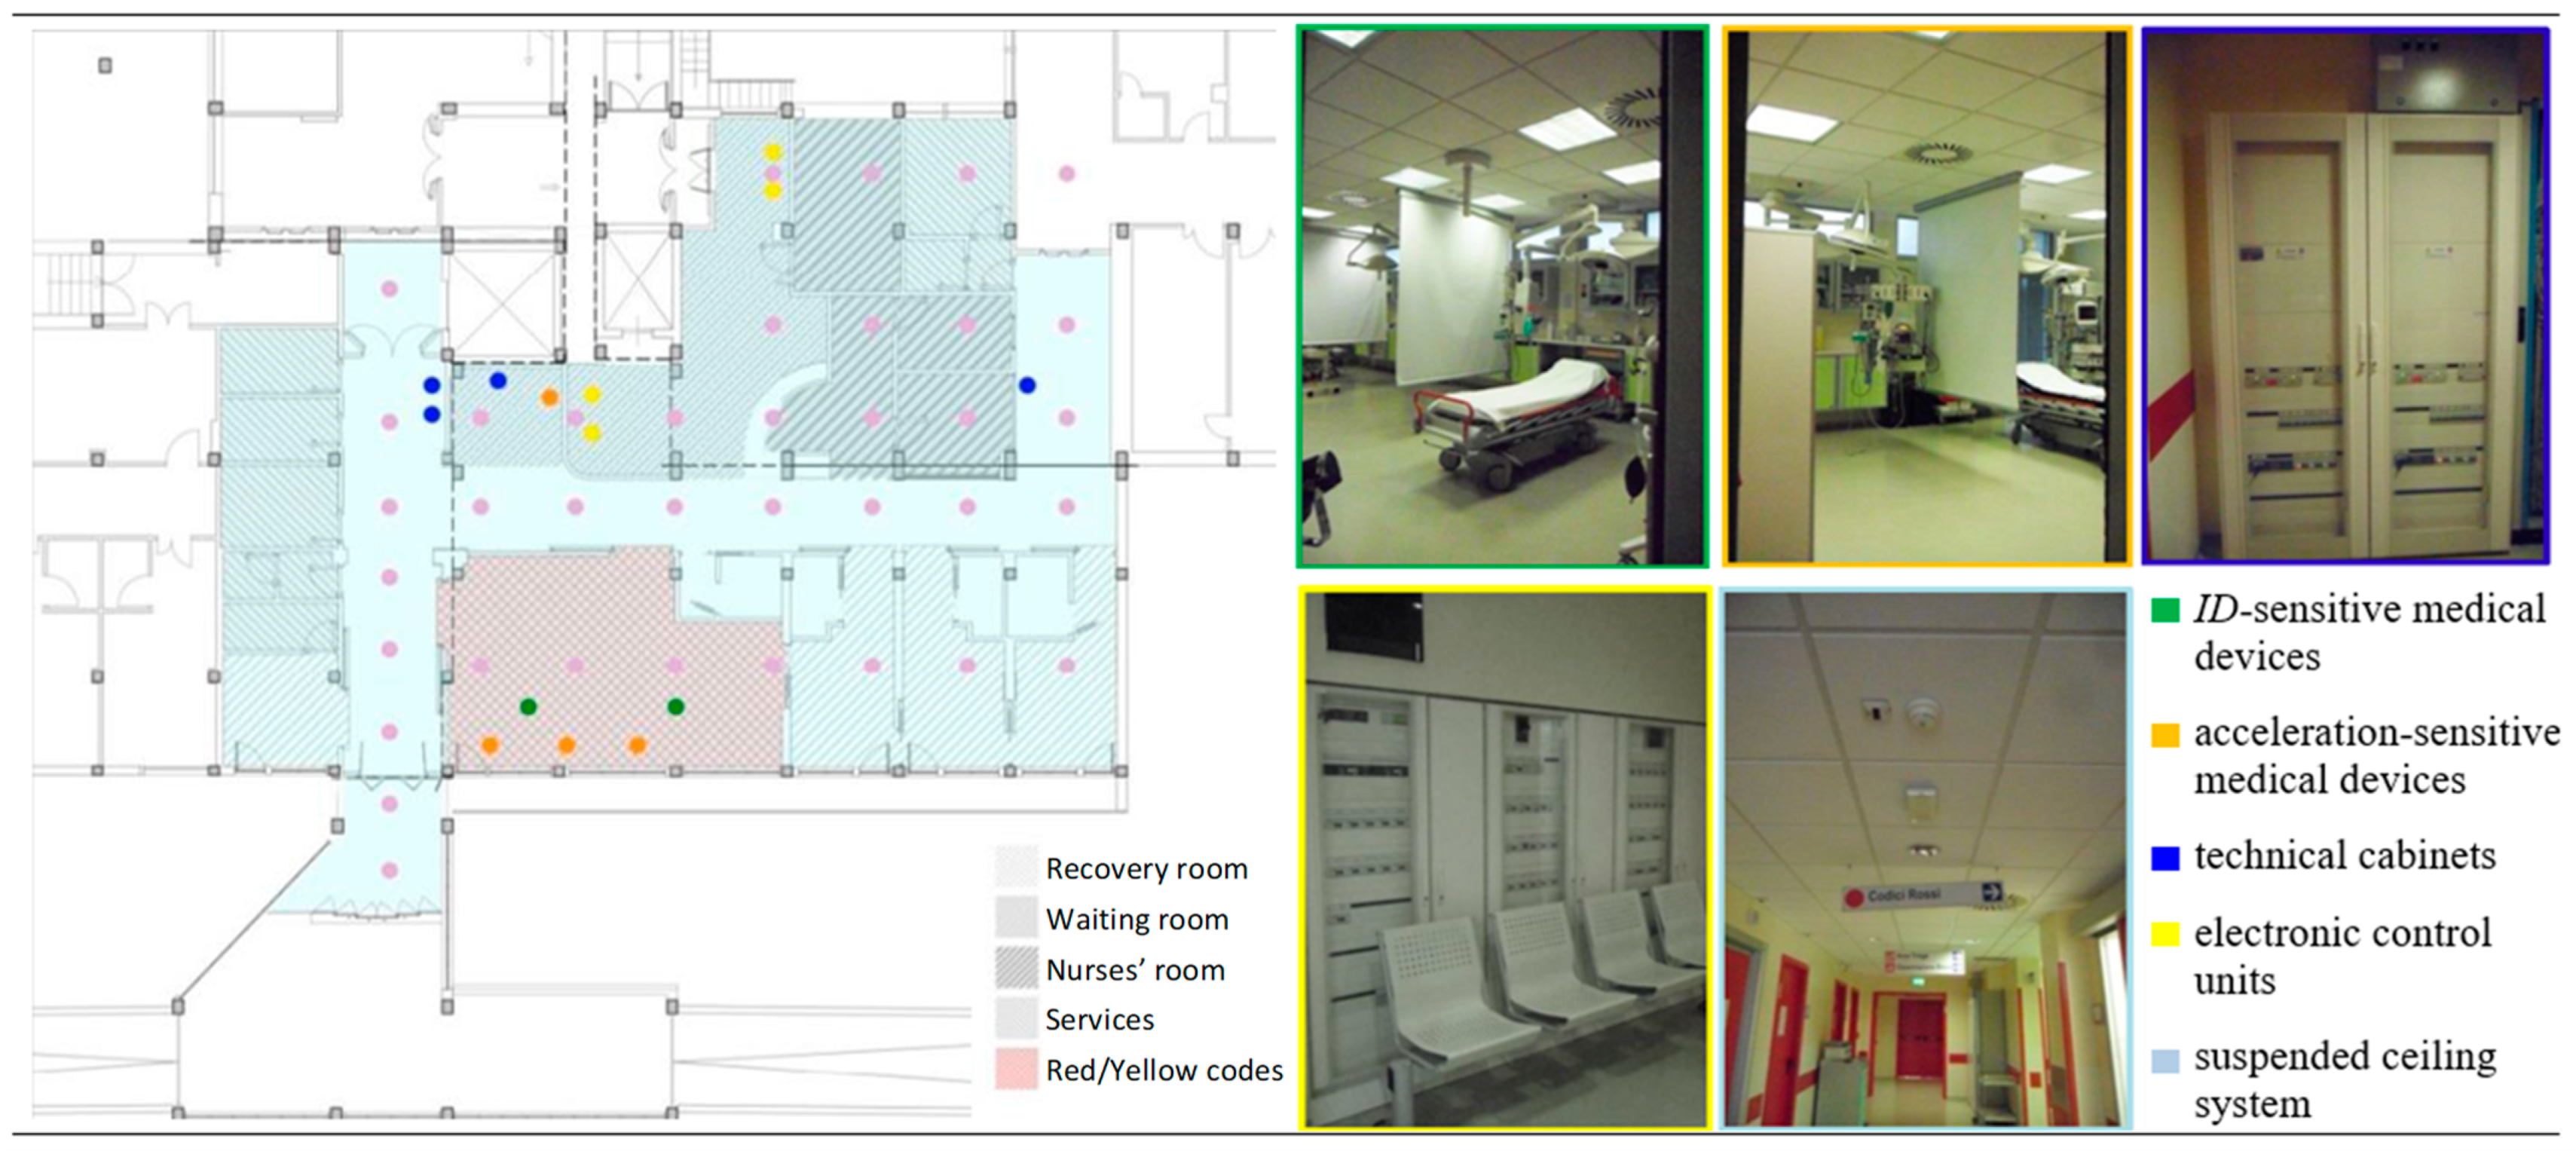
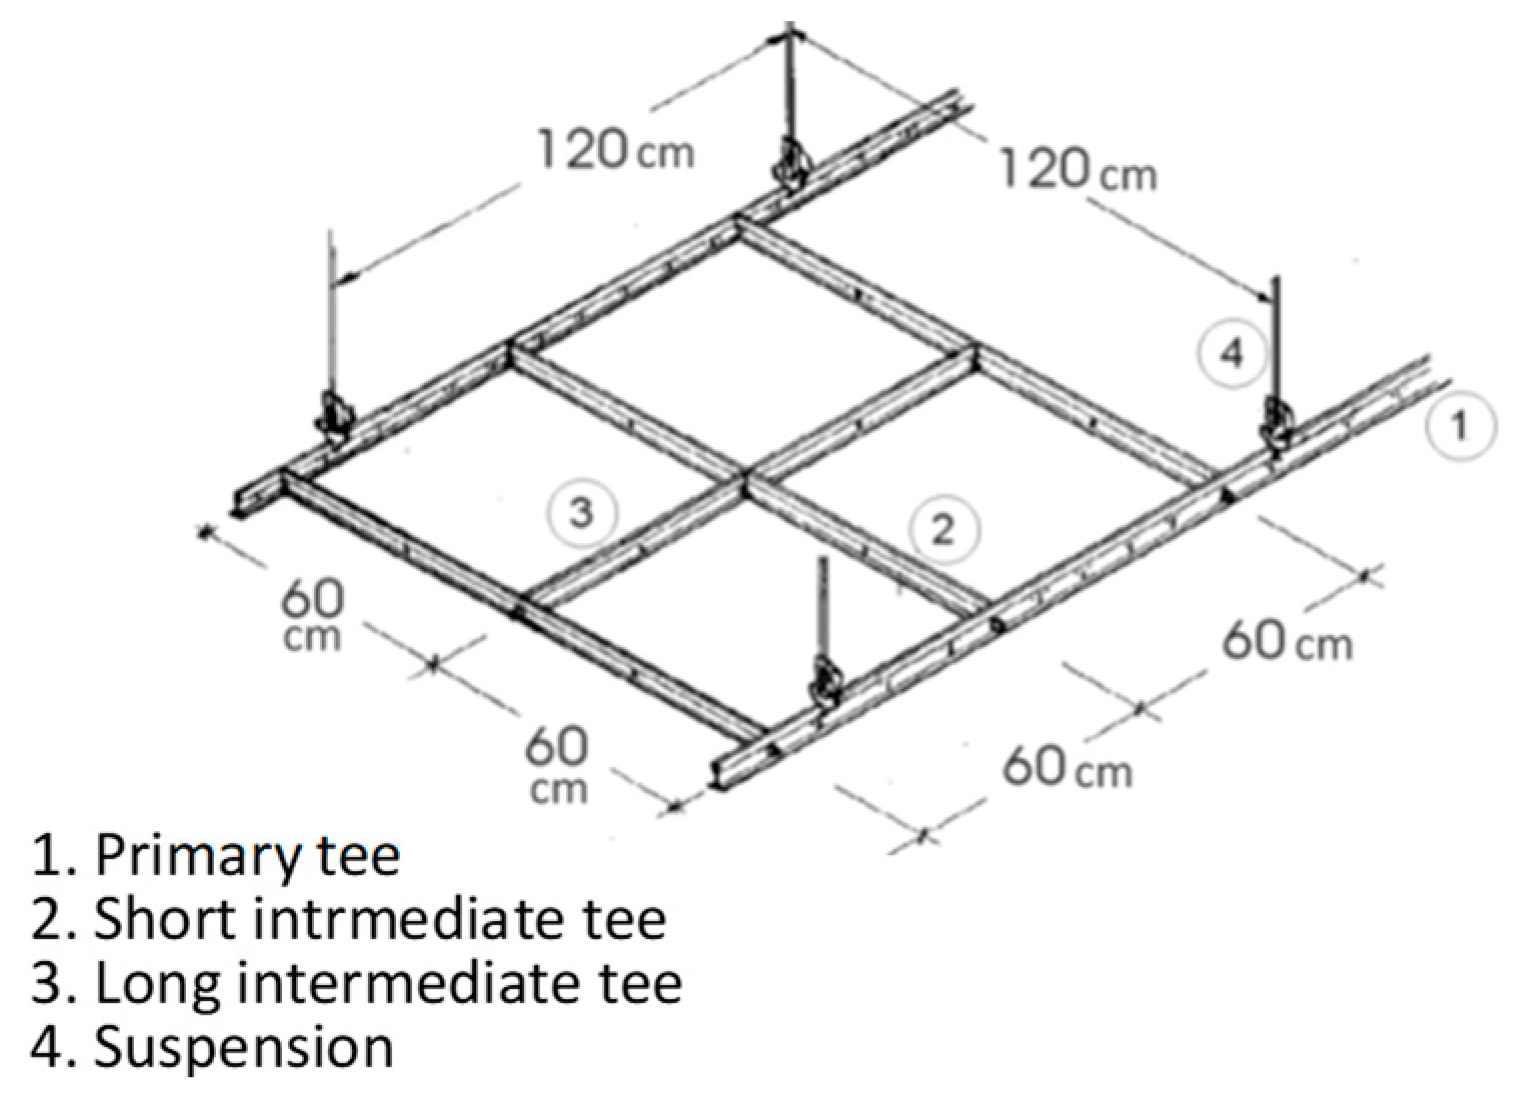
2.3.2. The Nonstructural Components

Health systems include a large number of nonstructural components, both architectural ones, such as partitions and ceilings, and ones related to utility systems, such as piping, air or heating ducts, and electrical and electronic equipment. Furthermore, even the building’s content, such as cabinets and furniture, should be considered for assessing their functionality. In Figure 4, the main nonstructural components of the EDSH are shown. In this study, only the suspended ceilings and the cabinets are taken into account.
Suspended ceilings. Suspended ceilings typically consist of a grid system (see Figure 5), hanger or bracing wires, perimeter supports, and lay-in tiles. In this case, the grid system consists of hot-dipped galvanized inverted T-sections that form square or rectangular-shaped frames for supporting the tiles.
They are divided into two main categories: main tees and cross tees. Main tees come in higher capacity and bigger lengths, while cross tees provide the transverse restraint for the main tees. Figure 6 shows the measures of the rooms constituting the EDSH, together with the direction of suspended ceiling elements.
Cabinets. The cabinets have been included in the analysis since, during severe earthquakes, they may overturn and obstruct the rooms of the EDSH, preventing their access.

2.3.3. The Organizational System

The assessment of the waiting time WT requires consideration of the number of steps involved in the rescue process and the time needed to execute each of them. Furthermore, the total time required to complete the process is affected by the transfer through the various involved rooms. Therefore, even the distances between each of the rooms play a role in the assessment of WT, as much as the availability of the required personnel.
All this information was found through a 100-day observation cycle made by the hospital staff [50]. Table 1 shows the main information regarding the patients’ stay times in the various rooms and the mutual distances between the involved rooms. In the same table, the percentage of patients classified in each color code during the observation period is shown. Further information, such as the personnel involved in each step and its respective working time, can be found in Pianigiani and Viti [43].
Figure 7 shows the patients’ arrivals in the 100 days of observation and the average arrivals within a single day. As can be noticed, the rate of arrival is not regular, achieving its maximum intensity between 8:00 am and 1:00 pm and strongly reducing in the nighttime.

2.4. The Metamodel

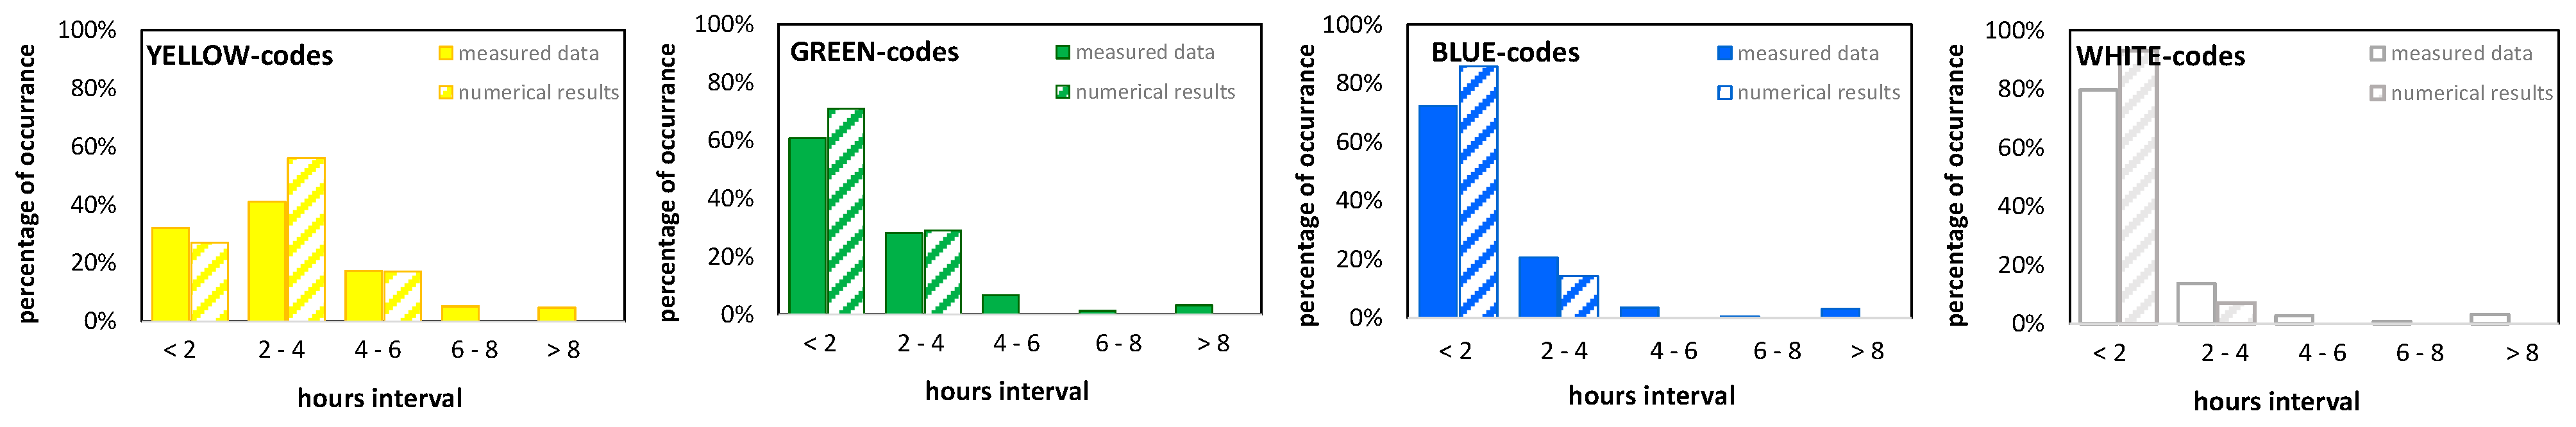
2.4.1. Assessment of the WT in Standard Conditions

The numerical analysis was performed by the software ProModel [51], which simulates the EDSH’s functioning based on its effective plan. The flowchart of the metamodel is shown in Figure 8. All the collected information regarding the patient’s arrival and treatment and the personnel working has been used to set the metamodel. The medical staff (nurses and doctors) is considered to be fully operational even at night, while the help operators are active only in the daytime (8 h). The OBI rooms are assumed to contain a maximum of five beds, while the emergency room can accommodate one bed for the red codes and two for the yellow codes, and the waiting room is considered to have an unlimited capability.
In the simulation, if two or more patients attempt to enter the same unit, a FIFO (first in—first out) rule is used. In case a unit is full, patients who need to be treated in that unit experience a waiting time. The transportation time is reproduced based on the assumed walking speed and distances between the rooms. The simulation has been performed through a Monte Carlo approach, considering 100 different replications for each set of data. The statistical results represent the waiting time experienced by each patient. The data clouds are set and manipulated in order to calculate a median curve of these points.
Thanks to the data provided by the 100-day observation, the results of the Monte Carlo analysis could be compared to the “experimental” ones, i.e., the effective average WT experienced by the patients. Figure 9 shows the results provided by the metamodel validation. Further detail on the analysis can be found in Pianigiani and Viti [43].

2.4.2. Assessment of the WT in Emergency Conditions

The emergency scenarios were introduced as a function of the site hazard. Figure 10 shows the flowchart of the metamodel in emergency conditions. In the figure, the red writing indicates the steps of the analysis developed in the current research, while the black writing indicates the steps developed in [43]. Upon the occurrence of an earthquake, most data change in both the physical system and the organizational one. The organizational system abruptly changes since the emergency’s occurrence implies the adoption of a special protocol called PEMAF (from the Italian: “Piano di Emergenza Massiccio Afflusso di Feriti”), which implies an immediate change in the personnel working, the use of the emergency department’s available rooms, and the criteria of providing the rescue. Furthermore, the emergency induces an increase in the number of patients and a change in their average needs. In turn, the physical systems (structure and nonstructural components) can—partially or completely—become condemned, preventing the use of some of the rooms and consequently increasing the WT.
The gravity of the damage has been assumed based on the fragility curves (see typical in Figure 11) found for the structure and the nonstructural components, respectively. To assess the EDSH’s serviceability, a comprehensive fragility curve has been found as the envelope of the ones referring to structural and nonstructural components (see Figure 11). When the expected seismic intensity is known, the probability of failure can be easily estimated through the enveloped fragility curve and used to assess the percentage of rooms assumed as out of service.
Figure 11 illustrates two different damage scenarios: a low-intensity seismic event, which intersects the comprehensive fragility curve for a probability of failure of around 17%, and a higher-intensity event, corresponding to a 50% probability of failure. Assuming a total number of rooms used for the rescue equal to 6, in the first case, the number of rooms considered as out of service is 1, while in the second case, it is 3.
It should be underlined that when the envelope coincides with the nonstructural fragility curve, the loss of serviceability is related to damages to the nonstructural components. In this case, therefore, the rooms are assumed to be out of service only temporarily since the damage can likely be fixed in a short time. Instead, when the envelope coincides with the structural fragility curve, the percentage of failure is related to the structure, and the consequent loss of service of the room must be considered permanent, i.e., longer than the 30-day duration of the analytical simulation.
Even the organizational system would certainly change due to the emergency condition, experiencing an increase in demand, together with a strengthening of some aspects, such as the working schedule, the number of personnel, and the number of rooms dedicated to rescue.
In the next section, the changes occurring in the system in emergency conditions are presented in detail.

3. The Seismic Response of the Edsh

3.1. Seismic Hazard of the Area

The seismic intensity of the area can be quantified according to the Italian Technical Code [52], which indicates a PGA equal to 0.227 g for a Return Period (RP) equal to 475 years (rock outcrop). The EDSH’s foundation soil has been the object of a careful geological investigation (see [53]), which included a seismic refraction test (SRT), a downhole test (DHT), a multichannel analysis of surface waves (MASW) combined with an extended spatial autocorrelation (ESAC), and various H/V lectures. Figure 12a shows the map of the tests performed within the hospital area.
The position where the tests have been performed is very important; since the soil has a slope, important excavation activities were performed for the buildings’ construction. Each test provided an average value of the shear velocity of the uppermost 30 meters (vs,30), shown in Figure 12b. As can be seen, the various tests provided results that differed from each other. The investigation closest to the EDSH is the MASW/ESAC one, which provided a vs,30 equal 478 m/s. As a result of such investigation, the soil has been classified as belonging to the B-class, which is the most conservative assumption consistent with the experimental results according to the current Italian Technical Code [52]. The elastic spectrum of the area for the soil-class B is shown in Figure 12c.

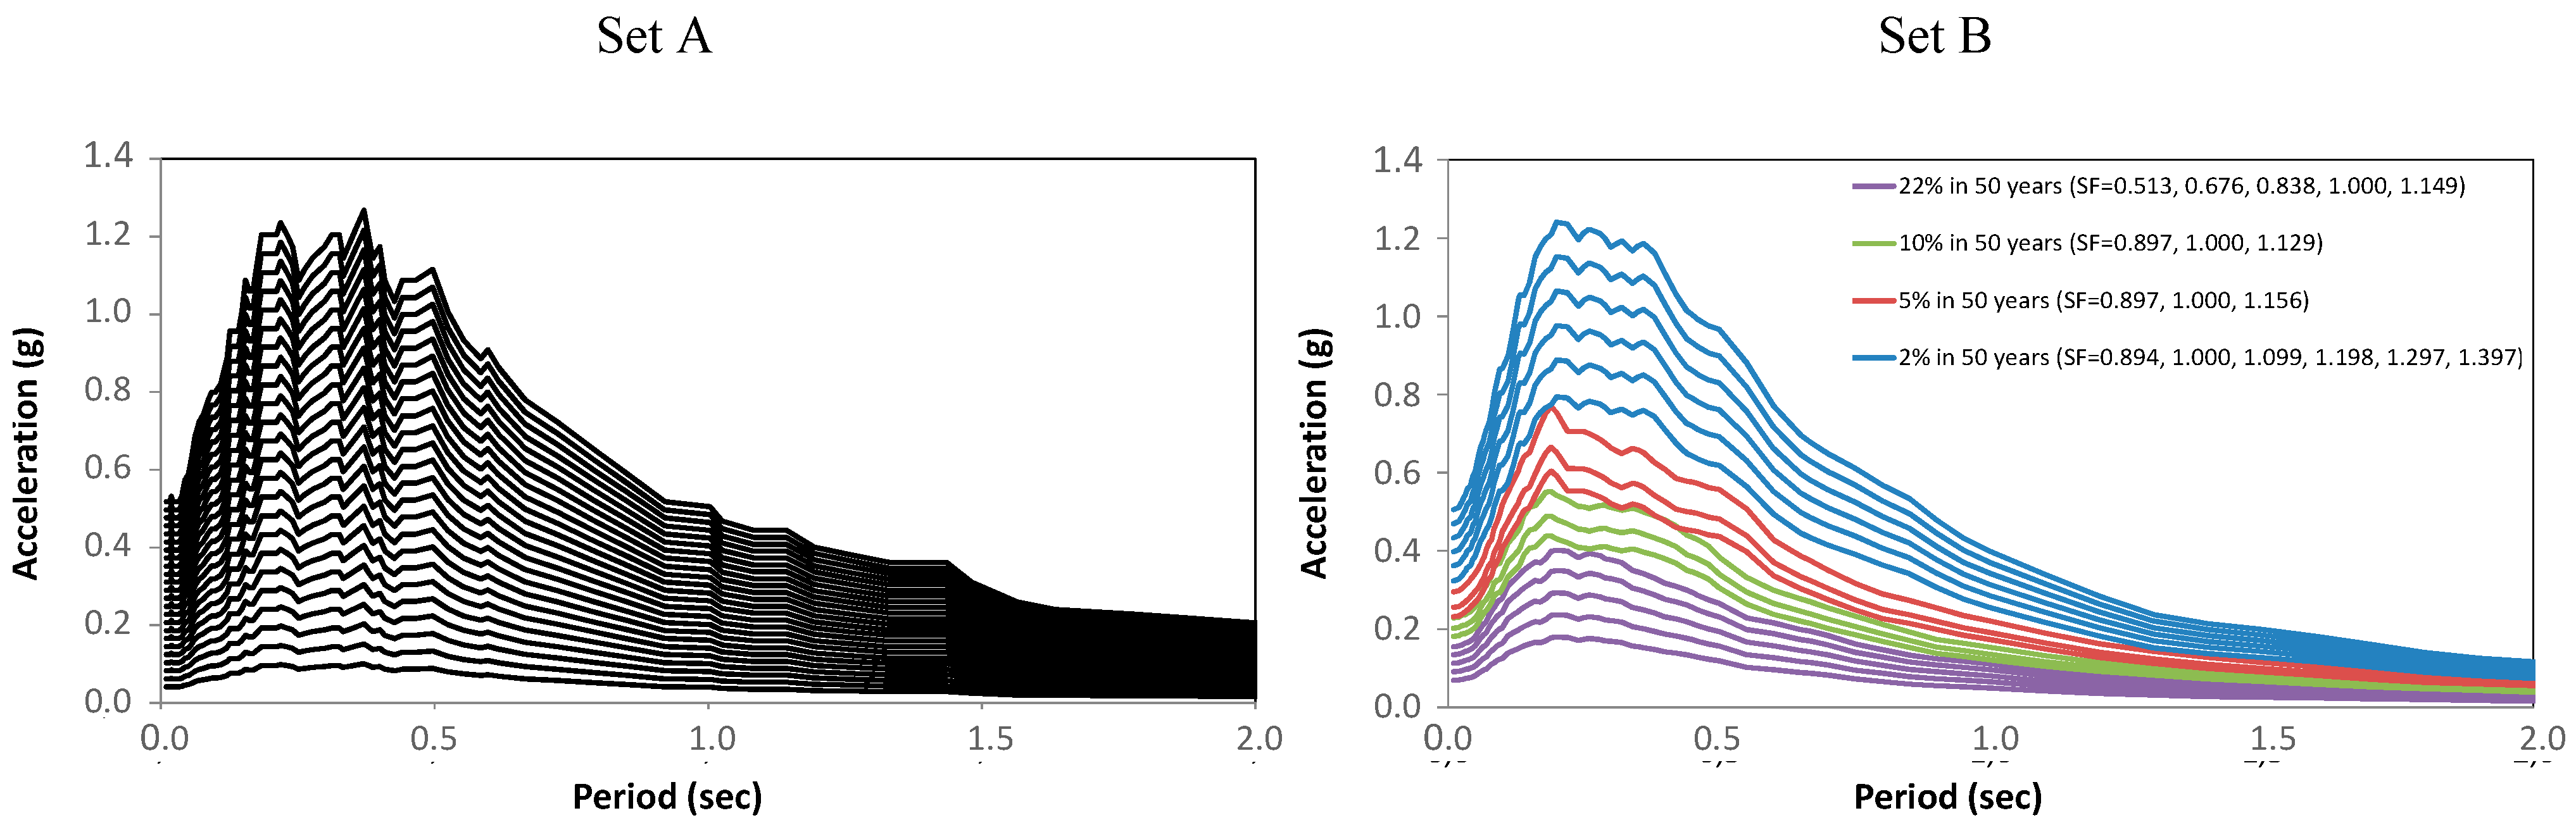
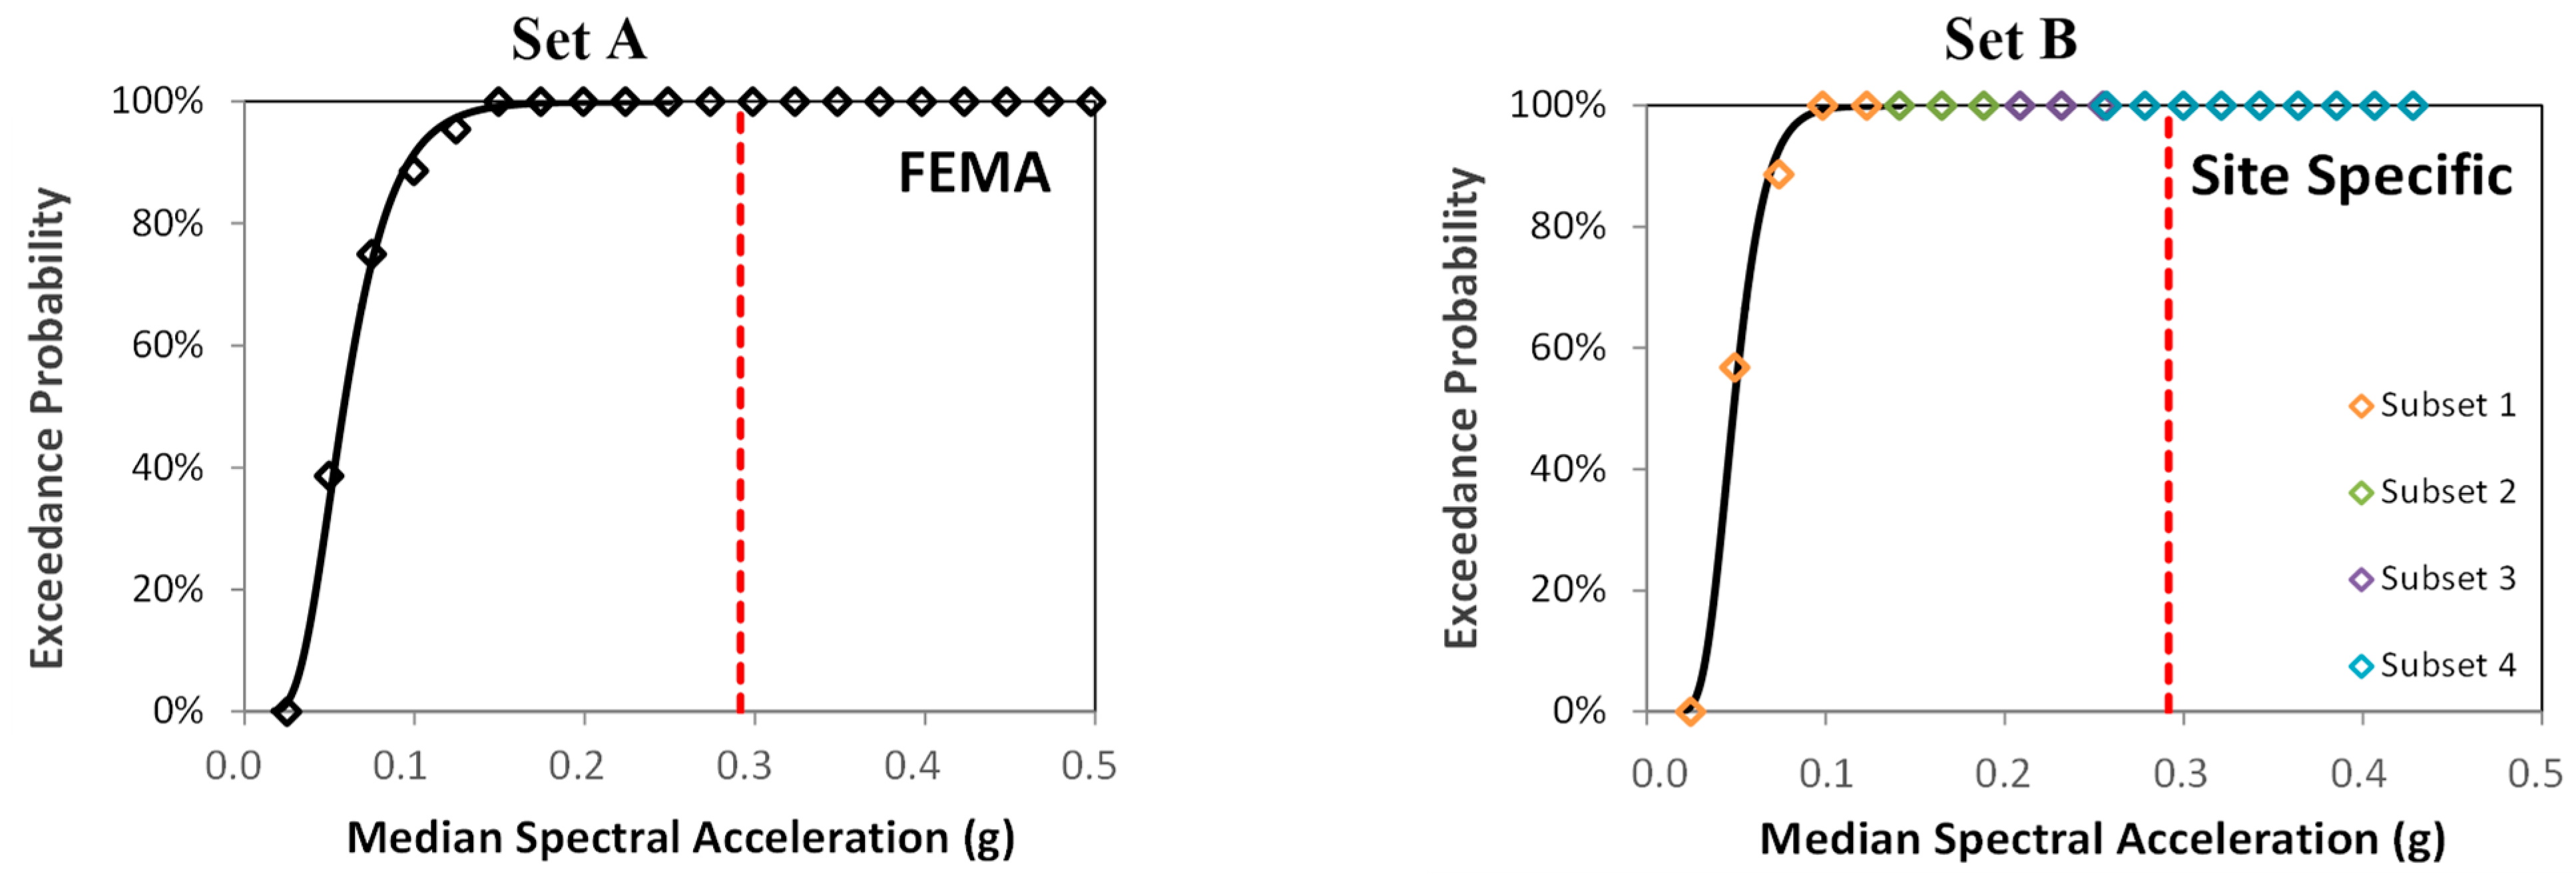
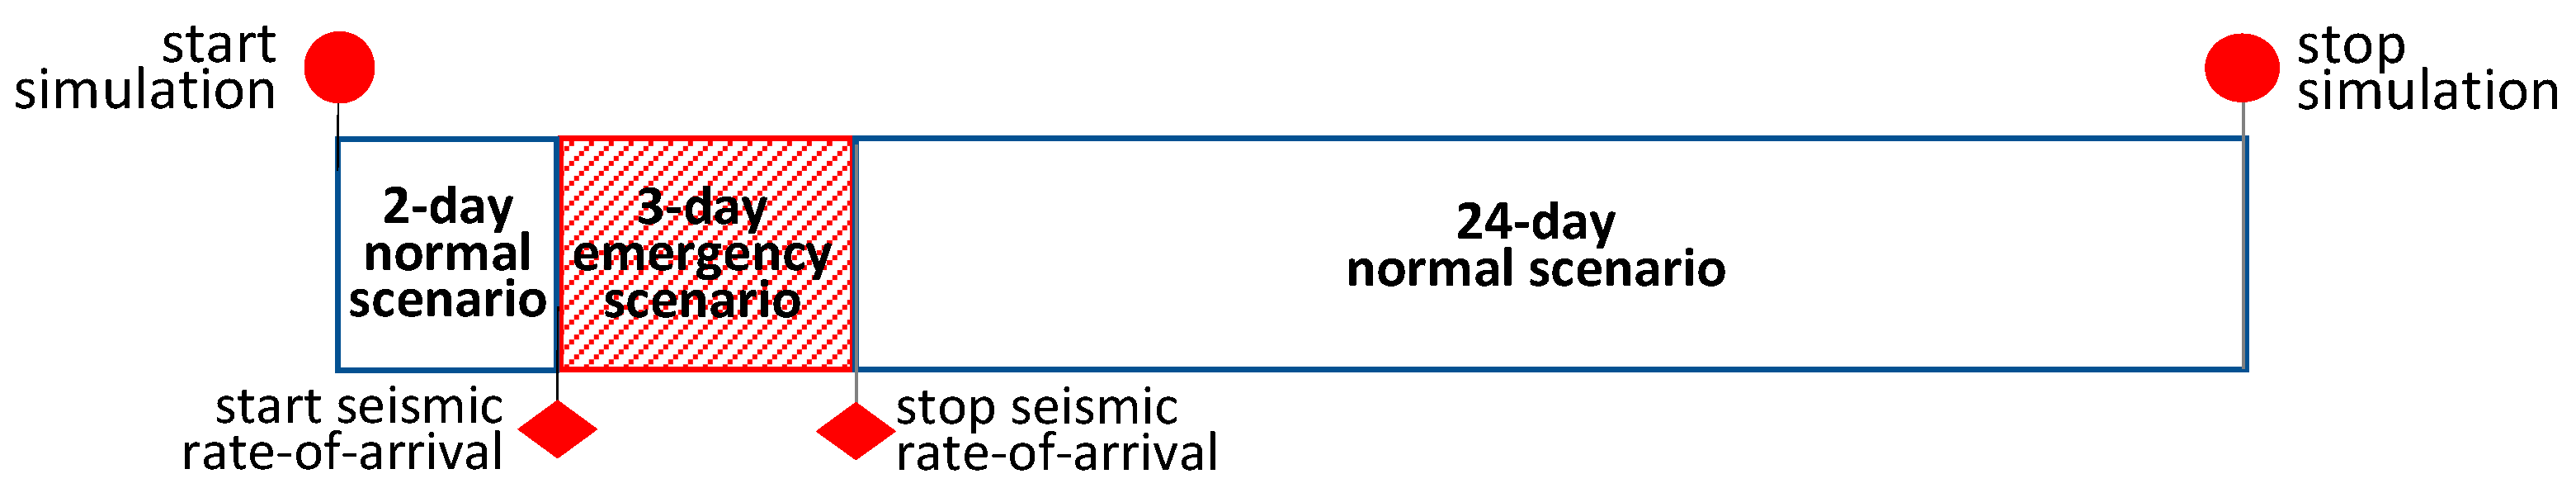
3.2. The Seismic Input

In this work, the building’s seismic performance has been represented in terms of fragility curves. To find the fragility curves, an Incremental Dynamic Analysis (IDA) was performed, considering many different intensities of the seismic input. For this reason, a wide range of seismic intensities has been considered beyond the PGA proper of the building site. Namely, PGAs ranging between 0.025 g and 0.625 g, with steps of 0.025 g, have been included in the analysis.
This analytical approach requires special attention to the selection of the ground motions to represent the seismic input. If natural ground motions are adopted, they must be scaled in order to cover the entire range of considered intensities; consequently, high values of the scale factors must be used. For this reason, in this work, two different sets of ground motions have been considered to represent the seismic input, respectively provided by FEMA P695 [54] (set A) and selected among the local records (set B). The first set consists of 22 pairs of ground motions (listed in Table 2), with a total of 44 time-histories. At the fundamental period of the structure (T = 0.816 s), the median spectral acceleration is 0.445 g. Twenty-four different scale factors, ranging between 0.112 and 1.404, have been adopted to obtain as many intensities as possible of the ensemble.
The second record set, specifically developed for the site, consists of four subsets of 22 pairs of records each. The time histories in each of the subsets, listed in Table 3, correspond to different probabilities of exceedance in 50 years equal to 22%, 10%, 5%, and 2%, respectively. Figure 13 shows the median spectra of the two sets of ground motions.

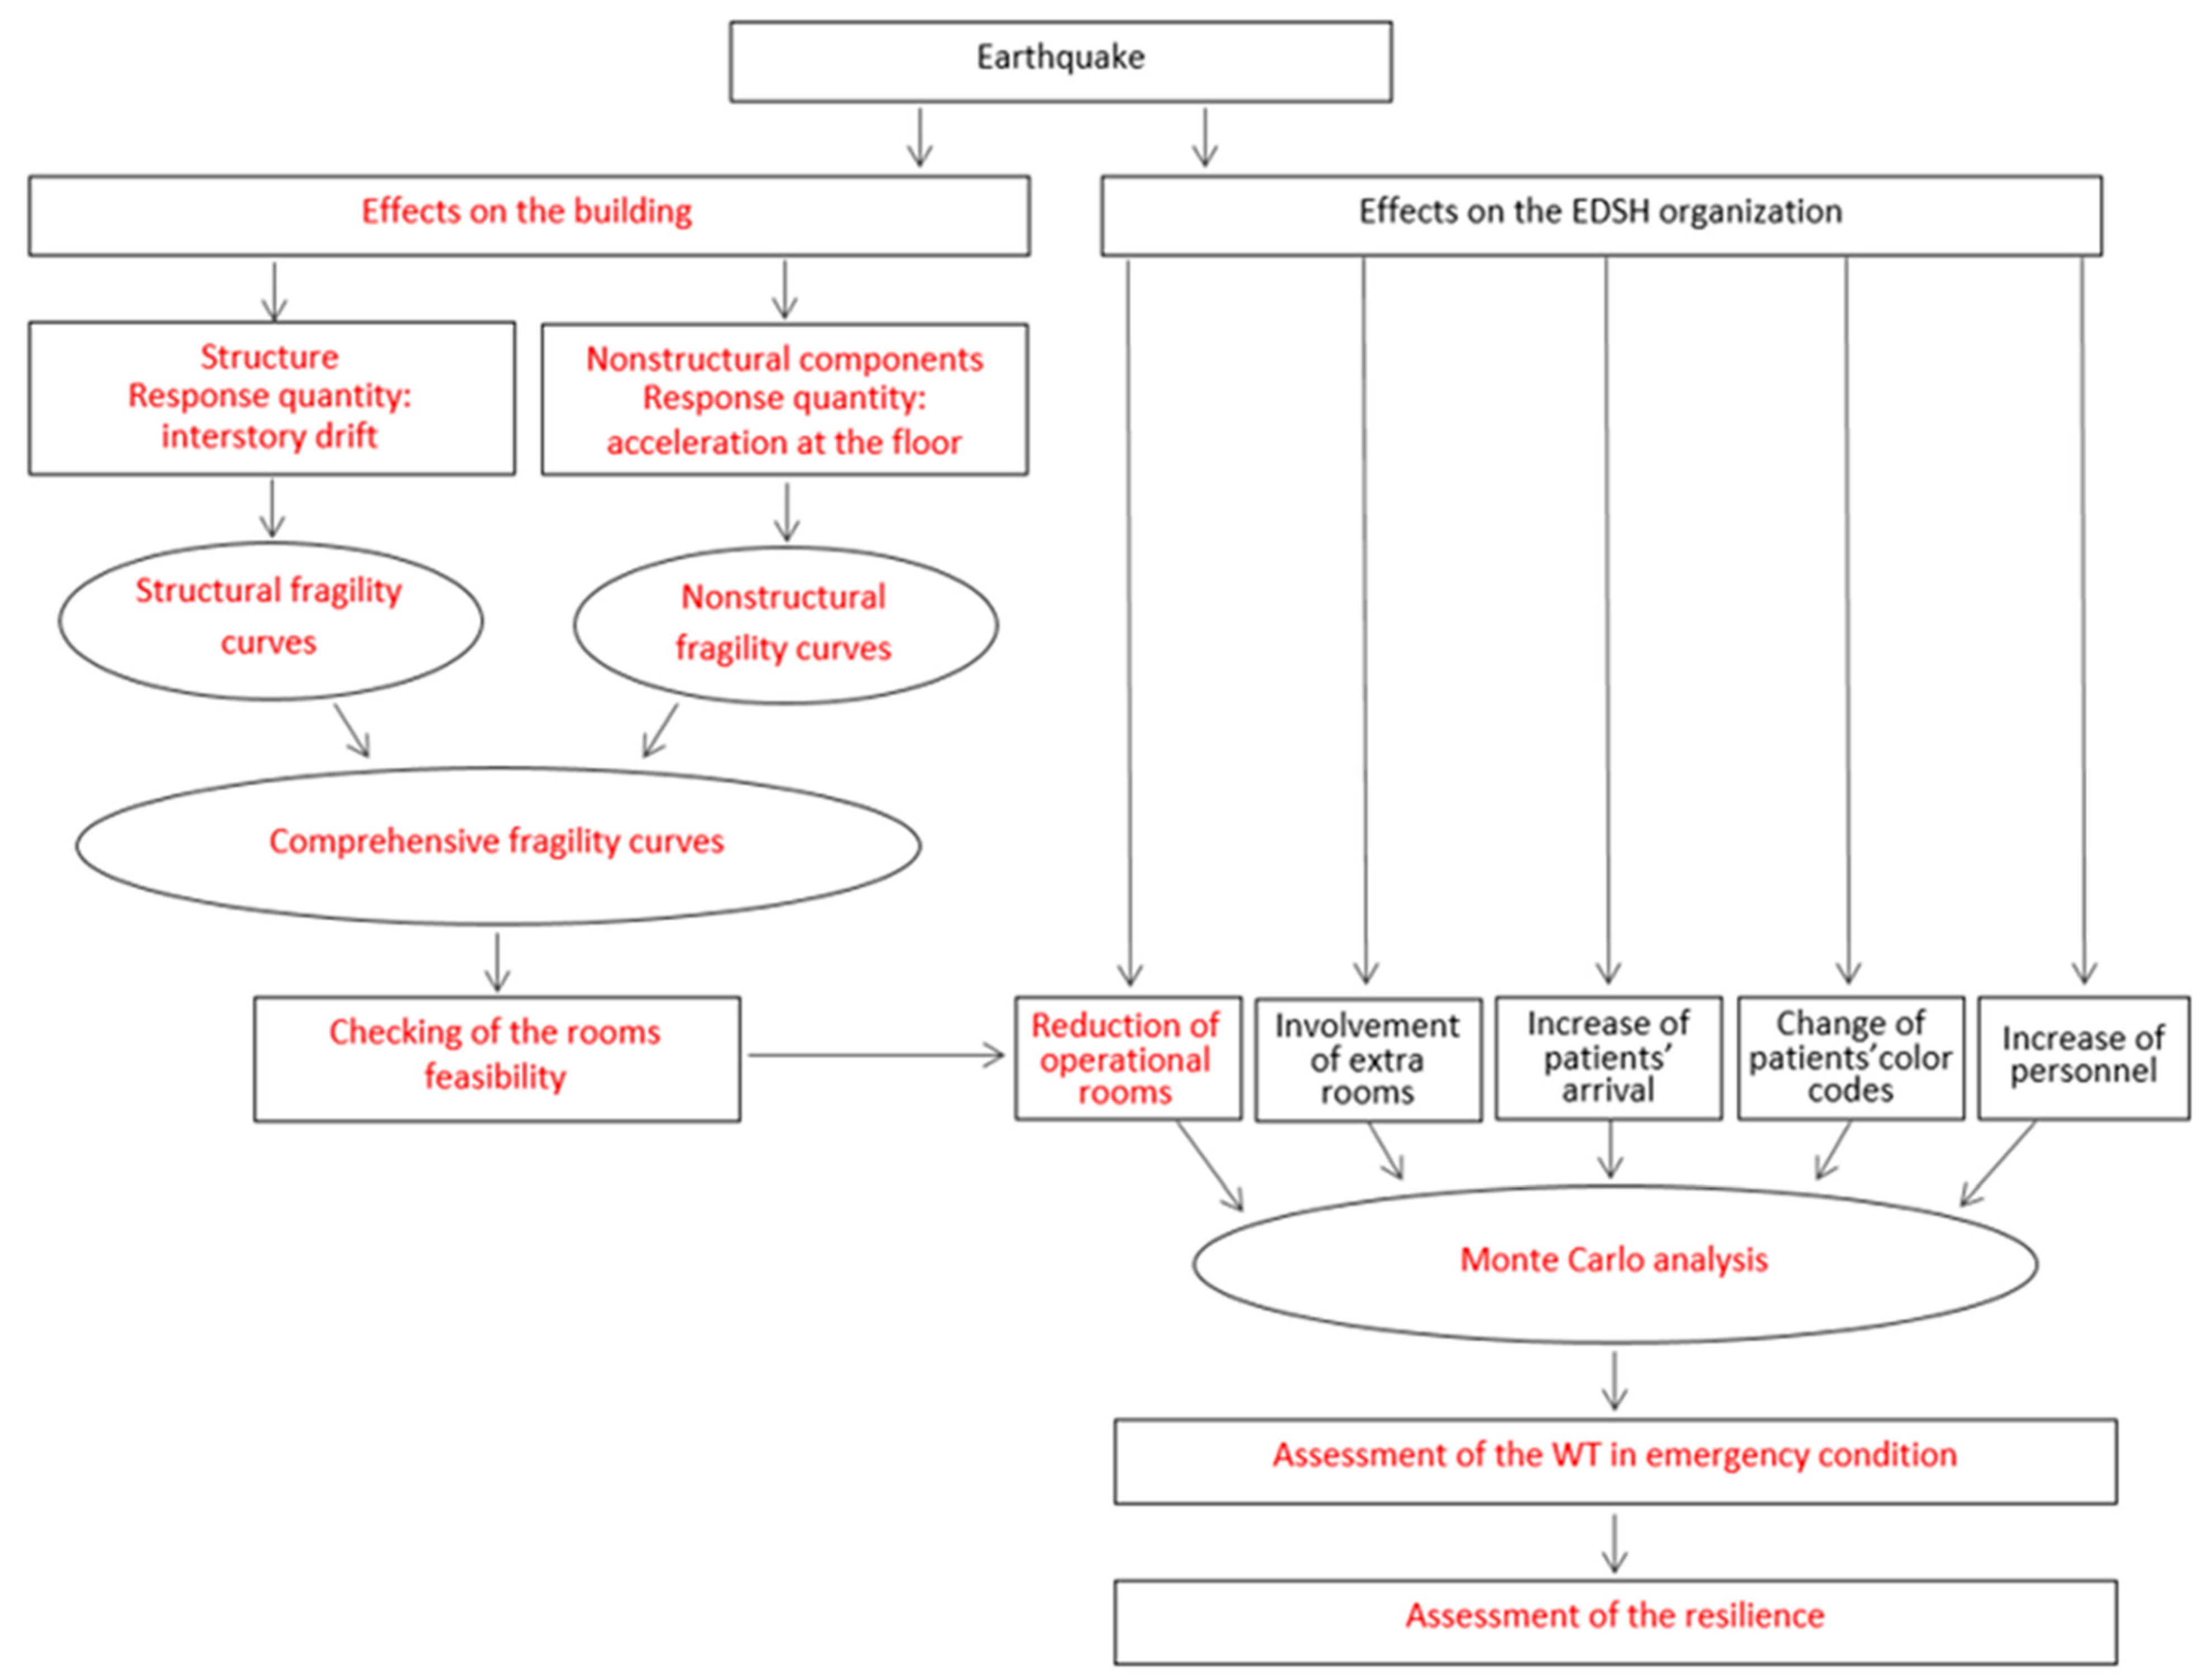
3.3. Effect of the Earthquake on the Physical Systems

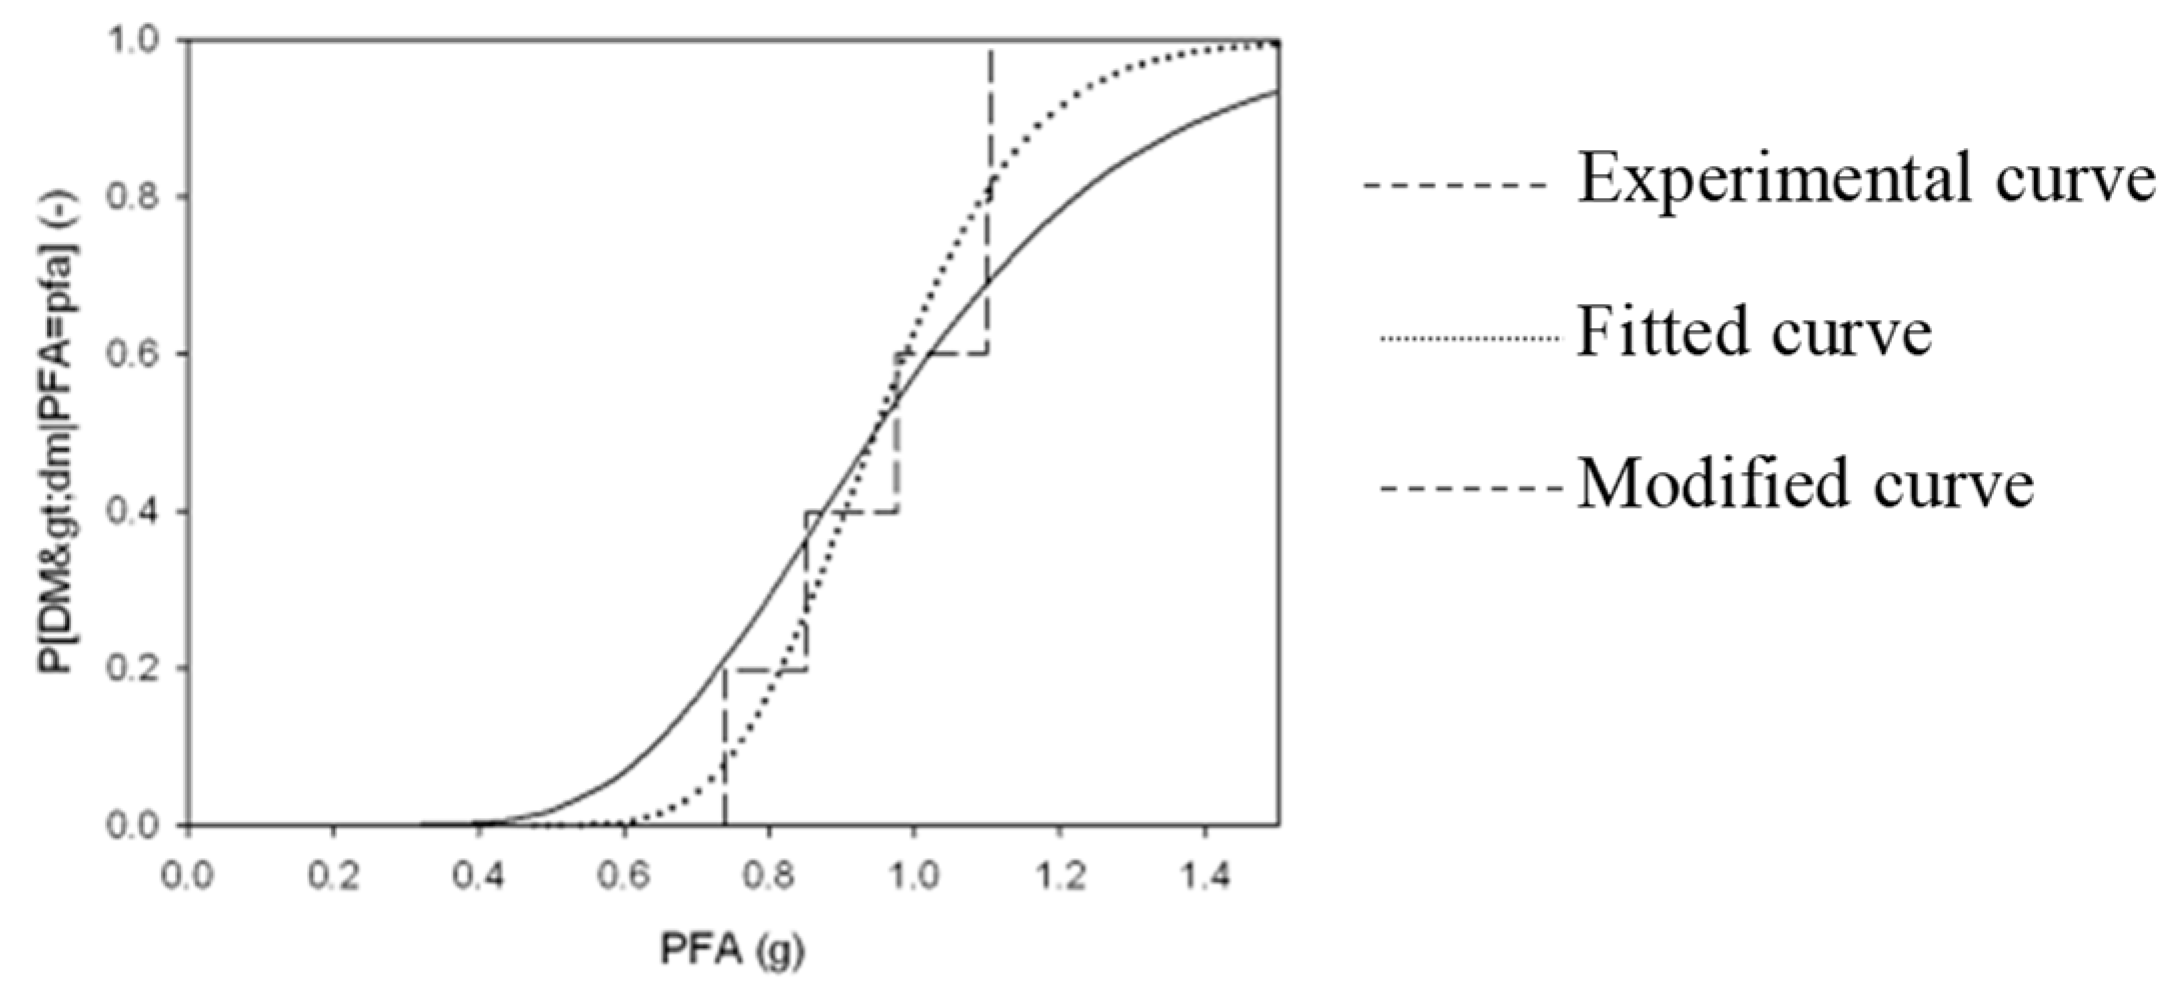
3.3.1. Fragility Curves of the Structure

The structure’s functionality with reference to the seismic hazard can be easily evaluated by comparing its seismic response to the expected site earthquakes to the performance limits provided by the Codes. This work represents the building’s structural response through a 3D Ruaumouko model developed in cooperation with the Istituto Universitario di Studi Superiori (IUSS) of Pavia, Italy [48,55]. The inelastic behavior of beams and columns has been described through concentrated plastic hinges at their ends and by neglecting the confinement effects of the transverse reinforcement, which does not comply with the current standard, resulting in almost ineffective. The shear mechanism’s effects on the joints’ behavior have been taken into account.
The structure’s seismic response has been checked by performing a preliminary modal analysis, followed by an incremental dynamic analysis for both sets of records of ground motions presented in Section 3.2. The limit condition assumed in the IDA is the achievement of the assumed limit deformation of each structural element.
The response quantity selected to represent the structure’s seismic response is the inter-story drift, read as the mean value of the response domain provided by IDA. The response domains have been compared to the limit values provided by FEMA P695 [54], and the cumulative conditional probability of exceeding the limit values has been determined. The obtained fragility curves are shown in Figure 14.

3.3.2. Fragility Curves of the Nonstructural Components

The building’s functionality during a seismic emergency has been checked using fragility curves referring to both the structure and the nonstructural components.
Suspended ceiling. Figure 15 shows the fragility curves [55] found for the EDSH’s two most strategic rooms, i.e., the emergency room (ER), where severely injured patients are located, and the OBI room, which holds the patients needing in-depth examination. In Figure 15, the fragility curves referring to the structure and the considered nonstructural components (ceiling system and cabinet) have been superposed. The “final” fragility curves expressing the physical adequacy of the checked rooms are indicated by the red lines, which represent the most conservative conditions provided by the fragility analysis.
Cabinet. The cabinet non-structural component is considered for the overturning limit due to the lack of data in other damage limit states and because the change of position does not cause big problems in the emergency room. Other damage limit states could be considered, for example, in the pharmacy, where medicine faults can cause greater consequences. Figure 16 illustrates the fragility curve derived by Cosenza et al. [56], which, for the present work, has been assumed as reliable data.

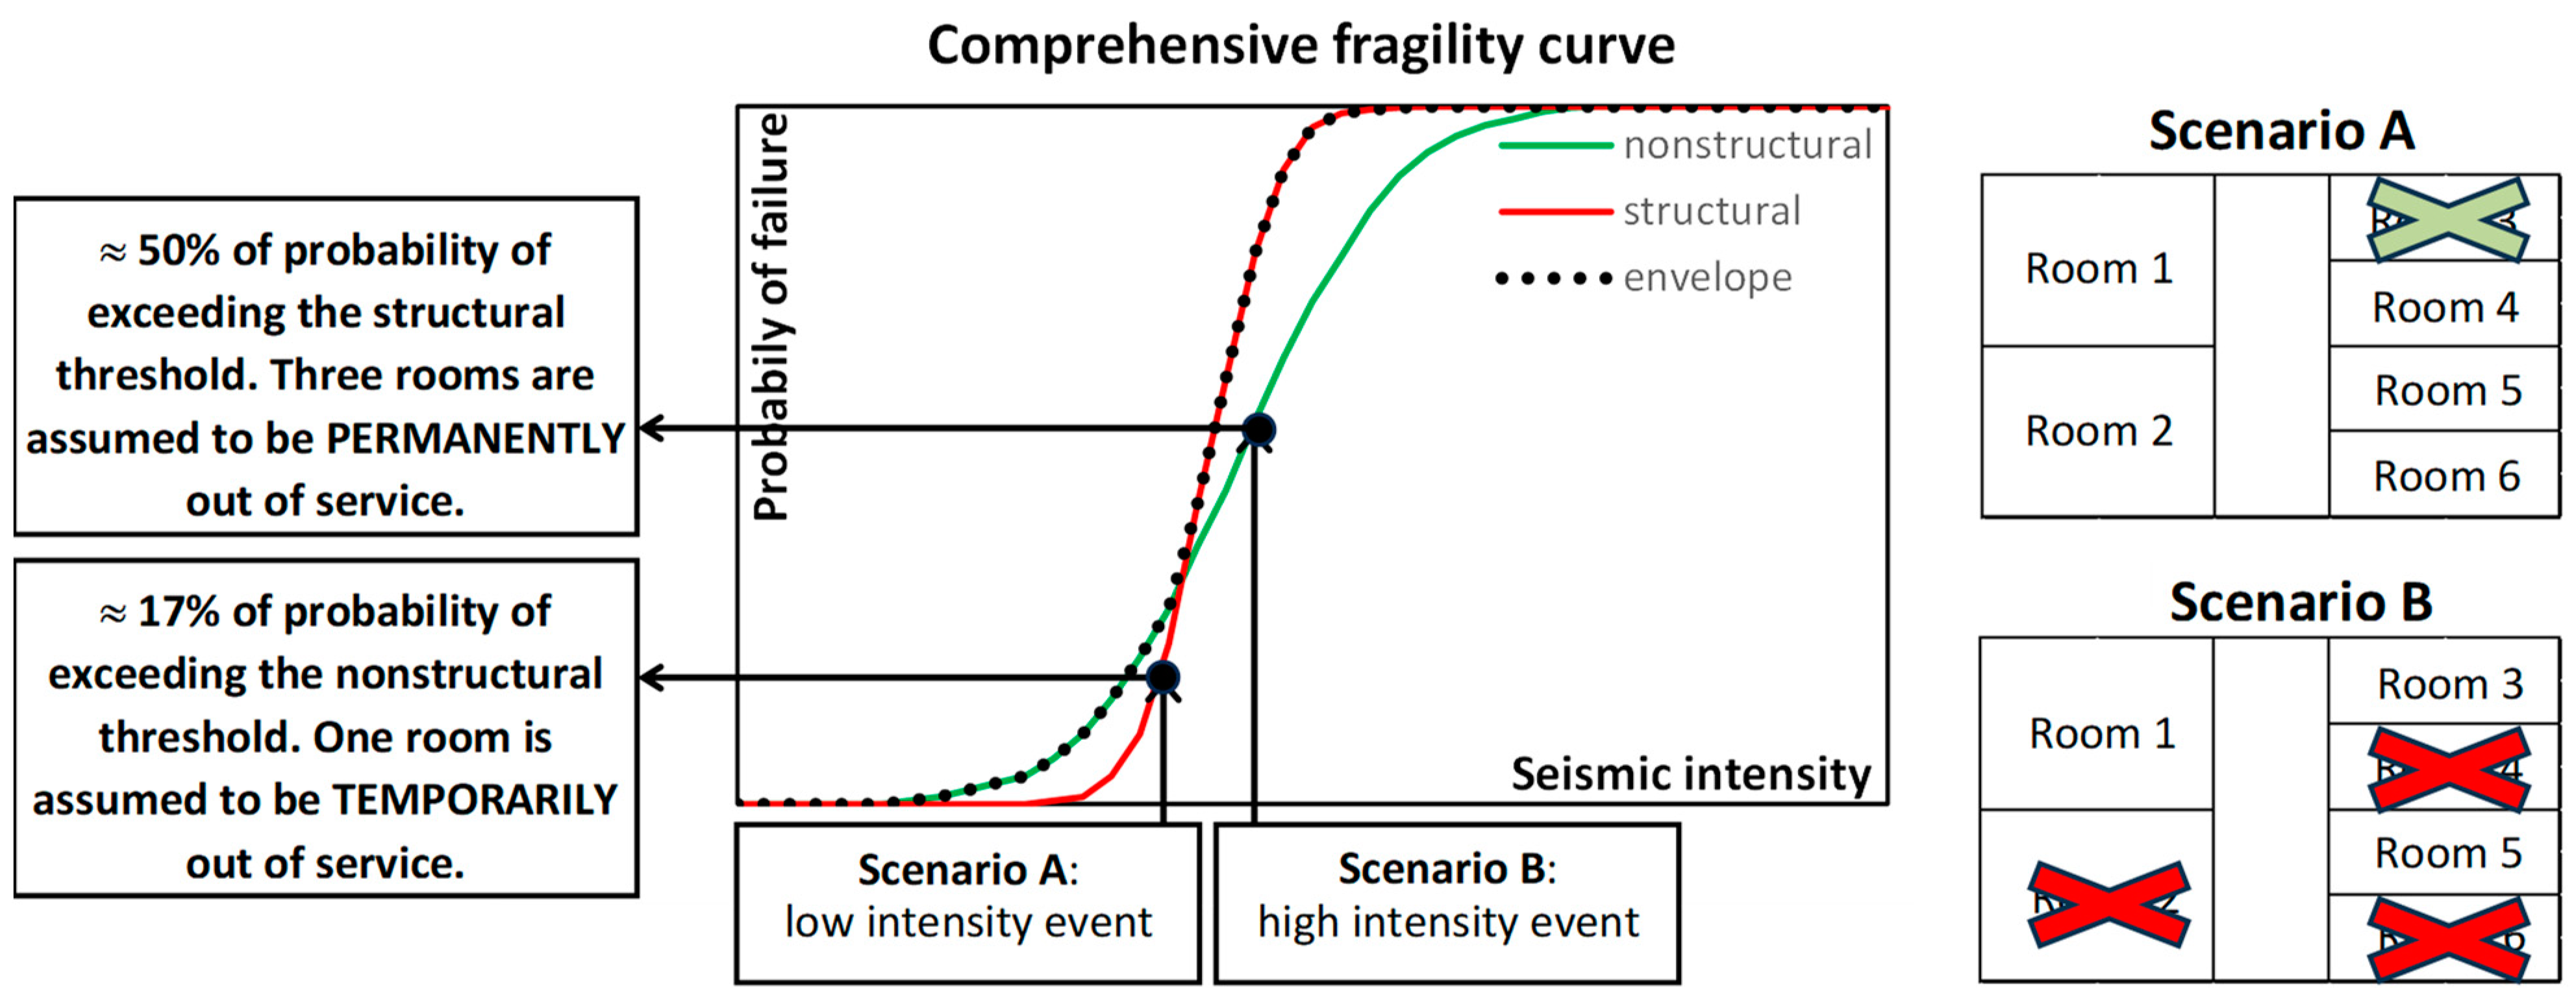
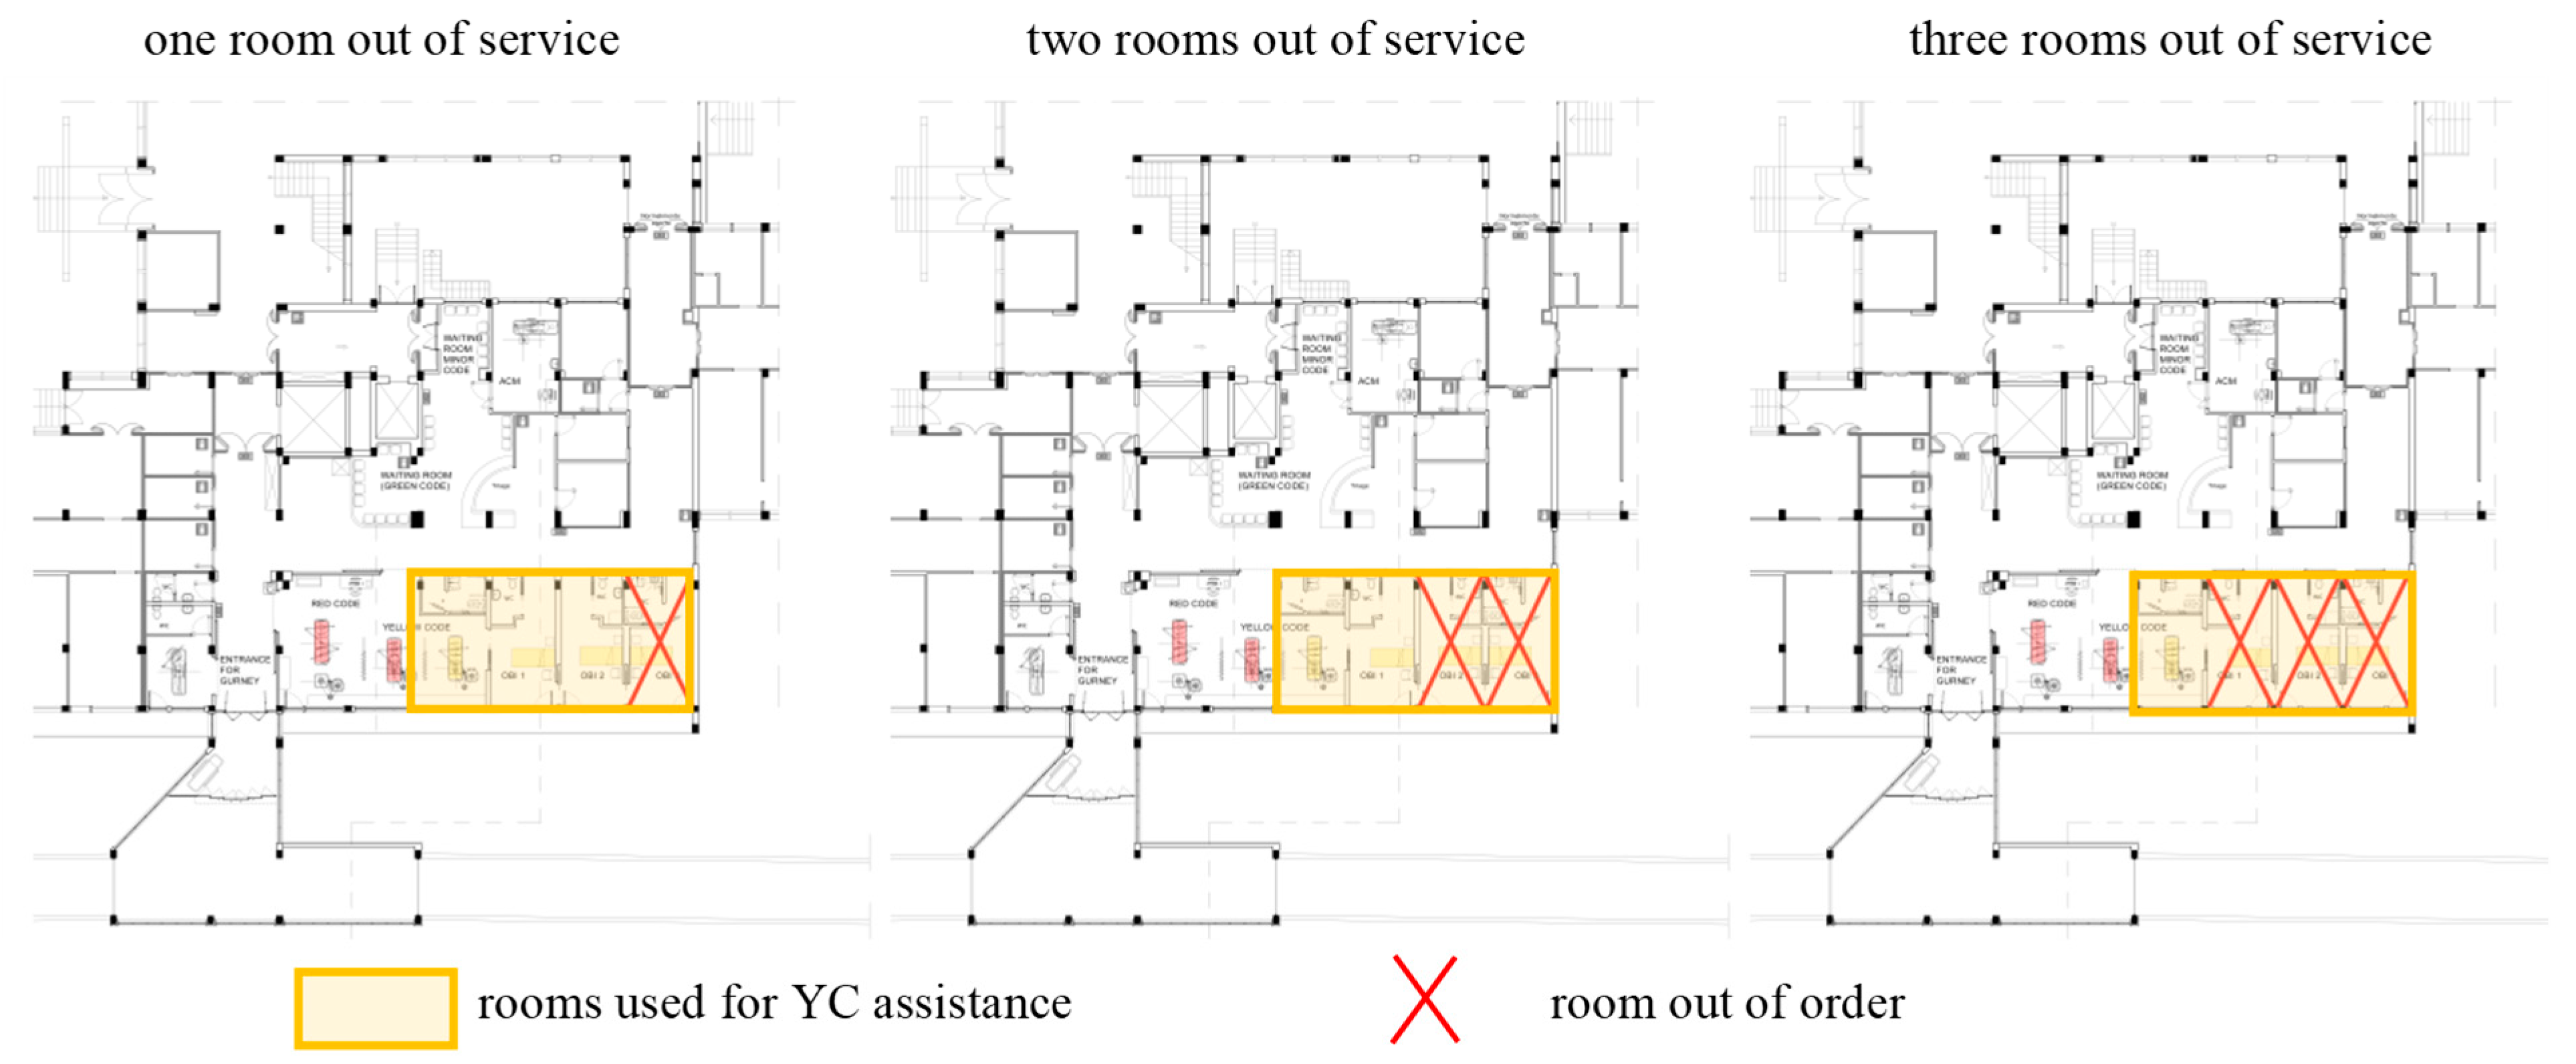
3.3.3. Damages Scenarios at the Occurring of Seismic Excitation

As a consequence of seismic events, the building can experience eventual damage, occurring to the structure or to the structural components. As explained in Section 2.4, the EDSH’s safety status can be assessed by comparing the expected PGA to the fragility curves of both structural and nonstructural components.
In this case study, the nonstructural components appeared stronger than the structure of the building. Therefore, the fragility envelope coincides with the structural fragility curves, and the rooms’ eventual loss of service must be considered permanent. In the analysis, the number of rooms assumed as possibly “out-of-service” ranges from 0 to three (half of the total), as shown in Figure 17, since a higher level of structural damage has been assumed to completely invalidate the EDSH functionality.

3.4. Effects of the Earthquake on the Organizational System

The EDSH’s activity is largely affected by the occurrence of emergencies. Namely, in the occurrence of an earthquake, the main changes involve the amount and type (color code) of care demand and the EDSH’s organization (number of personnel, schedule, and number of rooms used).

3.4.1. Changes in the Demand for Rescue Operations

In case of earthquakes, due to the damage to buildings, there is an abrupt increase in flow to emergency departments. Such an increase, despite being related to the intensity of the ground motion, is largely affected by the community’s properties, such as the population density and the type of infrastructure.
Unfortunately, there are no available data regarding the possible increase in arrivals to the EDSH in case of an earthquake; therefore, the arrival increase has been determined based on the functioning of the Northridge Hospital after an earthquake occurred in Los Angeles (CA) in 1994 [4], whose PGA was equal to 0.8 g. Since the expected ground motion has a much smaller intensity than the Northridge one, the arrival increase has been scaled consequently. The rate of patients’ arrival can be found in [43].
Another important change in the EDSH’s functioning concerns the type of rescue required by the patients. Even in this case, the available data are limited to two seismic events, both in California, Northridge (January 1994) and Loma Prieta (October 1989) [57,58,59,60,61]. Neither of such cases can be considered to be similar to the assumed case study, so t further adjustment was required: the rescue provided in the Northridge Hospital was classified according to the color-code approach used in the Italian health system (see [50]) in order to set the metamodel. The specification of the assumed color codes’ rescue, found as a result of such analysis, can be found in [43].

3.4.2. Changes in the EDSH Organization

The organizational procedures are very sensitive to emergencies. In Italy, the PEMAF protocol replaces the emergency department’s ordinary assets according to criteria previously assumed.
Namely, a larger amount of personnel is engaged with a 24-h working time. Furthermore, some extra rooms, usually used for consultations or surgeries, are assigned to rescue. The entire ER building is used for the major codes, which are assumed to arrive only by ambulance, i.e., through the vehicular path. All the specifications related to the PEMAF activation in the EDSH can be found in [43]. It’s worth noting that the increase in the rooms assigned to the emergency department implies the use of additional rooms located in adjacent buildings. In addition, the patient treatment procedure is changed, and patients with “minor codes” are not treated in the emergency room. Only the red and yellow zones are located within the emergency department, while the green zone is placed in the rehabilitation gymnasium area, in the adjacent building, and the operating rooms are located on the top floor. Therefore, they can be reached only through the elevator, and the only available elevator can host only one patient (accompanied by a nurse). In this study, the green zone is not included since the analysis is focused only on the major codes. The flowchart of the major codes is shown in Figure 18.

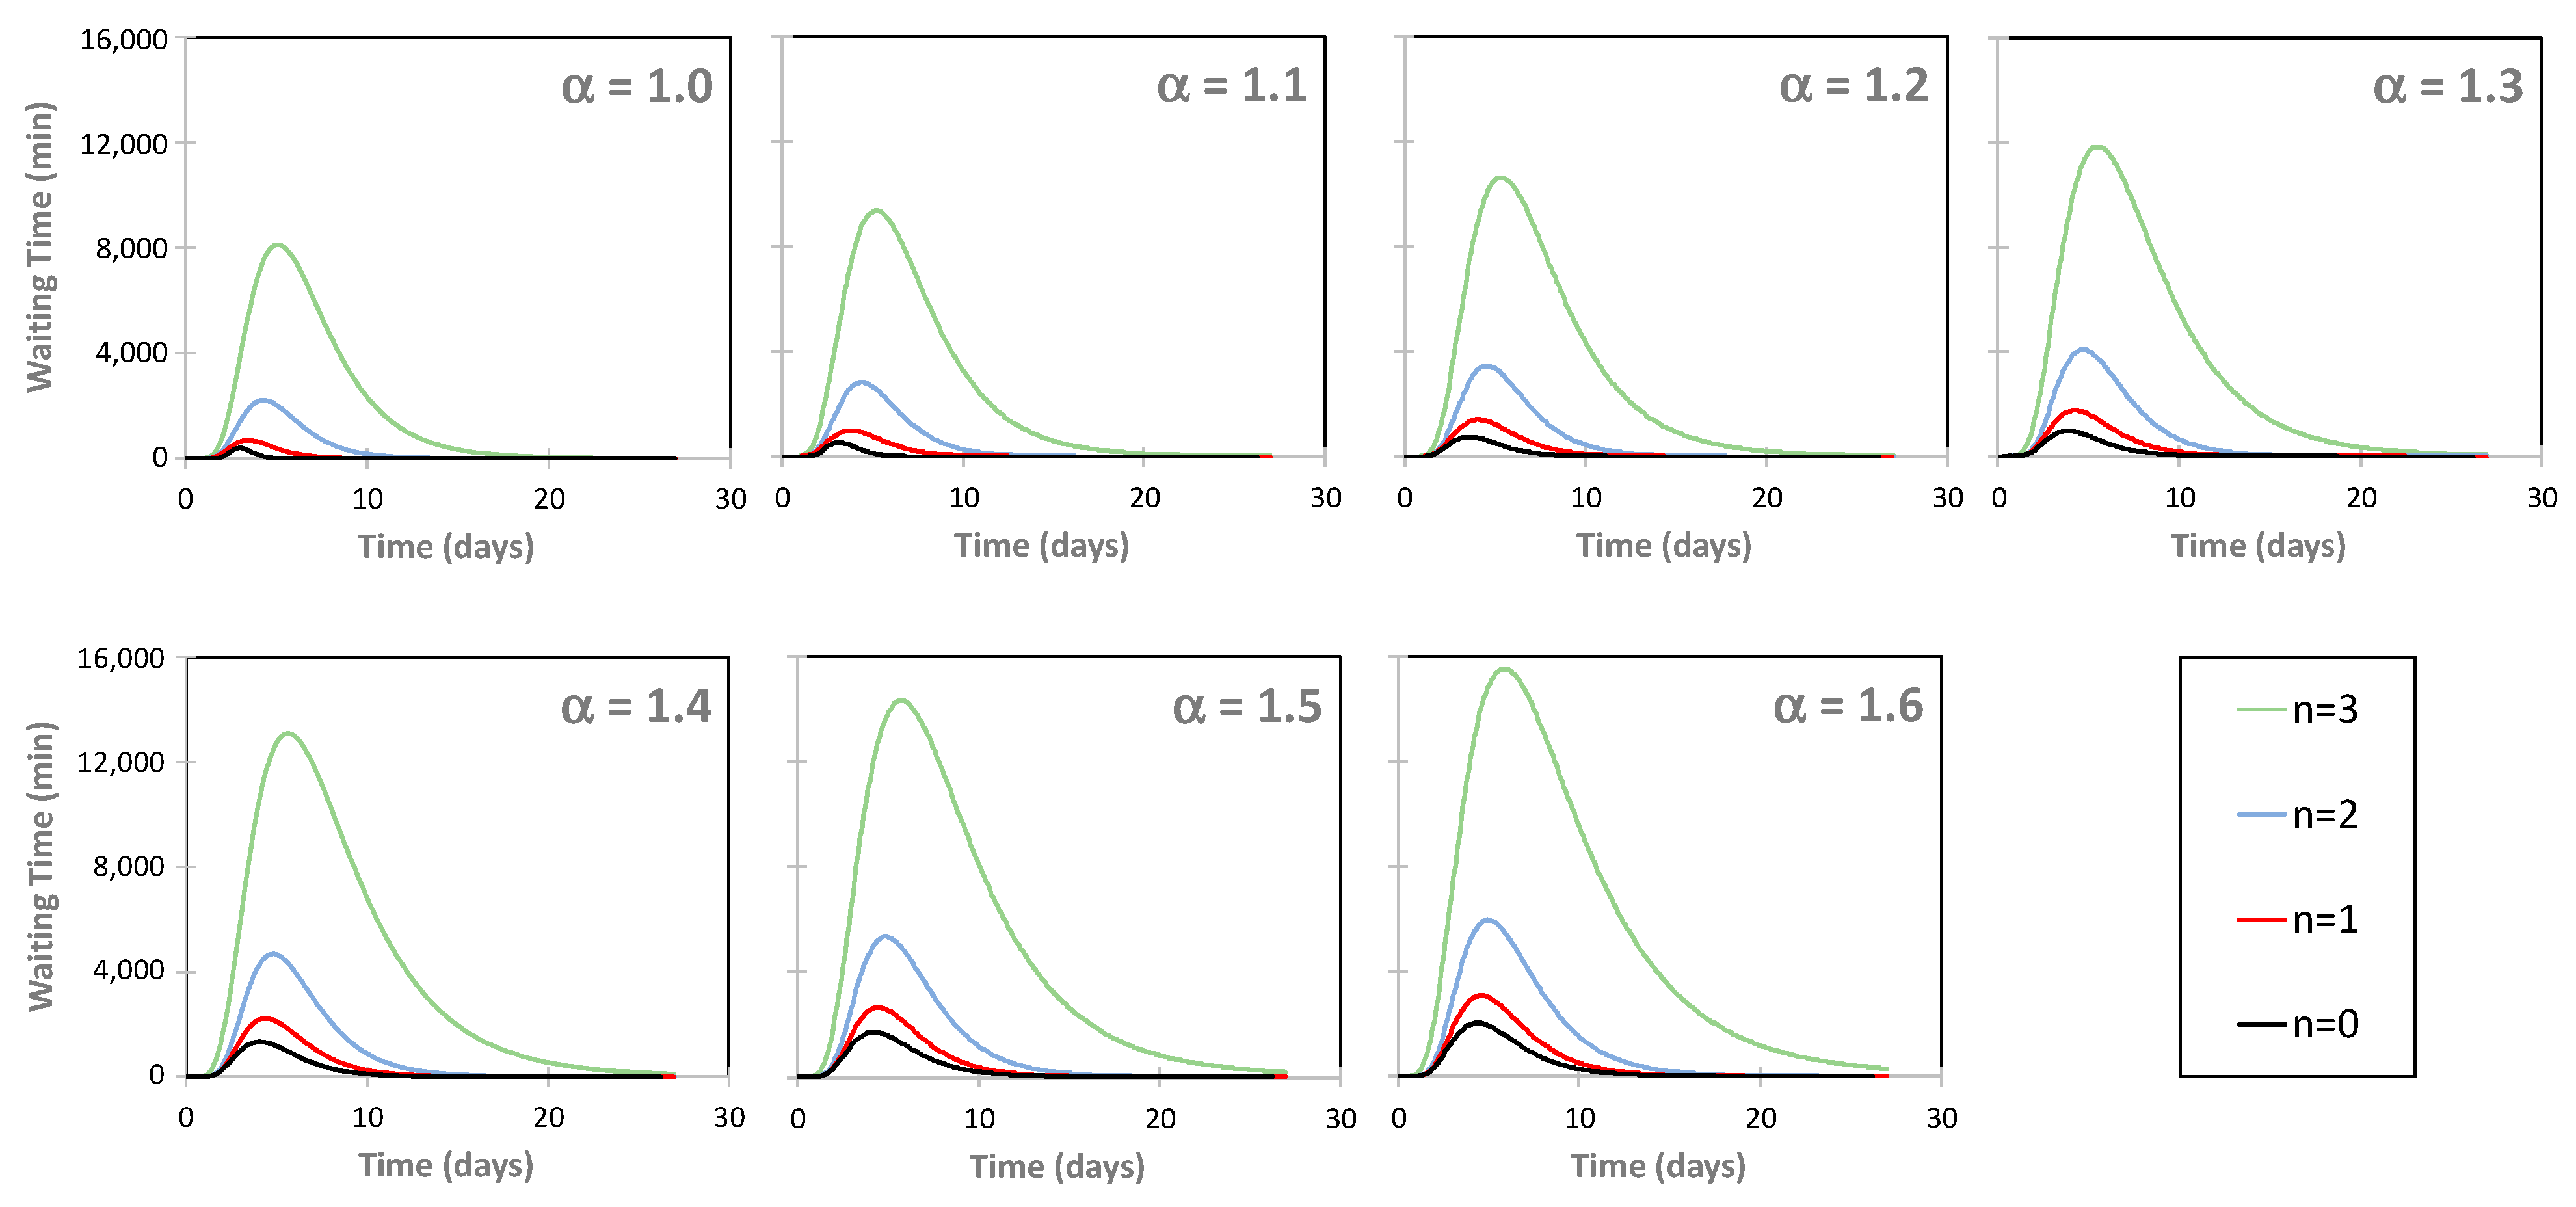
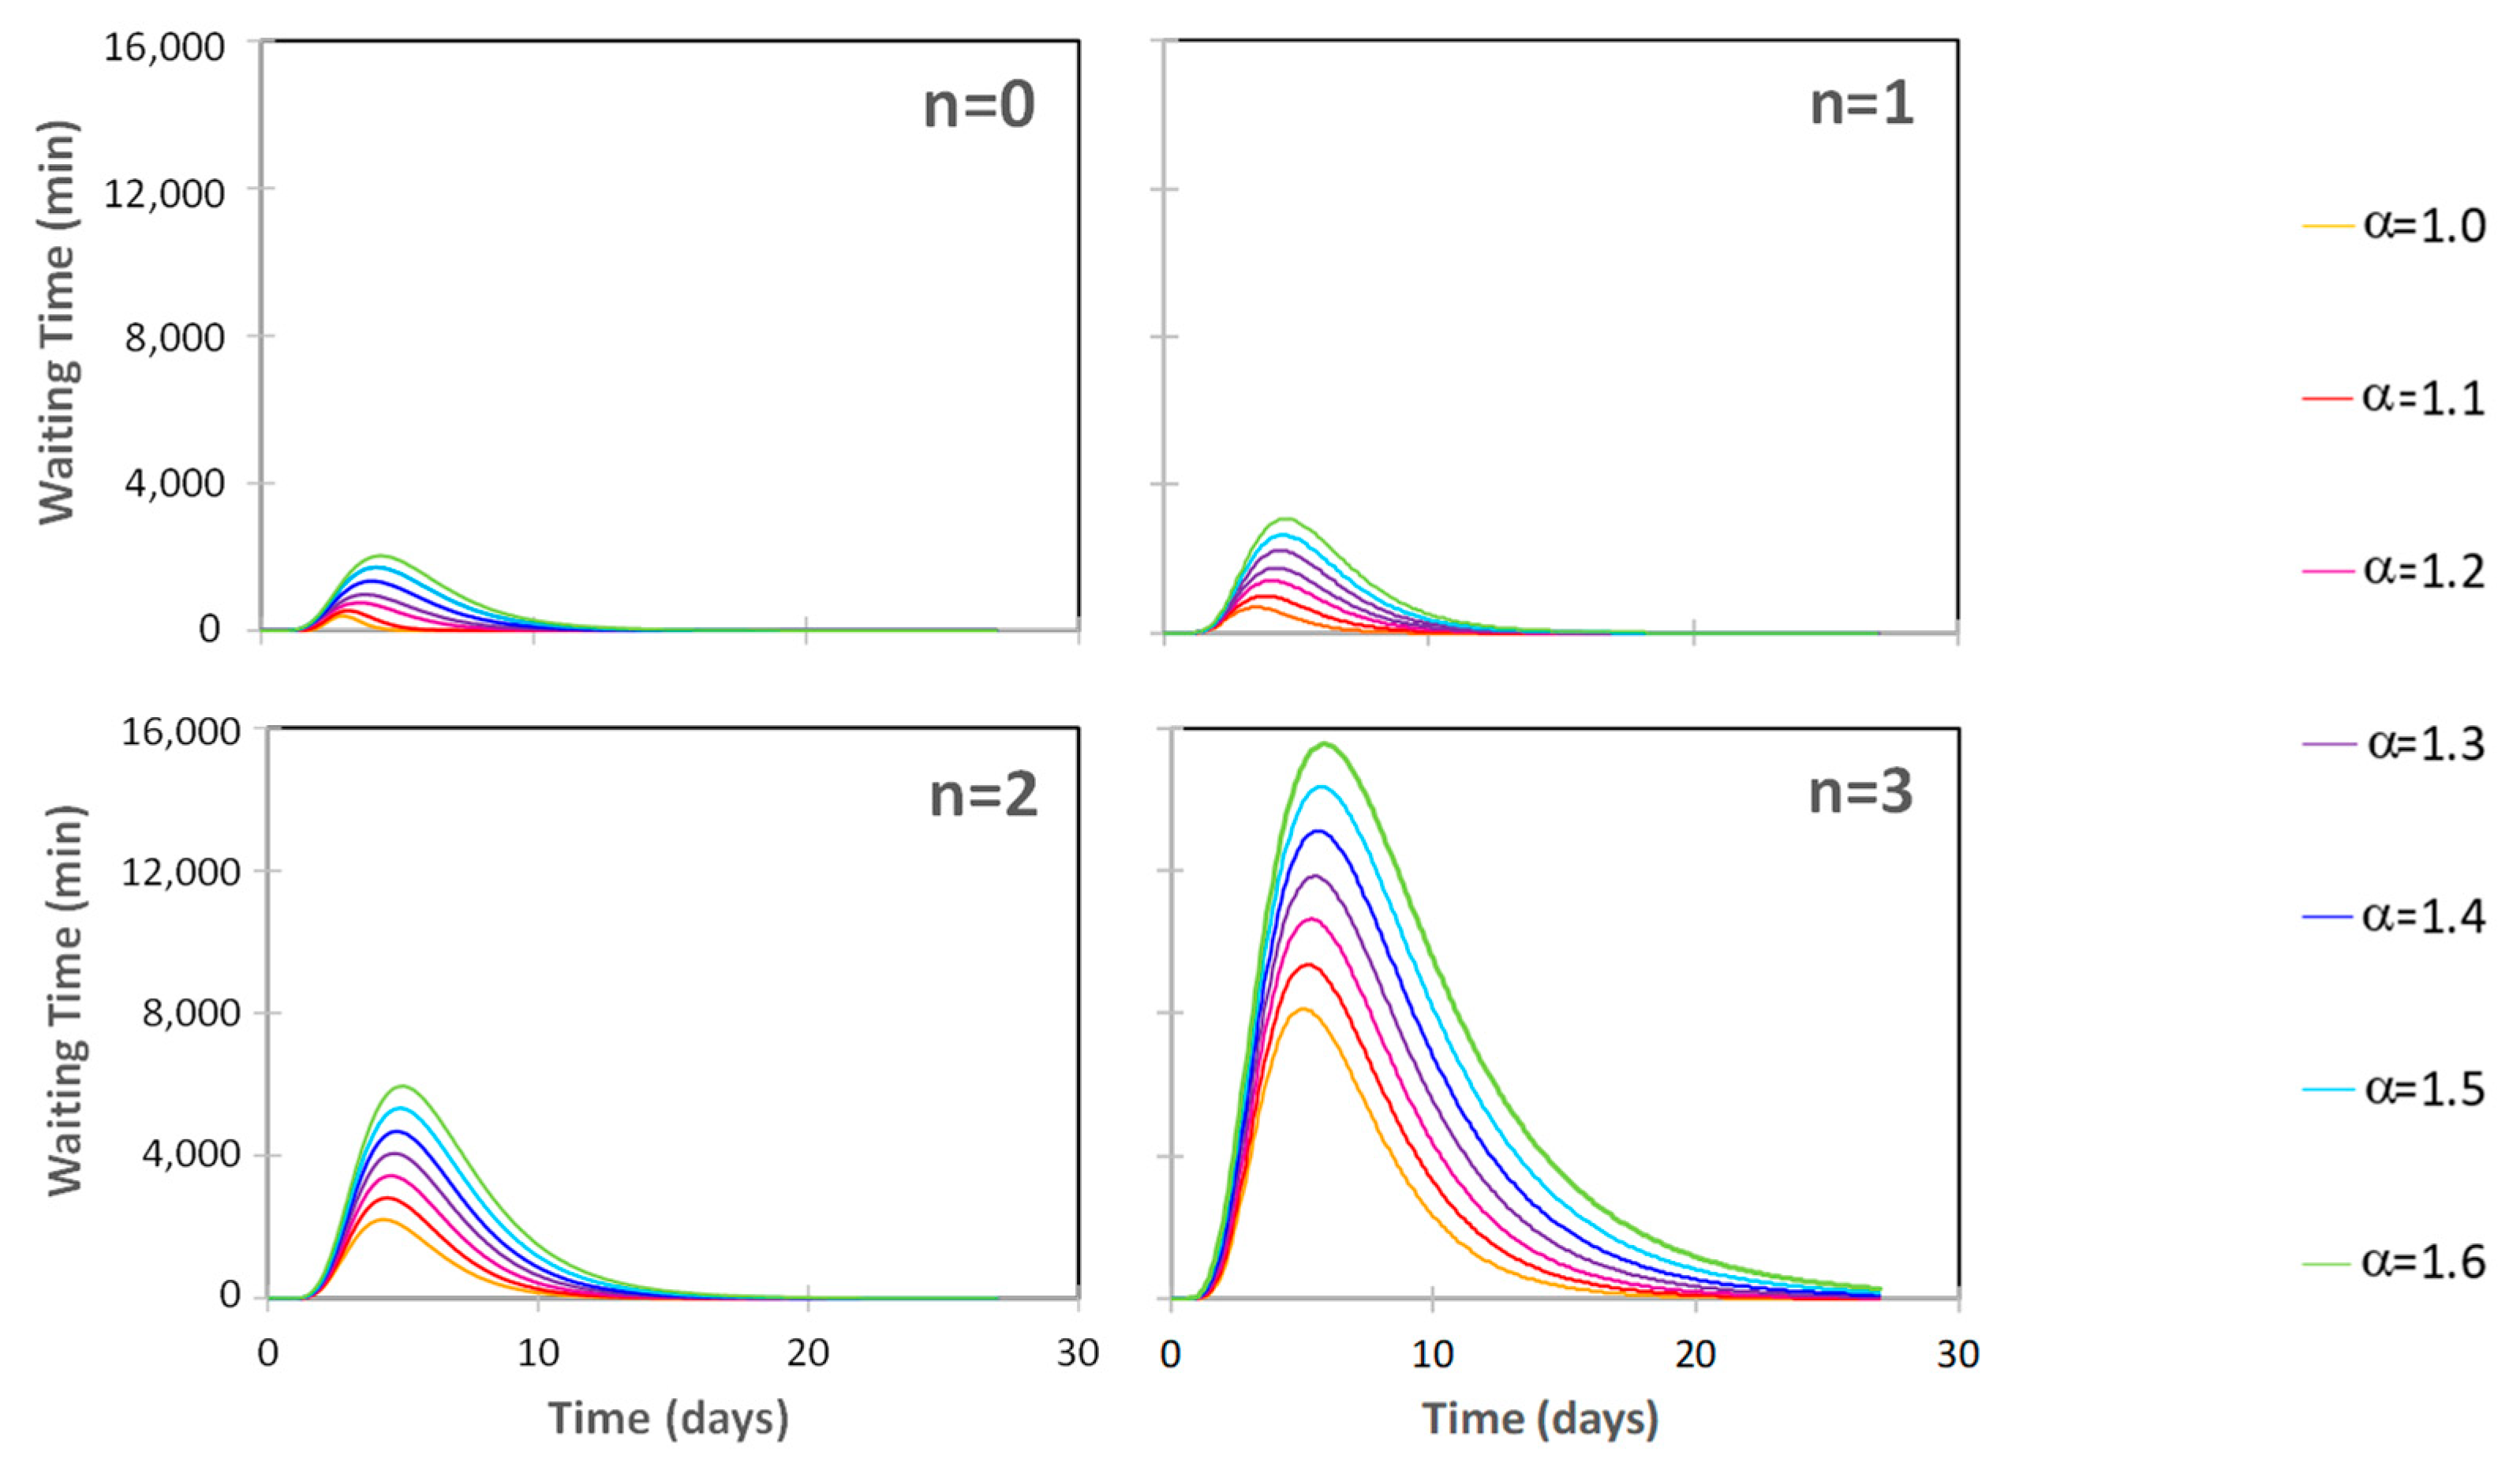
3.5. The EDSH’s Functionality during a Seismic Emergency

The analysis of the EDSH’s functionality in emergency conditions has been performed over a period of 30 days (see Figure 19), considering the occurrence of a seismic emergency after 2 days of normal service of the hospital, 3 days of increased patient arrival, and the remaining 24 days of a normal rate of arrival.
In the analysis, different assumptions compatible with the described seismic emergency have been made regarding the increase in the patient arrival rate and the out-of-service number. The seismic event described in Section 3.2 has been assumed to be the strongest expectable ground motion. The seismic scenario, therefore, is described through an increase (α) of the rate of arrival ranging between 1.0 (no increase) and 1.6 and a loss of service of rooms (n) ranging between 0 (normal integrity of the EDSH) and 3 (three rooms out-of-service). For each of the 28 combinations of parameters, a Monte Carlo analysis consisting of 100 different cases has been run.
For simplicity’s sake, only the yellow-code patients have been checked in this paper. Indeed, the increase in waiting time affects the yellow-code patients much more than the red-code ones since the number of yellow-code patients is much larger, and the red-code ones can take advantage of their priority in care.
Figure 20 and Figure 21 show the results of the analysis as a function of α, and n respectively. As can be noticed, the closure of one room does not affect the system’s functionality very much, while when the closure involves three rooms, the WT increases by almost ten times.

4. EDSH Resilience

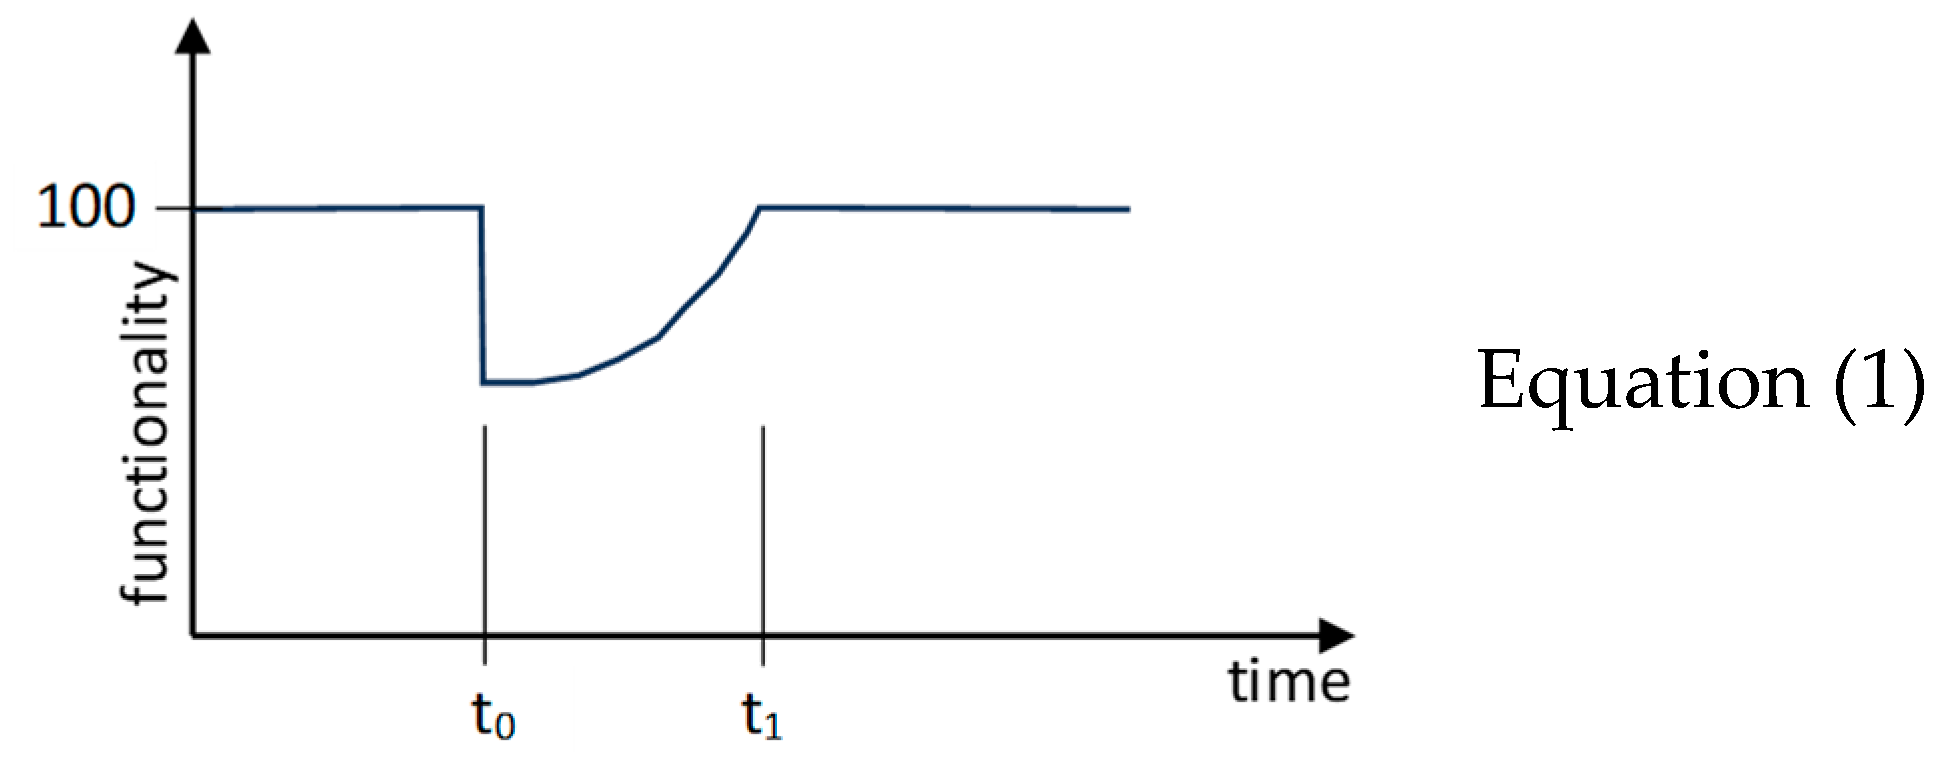
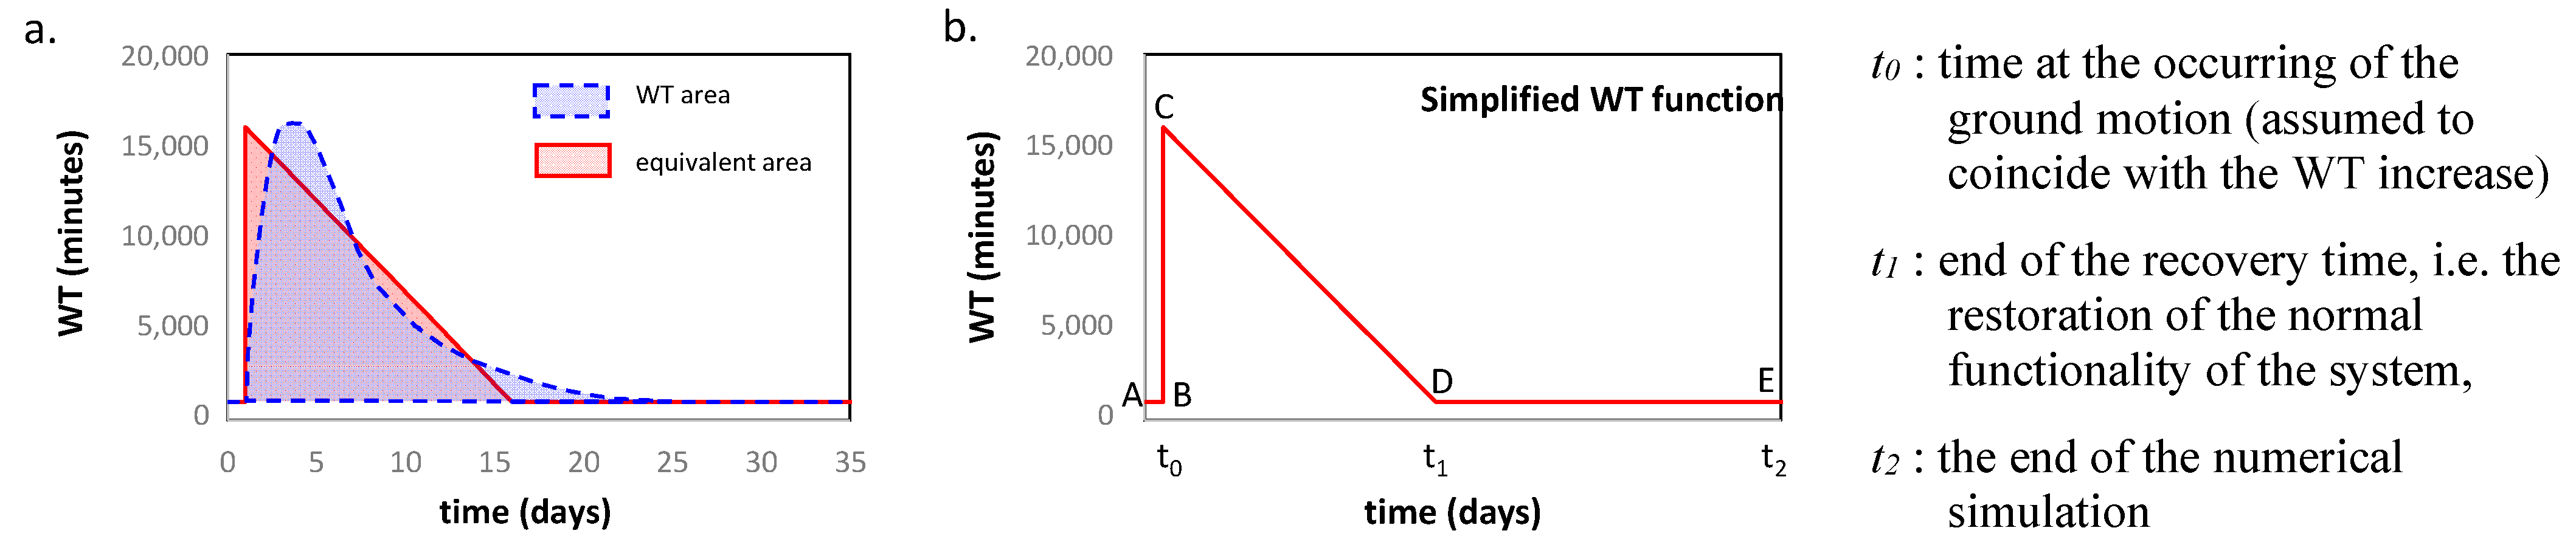
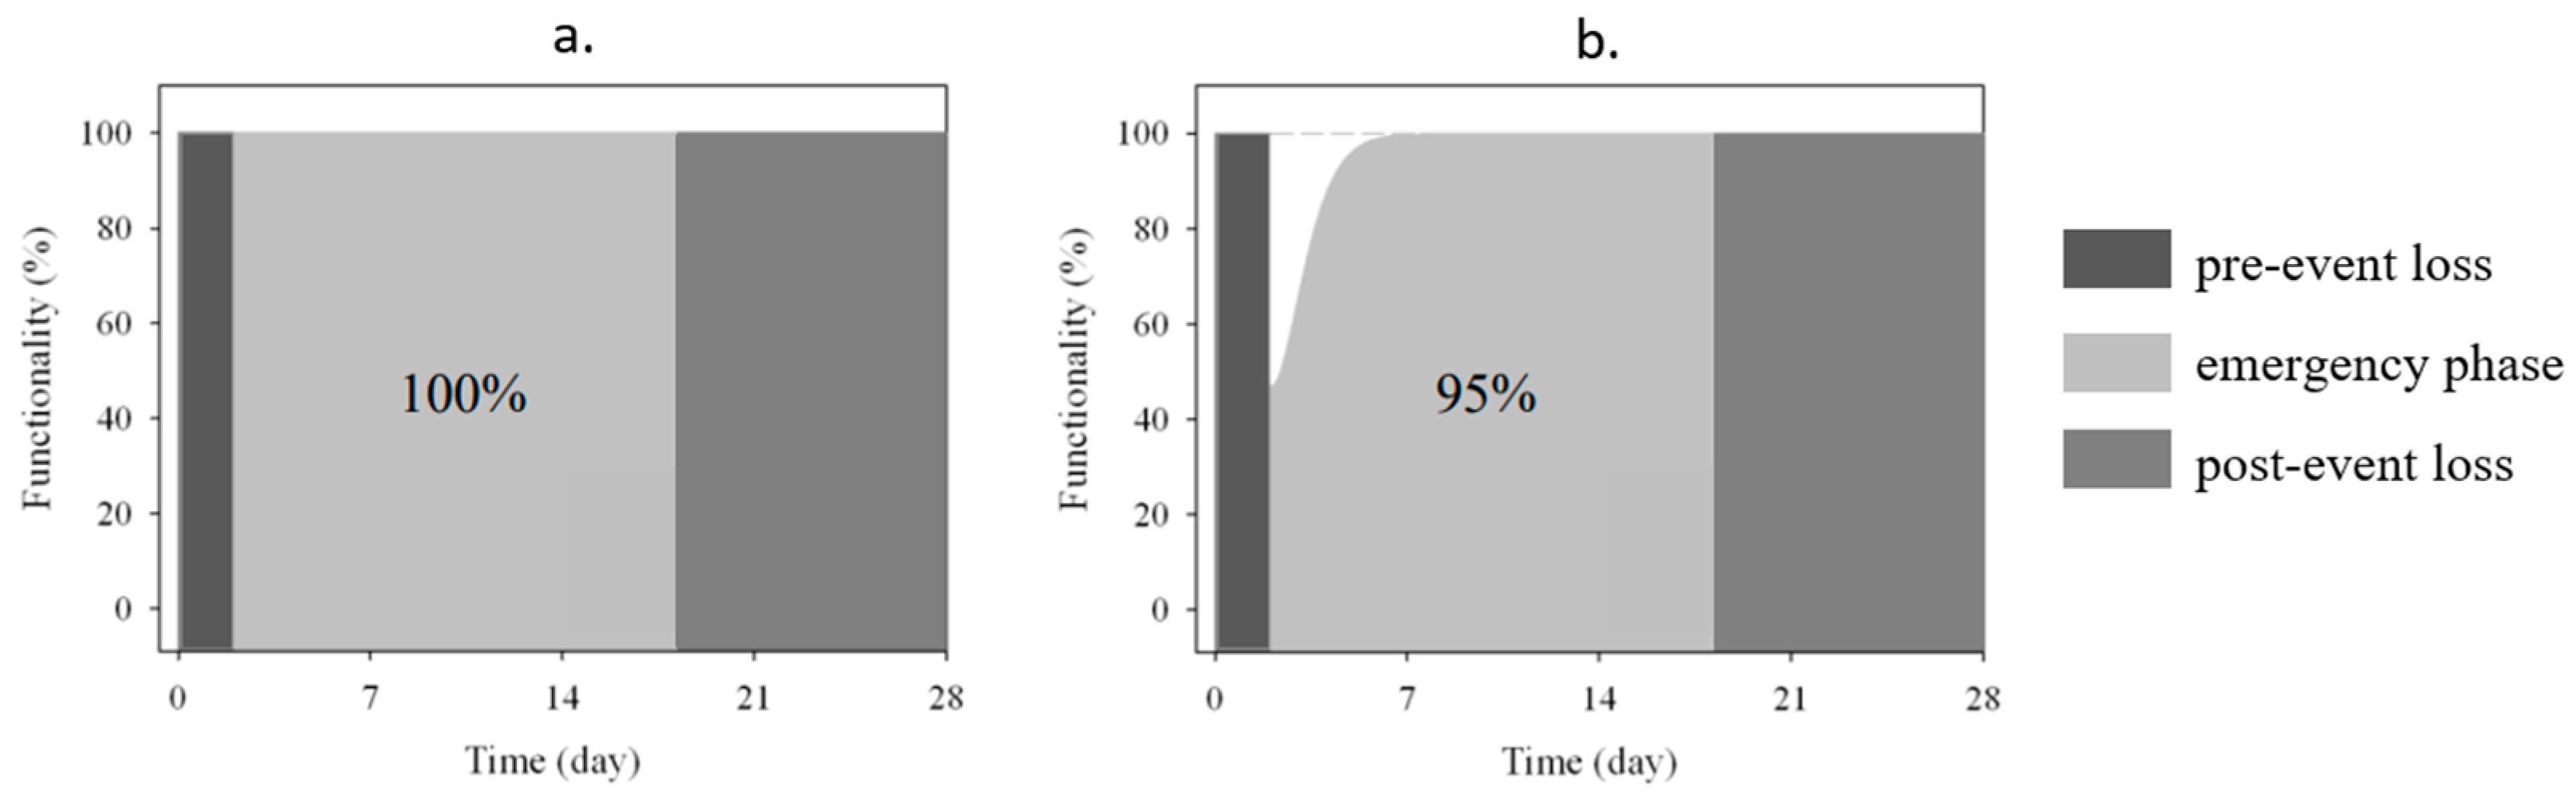
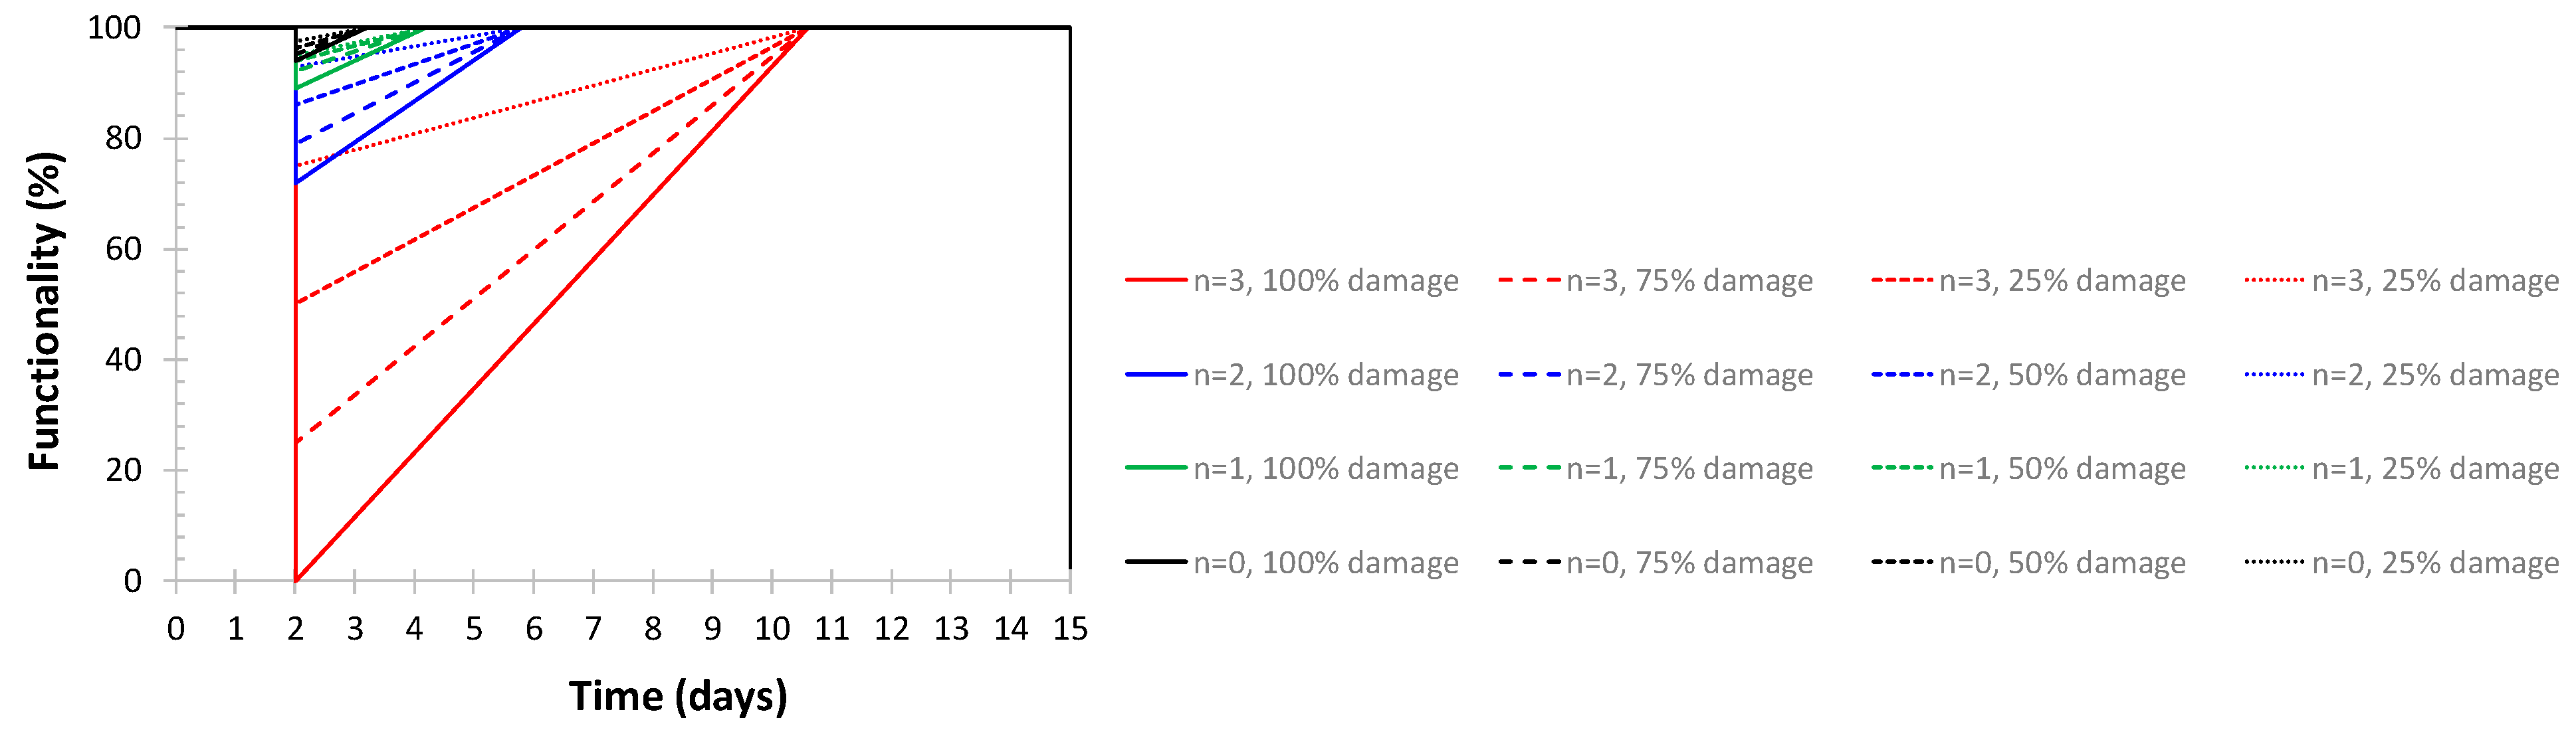
4.1. Resilience Modeling

In this work, the resilience has been quantified according to the approach provided by Bruneau & Reinhorn [2], who defined it as a non-stationary stochastic process, measured by the size of the expected degradation in functionality (probability of failure) over time (time to recovery), as shown in Figure 22.
R = t 0 t 1 100 q ( t ) d t
The functionality of a system is assumed to vary with time, and it is defined as representative of the quality of an essential system in the community. The performance can change in a range from 0% to 100%, where 100% represents no degradation in service and 0% means no service available. If an earthquake strikes at time t0, the functionality of the system abruptly reduces; the restoration of the system is expected to occur over time until time t1 when the functionality achieves 100% again.
The trend of R within the recovery time, TRE, defined as the range of time between t0 and t1, is not easy to assess since the recovery process depends on multiple factors, such as time dimensions, spatial dimensions (e.g., different neighborhoods may have different recovery paths), and interdependencies between different economic sectors involved [3], [42]. In this work, the simplified approach proposed by Cimellaro et al. [3] has been assumed; it leads to choosing among three possible recovery functions depending on the system and the social response: (i) a linear equation, (ii) an exponential equation [62], and (iii) a trigonometric equation [63].
The simplest form is the linear recovery function. It is generally used when there is no available information about the organization of the community, and it is suitable for average-prepared communities (when no information is provided regarding preparedness and available sources). The trigonometric model is suitable for well-prepared communities, while the exponential model is suitable for well-prepared communities with good organization and organized support by surrounding areas.
In this work, the linear model is adopted since there is no specific information about the preparedness of the Emergency Department to catastrophic events. As stated in the Introduction, the functionality of the system has been measured through the WT of yellow-code patients arriving at the EDSH. Figure 23a shows a generic WT function representing the increase induced by an emergency, i.e., at the occurrence of a ground motion.
The loss of functionality corresponds to the area enveloped by the curve of the WT expressed in the time domain. To quantify the resilience of the system, such area needs to be quantified by assuming an equivalent, simplified distribution, as the one shown in Figure 23b. With reference to this simplified curve, the loss of functionality consists of the area inscribed under the poly-line B-C-D. It’s worth noting that point C becomes the representative point of the loss of functionality of the system, while point D represents the restoring point, i.e., the time the system reverts to its functionality.
The loss of functionality is determined based on the worst case calculated through the simulations, corresponding to the maximum value of WT registered in the analysis. By assuming a case of total loss of functionality, it is possible to assess the other resilience curves following the general equation exemplified below:
full functionalityfunctionality loss (p1 = i, p2 = k) = residual functionality (p1 = i, p2 = k)
where p1 and p2, respectively, represent Condition 1 and Condition 2, which vary during the scenario, and the functionality loss is represented by the maximum waiting time (point C).
100 − YcoordinateC point (p1 = i, p2 = k) = residual functionality
To assess the y-coordinate of point C on the resilience curve, it is necessary to equalize the results of the maximum waiting time (by representing point C on the WT curve and 0% functionality in the system) for each simulation through the following proportion:
Max(p1 = max, p2 = max): 100 = MaxWT(p1 = i, p2 = k): x
where p1 = max and p2 = max are the extreme conditions corresponding to the maximum WT. By assuming the maximum loss of the system’s functionality and the maximum waiting time (Equation (5)), all the other simulations, due to the variation of the parameters involved, are scaled based on the maximum value of C.
Max(p1 = max, p2 = max) = MaxLoss(p1 = max, p2 = max) = MinFUNCTIONALITY(p1 = max, p2 = max)

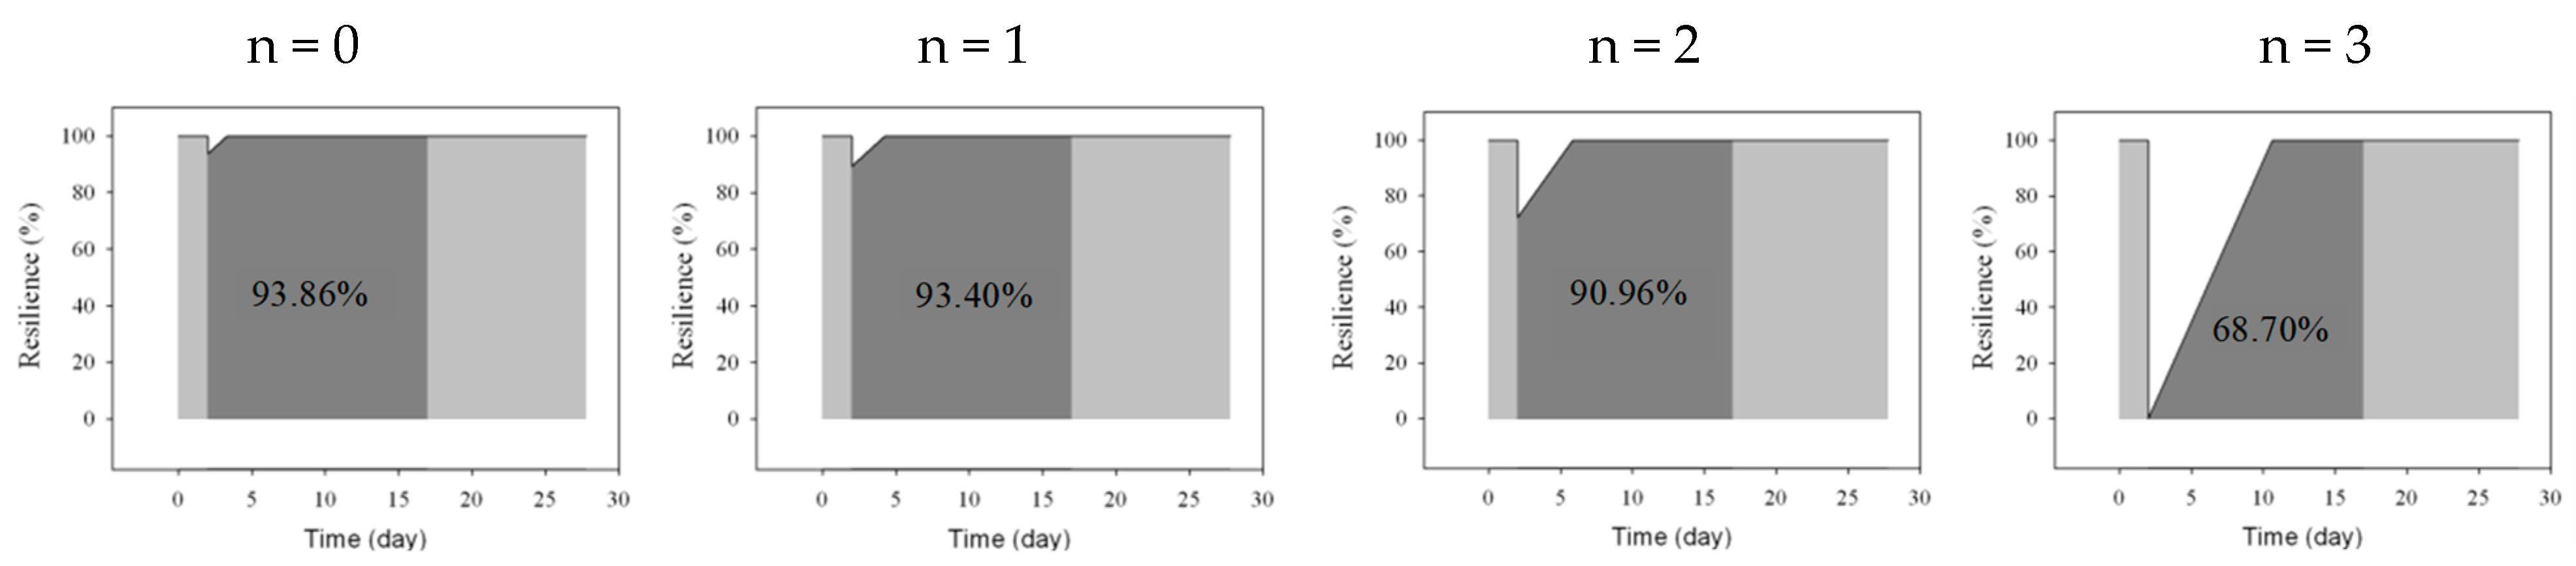
4.2. Resilience of the EDSH

The EDSH’s resilience has been assessed over a range of time equal to five times the emergency phase’s duration, assumed to be 3 days long. Therefore, the assessment of the EDSH’s functionality has been checked for 15 days from the earthquake’s occurrence, even though the system has not yet been completely restored. According to this assumption, perfect resilience (R = 100%) corresponds to no lack of functionality (see Figure 24a), while the worst possible scenario (see Figure 24b) corresponds to a total lack of functionality due to the maximum increase of WT assumed in the catastrophic event. Figure 24 highlights the considered “resilience area” (light grey) assumed to scale every eventual loss of functionality. All the possible cases can be assessed by calibrating these opposite outcomes based on their damage level, i.e., the WT increase due to the seismic event, through the ratio of the area bounded by the curve.
In this work, the total loss of functionality (100%) is calculated by assuming the equivalence of the waiting time and the functionality curves. Table 4 shows the main coordinates of the WT and the functionality curves. The numerical values refer to no increase in the rate (α = 1.0) and maximum structural damage (three rooms permanently out of service, i.e., n = 3), assuming a seismic shock (PGA = 0.27 g) occurring at t0 = 2 days.
The global behavior of the hospital system is summarized in Figure 25, where four percentages of damaged areas related to the corresponding n parameter are additionally plotted. The derivation of damages equal to 0%, 25%, 50%, 75%, and 100% for the areas involved are calculated in order to understand the system’s varying response. Point D of the resilience curves never changes within the same range (same n-value) since the variation of the damage is applied without affecting the BD segment of the resilience curve, which is a function of the n parameter. On the contrary, the area of the resilience curve and, consequently, the peaks and the recovery segment (segments BC and CD, respectively) are influenced by the extension of the damaged area. By applying Equations (2)–(5), all the points needed for the construction of the resilience curve are assessed for the simplified cases of n variable, 100% functionality of the available rooms, and α = 1.0.
The resilience is calculated within the range of 18 days, which covers the emergency phase (3 days) plus a further 15 days after the shock, i.e., five times the emergency phase’s length. This area is rudely scaled based on a fully operational curve, corresponding to resilience equal to 100%, and is associated with no damage occurring.
Figure 26 shows the functionality curves found for the different n-values, together with the corresponding value found for the resilience.

5. Concluding Remarks

In order to assess the resilience of the Emergency Department of the Sansepolcro Hospital (EDSH), located in Tuscan (Italy), its functionality was determined in terms of both physical (structural and non-structural) and organizational factors. The waiting time (WT) between the patients’ request for service and receiving the necessary treatment is selected as the characteristic parameter of hospital functionality. The assessment was performed through an analytical simulation using the ProModel software, setting a calibrated and validated metamodel, where the aforementioned waiting time (WT) was the main parameter.
The resilience of the EDSH has been evaluated for an earthquake compatible with the seismic hazard of the area, defined according to the current Technical Code NTC 2018. The expected response of structure has been determined by performing an Incremental Dynamic Analysis on the basis of two spectrum-compatible sets of ground motions. The comparison between the structural response and the code requirements led to determining the fragility curves of the structure. Two nonstructural components, i.e., ceilings and cabinets, have been considered in the analysis; their seismic response has been described through fragility curves, which have been found based on experimental data.
The emergency department’s organization has been described based on the emergency protocol prepared by the Italian Civil Protection for Hospitals. Furthermore, the increase in the care demand due to the earthquake has been considered in the simulation. A Monte Carlo simulation analysis has been performed to assess the variation in WT due to the assumed emergency and the recovery time needed to restore the EDSH’s “normal” functioning. The analysis led to determining the EDSH’s resilience curves related to the various assumptions.
The work represents a comprehensive application of the presented procedure to a real case study and provides important information on its functioning. In regard to the organization of the Emergency Department, the study points out the role of each choice on its effective functionality, and it can be used to select eventual improvements, such as the optimal size (numbers) of personnel or Simple Markup, All Markup and original rooms for specific assistance scenarios. In regard to the physical systems, the proposed metamodel shows what are the main weaknesses of the building with respect to the various levels of seismic demand and provides useful information about the amount, the installation type, and the location of the nonstructural components used in architectural and service systems. The analysis can even be used to optimize the single steps of the EDSH functionality, such as the choice of rooms to use for each treatment or the calibration of sources for each color code.
Furthermore, the analysis pointed out which data are necessary to optimize the EDSH functionality, indicating the need to collect information in specific areas of the research, such as the precise amount of the patients’ increase at the occurrence of emergencies, the preliminary (statistical) evaluation of their needs and the time required by each care step.
The work should be expanded with a minor effort to account for further issues, such as the neighboring infrastructures, which can largely impact the EDSH functionality, and to include other possible sources of emergencies.

Author Contributions

Conceptualization, M.P., S.V.; methodology, M.P., S.V.; software, M.P.; validation, M.P., S.V.; formal analysis, M.P., S.V.; investigation, M.P.; data curation, M.P., M.T.; writing—original draft preparation, S.V.; writing—review and editing, S.V.; visualization, M.P., S.V.; supervision, M.P., M.T., S.V. All authors have read and agreed to the published version of the manuscript.

Funding

This research received no external funding.

Data Availability Statement

The data obtained through the survey will be provided on request from the corresponding author when compatible with the data policy of Institutions.

Acknowledgments

The authors thank AUSL 8 (Azienda Sanitaria Locale di Arezzo) for providing the data used in the analysis and the Department of Architecture of the University of Florence for the support.

Conflicts of Interest

The authors declare no conflicts of interest.

References

  1. Bruneau, M.; Reinhorn, A.M. Overview of the Resilience Concept. In Proceedings of the 8th US National Conference on Earthquake Engineering, San Francisco, FL, USA, 18–22 April 2006; p. 2040. [Google Scholar]
  2. Bruneau, M.; Reinhorn, A.M. Exploring the Concept of Seismic Resilience for Acute Care Facilities. Earthq. Spectra 2007, 23, 41–62. [Google Scholar] [CrossRef]
  3. Cimellaro, G.P.; Reinhorn, A.M.; Bruneau, M. Framework for analytical quantification of disaster resilience. Eng. Struct. 2010, 32, 3639–3649. [Google Scholar] [CrossRef]
  4. Cimellaro, G.P.; Reinhorn, A.M.; Bruneau, M. Performed-based metamodel for healthcare facilities. Earthq. Eng. Struct. Dyn. 2011, 40, 1197–1217. [Google Scholar] [CrossRef]
  5. Liu, J.; Zhai, C.; Yu, P. A probabilistic framework to evaluate seismic resilience of hospital buildings using baysian networks. Reliab. Eng. Syst. Saf. 2022, 226, 1086444. [Google Scholar] [CrossRef]
  6. Chang, S.; Shinozuka, M. Measuring improvements in the disaster resilience of communities. Earthq. Spectra 2004, 20, 739–755. [Google Scholar] [CrossRef]
  7. Ardagh, M.W.; Richardson, S.K.; Robinson, V.; Than, M.; Gee, P.; Henderson, S.; Khodaverdi, L.; McKie, J.; Robertson, G.; Schroeder, P.P.; et al. The initial health-system response to the earthquake in Christchurch, New Zealand, in February 2011. Lancet 2012, 379, 2109–2115. [Google Scholar] [CrossRef] [PubMed]
  8. Bruneau, M.; Chang Eguchi, R.T.; Lee, G.C.; O’Rourke, T.D.; Reinhorn, A.M.; Masanobu Shinozuka, M.; Tierney, K.; Wallace, W.A.; Winterfeldt, D. A Framework to Quantitatively Assess and Enhance the Seismic Resilience of Communities. Earthq. Spectra 2003, 19, 733–752. [Google Scholar] [CrossRef]
  9. Ceferino, L.; Mitrani-Reiser, J.; Kiremidjian, A.; Deierlein, G.; Bambarén, C. Effective plans for hospital system response to earthquake emergencies. Nat. Commun. 2020, 11, 4325. [Google Scholar] [CrossRef]
  10. Tariverdi, M.; Miller-Hooks, E.; Kirsch, T. Strategies for improved hospital response to mass casualty incidents. Disaster Med. Public Health Prep. 2018, 12, 778–790. [Google Scholar] [CrossRef]
  11. Cimellaro, G.P.; Piquet, M. Resilience of a hospital emergency department under seismic event. Adv. Struct. Eng. 2016, 19, 825–836. [Google Scholar] [CrossRef]
  12. Hassan, E.M.; Mahmoud, H. An integrated socio-technical approach for postearthquake recovery of interdependent healthcare system. Reliab. Eng. Syst. Saf. 2020, 201, 106953. [Google Scholar] [CrossRef]
  13. Viti, S.; Cimellaro, G.P.; Reinhorn, A.M. Retrofit of hospital through strength reduction and enhanced damping. Smart Struct. Syst. 2006, 2, 339–355. [Google Scholar] [CrossRef]
  14. Nuti, C.; Vanzi, I. Assessment of post-earthquake availability of hospital system and upgrading strategies. Earthq. Eng. Struct. Dyn. 1998, 27, 1403–1423. [Google Scholar] [CrossRef]
  15. WHO. Health Facility Seismic Health Facility Seismic Vulnerability Evaluation; WHO: Geneva, Switzerland, 2006. [Google Scholar]
  16. Badillo-Almarez, H.; Reinhorn, A.M.; Whittaker, A. Seismic Fragility of Suspended Ceiling Systems. Earthq. Spectra 2007, 23, 21–40. [Google Scholar] [CrossRef]
  17. Myrtle, R.C.; Masri, S.F.; Nigbor, R.L.; Caffrey, J.P. Classification and prioritization of essential systems in hospitals under extreme events. Earthq. Spectra 2005, 21, 779–802. [Google Scholar] [CrossRef]
  18. Miniati, R.; Iasio, C. Methodology for rapid seismic risk assessment of health structures: Case study of the hospital system in Florence, Italy. Int. J. Disaster Risk Reduct. 2012, 2, 16–24. [Google Scholar] [CrossRef]
  19. Masi, A.; Santarsiero, G.; Chiauzzi, L. Vulnerability Assessment and Seismic Risk Reduction Strategies of Hospitals in Basilicata Region (Italy). In Proceedings of the 15th World Conference on Earthquake Engineering—WCEE, Lisbon, Portugal, 24–28 September 2012; pp. 1–10. [Google Scholar]
  20. Uma, S.R.; Beattie, G.J. Seismic Assessment of Engineering Systems in Hospitals—A Challenge for Operational Continuity. In Proceedings of the New Zealand Society for Earthquake Engineering Annual Meeting, Auckland, New Zealand, 14–16 April 2010. [Google Scholar]
  21. Davenport, P.N. Review of seismic provisions of historic New Zealand loading codes. In New Zealand Society for Earthquake Engineering Annual Meeting; National Academies Press: Washington, DC, USA, 2004. [Google Scholar]
  22. IoM. Hospital-Based Emergency Care: At the Breaking Point; Project Retrofitting Studies; IPDED, I.P.D. and E.D.: Washington, DC, USA, 2010. [Google Scholar]
  23. ASPR. Hospital Preparedness Program. 2013. Available online: http://www.phe.gov/preparedness/plann (accessed on 6 January 2020).
  24. Hossain, L.; Kit, D.C. Modeling coordination in hospital emergency departments through social network analysis. Disasters 2012, 36, 338–364. [Google Scholar] [CrossRef]
  25. Fawcett, W.; Oliveira, C.S. Casualty treatment after earthquake disasters: Development of a regional simulation model. Disasters 2000, 24, 271–287. [Google Scholar] [CrossRef]
  26. Porter, K.; Ramer, K. Estimating earthquake-induced failure probability and downtime of critical facilities. J. Bus. Contin. Emerg. Plan. 2012, 5, 352–364. [Google Scholar]
  27. Unanwa, C.O.; McDonald, J.R.; Mehta, K.C.; Smith, D.A. The development of wind damage bands for buildings. J. Wind Eng. Ind. Aerodyn. 2000, 84, 119–149. [Google Scholar] [CrossRef]
  28. Jacques, C.C.; McIntosh, J.; Giovinazzi, S.; Kirsch, T.D.; Wilson, T.; Mitrani-Reiser, J. Resilience of the Canterbury Hospital System to the 2011 Christchurch Earthquake. Earthq. Spectra 2014, 30, 533–554. [Google Scholar] [CrossRef]
  29. Alowad, A.; Samaranayake, P.; Ahshan, K.B.; Karim, A. Enhancing patient flow in emergency department (ED) using lean strategies–an integrated voice of customer and voice of process perspective. Bus. Process Manag. J. Bus. 2020, 27, 75–105. [Google Scholar] [CrossRef]
  30. Sabir, S.M.; Mustafa, F.A. Performance-based building design: Impact of emergency department layout on its functional performance efficiency—The case of Erbil hospitals. Open House Int. 2023, 48, 840–862. [Google Scholar] [CrossRef]
  31. Setola, R. Availability of healthcare services in a networkbased scenario. Int. J. Netw. Vis. Organ. 2007, 4, 130–144. [Google Scholar]
  32. Kuwata, Y.; Takada, S. Seismic risk assessment of lifeline considering hospital functions. Asian J. Civ. Eng. 2007, 21, 315–328. [Google Scholar]
  33. Yao, G. Identification of earthquake damaged operational and functional components in hospital buildings. J. Chin. Inst. Eng. 2000, 23, 409–416. [Google Scholar] [CrossRef]
  34. Lupoi, G.; Franchin, P.; Lupoi, A.; Pinto, P.E.; Calvi, G.M. Probabilistic Seismic Assessment for Hospitals and Complex-Social Systems; IUSS Press: Pavia, Italy, 2008. [Google Scholar]
  35. Leontief, W.W. Input-Output Economics, 2nd ed.; Oxford University Press: Oxford, UK, 1986. [Google Scholar]
  36. Haimes, Y.Y.; Horovitz, B.M.; Lambert, J.H.; Santos, J.R.; Lian, C.; Crowther, K.G. Inoperability input–output model for interdependent infrastructures sectors. I: Theory and methodology. J. Infrastruct. Syst. 2005, 11, 67–79. [Google Scholar] [CrossRef]
  37. Lee, E.E., II; Mitchell, J.E.; Wallace, W.A. Restoration of Services in Interdependent Infrastructure Systems: A Network Flows Approach. IEEE Trans. Syst. Man Cybern. Part C Appl. Rev. 2007, 37, 1303–1317. [Google Scholar] [CrossRef]
  38. Arboleda, C.A.; Abraham, D.M.; Lubitz, R.M. Simulation as a tool to assess the vulnerability of the operation of a health care facility. J. Perform. Constr. Facil. 2007, 21, 302–312. [Google Scholar] [CrossRef]
  39. Yavari, S.; Chang, S.E.; Elwood, K.J. Modeling post-earthquake functionality of regional health care facilities. Earthq. Spectra 2010, 26, 869–892. [Google Scholar] [CrossRef]
  40. McCabe, O.L.; Barnett, D.J.; Taylor, H.G.; Links, J.M. Ready, willing, and able: A framework for improving the public health emergency preparedness system. Disaster Med. Public Health Prep. 2010, 4, 161–168. [Google Scholar] [CrossRef]
  41. Cimellaro, G.P.; Fumo, C.; Reinhorn, A.M.; Bruneau, M. Seismic resilience of health care facilities. In Proceedings of the 14th World Conference on Earthquake Engineering (14WCEE), Beijing, China, 12–17 October 2008. [Google Scholar]
  42. Miles, S.B.; Chang, S.E. Modeling community recovery from earthquakes. Earthq. Spectra 2006, 22, 439–458. [Google Scholar] [CrossRef]
  43. Pianigiani, M.; Viti, S. Functionality analysis of emergency departments: A case study. J. Build. Eng. 2021, 40, 1–13. [Google Scholar] [CrossRef]
  44. McCarthy, K.; McGee, H.M.; O’Boyle, C.A. Outpatient clinic waiting times and nonattendance as indicators of quality. Psychol. Health Med. 2000, 5, 287. [Google Scholar] [CrossRef]
  45. Thompson, D.A.; Yarnold, P.R. Relating patient satisfaction to waiting time perceptions and expectations: The disconfirmation paradigm. Acad. Emerg. Med. Off. J. Soc. Acad. Emerg. Med. 1995, 2, 1057–1062. [Google Scholar] [CrossRef] [PubMed]
  46. Thompson, D.A.; Paul, R.; Yarnold, P.R.; Williams, D.R.; Adams, S.L. Effects of actual waiting time, perceived waiting time, information delivery, and expressive quality on patient satisfaction in the emergency department. Ann. Emerg. Med. 1996, 28, 657. [Google Scholar] [CrossRef]
  47. Richards, M.E.; Crandall, C.S.; Hubble, M.W. Influence of ambulance arrival on emergency department time to be seen. Prehospital Emerg. Care 2006, 12, 440–446. [Google Scholar] [CrossRef]
  48. Przelazloski, K. Collapse Fragility Analysis on Sansepolcro Hospital Structure. Master’s Dissertation, Università degli Studi di Pavia, Pavia, Italy, 2014. [Google Scholar]
  49. NTC. Norme Tecniche per le Costruzioni; Decreto Ministeriale 14 gennaio 2008; Ministero Infrastrutture e Trasporti G.U.R.I. 4 Febbraio: Roma, Italy, 2008. (In Italian) [Google Scholar]
  50. Pianigiani, M. Seismic Resilience of Hospital Systems. Ph.D. Dissertation, Università degliu Studi di Firenze, Firenze, Italy, 2016. [Google Scholar]
  51. Price, R.N. ProModel Manufacturing Simulation Software: Reference Guide; Version 4.2; ProModel Corporation: Orem, UT, USA, 1999. [Google Scholar]
  52. NTC. Aggiornamento delle Norme Tecniche per le Costruzioni; Decreto Ministeriale 17 gennaio 2018; Ministero delle Infrastrutture e dei Trasporti, G.U.R.I. n. 42 del 20 febbraio: Roma, Italy, 2018. (In Italian) [Google Scholar]
  53. Viti, S.; Tanganelli, M.; D’Intinosante, V.; Baglione, M. Effects of Soil Characterization on the Seismic Input. J. Earthq. Eng. 2017, 23, 487–511. [Google Scholar] [CrossRef]
  54. FEMA. Quantification of Building Seismic Performance Factors, FEMA P-695; Applied Technology Council for the Federal Emergency Management Agency: Washington, DC, USA, 2009. [Google Scholar]
  55. Pianigiani, M.; Przelazloski, K.; Christovasilis, I.P.; Cimellaro, G.P.; De Stefani, M.; Filiatrault, A.; Sullivan, T.J.; Tanganelli, M. A comprehensive methodology for evaluating the seismic resilience of health care facilities considering nonstructural components and organizational models. In Second European Conference on Earthquake andn Seismology; European Association for Earthquake Engineering (EAEE): Istanbul, Turkey, 2014; pp. 1–4. [Google Scholar]
  56. Cosenza, E.; Di Sarno, L.; Maddaloni, G.; Maddaloni Magliulo, G.; Petrone, C.; Prota, A. Shake table tests for the seismic fragility evaluation of hospital rooms. Earthq. Eng. Struct. Dyn. 2014, 44, 23–40. [Google Scholar] [CrossRef]
  57. Aroni, S.; Durkin, M. Injuries and Occupant Behavior in Earthquakes; Samuel Aroni and Romulus Constantinescu: Washington, DC, USA, 1987. [Google Scholar]
  58. Cheu, D.H. Northridge Earthquake, 17 January 1994: California Seismic Safety Commission, Sacramento, The Hospital Response. 1994. Available online: https://www.govinfo.gov/content/pkg/GOVPUB-C13-80b021981b7845eb8e7d09b3aa8d4c7f/pdf/GOVPUB-C13-80b021981b7845eb8e7d09b3aa8d4c7f.pdf (accessed on 9 February 2024).
  59. Durkin, M.E. Fatalities, Non-Fatal Injuries and Medical Aspects of a Northridge Earthquake; EEFIT: L’Aquila, Italy, 2009; pp. 1–54. [Google Scholar]
  60. Olson, R.A.; Alexander, D.E. Summary of Proceedings. In Second National Workshop on Modelling Earthquake Casualties for Planning and Response; Jesuit Retreat House: Los Altos, CA, USA, 1996. [Google Scholar]
  61. Salinas, C.; Salinas, C.; Kurata, J. The effects of Northridge Earthquake on the Pattern of Emergency Department Care. Am. J. Emerg. Med. 1998, 16, 254–256. [Google Scholar] [CrossRef] [PubMed]
  62. Kafali, C.; Grigoriu, M. Rehabilitation decision analysis. In Proceedings of the 9th International Conference on Structural Safety and Reliability, Rome, Italy, 19–23 June 2005. [Google Scholar]
  63. Chang, S.; Svekla, W.D.; Shinouza, M. Linking infrastructure and urban economy—Simulation of water disruption impacts in Earthquakes. Environ. Plan. B Plan. Des. 2002, 29, 281–301. [Google Scholar] [CrossRef]
Figure 1. Sansepolcro Hospital. (a) Aerial view (from: https://www.ttv.it/politica/medicina-non-chiude-le-reazioni, accessed on 21/02/2024). (b) Structural units in the 3D model (EDSH in red).
Modelling 05 00017 g001
Figure 2. Flowchart of major and minor codes.
Modelling 05 00017 g002
Figure 3. Plans and vertical sections of the structure.
Modelling 05 00017 g003
Figure 4. Nonstructural components within the EDSH.
Modelling 05 00017 g004
Figure 5. Scheme of the suspended ceiling in the EDSH.
Modelling 05 00017 g005
Figure 6. Dimensions of the rooms constituting the EDSH and direction of the suspended ceiling tees. MT: main tee; CT: cross tee.
Modelling 05 00017 g006
Figure 7. Patients’ arrivals within the day and the year (1 month).
Modelling 05 00017 g007
Figure 8. Flowchart of the metamodel in ordinary conditions.
Modelling 05 00017 g008
Figure 9. Comparison between the numerical results and the measured WT.
Modelling 05 00017 g009
Figure 10. Flowchart of the metamodel in emergency conditions.
Modelling 05 00017 g010
Figure 11. Envelope of fragility curves and possible damage scenarios.
Modelling 05 00017 g011
Figure 12. Experimental campaign for the soil characterization. (a) Map of the performed tests. (b) Average shear velocities provided by the experimental tests. (c) The soil spectrum was provided by the NTC 2018 [53].
Modelling 05 00017 g012
Figure 13. Median spectra found for the two sets of ground motions (A and B, respectively).
Modelling 05 00017 g013
Figure 14. Fragility curves obtained for the considered limit states for the two sets of ground motions.
Modelling 05 00017 g014
Figure 15. Structural and nonstructural fragility curves in the EDSH’s two most strategic rooms.
Modelling 05 00017 g015
Figure 16. Fragility curves of cabinets, derived from lab tests at the University of Naples (from [57]).
Modelling 05 00017 g016
Figure 17. Three potential scenarios of loss of service of the EDSH rooms.
Modelling 05 00017 g017
Figure 18. Flowchart of major codes in case of emergency.
Modelling 05 00017 g018
Figure 19. Scheme of the analysis represented the EDSH’s functionality in emergency conditions.
Modelling 05 00017 g019
Figure 20. Results of the analysis as a function of the rate of arrival (α).
Modelling 05 00017 g020
Figure 21. Results of the analysis as a function of the number of out-of-service rooms (n).
Modelling 05 00017 g021
Figure 22. Resilience function, according to Bruneau and Reinhorn [3].
Modelling 05 00017 g022
Figure 23. WT function as loss of functionality. (a). Equivalence of areas in WT functions; (b). Simplified WT function.
Modelling 05 00017 g023
Figure 24. Resilience assessment using the area method. (a). No lack of functionality; (b). Maximum lack of functionality.
Modelling 05 00017 g024
Figure 25. Functionality curves as a function of n (α = 1.0).
Modelling 05 00017 g025
Figure 26. Resilience curves (α = 1.0).
Modelling 05 00017 g026
Table 1. Estimated time (in minutes) and time-involved rooms for each color code.
Estimated Time (in min) of Stay for Each Color Code Mutual Distances (in meters)
Red YellowGreenBlueWhite EntryRECERWRACMOBI
(0.5%)(10.6%)(45.1%)(1.72%)(41.8%)Entry0209252525
Entry REC 01031010
REC2–52–55–105–105–10ER 012.517.513
ER15–3015–30 WR 01212
ACM 10–2010–155–10ACM 018
OBI 240–2880 OBI 0
Table 2. FEMA P695 record set (set A).
IDEvent NameRecording StationPGA IDEvent NameRecording StationPGA
1Northridge, CA Beverly Hills—14145 Mulhol 0.5212Lander, CA Coolwater 0.42
2Northridge, CA Canyon Country—W Lost Cany 0.4813Loma Prieta, CA Capitola 0.53
3Duzce, Turkey Bolu 0.8214Loma Prieta, CA Gilroy Array #3 0.56
4Hector Mine, CA Hector 0.3415Manjil, Iran Abbar 0.51
5Imperial Valley, CA Delta 0.3516Superstition Hills, CA El Centro Imp. Co. Cent 0.36
6Imperial Valley, CA El Centro Array #11 0.3817Superstition Hills, CA Poe Road (temp) 0.45
7Kobe, Japan Nishi-Akashi 0.5118Cape Mendocino, CA Rio Dell Overpass—FF 0.55
8Kobe, Japan Shin-Osaka 0.2419Chi-Chi, Taiwan CHY101 0.44
9Kocaelia, Turkey Duzce 0.3620Chi-Chi, Taiwan TCU045 0.51
10Kocaelia, Turkey Arcelik 0.2221San Fernando, CA LA—Hollywood Stor FF0.21
11Lander, CA Yermo Fire Station 0.2422Friuli, Italy Tolmezzo 0.35
Table 3. Site Specific Record Sets (set B).
22% in 50 Years10% in 50 Years
No Event NameRecording Station PGANo Event NameRecording Station PGA
1Northridge, CA LA—N Figueroa St 0.291Coalinga, CA Palmer Ave 0.29
2Whittier Narrows, CA LA—Baldwin Hills 0.182Chi-Chi, Taiwan CHY032 0.18
3Northridge, CA Burbank—Howard Rd. 0.203Northridge, CA Manhattan Beach—Manhattan 0.20
4Northwest China Jiashi 0.374Coalinga, CA Skunk Hollow 0.37
5Northridge, CA Newhall—Fire Station 0.455Sierra Madre, CA Altadena—Eaton Canyon 0.45
6Northridge, CA Santa Barbara—UCSB Goleta 0.236Northridge, CA Downey—Co Maint Bldg 0.23
7Hector Mine, CA Fun Valley 0.227Chi-Chi, Taiwan TCU075 0.22
8Chi-Chi, Taiwan CHY088 0.348Chi-Chi, Taiwan TCU079 0.34
9Landers, CA Fort Irwin 0.289Sierra Madre, CA Pasadena—USGS/NSMP Office 0.28
10Chi-Chi, Taiwan CHY015 0.4910Northridge, CA LA—Univ. Hospital 0.49
11Taiwan SMART1 SMART1 M07 0.1811Mammoth Lakes, CA Convict Creek 0.18
12Chi-Chi, Taiwan TCU129 0.1412Taiwan SMART1 SMART1 E02 0.14
13Irpinia, Italy Rionero In Vulture 0.2013Hollister, CA Hollister City Hall 0.20
14Northridge, CA Compton—Castlegate St 0.1414Northridge, CA Lakewood—Del Amo Blvd 0.14
15Imperial Valley, CA Niland Fire Station 0.2715Prarkfield, CA Cholame—Shandon Array #8 0.27
16Whittier Narrows, CA La Habra—Briarcliff 0.2116Northridge, CA LA—116th St School 0.21
17Chi-Chi, Taiwan HWA058 0.2617Northridge, CA San Gabriel—E Grand Ave 0.26
18Whittier Narrows, CA San Marino—SW Academy 0.2718Kalamata, Greece Kalamata 0.27
19Mammoth Lakes, CA Mammoth Lakes H. S. 0.1919Loma Prieta, CA Fremont—Emerson Court 0.19
20Sierra Madre, CA Cogswell Dam-Right Abutment 0.2320Whittier Narrows, CA El Monte—Fairview Av 0.23
21Northridge, CA Northridge—17645 Saticoy St 0.6121Coalinga, CA Coalinga-14th & Elm (Old CHP) 0.61
22Northwest China Jiashi 0.1822Northridge, CA Moorpark—Fire Station 0.18
5% in 50 Years2% in 50 Years
NoEvent NameRecording StationPGANoEvent NameRecording StationPGA
1Prarkfield, CA Cholame—Shandon Array #5 0.44 1Tabas, Iran Dayhook 0.41
2Northridge, CA Pacific Palisades—Sunset 0.47 2North Palm Springs, CA Desert Hot Springs 0.33
3Northridge, CA LA—N Westmoreland 0.40 3Northridge, CA Beverly Hills—12520 Mulhol 0.62
4Whittier Narrows, CA Downey—Birchdale 0.30 4Northridge, CA LA 00 0.39
5Kern County, CA Taft Lincoln School 0.18 5Chi-Chi, Taiwan TCU080 0.54
6Chi-Chi, Taiwan TCU075 0.22 6Coalinga, CA Cantua Creek School 0.28
7Chi-Chi, Taiwan CHY088 0.26 7Coyote Lake, CA Gilroy Array #6 0.43
8San Fernando, CA LA—Hollywood Stor FF 0.21 8Northwest China Jiashi 0.30
9Chi-Chi, Taiwan CHY010 0.23 9Northridge, CA Stone Canyon 0.39
10Chi-Chi, Taiwan CHY047 0.14 10Chalfant Valley, CA Bishop—LADWP South St 0.25
11San Fernando, CA Castaic—Old Ridge Route 0.32 11Chi-Chi, Taiwan TCU078 0.47
12Chalfant Valley, CA Bishop—LADWP South St 0.25 12Managua, Nicaragua Managua, ESSO 0.42
13Imperial Valley, CA Calexico Fire Station 0.27 13Chi-Chi, Taiwan TCU078 0.39
14Northridge, CA LA—Fletcher Dr 0.24 14Northridge, CA LA—Chalon Rd 0.23
15Kobe, Japan Tadoka 0.29 15Corinth, Greece Corinth 0.30
16Chi-Chi, Taiwan ILA067 0.20 16Imperial Valley, CA SAHOP Casa Flores 0.51
17Whittier Narrows, CA LA—Fletcher Dr 0.21 17Friuli, Italy Tolmezzo 0.35
18Whittier Narrows, CA Garvey Res.—Control Bldg 0.46 18North Palm Springs, CA Whitewater Trout Farm 0.61
19Loma Prieta, CA Gilroy—Gavilan Coll. 0.36 19Coalinga, CA Oil City 0.87
20Chi-Chi, Taiwan TCU129 0.95 20Chi-Chi, Taiwan TCU095 0.71
21Prarkfield, CA Cholame—Shandon Array #5 0.29 21Northridge, CA Pacoima Dam (downstream) 0.43
22Northridge, CA Pacific Palisades—Sunset 0.39 22Yountville, CA Napa Fire Station #3 0.51
Table 4. Coordinates of normalized WT and functionality curves in the worst case.
WT CurveFunctionality Curve
PointX-Coordinate (Days)Y-Coordinate (Minutes)PointX-Coordinate (Days)Y-Coordinate (%)
Generalα = 1, n = 3Generalα = 1, n = 3Generalα = 1, n = 3Generalα = 1, n = 3
A0000A00100100
Bt0200Bt02100100
Ct02WT peak8195.8Ct02Residual functionality0
Dt0 + normalized recovery time10.63600Dt0 + equivalent recovery time10.636100100
ESimulation end27.7700ESimulation end27.770100
Disclaimer/Publisher’s Note: The statements, opinions and data contained in all publications are solely those of the individual author(s) and contributor(s) and not of MDPI and/or the editor(s). MDPI and/or the editor(s) disclaim responsibility for any injury to people or property resulting from any ideas, methods, instructions or products referred to in the content.

