Modelling Key Performance Indicators in a Gamified Waste Management Tool

 ,
,  ,
,  ,
,  ,
,  and
and
Abstract
:1. Introduction
2. Prior Art
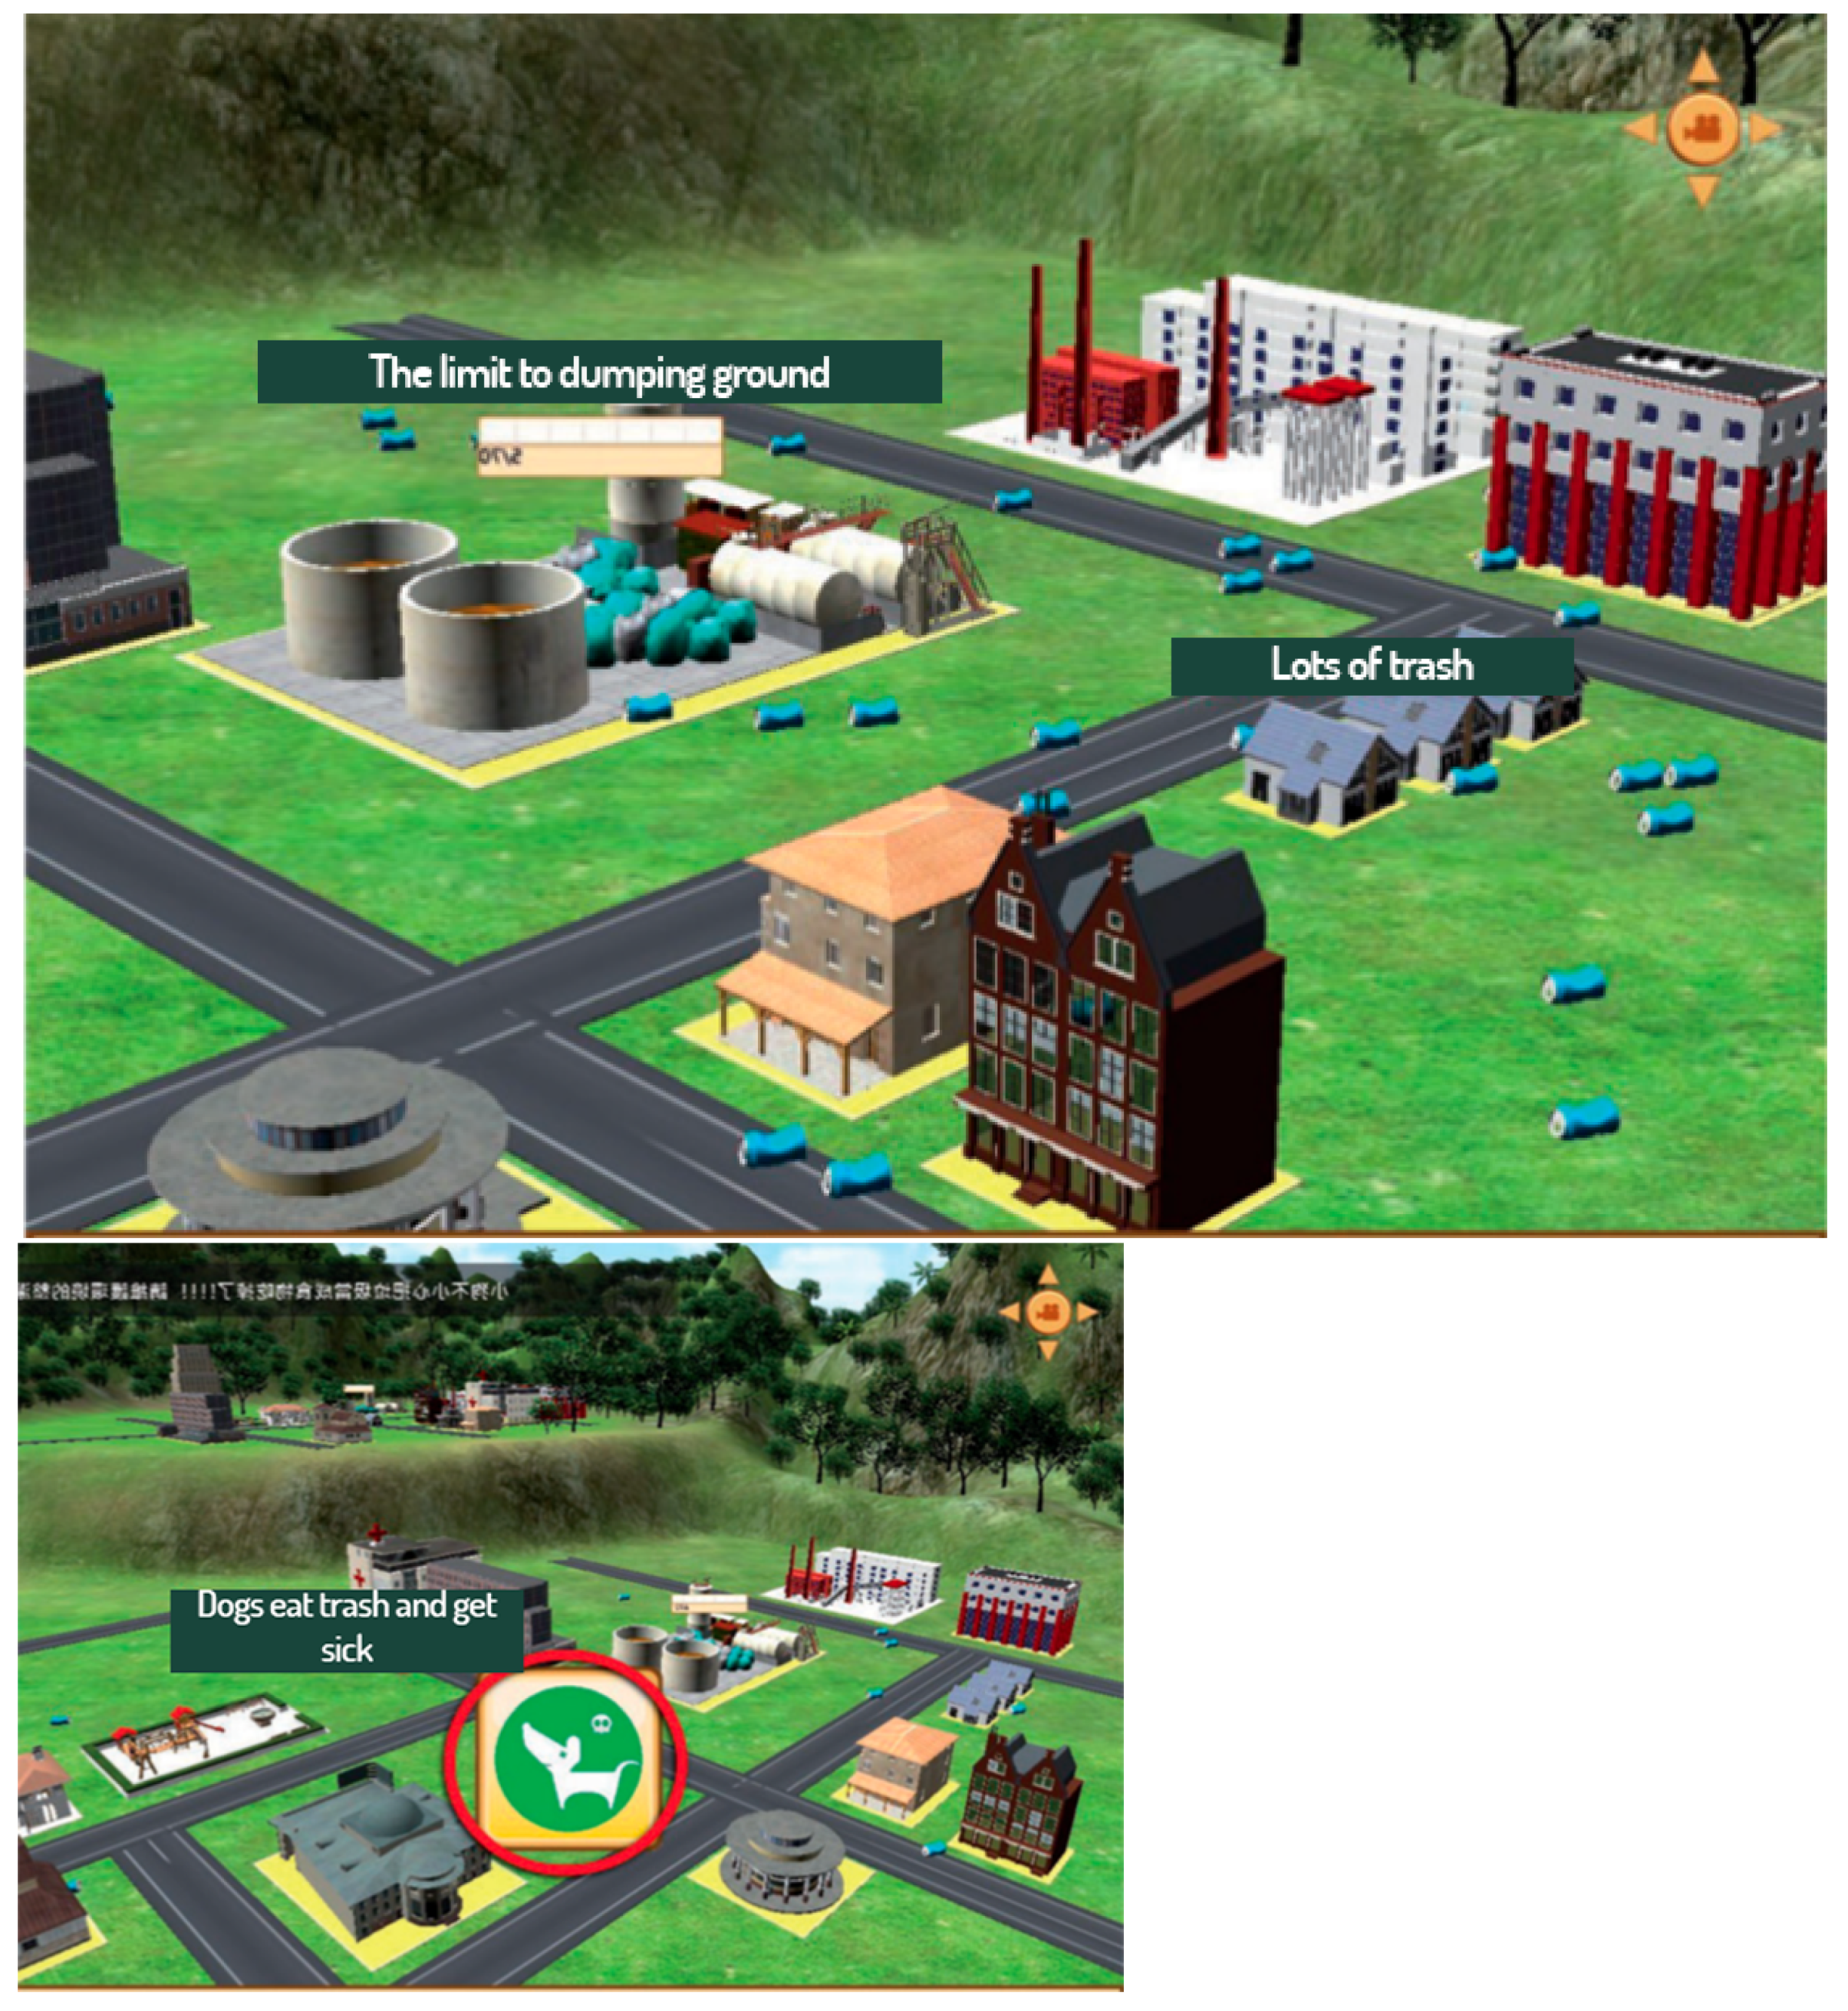
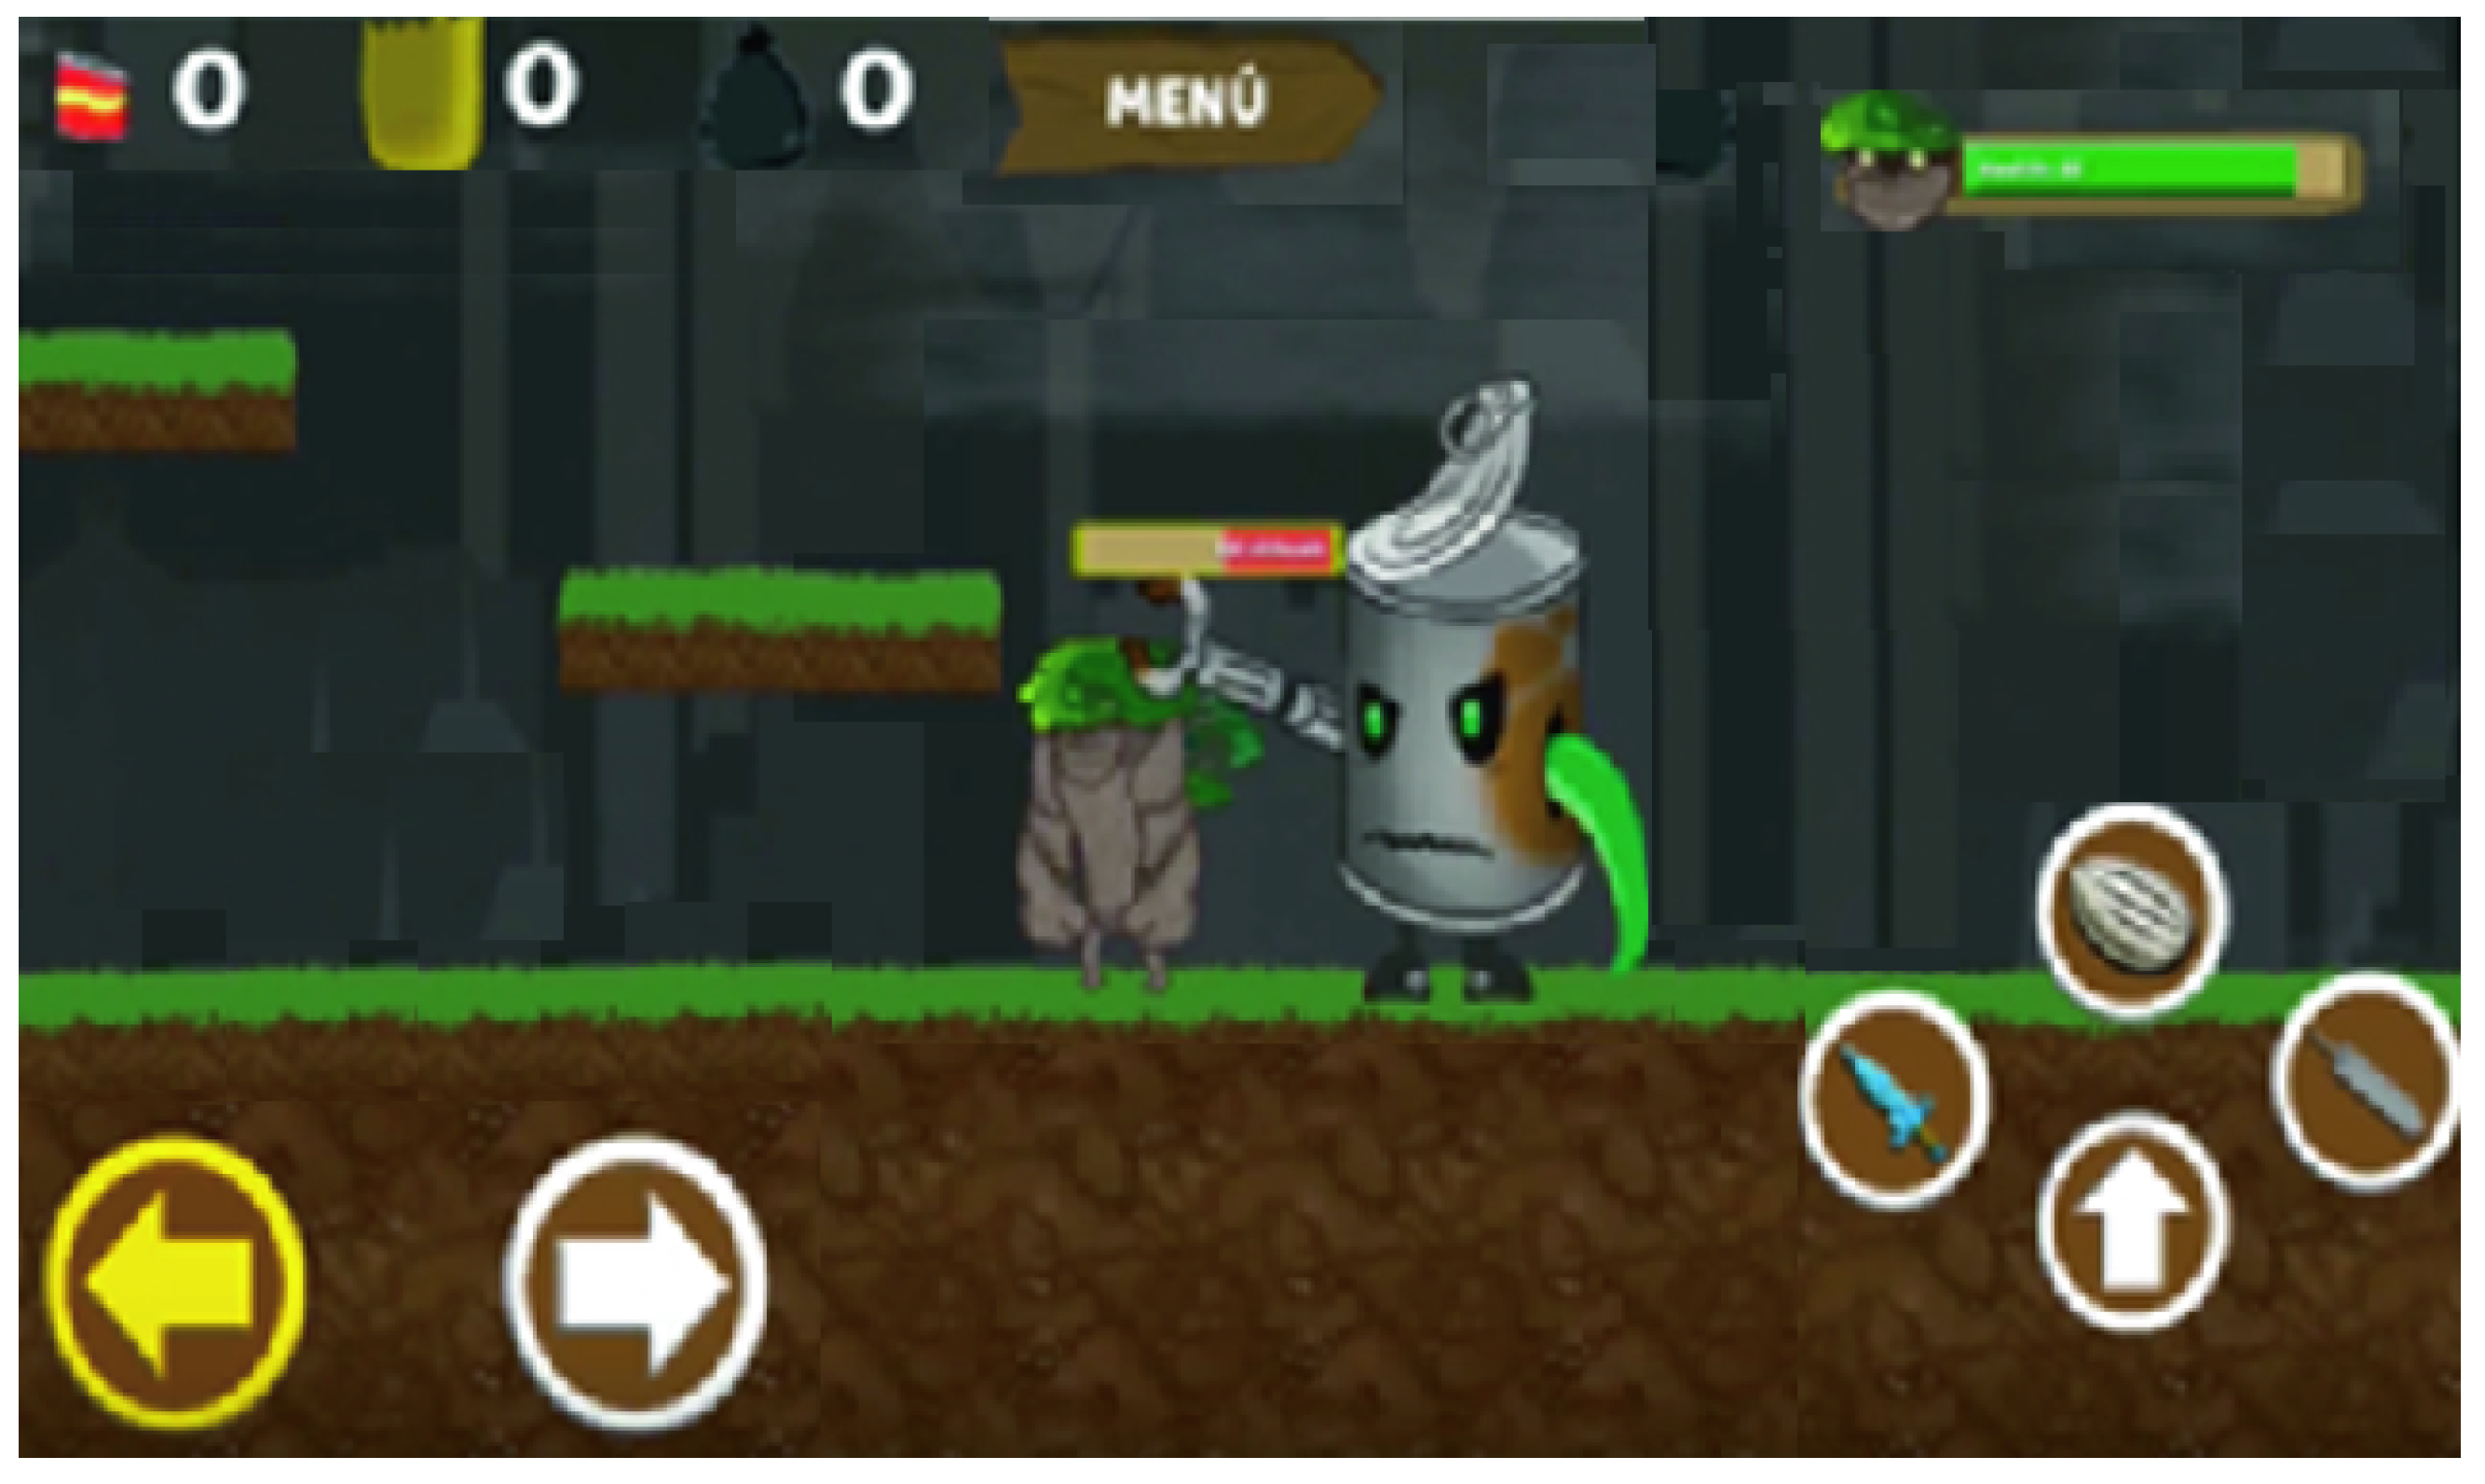
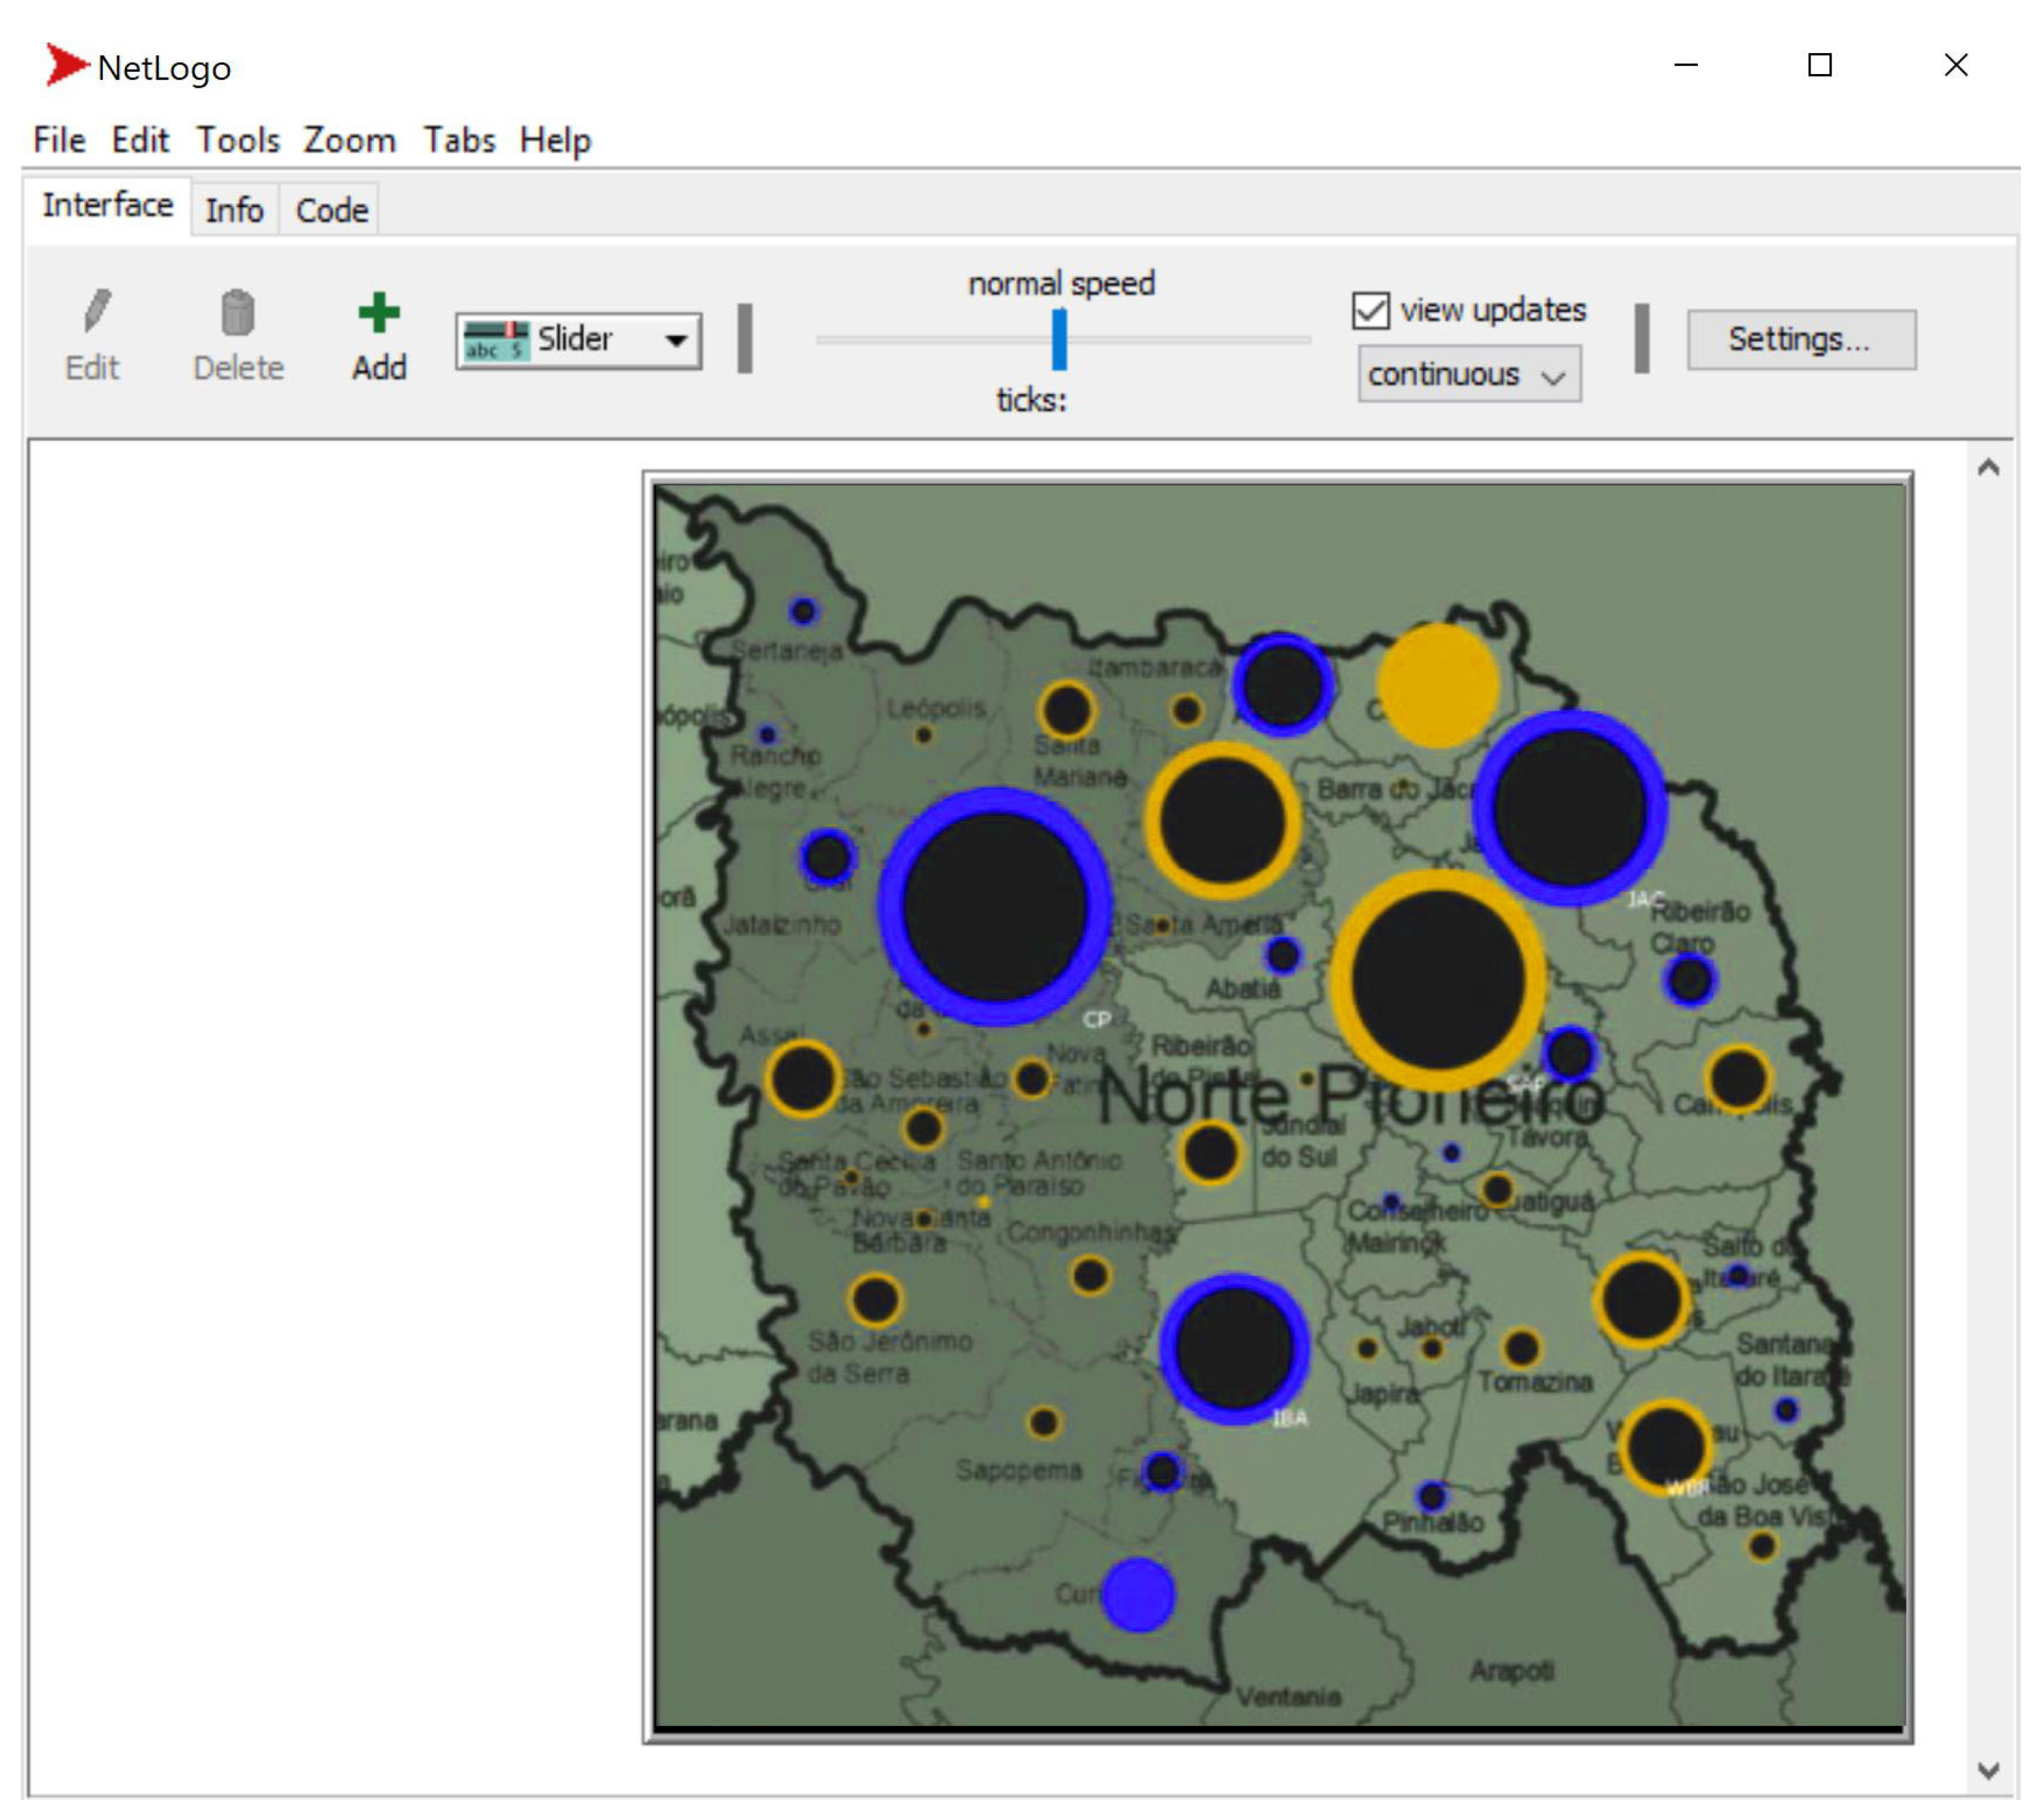
Simulation Games and Gamified Tools
3. Factors Affecting Waste—Key Performance Indicators
3.1. Approaching the Waste Management Problem
3.2. Key Performance Indicators
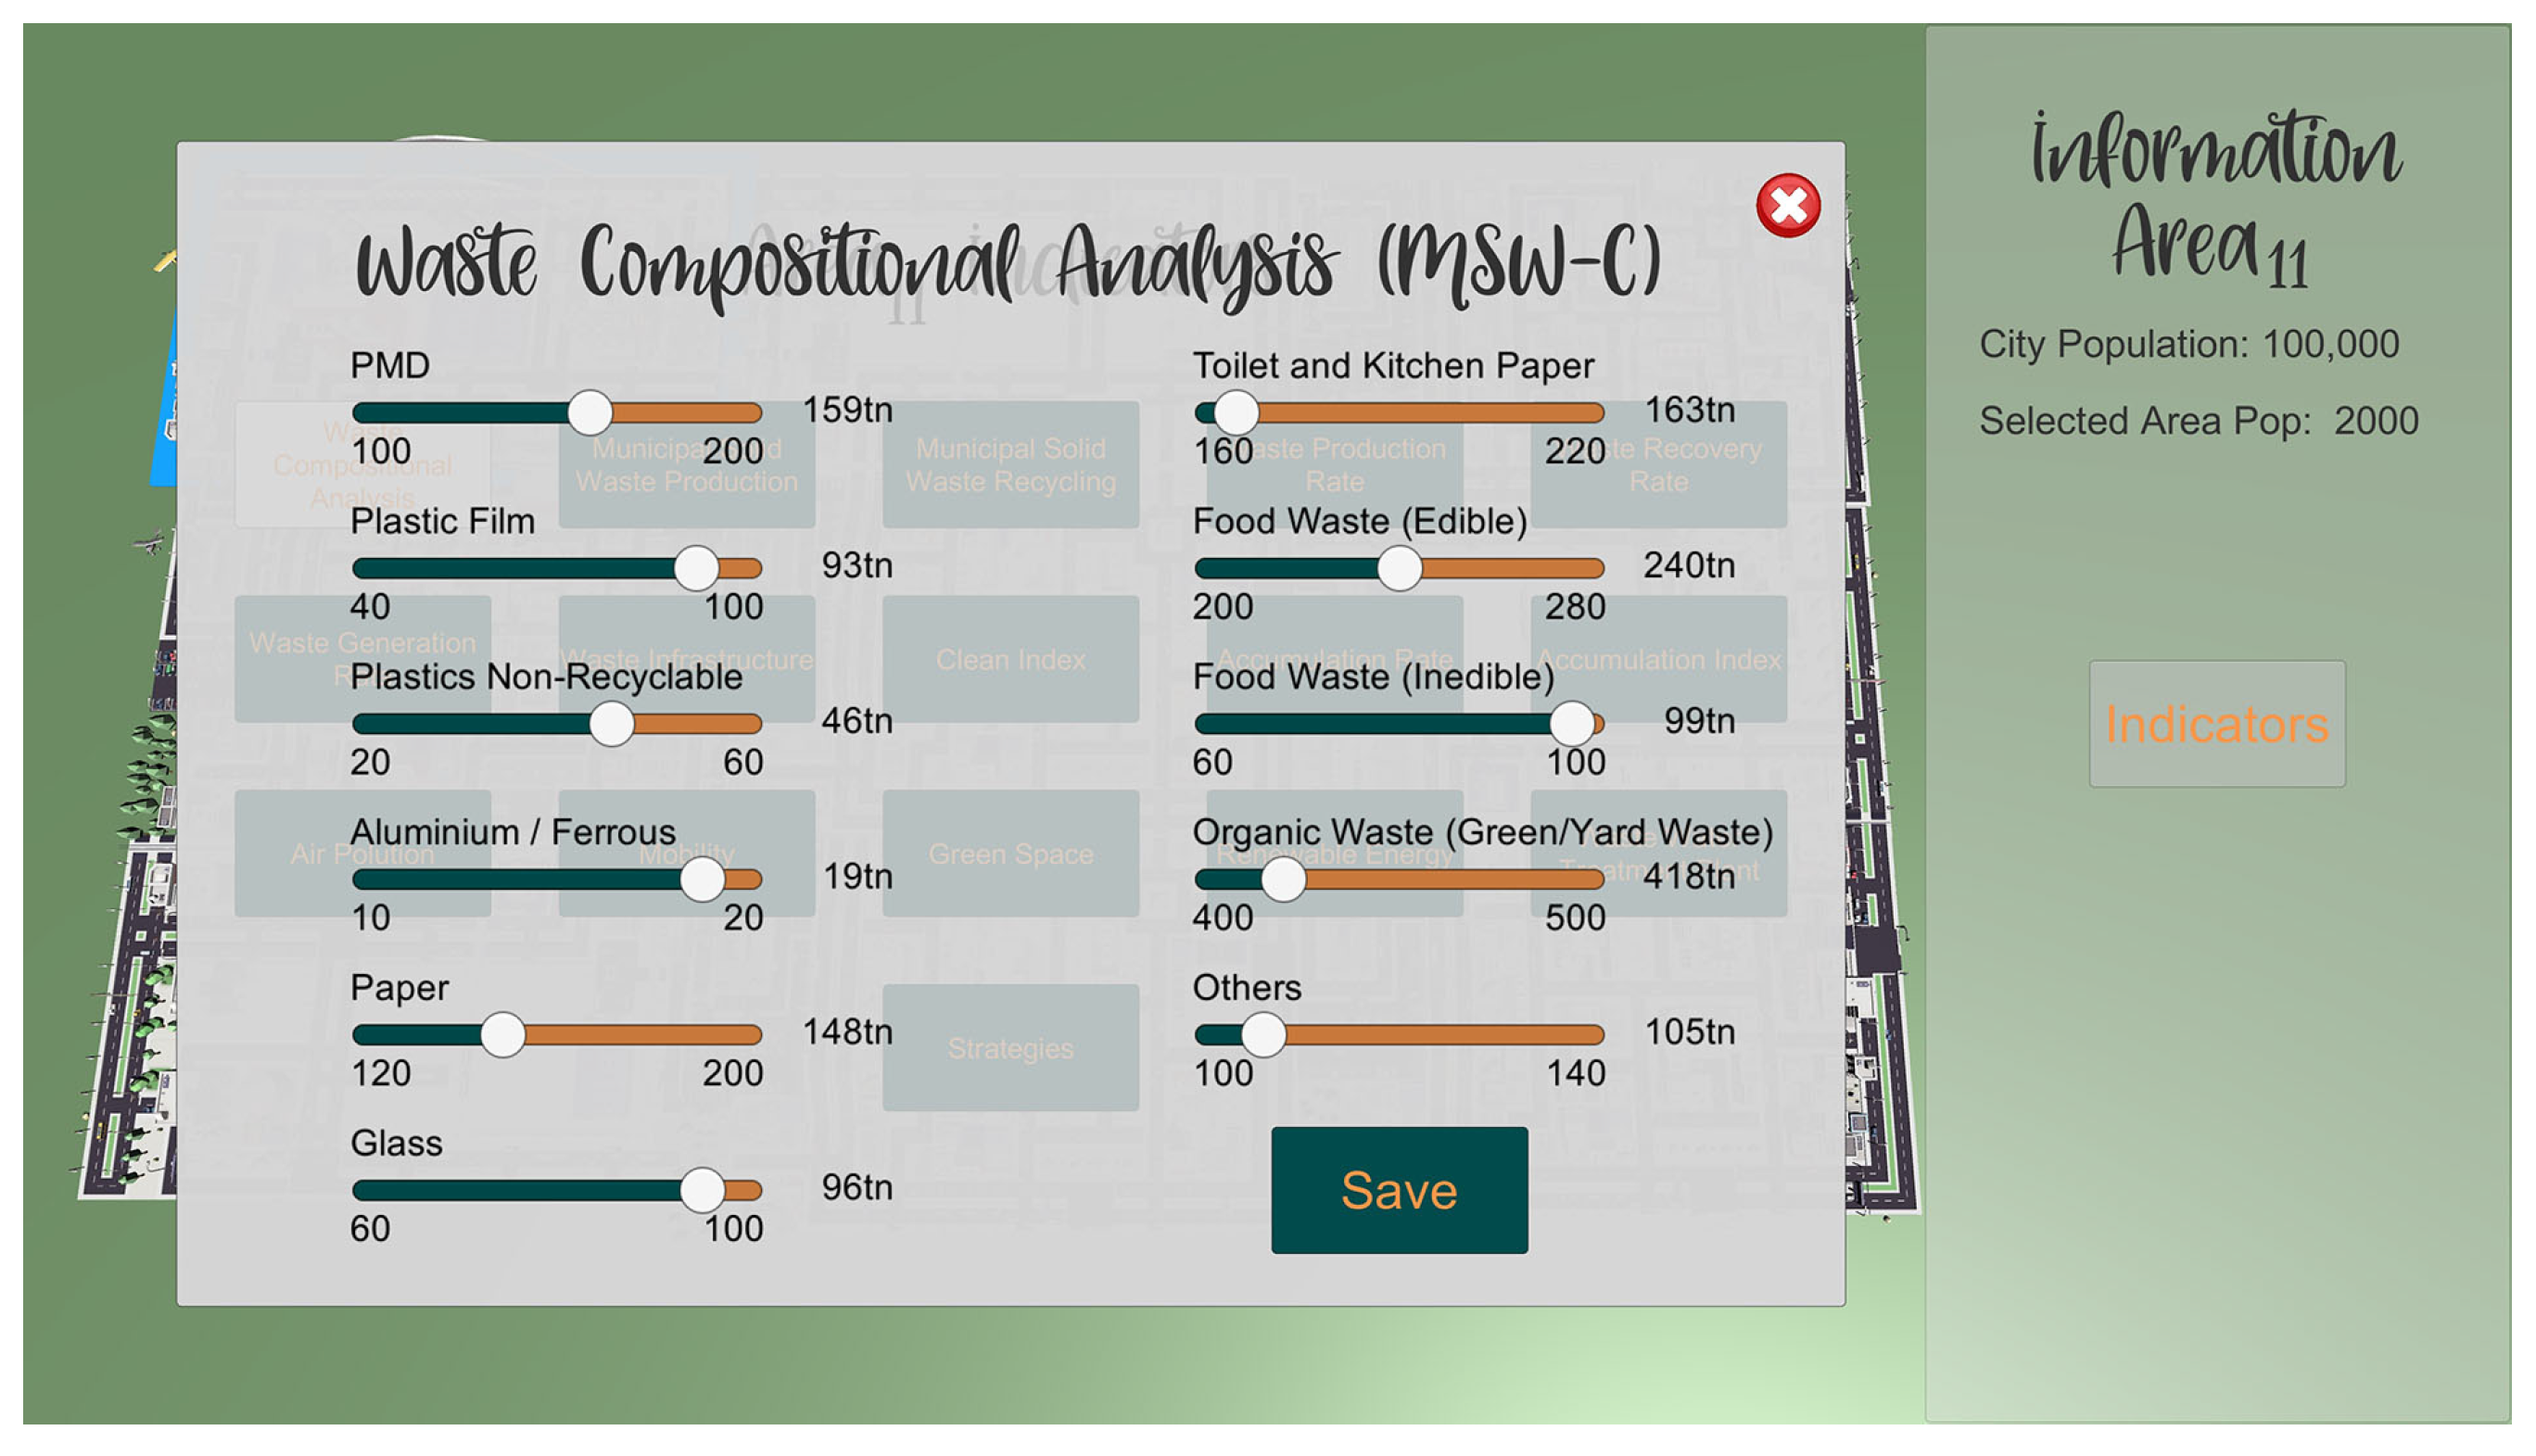
3.2.1. Waste Compositional Analysis (MSW-C)
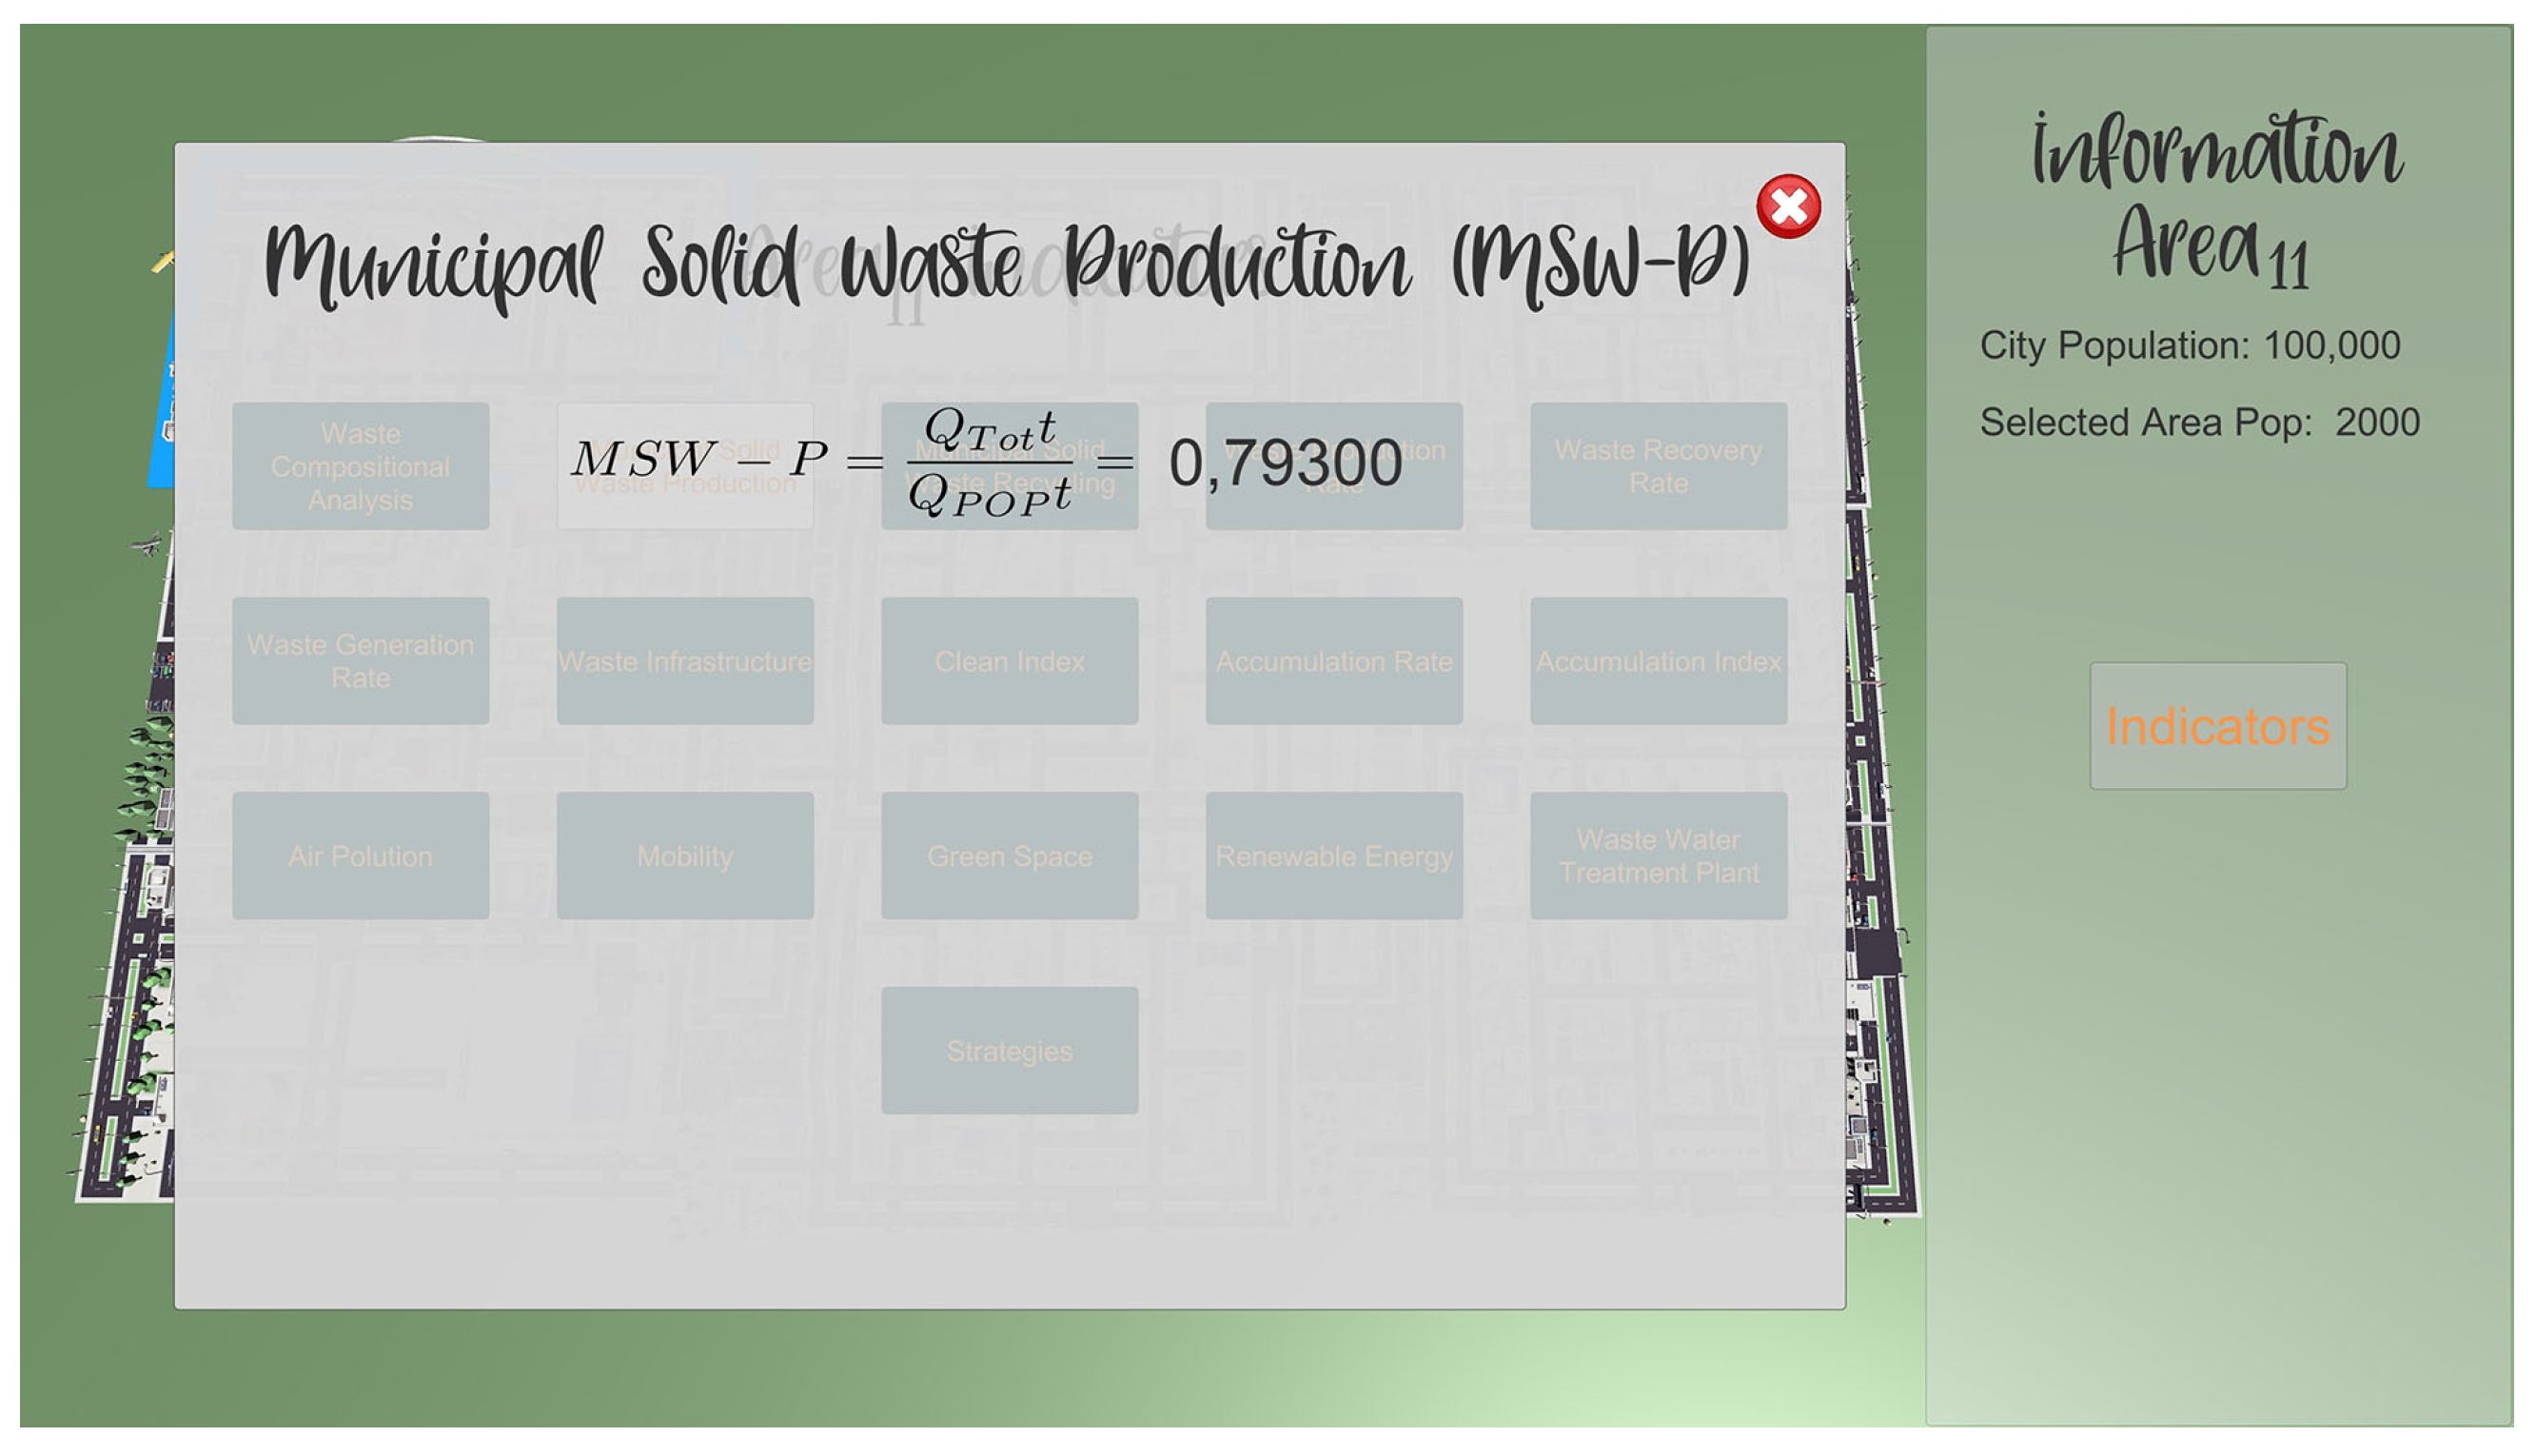
3.2.2. Municipal Solid Waste Production (MSW-P)
3.2.3. Municipal Solid Waste Recycling (MSW-R)
3.2.4. Waste Production Rate (WPR)
3.2.5. Waste Recovery Rate (WRR)
3.2.6. Waste Generation Rate (WGR)
3.2.7. Waste Infrastructure (WI)
3.2.8. Clean Index (CI)
- 1(A): Outstanding waste collection, defined as at least three times daily (morning, midday, afternoon). Waste bins exist at least every 100–200 m as well as other waste infrastructure (such as separated recycling bins, collection of hazardous waste, or increased waste awareness and informational signs). Mechanical cleaning of roads two times weekly, with waste bin capacity at least in the range of 1.5–2.5 L/guest.
- 2(B): Acceptable collection of waste, three to four times/week and twice/day for some areas (e.g., morning and afternoon collection, average waste bin separation of 200–400 m with other waste infrastructure (e.g., recycling bins). Waste bins capacity is at least 1.0–1.4 L/visitor. Informational signs are visible, and mechanical road cleaning occurs at least weekly.
- 3(C): Average collection of waste twice weekly and once per day in some areas. On average, waste bins are spaced ever 500 m with some other waste infrastructure available. Waste bin capacity varies from 0.5–1.4 L/visitor with limited awareness and informational signs, with only periodic road cleaning.
- 4(D): Periodic collection of waste–approximately once weekly, with limited public waste bins or other infrastructure, zero implementation of mechanical cleaning of the roads and waste bin capacity 0.5–1.4 L/visitor.
- 5(E): Zero formal cleaning programs in the area, no waste infrastructure and no mechanical cleaning of the roads. Little to no waste awareness or signage.
3.2.9. Accumulation Rate (AR)
3.2.10. Accumulation Index (AI)
3.2.11. Air Pollution
3.2.12. Mobility
- [A] Public Transportation must line with existing EU regulations regarding Transportation means (i.e., 80% Electric Cars by 2050 [36])
- [B] They must cover existing National plans and targets.
- [C] Satisfy the needs of Public Transportation for the maximum population density requirements.
- [D] Contribute to the existing National Plans to reduce Carbon Dioxide emissions.
3.2.13. Green Space
3.2.14. Renewable Energy Sources (RES)
3.2.15. Waste Water Treatment (WWT)
- [A] The wastewater treatment plant will perform all primary, secondary, and tertiary treatment [50].
- [B] Agglomerations and collection systems are 100% treated in the wastewater treatment plant.
- [C] The P.E of each area will always be within the limits provided by WWTD (≥2000 P.E).
- [D] Wastewater Treatment plants will protect environment and surface waters as well as human health [49]:
3.2.16. Strategies
3.2.17. Correlations among KPIs
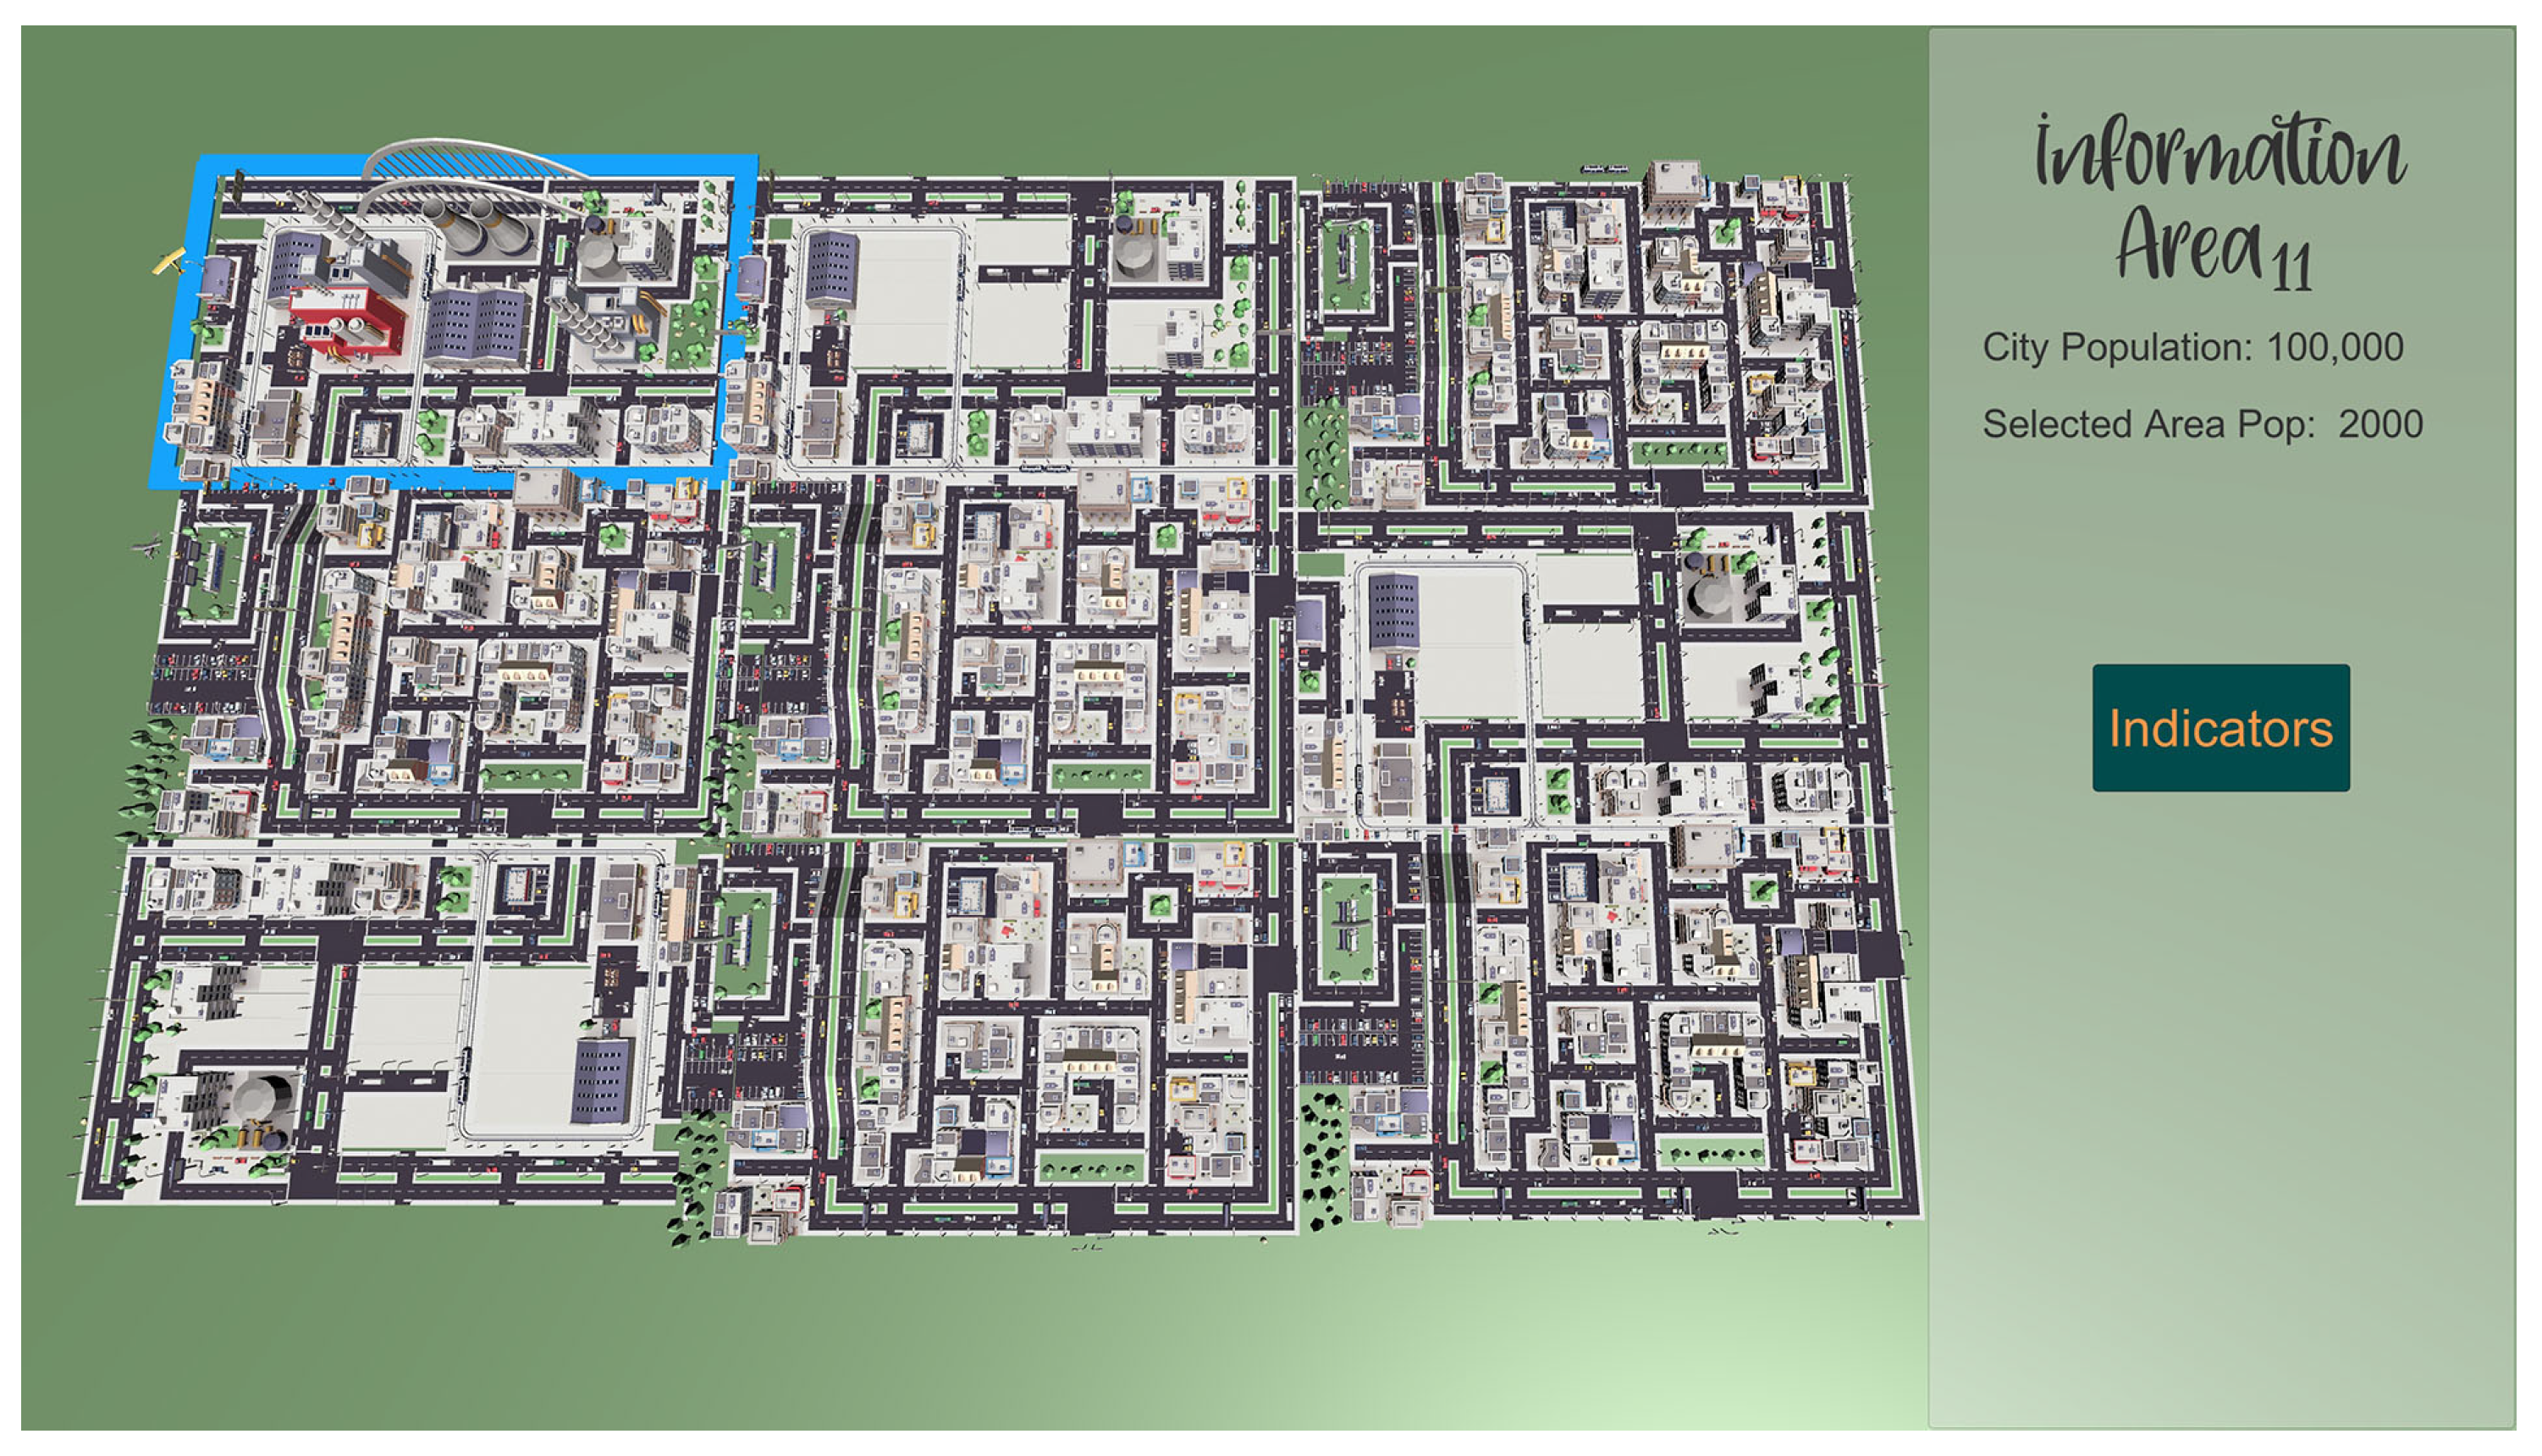
4. Design and Development of Waste Management Tool
Current Status of the Tool
5. Conclusions and Future Work
Author Contributions
Funding
Institutional Review Board Statement
Informed Consent Statement
Data Availability Statement
Conflicts of Interest
References
- Ackerman, F. Waste management and climate change. Local Environ. 2000, 5, 223–229. [Google Scholar] [CrossRef]
- Seeberger, J.; Grandhi, R.; Kim, S.S.; Mase, W.A.; Reponen, T.; Ho, S.m.; Chen, A. Special report: E-waste management in the united states and public health implications. J. Environ. Health 2016, 79, 8–17. [Google Scholar] [PubMed]
- Haupt, T.; Arnold, U.; Bidlingmaier, W. Studien-und Hochschulübergreifender Einsatz Einer Engl.-spr. Multimedialen Urban Infrastructure Development Simulation in der Akademischen Ausund Weiterbildung-MUrIDS (Cross-Study and Cross-University Use of an English Multimedia Urban Infrastructure Deve. Workshop: Multimedia in Bildung und Wirtschaft–Einsatz und Nachhaltigkeit von eLearning, Volume 22, p. 5. Available online: https://his-he.de/fileadmin/user_upload/Publikationen/Projektberichte_alte_Website/Hochschulplanung/hp165.pdf (accessed on 24 October 2021).
- Arnold, U.; Söbke, H.; Reichelt, M. Simcity in infrastructure management education. Educ. Sci. 2019, 9, 209. [Google Scholar] [CrossRef] [Green Version]
- Fernández, P.; Ceacero-Moreno, M. Urban sustainability and natural hazards management; designs using simulations. Sustainability 2021, 13, 649. [Google Scholar] [CrossRef]
- Wu, K.C.; Huang, P.Y. Treatment of an Anonymous Recipient: Solid-Waste Management Simulation Game. J. Educ. Comput. Res. 2015, 52, 568–600. [Google Scholar] [CrossRef]
- Lepe-Salazar, F.; Cortés-Álvarez, T.; Serratos-Chávez, E.; Jáuregui-Flores, L.; Juárez-Cervantes, E.; Valdovinos-López, R.; Rincón-Martínez, D.; la Madrid, R. A Game-Based Service to Mitigate the Risk of Inundations Caused by Solid Waste Accumulation. In Making Smart Cities More Playable: Exploring Playable Cities; Nijholt, A., Ed.; Springer: Singapore, 2020; pp. 279–299. [Google Scholar] [CrossRef]
- Wilensky, U. NetLogo. 1999. Available online: http://ccl.northwestern.edu/netlogo/ (accessed on 24 October 2021).
- de Souza, V.M.; Bloemhof, J.; Borsato, M. Assessing the eco-effectiveness of a solid waste management plan using agent-based modelling. Waste Manag. 2021, 125, 235–248. [Google Scholar] [CrossRef]
- Likotiko, E.; Nyambo, D.; Mwangoka, J. Multi-Agent Based IoT Smart Waste Monitoring and Collection Architecture. Int. J. Comput. Sci. Eng. Inf. Technol. 2017, 7, 1–14. [Google Scholar] [CrossRef]
- European Commission. Green City Accord Target Areas. 2021. Available online: https://ec.europa.eu/environment/green-city-accord/monitoring-framework_en (accessed on 24 October 2021).
- Loizia, P.; Voukkali, I.; Zorpas, A.A.; Navarro Pedreño, J.; Chatziparaskeva, G.; Inglezakis, V.J.; Vardopoulos, I.; Doula, M. Measuring the level of environmental performance in insular areas, through key performed indicators, in the framework of waste strategy development. Sci. Total Environ. 2021, 753, 141974. [Google Scholar] [CrossRef]
- Zorpas, A.A.; Lasaridi, K.; Voukkali, I.; Loizia, P.; Chroni, C. Household waste compositional analysis variation from insular communities in the framework of waste prevention strategy plans. Waste Manag. 2015, 38, 3–11. [Google Scholar] [CrossRef]
- Zorpas, A.A.; Lasaridi, K.; Voukkali, I.; Loizia, P.; Chroni, C. Promoting Sustainable Waste Prevention Strategy Activities and Planning in Relation to the Waste Framework Directive in Insular Communities. Environ. Process. 2015, 2, 159–173. [Google Scholar] [CrossRef] [Green Version]
- Voukkali, I.; Loizia, P.; Navarro-Pedreño, J.; Zorpas, A.A. Urban strategies evaluation for waste management in coastal areas in the framework of area metabolism. Waste Manag. Res. J. Sustain. Circ. Econ. 2021, 39, 0734242X2097277. [Google Scholar] [CrossRef]
- Zorpas, A.A. Strategy development in the framework of waste management. Sci. Total Environ. 2020, 716, 137088. [Google Scholar] [CrossRef]
- Sharp, V.; Giorgi, S.; Wilson, D.C. Methods to monitor and evaluate household waste prevention. Waste Manag. Res. 2010, 28, 269–280. [Google Scholar] [CrossRef]
- Vardopoulos, I.; Konstantopoulos, I.; Zorpas, A.A.; Limousy, L.; Bennici, S.; Inglezakis, V.J.; Voukkali, I. Sustainable metropolitan areas perspectives through assessment of the existing waste management strategies. Environ. Sci. Pollut. Res. 2021, 28, 24305–24320. [Google Scholar] [CrossRef] [PubMed]
- Victor, P.A. Indicators of sustainable development: Some lessons from capital theory. Ecol. Econ. 1991, 4, 191–213. [Google Scholar] [CrossRef]
- Green Dot Cyprus. Green National Household Results per Municipality per Year Cyprus. 2011. Available online: https://greendot.com.cy/en/ (accessed on 24 October 2021).
- The European Parliament and the Council of the European Union. Directive 2003/35/EC of the European Parliament and of the Council of 26 May 2003 providing for public participation in respect of the drawing up of certain plans and programmes relating to the environment and amending with regard to public participation. Off. J. Eur. Union 2003, 17–25. [Google Scholar]
- Printing Office of the Republic of Cyprus. Packaging and Waste Packaging (Amendment) Law; (Law No. 159(I)/2005); Printing Office of the Republic of Cyprus: Nicosia, Cyprus, 2005. [Google Scholar]
- Rhyner, C.; Schwartz, L.; Wenger, R.; Kohrell, M. Waste Management and Resource Recovery; CRC Press: Boca Raton, FL, USA, 2017; pp. 1–528. [Google Scholar] [CrossRef]
- Luttenberger, L.R. Waste management challenges in transition to circular economy—Case of Croatia. J. Clean. Prod. 2020, 256, 120495. [Google Scholar] [CrossRef]
- Bhada-Tata, P.; Hoornweg, D. What a Waste?: A Global Review of Solid Waste Management. 2012. Available online: http://hdl.handle.net/10986/17388 (accessed on 24 October 2021).
- Kaza, S.; Yao, L.; Bhada-Tata, P.; Van Woerden, F. What a Waste 2.0: A Global Snapshot of Solid Waste Management to 2050; The World Bank: Washington, DC, USA, 2018; p. 292. [Google Scholar] [CrossRef]
- Alkalay, R.; Pasternak, G.; Zask, A. Clean-coast index—A new approach for beach cleanliness assessment. Ocean. Coast. Manag. 2007, 50, 352–362. [Google Scholar] [CrossRef]
- Messineo, A.; Panno, D. Municipal waste management in Sicily: Practices and challenges. Waste Manag. 2008, 28, 1201–1208. [Google Scholar] [CrossRef]
- Loizia, P.; Voukkali, I.; Chatziparaskeva, G.; Navarro-Pedreño, J.; Zorpas, A.A. Measuring the Level of Environmental Performance on Coastal Environment before and during the COVID-19 Pandemic: A Case Study from Cyprus. Sustainability 2021, 12, 2485. [Google Scholar] [CrossRef]
- Ghorani azam, A.; Riahi-Zanjani, B.; Balali-Mood, M. Effects of air pollution on human health and practical measures for prevention in Iran. J. Res. Med. Sci. 2016, 21, 65. [Google Scholar] [CrossRef]
- Zarate, E. Understanding the Origins and Fate of Air Pollution in Bogotá, Colombia. 2007. Available online: https://infoscience.epfl.ch/record/100037 (accessed on 24 October 2021).
- Ho, B. Urban Air Pollution; IntechOpen: Rijeka, Croatia, 2012. [Google Scholar] [CrossRef] [Green Version]
- Hogg, D.; Ballinger, A. The Potential Contribution of Waste Management to a Low Carbon Economy; Eunomia Research & Consulting Ltd.: Bristol, UK, 2015. [Google Scholar]
- Department of Labour Inspection (DLI) of the Ministry of Labour; Insurance, S. Air Quality in Cyprus. Available online: https://www.airquality.dli.mlsi.gov.cy/ (accessed on 24 October 2021).
- Pisoni, E.; Christidis, P.; Thunis, P.; Trombetti, M. Evaluating the impact of “Sustainable Urban Mobility Plans” on urban background air quality. J. Environ. Manag. 2019, 231, 249–255. [Google Scholar] [CrossRef]
- Kasten, P.; Bracker, J.; Haller, M.; Purwanto, J. Assessing the Status of Electrification of the Road Transport Passenger Vehicles and Potential Future Implications for the Environment and European Energy System; Öko-Institut: Darmstadt, Germany, 2016. [Google Scholar]
- De la Barrera, F.; Reyes-Paecke, S.; Banzhaf, E. Indicators for green spaces in contrasting urban settings. Ecol. Indic. 2016, 62, 212–219. [Google Scholar] [CrossRef]
- Gerstenberg, T.; Hofmann, M. Perception and preference of trees: A psychological contribution to tree species selection in urban areas. Urban For. Urban Green. 2015, 15, 103–111. [Google Scholar] [CrossRef]
- European Commission. Building a Green Infrastructure for Europe; Publications Office of the European Union: Luxembourg; Brussels, Belgium, 2013; p. 22. [Google Scholar] [CrossRef]
- World Health Organisation(WHO). Health Indicators of Sustainable Cities in the Context of the Rio+20 UN Conference on Sustainable Development; WHO: Geneva, Switzerland, 2012. [Google Scholar]
- Russo, A.; Cirella, G. Modern Compact Cities: How Much Greenery Do We Need? Int. J. Environ. Res. Public Health 2018, 15, 2180. [Google Scholar] [CrossRef] [PubMed] [Green Version]
- Delponte, I.; Schenone, C. RES Implementation in Urban Areas: An Updated Overview. Sustainability 2020, 12, 382. [Google Scholar] [CrossRef] [Green Version]
- European Commission. Resolution of the European Committee of the Regions—The Green Deal in partnership with local and regional authorities. In Communication from the Commission to the European Parliament, The European Council, The Council, The European Economic and Social Committee and the Committee of the Regions the European Green Deal; Number COM(2019) 640 Final; European Commission: Brussels, Belgium; Luxembourg, 2019; p. 24. [Google Scholar]
- Zorpas, A.A.; Saranti, A. Multi-criteria analysis of sustainable environmental clean technologies for the treatment of winery’s wastewater. Int. J. Glob. Environ. Issues 2016, 15, 151–168. [Google Scholar] [CrossRef] [Green Version]
- Cyprus, T.S.O. Transmission System Operator Cyprus. 2020. Available online: https://tsoc.org.cy/electrical-system/energy-generation-records/res-penetration/ (accessed on 24 October 2021).
- Regu, C.E. Cyprus Energy Regulatory Authority. 2021. Available online: https://www.cera.org.cy/en-gb/smv/sp-graph (accessed on 24 October 2021).
- Republic of Cyprus, Statistical Service, Ministry of Finance. Demographic Statistics 2019. 2019. Available online: https://www.mof.gov.cy/mof/cystat/statistics.nsf/populationcondition_21main_en/populationcondition_21main_en?OpenForm&sub=1&sel=1 (accessed on 24 October 2021).
- European Commission. Directive (EU) 2018/2001 of the European Parliament and of the Council of 11 December 2018 on the Promotion of the Use of Energy from Renewable Sources (Recast) (Text with EEA Relevance)Text with EEA Relevance; Technical Report; European Commission: Brussels, Belgium; Luxembourg, 2018. [Google Scholar]
- Pesqueira, J.F.J.R.; Pereira, M.F.R.; Silva, A.M.T. Environmental impact assessment of advanced urban wastewater treatment technologies for the removal of priority substances and contaminants of emerging concern: A review. J. Clean. Prod. 2020, 261, 121078. [Google Scholar] [CrossRef]
- European Commission. Communication from the Commission to the European Parliament, the Council, the European Economic and Social Committee and the Committee of the Regions A Policy Framework for Climate and Energy in the Period from 2020 to 2030; European Commission: Brussels, Belgium; Luxembourg, 2014. [Google Scholar]
- European Commission. Report from the Commission to the European Parliament, the Council, the European Economic and Social Committee and the Committee of the Regions- Tenth Report on the Implementation Status and Programmes for Implementation (as required by Article 17 of Coun; European Commission: Brussels, Belgium; Luxembourg, 2016. [Google Scholar]
- World Health Organisation(WHO). Population Connected to Wastewater Treatment Facilities. 2015. Available online: https://gateway.euro.who.int/en/indicators/enhis_4-population-connected-to-wastewater-treatment-facilities/ (accessed on 24 October 2021).
- Eurostat. Population Connected to Wastewater Treatment Plants. 2018. Available online: http://appsso.eurostat.ec.europa.eu/nui/show.do?dataset=env_ww_con&lang=en (accessed on 24 October 2021).
- Niccolucci, V.; Botto, S.; Rugani, B.; Nicolardi, V.; Bastianoni, S.; Gaggi, C. The real water consumption behind drinking water: The case of Italy. J. Environ. Manag. 2011, 92, 2611–2618. [Google Scholar] [CrossRef]
- European Commission. Communication from the Commission to the European Parliament, the Council, the European Economic and Social Committee and the Committee of the Regions Closing the Loop—An EU Action Plan for the Circular Economy; Number COM(2015) 614 Final; European Commission: Brussels, Belgium; Luxembourg, 2015. [Google Scholar]
- Nations, U. Transforming Our World: The 2030 Agenda for Sustainable Development. 2015. Available online: https://sdgs.un.org/2030agenda (accessed on 24 October 2021).
- Mohanty, S. Everything You Wanted to Know About Smart Cities. IEEE Consum. Electron. Mag. 2016, 5, 60–70. [Google Scholar] [CrossRef]
- Stambouli, A.B.; Khiat, Z.; Flazi, S.; Kitamura, Y. A review on the renewable energy development in Algeria: Current perspective, energy scenario and sustainability issues. Renew. Sustain. Energy Rev. 2012, 16, 4445–4460. [Google Scholar] [CrossRef]
- Petinrin, J.O.; Shaaban, M. Renewable energy for continuous energy sustainability in Malaysia. Renew. Sustain. Energy Rev. 2015, 50, 967–981. [Google Scholar] [CrossRef]
- Calisto Friant, M.; Vermeulen, W.J.V.; Salomone, R. Analysing European Union circular economy policies: Words versus actions. Sustain. Prod. Consum. 2021, 27, 337–353. [Google Scholar] [CrossRef]
- Wittmaier, M.; Langer, S.; Sawilla, B. Possibilities and limitations of life cycle assessment (LCA) in the development of waste utilization systems—Applied examples for a region in Northern Germany. Waste Manag. 2009, 29, 1732–1738. [Google Scholar] [CrossRef]
- Brook Lyndhurst. WR1204 Household Waste Prevention Evidence Review: L1 m1—Executive Report, a Report for Defra’s Waste and Resources Evidence Programme; Technical Report; Brook Lyndhurst: London, UK, 2009. [Google Scholar]
- Shi, Y.; Ge, X.; Yuan, X.; Wang, Q.; Kellett, J.; Li, F.; Ba, K. An Integrated Indicator System and Evaluation Model for Regional Sustainable Development. Sustainability 2019, 11, 2183. [Google Scholar] [CrossRef] [Green Version]
- Strzebkowski, R.; Gehrmann, T.; Siegel, J.E.; Politopoulos, K.; Christodoulides, C.; Pappas, G. AR/VR/Game-based Edutainment Applications and Real-Time Data Visualisation Technologies for Discovery Learning in the Industry and Distance Education; OEB: Berlin, Germany, 2018. [Google Scholar]
- Avraamidou, A.; Lambis, S.; Pappas, G.; Christodoulides, C. Enhancing Distance Education Students’ Learning Experience Through Emerging Technologies. In Proceedings of the INTED2019 Proceedings, Valencia, Spain, 11–13 March 2019; Volume 1, pp. 3022–3029. [Google Scholar] [CrossRef]
- Pappas, G.; Peratikou, P.; Siegel, J.E.; Politopoulos, K.; Christodoulides, C.; Stavrou, S. Cyber Escape Room: An educational 3D escape room game within a cyber range training realm. In Proceedings of the INTED2020 Proceedings, 14th International Technology, Education and Development Conference, Valencia, Spain, 2–4 March 2020; pp. 2621–2627. [Google Scholar] [CrossRef]
- Pappas, G.; Siegel, J.E.; Vogiatzakis, I.; Politopoulos, K. Gamification and the Internet of Things in Education. In Handbook of Intelligent Techniques in Educational Process; Springer: Berlin/Heidelberg, Germany, 2022. [Google Scholar]
- Pappas, G.; Siegel, J.E.; Politopoulos, K. VirtualCar: Virtual Mirroring of IoT-Enabled Avacars in AR, VR and Desktop Applications. 2018. Available online: https://diglib.eg.org/handle/10.2312/egve20181381 (accessed on 24 October 2021).
- Pappas, G.; Siegel, J.E.; Politopoulos, K.; Sun, Y. A Gamified Simulator and Physical Platform for Self-Driving Algorithm Training and Validation. Electronics 2021, 10, 1112. [Google Scholar] [CrossRef]
- Siegel, J.E. Cloudthink and the Avacar: Embedded Design to Create Virtual Vehicles for Cloud-Based Informatics, Telematics, and Infotainment. S.M. Thesis, Massachusetts Institute of Technology, Cambridge, MA, USA, 2013. [Google Scholar]
- Wilhelm, E.; Siegel, J.E.; Mayer, S.; Sadamori, L.; Dsouza, S.; Chau, C.K.; Sarma, S.E. Cloudthink: A scalable secure platform for mirroring transportation systems in the cloud. Transport 2015, 30, 320–329. [Google Scholar] [CrossRef] [Green Version]
- Siegel, J.E. Data Proxies, the Cognitive Layer, and Application Locality: Enablers of Cloud-Connected Vehicles and Next,-Generation Internet of Things. Ph.D. Thesis, Massachusetts Institute of Technology, Cambridge, MA, USA, 2016. [Google Scholar]
- Siegel, J.E.; Bhattacharyya, R.; Deshpande, A.; Sarma, S.E. Vehicular engine oil service life characterization using on-board diagnostic (OBD) sensor data. In Proceedings of the IEEE Sensors 2014, Valencia, Spain, 2–5 November 2014; pp. 1722–1725. [Google Scholar]
- Siegel, J.E.; Bhattacharyya, R.; Deshpande, A.; Sarma, S.E. Smartphone-Based Wheel Imbalance Detection. In Proceedings of the Dynamic Systems and Control Conference, Columbus, OH, USA, 28–30 October 2015. [Google Scholar]
- Siegel, J.E.; Kumar, S.; Ehrenberg, I.; Sarma, S.E. Engine misfire detection with pervasive mobile audio. In Proceedings of the Joint European Conference on Machine Learning and Knowledge Discovery in Databases, Riva del Garda, Italy, 19–23 September 2016; Springer: Cham, Switzerland, 2016; pp. 226–241. [Google Scholar]
- Siegel, J.E.; Bhattacharyya, R.; Deshpande, A.; Sarma, S.E. Smartphone-Based Vehicular Tire Pressure and Condition Monitoring. In Proceedings of the SAI Intelligent Systems Conference, London, UK, 21–22 September 2016; pp. 446–455. [Google Scholar]
- Siegel, J.E.; Bhattacharyya, R.; Kumar, S.; Sarma, S.E. Air filter particulate loading detection using smartphone audio and optimized ensemble classification. Eng. Appl. Artif. Intell. 2017, 66, 104–112. [Google Scholar] [CrossRef] [Green Version]
- Siegel, J.E.; Sun, Y.; Sarma, S.E. Automotive Diagnostics as a Service: An Artificially Intelligent Mobile Application for Tire Condition Assessment. In Proceedings of the International Conference on AI and Mobile Services, Seattle, WA, USA, 25–30 June 2018. [Google Scholar]
- Siegel, J.E.; Coda, U.; Terwilliger, A. Surveying Off-Board and Extra-Vehicular Monitoring and Progress Towards Pervasive Diagnostics. arXiv 2021, arXiv:2007.03759. [Google Scholar]
- Pappas, G.; Siegel, J.E.; Rutkowski, J.; Schaaf, A. Game and Simulation Design for Studying Pedestrian-Automated Vehicle Interactions. arXiv 2021, arXiv:2109.15205. [Google Scholar]
- Siegel, J.E.; Kumar, S.; Sarma, S.E. The Future Internet of Things: Secure, Efficient, and Model-Based. IEEE Internet Things J. 2017, 5, 2386–2398. [Google Scholar] [CrossRef] [Green Version]
- Kumaravel, B.T.; Bhattacharyya, R.; Siegel, J.E.; Sarma, S.E.; Arunachalam, N. Development of an Internet of Things enabled manufacturing system for tool wear characterization. In Proceedings of the 2017 IEEE 3rd International Symposium in Robotics and Manufacturing Automation (ROMA), Kuala Lumpur, Malaysia, 19–21 September 2017; pp. 1–6. [Google Scholar]
- Siegel, J.E.; Beemer, M.F.; Shepard, S.M. Automated non-destructive inspection of fused filament fabrication components using thermographic signal reconstruction. Addit. Manuf. 2020, 31, 100923. [Google Scholar] [CrossRef]
- Sen, P.; Kantareddy, S.N.R.; Bhattacharyya, R.; Sarma, S.E.; Siegel, J.E. Low-cost diaper wetness detection using hydrogel-based RFID tags. IEEE Sens. J. 2020, 20, 3293–3302. [Google Scholar] [CrossRef]


| Commercial Games /Research Tools | Information about Waste Management Systems |
|---|---|
| SimCity 4 | All waste lumped as “garbage” |
| Multiple disposal avenues (Landfill, Recycling, Waste-to-Energy) | |
| Waste accumulation reported though desirability reports, Mayor Rating | |
| Cities: Skylines | All waste lumped as “garbage” |
| Multiple disposal avenues (Landfill, Recycling, Incinerator, Waste Processing, …) | |
| Waste accumulation reported though feedback bubbles | |
| Wu and Huang’s Research Tool [6] | All waste lumped as “garbage” |
| Multiple disposal avenues (Waste Product Dump, Incinerator, Environment Factory, Trading Companies) | |
| Waste accumulation reported though reports of garbage-driven natural disasters | |
| Wood of War | Multiple waste monsters found with varied garbage piles |
| Waste disposed of by defeating monsters Real-world waste reported through GPS tags | |
| Real-world waste build-up is communicated to developers, authorities | |
| NetLogo | All waste types lumped |
| Sociotechnical approach for complex waste management and decision-making | |
| Waste management parameters (agents) executed serially. Empirical calibration necessary to mirror real-world scenarios. |
| Categories of Waste | Range (%) | Scaled Estimated Amount (tn) |
|---|---|---|
| PMD | 5–30 | 7639 |
| Plastic Film | 1–7 | 3588 |
| Plastics Non-Recyclable | 1–3 | 1835 |
| Aluminium/Ferrous | 0.5–2 | 682 |
| Paper | 5–20 | 8572 |
| Glass | 1–7 | 4327 |
| Toilet and Kitchen Paper | 1–15 | 9652 |
| Food Waste (edible) | 2–20 | 12,055 |
| Food Waste (inedible) | 2–20 | 4091 |
| Organic Waste(Green Waste, Yard Waste) | 2–20 | 22,243 |
| Others | 1–10 | 6494 |
| Total | 81,178 (figures per [13]) |
| Categories | Range (%) | Estimated Amount (tn) |
|---|---|---|
| PMD | 50–100 | 3819 |
| Paper | 50–100 | 4286 |
| Glass | 80–100 | 3461 |
| Total | 5172 |
| Categories | Range of Recovery (%) | Estimated Waste Recovered (tn) | |
|---|---|---|---|
| Min | Max | ||
| PMD | 50 | 100 | 3819 |
| Aluminium/Ferrous | 50 | 100 | 341 |
| Paper | 50 | 100 | 4286 |
| Glass | 80 | 100 | 3461 |
| Food waste | 50 | 100 | 8073 |
| Green Waste | 80 | 100 | 17,794 |
| 37,776 | |||
| Categories | Bin Colour | Proposed Range |
|---|---|---|
| Recycle Bin for: | ||
| Plastics | Yellow | |
| Paper | Brown | |
| PMD | Blue | min: W.I ⩾ 0.5–1.5 L/capita |
| Mixed waste | Green | max: W.I ⩾ –25 L/capita |
| Food Waste | Pink | |
| Green Waste | Light Green | |
| Batteries | Transparent | |
| Glass Packaging | Grey | |
| Aluminium | Perforated |
| Quality | Level of Sevices (LOS) | CI | Identification |
|---|---|---|---|
| Very Clean | 1(A) | 0–2 | No litter seen |
| Clean | 2(B) | 2–5 | No litter seen over a large area |
| Moderate | 3(C) | 5–10 | A few pieces of litter visible |
| Dirty | 4(D) | 10–20 | A lot of litter visible |
| Very Dirty | 5(E) | 20+ | Most of the area is covered in litter |
| LOS | WAI | WAR (Items/m/Day) | WAR (Items/km/Day) | |
|---|---|---|---|---|
| Extremely Low | 1 | ≤1 | 0.000001 | 1 |
| Very Low | 2 | 1–2 | 0.00001 | 10 |
| Low | 2–3 | 2–3 | 0.0001 | 100 |
| Moderate | 3 | 3–4 | 0.001 | 1000 |
| High | 4 | 4–5 | 0.01 | 10,000 |
| Very High | 4–5 | 5–6 | 0.1 | 100,000 |
| Extremely High | 5 | ≥6 | 1 | 1,000,000 |
| Categories | Range (%) | Low | Moderate | High | Very High |
|---|---|---|---|---|---|
| 0–100 | 0–50 | 50–100 | 100–200 | >200 | |
| 0–100 | 0–25 | 25–50 | 50–100 | >100 | |
| Carbon Dioxide (CO) | To be defined | ||||
| Carbon Monoxide (CO) | 0–100 | 0–7000 | 7000–15,000 | 15,000–20,000 | >20,000 |
| Nitrogen Monoxide (NO) | 0–100 | ||||
| Nitrogen Dioxide (NO) | 0–100 | 0–100 | 100–150 | 150–200 | >200 |
| Sulphur Dioxide (SO) | 0–100 | 0–150 | 150–250 | 250–350 | >350 |
| Ozone (O) | 0–100 | 0–100 | 100–140 | 140–180 | >180 |
| Benzene (CH) | 0–100 | 0–5 | 5–10 | 10–15 | >15 |
| Transportation |
|---|
| Buses |
| Trams/Trolleys |
| Trains/Underground Metro |
| Bike lanes |
| Walk lanes |
| Electric Cars |
| Green Space Categories | Green Space Requirements (m/Capita) |
|---|---|
| Green Space (Parks, Playgrounds, Open-air Sport Facilities) | min: 9 m/capita |
| optimum: 50–57 m/capita |
| Category | RES Share in Total Energy Production (MWh) |
|---|---|
| RES (P/V Parks, P/V houses, Wind Parks) | min: 11.7% (63,176 MWh) |
| max ≥ 32% (≥114,760 MWh) |
| Categories |
|---|
| Circular Economy |
| European Green Deal (EGD) |
| United Nations Sustainability Goals (UNSDGs) |
| Zero Waste Policy |
| Low Carbon Society |
| Waste Prevention |
| Energy Recovery |
| Smart City |
| Environmental Management Systems (i.e., ISO14001, EMAS) |
| R-strategies |
| Categories |
|---|
| Use of leftovers |
| Use of reusable Grocery Bags |
| Reusable Coffee Cup |
| Home Composting |
| Food Waste Campaign |
| Donations where possible (i.e., Toys, Books, clothes etc) |
| Book exchanges |
| Smart shopping list (buying exact necessities from stores) |
| Keeping vegetables and fruits in loosely tied bags |
| Reuse of electrical appliances |
| Electrical Appliances repair stores to extend life time of devices |
| MSW-C | MSW-P | MSW-R | WPR | WRR | WGR | WI | CI | AR | AI | Air Pollution | Mobility | Green Space | Renewable Energy | Waste Water Treatment Plant | Strategies | |
| MSW-C | ✓ | ✓ | ✓ | ✓ | ✓ | ✓ | ||||||||||
| MSW-P | ✓ | ✓ | ✓ | ✓ | ✓ | ✓ | ||||||||||
| MSW-R | ✓ | ✓ | ✓ | ✓ | ✓ | ✓ | ✓ | |||||||||
| WPR | ✓ | ✓ | ✓ | ✓ | ✓ | ✓ | ✓ | ✓ | ||||||||
| WRR | ✓ | ✓ | ✓ | ✓ | ||||||||||||
| WGR | ✓ | ✓ | ✓ | ✓ | ✓ | ✓ | ✓ | ✓ | ✓ | ✓ | ||||||
| WI | ✓ | ✓ | ✓ | ✓ | ✓ | |||||||||||
| CI | ✓ | ✓ | ✓ | ✓ | ✓ | ✓ | ✓ | ✓ | ||||||||
| AR | ✓ | ✓ | ✓ | ✓ | ✓ | ✓ | ||||||||||
| AI | ✓ | ✓ | ✓ | ✓ | ✓ | ✓ | ||||||||||
| Air Pollution | ✓ | ✓ | ✓ | ✓ | ✓ | ✓ | ✓ | ✓ | ||||||||
| Mobility | ✓ | ✓ | ✓ | |||||||||||||
| Green Space | ✓ | ✓ | ✓ | ✓ | ✓ | ✓ | ✓ | |||||||||
| Renewable Energy | ✓ | ✓ | ✓ | ✓ | ✓ | ✓ | ||||||||||
| Waste Water Treatment Plant | ✓ | |||||||||||||||
| Strategies | ✓ | ✓ | ✓ | ✓ | ✓ | ✓ | ✓ | ✓ | ✓ | ✓ | ✓ | ✓ | ✓ | ✓ | ✓ | |
| Acronyms and Terms | ||||||||||||||||
| MSW-C | Waste Compositional Analvsis | |||||||||||||||
| MSW-P | Municipal Solid Waste Production | |||||||||||||||
| MSW-R | Municipal Solid Waste Recycling | |||||||||||||||
| WPR | Waste Production Rate | |||||||||||||||
| WRR | Waste Recovery Rate | |||||||||||||||
| WGR | Waste Generation Rate | |||||||||||||||
| WI | Waste Infrastructure | |||||||||||||||
| Cl | Clean lndex | |||||||||||||||
| AR | Accumulation Rate | |||||||||||||||
| Al | Accumulation Index | |||||||||||||||
| Categories of Waste | Scaled Est. Amount (tn) | Range (tn) |
|---|---|---|
| PMD | 7639 | 5000–10,000 |
| Plastic Film | 3588 | 2000–5000 |
| Plastics Non-Recyclable | 1835 | 1000–3000 |
| Aluminium/Ferrous | 682 | 500–1000 |
| Paper | 8572 | 6000–10,000 |
| Glass | 4327 | 3000–5000 |
| Toilet and Kitchen Paper | 9652 | 8000–11,000 |
| Food Waste (edible) | 12,055 | 10,000–14,000 |
| Food Waste (inedible) | 4091 | 3000–5000 |
| Organic Waste (Green Waste, Yard Waste) | 22,243 | 20,000–25,000 |
| Others | 6494 | 5000–7000 |
| Population: 1500 | Population: 2000 | Population: 5000 | Population: 6500 | Population: 7000 | Population: 10,000 | Population: 18,000 | Population: 20,000 | Population: 30,000 | ||||||||||
| Lower Bound | Upper Bound | Lower Bound | Upper Bound | Lower Bound | Upper Bound | Lower Bound | Upper Bound | Lower Bound | Upper Bound | Lower Bound | Upper Bound | Lower Bound | Upper Bound | Lower Bound | Upper Bound | Lower Bound | Upper Bound | |
| PMD | 750 | 1500 | 100 | 200 | 250 | 500 | 325 | 650 | 350 | 700 | 500 | 1000 | 900 | 1800 | 1000 | 2000 | 1500 | 3000 |
| Plastic Film | 300 | 750 | 40 | 100 | 100 | 250 | 130 | 325 | 140 | 350 | 200 | 500 | 360 | 900 | 400 | 1000 | 600 | 1500 |
| Plastic Non Recyclable | 150 | 450 | 20 | 60 | 50 | 150 | 65 | 195 | 70 | 210 | 100 | 300 | 180 | 540 | 200 | 600 | 300 | 900 |
| Aluminun/ Ferrous | 75 | 150 | 10 | 20 | 25 | 50 | 32 | 65 | 35 | 70 | 50 | 100 | 90 | 180 | 100 | 200 | 150 | 300 |
| Paper | 900 | 1500 | 120 | 200 | 300 | 500 | 390 | 650 | 420 | 700 | 600 | 1000 | 1080 | 1800 | 1200 | 2000 | 1800 | 3000 |
| Glass | 450 | 750 | 60 | 100 | 150 | 250 | 195 | 325 | 210 | 350 | 300 | 500 | 540 | 900 | 600 | 1000 | 900 | 1500 |
| Toilet and Kitchen paper | 1200 | 1650 | 160 | 220 | 400 | 550 | 520 | 715 | 560 | 770 | 800 | 1100 | 1440 | 1980 | 1600 | 2200 | 2400 | 3300 |
| Food Waste Edible | 1500 | 2100 | 200 | 280 | 500 | 700 | 650 | 910 | 700 | 980 | 1000 | 1400 | 1800 | 2520 | 2000 | 2800 | 3000 | 4200 |
| Food Waste Inedible | 450 | 750 | 60 | 100 | 150 | 250 | 195 | 325 | 210 | 350 | 300 | 500 | 540 | 900 | 600 | 1000 | 900 | 1500 |
| Organic Waste | 3000 | 3750 | 400 | 500 | 1000 | 1250 | 1300 | 1625 | 1400 | 1750 | 2000 | 2500 | 3600 | 4500 | 4000 | 5000 | 6000 | 7500 |
| Others | 750 | 1050 | 100 | 140 | 250 | 350 | 325 | 455 | 350 | 490 | 500 | 700 | 900 | 1260 | 1000 | 1400 | 1500 | 2100 |
Publisher’s Note: MDPI stays neutral with regard to jurisdictional claims in published maps and institutional affiliations. |
© 2021 by the authors. Licensee MDPI, Basel, Switzerland. This article is an open access article distributed under the terms and conditions of the Creative Commons Attribution (CC BY) license (https://creativecommons.org/licenses/by/4.0/).
Share and Cite
Pappas, G.; Papamichael, I.; Zorpas, A.; Siegel, J.E.; Rutkowski, J.; Politopoulos, K. Modelling Key Performance Indicators in a Gamified Waste Management Tool. Modelling 2022, 3, 27-53. https://doi.org/10.3390/modelling3010003
Pappas G, Papamichael I, Zorpas A, Siegel JE, Rutkowski J, Politopoulos K. Modelling Key Performance Indicators in a Gamified Waste Management Tool. Modelling. 2022; 3(1):27-53. https://doi.org/10.3390/modelling3010003
Chicago/Turabian StylePappas, Georgios, Iliana Papamichael, Antonis Zorpas, Joshua E. Siegel, Jacob Rutkowski, and Konstantinos Politopoulos. 2022. "Modelling Key Performance Indicators in a Gamified Waste Management Tool" Modelling 3, no. 1: 27-53. https://doi.org/10.3390/modelling3010003