Article

Application of Artificial Intelligence Algorithms to Estimate the Success Rate in Medically Assisted Procreation

by
Beatriz Brás de Guimarães
1,2,
Leonardo Martins
2,
José Luís Metello
3,
Fernando Luís Ferreira
4,*,
Pedro Ferreira
3 and
José Manuel Fonseca
2
1
Physics Department, Faculdade de Ciências e Tecnologia, Universidade NOVA de Lisboa, 2829-516 Caparica, Portugal
2
CA3—CTS UNINOVA, Faculdade de Ciências e Tecnologia, Universidade NOVA de Lisboa, 2829-516 Caparica, Portugal
3
Division of Reproductive Endocrinology and Infertility, CIRMA, Hospital Garcia de Orta, E.P.E, 2805-267 Almada, Portugal
4
CTS UNINOVA, Faculdade de Ciências e Tecnologia, Universidade NOVA de Lisboa, 2829-516 Caparica, Portugal
*
Author to whom correspondence should be addressed.
Reprod. Med. 2020, 1(3), 181-194; https://doi.org/10.3390/reprodmed1030014
Submission received: 23 September 2020 / Revised: 18 October 2020 / Accepted: 19 October 2020 / Published: 25 October 2020

Abstract

:
The aim of this study was to build an Artificial Neural Network (ANN) complemented by a decision tree to predict the chance of live birth after an In Vitro Fertilization (IVF)/Intracytoplasmic Sperm Injection (ICSI) treatment, before the first embryo transfer, using demographic and clinical data. Overall, 26 demographic and clinical data from 1193 cycles who underwent an IVF/ICSI treatment at Centro de Infertilidade e Reprodução Medicamente Assistida, between 2012 and 2019, were analyzed. An ANN was constructed by selecting experimentally the input variables which most correlated to the target through Pearson correlation. The final used variables were: woman’s age, total dose of gonadotropin, number of eggs, number of embryos and Antral Follicle Count (AFC). A decision tree was developed considering as an initial set the input variables integrated in the previous model. The ANN model was validated by the holdout method and the decision tree model by the 10-fold cross method. The ANN accuracy was 75.0% and the Area Under the Receiver Operating Characteristic (AUROC) curve was 75.2% (95% Confidence Interval (CI): 72.5–77.5%), whereas the decision tree model reached 75.0% and 74.9% (95% CI: 72.3–77.5%). These results demonstrated that both ANN and decision tree methods are fair for prediction the chance of conceive after an IVF/ICSI cycle.

Graphical Abstract

1. Introduction

Infertility is a global health issue that afflicts around 15% of couples worldwide [1]. However, less than 55% of these affected couples ask for medical assistance [2]. Overall, 4% up to 17% undergo In Vitro Fertilization (IVF)/Intracytoplasmic Sperm Injection ICSI treatment in developed countries, while this number is even lower in least developed ones [3]. The causes of infertility are multiple and both men and women may be affected. A male factor can be identified in 30% to 40% of cases [4] and a similar proportion can be found in women. In about 30% of cases, both contribute to the problem while in around 10% it is not possible to establish a definitive cause [5]. IVF/ICSI treatments are the last solution for many couples, but they come with several drawbacks, such as being expensive, emotionally burdensome, with secondary effects and with a variable likelihood of success. This issue is important not only to deal with the couples’ expectations, but also to prepare institutions particularly when public funding is applied. Costs and effectiveness continue to stimulate discussion in scientific and public forums [6].
In recent decades, we have witnessed unique revolutions in access to information, both in pharmacological and clinical research, and in the means of diagnosis and therapy. All these advances resulted in the entry of technology, engineering, rational sciences and mathematics in the world of medicine [7] and has been found to be determinant in medical areas including the prediction of the survival of patients with breast cancer [8], liver cancer [9] or pancreas cancer [10]. Since then, Artificial Intelligence (AI) algorithms have been shown to be capable of handling large amounts of data and use the extracted information to select possible diagnoses of different health problems [11,12,13,14]. Therefore, clinical decision support systems can assist both professionals and patients in this decision-making process [15,16].
The growing amount of data available in reproductive medicine suggests that decision-making for patients with infertility is an ideal clinical approach, based on the analysis of their characteristics, combining Assisted Reproductive Technology (ART) techniques with AI methods [17]. Several predictive models have been proposed, with the main aim of identifying clinical and demographic variables that correlate to the success of treatment. Success has been defined in several different ways: pregnancy, ongoing pregnancy or deliver of a healthy infant [6,18,19]. As far as we know, Templeton et al. [6] contributed to the oldest scientific study based on the identification of factors that affect the outcome of an IVF treatment and the measurement of the magnitude of its effect, using a logistic regression, finding that the highest success rates for live birth occurred in the group of women aged between 25 and 30 years, followed by a considerable decline in older woman. Regardless, additional factors were taken into account such as the number of successful previous pregnancies, the number of previous unsuccessful IVF treatments, female causes of infertility and duration of infertility. Nelson and Lawlor [20] corroborated Templeton’s study [6] with a new model using univariate and multivariate logistic regression. This approach, significantly, improved the overall prediction of live birth, being able to allocate couples on different prognosis classes. The age-related decline in female fertility has also been studied by other authors that proved that expression oocyte genes are influenced by woman’s age. Therefore, dysfunctions in this area are believed to be one of the main causes of this phenomenon [21]. La Marca et al. [22] incorporated the Anti-Müllerian Hormone (AMH) concentrations into the model and the authors demonstrated that it is strongly associated with success in obtaining a live birth, independently of age. Other authors highlighted the importance of other variables like semen-analysis parameters, Body Mass Index (BMI) [23], previous abortion or miscarriage [24], ethnicity [25] or AFC [26].
The aim of the present study is to construct an ANN complemented by a decision tree to predict the chance of live birth during an infertility treatment, using the couple’s demographic and clinical data. This will be helpful to assist the physician to correct the couple’s expectations, which might have changed after having started the treatment.

2. Materials and Methods

2.1. Data

This is a retrospective study of 1193 cycles who undergone an IVF/ICSI treatment in Centro de Infertilidade e Reprodução Medicamente Assistida (CIRMA) at Hospital Garcia de Orta (HGO), E.P.E in Almada, Portugal. All considered cycles were performed between 2012 and 2019. Only cycles with a live birth delivery after 24 weeks, or cycles with no surplus embryos left were taken for consideration. The exclusion criteria were women without clinical information, including AMH or AFC. The study was approved on 23 January 2020 by the Hospital’s Ethics Committee for Health. The selected output variable was dichotomous (i.e., 1: with live birth, 0: without live birth) and the 26 input variables were duration of infertility (months), woman’s and man’s age (years), woman’s and man’s weight (kg), woman’s and man’s height (cm), woman’s and man’s BMI (kg/m2), woman’s and man’s smoking status (never, previous and present), woman’s and man’s ethnicity (African, Asian, Caucasian, Gipsy, Indian, and Mixture) woman’s and man’s previous children (yes or no), cause of infertility (endometriosis, male factor, both male and female factor, unexplained infertility, multiple female factors, other, ovulatory factor, tubal factor and uterine factor), total dose of gonadotropin (IU), days of stimulation, average daily dose of gonadotropin (IU/day), nature of treatment (IVF, ICSI and mixed IVF/ICSI), number of attempts in the center, number of eggs, number of mature eggs, number of embryos, AMH level (ng/mL) and AFC.

2.2. IVF/ICSI Procedures

According to the local protocol, ovarian stimulation was performed with 100 to 450 IU of recombinant Follicle Stimulating Hormone (r-FSH) or human Menopausal Gonadotropin (hMG) (Gonal-f®, Merck Serono (Darmstadt, Germany); Puregon®, MSD (Kenilworth, NJ, USA); Bemfola®, Gedeon Richter (Budapest, Hungry)) or HMG (Menopur®, Ferring (Saint-Prex, Switzerland)), based on ovarian reserve assessment, starting on cycle day 2 or 3, mostly within a Gonadotropin-Releasing Hormone (GnRH) antagonist flexible protocol (Cetrotide®, Merck Serono; or Orgalutran®, MSD) started on stimulation day 6. Final oocyte maturation was induced with hCG (mostly 6500 IU Ovitrelle®, Merck Serono) or GnRH agonist (0.2 mg Decapeptyl®, Ferring) when at least two follicles of 17 mm in diameter were visualized by ultrasound. Oocyte retrieval was performed 35–37 h after final maturation. ICSI was performed in cases of altered semen parameters, according to the World Health Organization (WHO) criteria or in cases of previous conventional IVF fertilization failure, or low fertilization rate. One or two embryos were transferred 2, 3 or 5 days after oocyte retrieval. A fresh transfer was canceled whenever the progesterone level was over 1.5 ng/mL, risk of Ovarian Hyperstimulation Syndrome (OHSS) or intracavitary uterine pathology was identified during stimulation. The luteal phase was supplemented with vaginal micronized natural progesterone (200 mg Progeffik®, Effik International (Brussels, Belgium), three times a day). Supernumerary embryos of sufficient quality were cryopreserved on days 2, 3 or at the blastocyst stage. Patients who did not become pregnant after fresh transfer could undergo frozen-thawed cycles under artificial endometrial preparation. Live birth was defined as at least one infant born alive after 24 weeks gestation, consistent with previous prediction models and publications. The hormonal measure of anti-müllerian hormone was done with blood serum sample using the Electrochemiluminescence (ECLIA) methodology, with the Modular EVO (E170) Roche Diagnostics® equipment (Basel, Switzerland).

2.3. Statistical Analysis

A univariate analysis was first performed. Categorical data were analyzed with the Qui-Square test, while continuous variables were compared using a standard t-test. Relationships between continuous input variables and the output variable were also assessed through calculation of a Pearson correlation coefficient. All the statistical tests considered a p-value less than 0.05 as a statistically significant result.

2.4. Predictive Model Analysis

This study can be divided into three phases: pre-processing, classification and comparison, as outlined in Figure 1. The pre-processing phase includes data reduction and resampling in order to balance the dataset. Focusing on to the cycles performed between 2012 and 2018, there were 375 couples with a live birth and 746 couples who failed to conceive, resulting in a 1:2 ratio. For that reason, and to avoid a future overfitting of the model to the data (losing the ability to generalize knowledge due to excessive adjustment to the input data [27]), SMOTE & Tomek-links, a hybrid sampling method was applied [28]. As a result of this pre-processing 1374 cases were used, with a 1:1 ratio (687 cases for each class). Subsequently, 72 cycles recorded in 2019 were added, which 60 of them represents failure whereas 12 present success, making a total of 1446 data. The reason why the most recent data were not included previously has to do with the availability of these data at a late stage in this process, with the aim of incorporating more material for the validation of the model.

2.4.1. Artificial Neural Network.

A Multilayer Perceptron (MLP) was developed composed by an input layer, one hidden layer and an output layer. A MLP is used for classification and prediction and has a high predictive accuracy [29]. All the input variables were previously normalized between [−1,1] according to the minmax criterion, it was used the Bayesian regularization backpropagation algorithm was implemented with the hyperbolic tangent and logistic functions were the activation function of the input and hidden layers and the output layer, respectively. During the training of a neural network, the main goal is to generate a network that produces a low learning error and, mainly, that is capable of respond appropriately to the presentation of new data achieving a good generalization. Thus, the learning process was stopped by validation stopping, which means that the neural network stops the training as soon as the error on the validation set is higher than it was the last time it was checked, to avoid overfitting. It was also applied the holdout validation method and a number of cases (70%) of the entire dataset (n = 1446) were randomly assigned to a separate set called training and were used during the learning process, as the same way that 15% of the cases were randomly choose to validate and the remaining 15% to test the model. The mean squared error was considered as the performance function and all the outcome metrics in this learning process come from the arithmetic mean of 100 iterations due to the existence of randomness in them.
The study of this model was divided into three steps. First of all, 20 neurons were considered in the input and hidden layers and the variables that most correlate with the target variable (p-value < 0.05), without a Pearson’s correlation coefficient above 0.9 between themselves [30], to prevent increasing the complexity of the system and noise in the classification. Afterwards, the next variable that most correlated with the dependent variable was included while the performance of the network was assessed, applying a technique similar to the wrapped method of forward variable selection, but starting with the two most correlated variables [31]. This process was repeated until there were no more variables correlated to the target. The final input was obtained when the performance stopped increasing. After that, the number of input and hidden units was analyzed. At first, the same number of neurons was assayed for both layers. Then, a different number of units was also tested for each layer, setting a defined value for one layer and varying the number of neurons in the other. As the last step, the number of hidden layers was verified, but once again, the final network architecture was defined when the performance did not increase. In short, the process of arriving at the combination of parameter values which yielded the best solution consisted of adjusting each one in turn, re-training the network and comparing results. The neural network was constructed using Neural Pattern Recognition app, running on MATLAB® R2019b (MathWorks, Natick, MA, USA).

2.4.2. Decision Tree

The logical rules followed by a decision tree are much easier to interpret than the numeric weights of the connections between nodes in a neural network [32]. For that reason, a decision tree was developed with the goal to complement the neural network model. The Classification and Regression Trees (CART) algorithm was used for the predictive modelling [33]. CART is a binary tree [34] (i.e., each node has only two branches) with yes/no questions [35]. The same input variables used in the final artificial neural network model were assessed as well as the most commons metrics to evaluate the degree of inhomogeneity or impurity (i.e., Gini’s index, entropy [36] and twoing criterion). Regarding the partition of each node, an exhaustive research it was applied (i.e., the deepest tree was built). The evaluation criterion adopted to select the best attribute for each node was the twoing criterion [37]. To mitigate overfitting [38], the size of the tree was controlled, limiting the number of nodes from 10 to 25 and applying the pruning approach (once cost complexity was assured [33], individually or combining the two methods. Also, a cross-validation was performed (k-fold = 10). The decision tree was constructed using Classification Learner app, running on MATLAB® R2019b.

2.4.3. Model Evaluation

The predictive performance of the models were calculated on the basis of the results of the classification process [34]: (i) Area Under the Receiver Operating Characteristic curve (AUROC) and (ii) accuracy.

3. Results

1193 cycles were evaluated. Overall, 387 cycles ended up with at least one live birth (a success rate of 32.4%), while 7.8% were cancelled before egg pick up (n = 93), 0.92% did not have oocyte (n = 11), 1.7% did not have mature eggs (n = 20) and 4.2% had no embryos (n = 50). Baseline characteristics of couples are presented in Table 1 and Table 2. In a univariate comparison and concerning the continuous variables, there were statistical significant differences in the mean of woman’s and man’s age, woman’s height, total dose of gonadotropin, average daily dose of gonadotropin, number of eggs, number of mature eggs, number of embryos, AMH level and AFC. Table 1 shows that younger women and men were more likely to achieve a live birth, as well as women with a higher number of eggs, mature eggs, embryos, AMH level and AFC. Moreover, total dose of gonadotropins or average daily dose were inversely related with success. Regarding demographic factors in Table 2, the majority of women and men never smoked, were Caucasian and had no previous children. The male factor was the main cause of infertility while IVF was the most common adopted infertility treatment. Only woman’s previous children and nature of treatment were statistically significantly different. Table 3 shows the Pearson correlation between continuous attributes and the output variable.

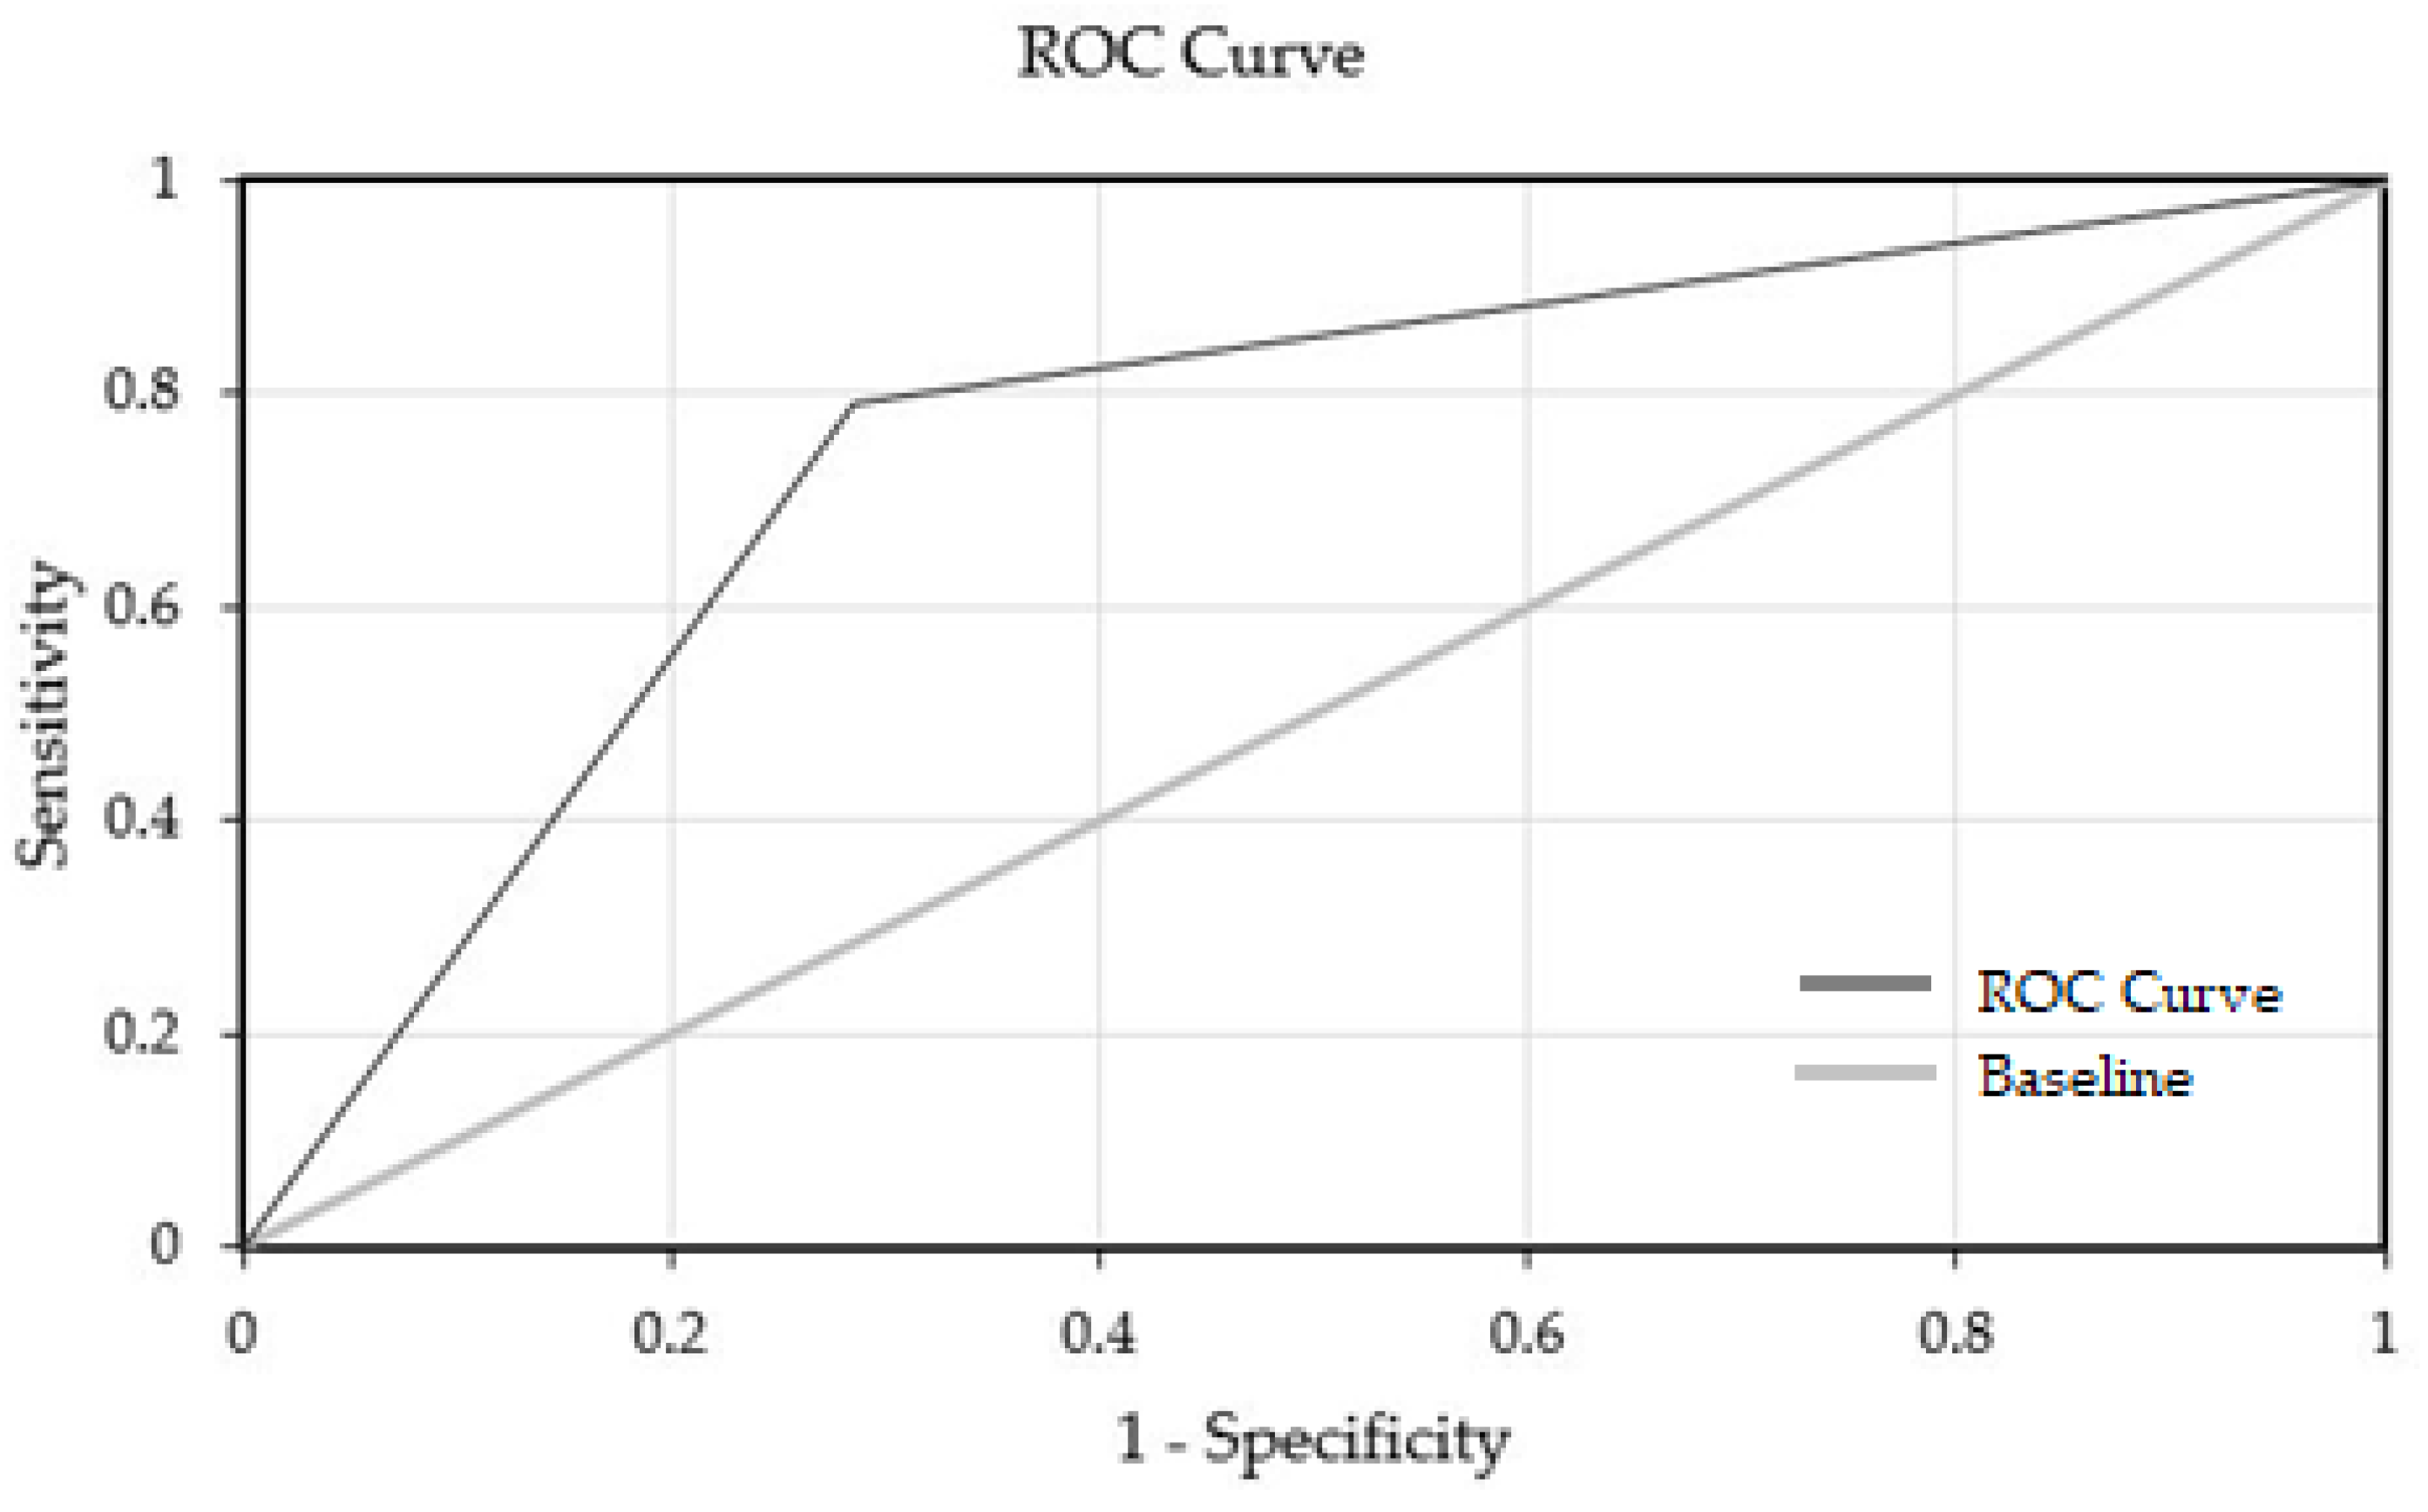
3.1. Artificial Neural Network
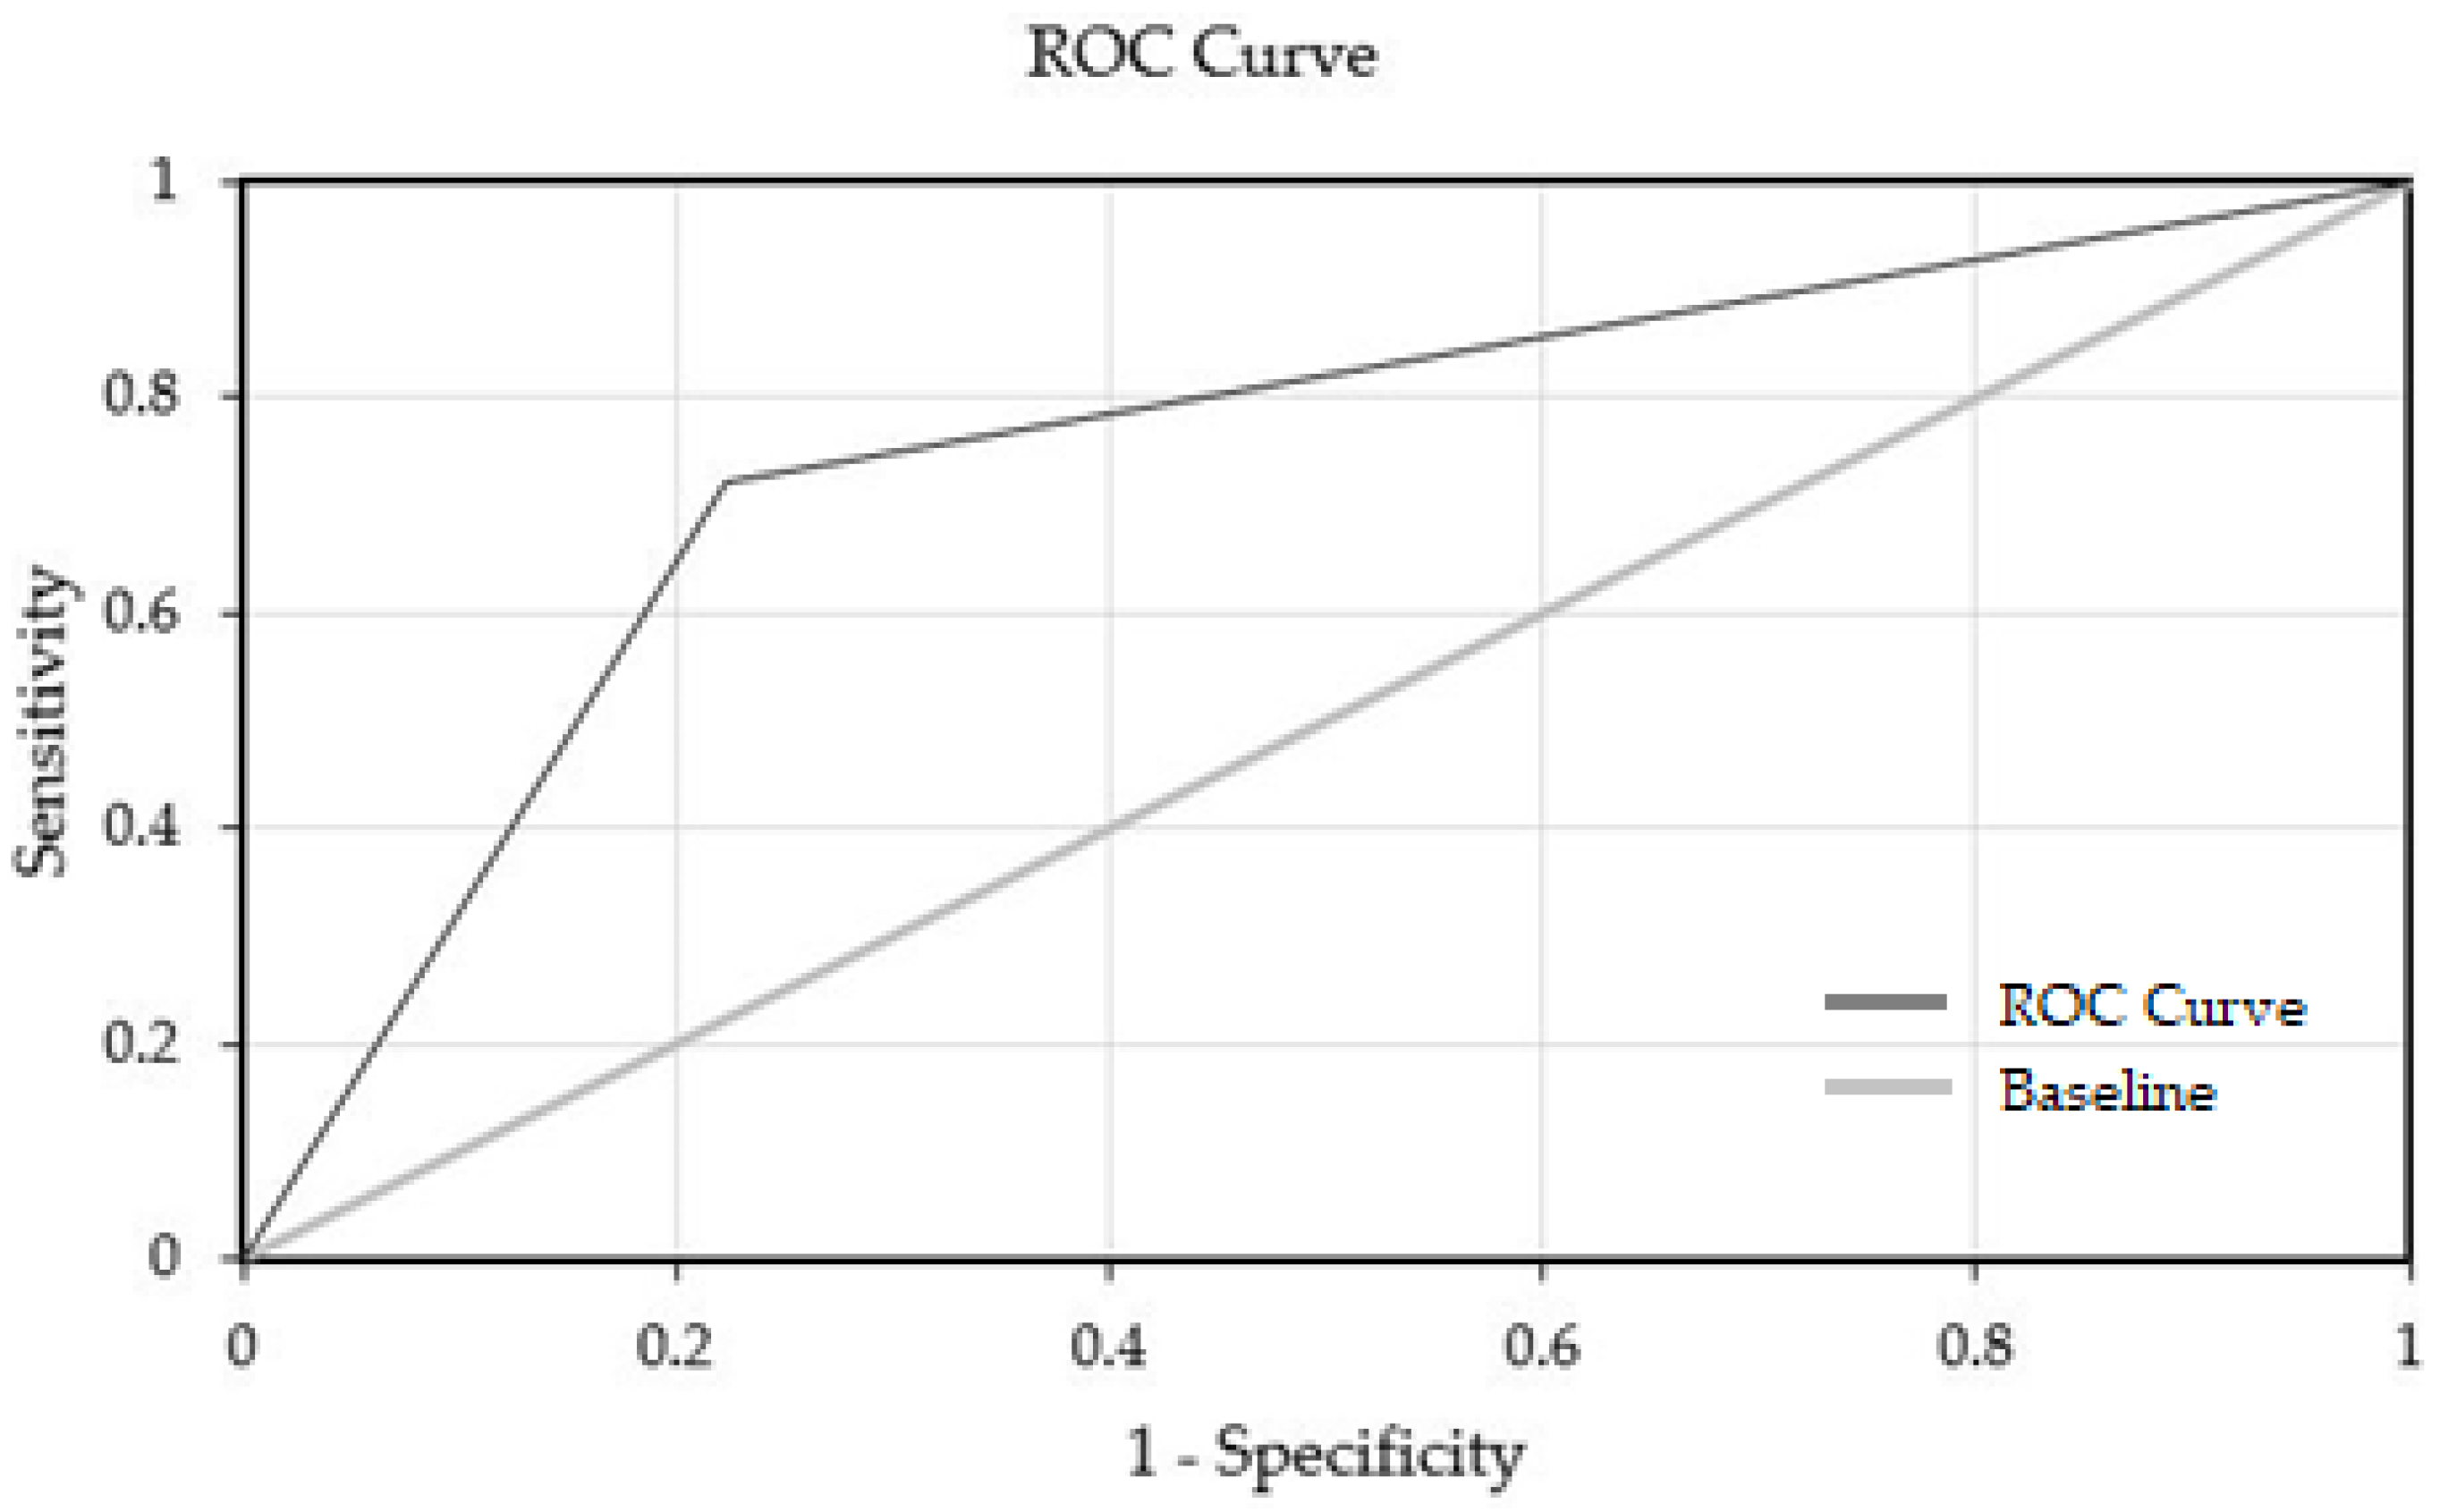
The implemented classification model was created based on the trial and error method (Figure 2), the following variables were used: woman’s age (years), total dose of gonadotropin (IU), number of eggs, number of embryos and AFC, which were all considered as statistically significant (p-value < 0.05). According to the predictions of the ANN model, the success of IVF/ICSI drops with the increase of woman’s age and total dose of gonadotropin and with the decrease of number of eggs, number of embryos and AFC. This model had an accuracy of 75.0% while the ROC curve test for discriminatory ability of the final prediction model had an AUROC equal to 75.2% (95% CI 72.5-77.5%) (Figure 3).

3.2. Decision Tree

Following the first approach to estimate the success rate to have a live birth, and since there are no easy explanations for the links between the weights and the input and output variables, a decision tree was built (Figure 4), which allows a simpler link between the input and output variables. Although the same five input variables of the ANN model were used, only three (i.e., woman’s age (years), total dose of gonadotropin (IU) and number of embryos) have shown to be important for the determination of the output variable. Table 4 lists the predictor importance of each variable. Overall, the accuracy was 75.0% while the AUROC was 74.9% (95% CI 72.3–77.5%) (Figure 5).

4. Discussion

Neural networks offer a different approach to pattern recognition and have been used in a wide range of fields [18], proving to be an effective diagnostic tool for many diseases or as an adjuvant to predict treatment outcomes [29]. The usefulness of artificial intelligence methods in analyzing data concerning reproductive medicine has also been advocated, giving a greater visibility to ANN, producing excellent results in predicting negative outcomes of infertility treatment, accurately confirming the lack of pregnancy in 86.5% of cases [39].
In 1997, Kaufmann et al. [18] constructed a neural network, achieving an accuracy of 59.0% while only using four inputs (three of them shared by this study, i.e., woman’s age, number of eggs and number of embryos, in turn the other variable accounts for the nature of the embryos, that is, whether they have been previously frozen. 16 years later, Durairaj and Thamilselvan [40] reported an accuracy of 73% using eight input variables including sperm concentration, woman’s BMI, infertility factor due to endometriosis and tubal factor, number of eggs, number of embryos and the nature of treatment (in particular, IVF treatment). In both cases, the variables number of eggs and number of embryos proved to be important in predicting a positive outcome. Hafiz et al. [41] and Leijdekkers et al. [42], also agreed on the importance of this two clinical variables.
Decision trees are also one of the most effective methods for data mining and they have been used in several disciplines, such as medical research. They can support diagnostic processes in cardiology [43], gastroenterology [44], general medicine [45], gynecology [46], neurology [47] or psychiatry [48].
In 2016, 3 decision trees were applied to select patients who were most likely to get pregnant trough their clinical information. The first one included information about woman’s age, number of eggs retrieved, number of embryos and its transfer, while the second and the third ones include woman’s age, number of eggs retrieved and woman’s age and number of embryos transferred, respectively [49]. According to Ghaeini et al. [50], a decision tree model composed with seven input variables (including the most common predictor variable, i.e., woman’s age) was implemented, reaching an accuracy of 70.3%. The significance of the variable AFC from the ANN and the decision tree models is in agreement with the publication by Dillon et al. [26]. In contrast, increasing the variable woman’s age, was associated with a decreased chance of at least one live birth. This is in agreement with other authors [6,20,24,51]. Before the present study, a decision tree was already constructed using only pre-treatment variables, namely AFC, woman’s age, disovulation as a female cause of infertility, AMH level and woman’s BMI. An accuracy of 59.3% was reached, as well as a discriminatory ability of the final prediction model of 59.6% [52].
From what is known so far, the ANN and the decision tree built are the first models to include total dose of gonadotropin.
The IVF/ICSI treatment predictors included here can be grouped into pre and post-treatment variables. In the ANN models from the 5 input variables considered, 2 were pre-treatment variables (i.e., woman’s age and AFC) and 3 were post-treatment specific attributes (i.e., total dose of gonadotropin, number of eggs and number of embryos). Compared to other studies (Table 5), the predictive ability of the two developed models seem to be better than what has previously been published. One of the main reasons is probably related to the expansion of the dataset comparing 1193 actual cycles to 455, 250, 251 and 737 patient’s data analyzed in the study of Kaufmann et al. [18], Durairaj and Thamilselvan [40], Ghaeini et al. [50] and Veiga et al. [52].
It was also shown that increasing the number of statistically significant pre and post-treatment variables do not improve the success prediction. In fact, the actual study achieved better results than previous ones even using fewer input values. From the 26 variables in the dataset, the Pearson correlation coefficient was calculated between each input variable and the output value (Table 3) and 10 statistically significant variables were found (p-value < 0.05). Yet, variables with coefficient r close to 0 were discarded because they correspond to an almost nonexistent correlation (i.e., woman’s height and man’s age) [53].
The Pearson correlation coefficient was also calculated for each pair of input variables, removing the variable number of mature eggs for having a strong correlation with the variables number of eggs and number of embryos (i.e., r = 0.945 and r = 0.917, respectively).
Therefore, seven variables (i.e., woman’s age, total dose of gonadotropin, average daily dose of gonadotropin, number of eggs, number of embryos, AMH level and AFC) were gathered as possible input variables for the ANN model. However, through the applied methodology during the study of the first model it was recognized that not all of these seven variables were necessary to integrate the input set, taking into account that the model’s performance did not increase. Then, the ANN model achieved the desirable results using the five variables already mentioned above.
Beyond these studies [18,40,50,52], McLernon [51] developed two models: one before treatment and one after the first embryo transfer attempt. While our study, with an AUROC around 75.0% in both prediction models, aids clinicians to shape couple’s expectations during that unique IVF/ICSI treatment and before the first embryo transfer, the accumulative aspect of McLernon’s models, with 72.0% of AUROC, will help physicians to communicate to couples their personalized chances of having a live birth over an entire package of IVF/ICSI treatment.
Taking into account that this study was performed with data from only one medical center, one limitation of these models is that only an internal validation was made. In the future, it is intended to perform an external validation, collecting new data from other fertility centers, to check if there is a geographical influence on chances of live birth for couples who need medical assistance. Nonetheless, there were no limitations on socioeconomic status since data was provided by a public hospital with universal access, and so we believe that these results can be generalized to any socioeconomic background. Moreover, the large temporal spectrum of the data (2012 to 2019) could mean that treatments made with older technology may have different results than those made with more recent ones. We believe that although our models achieved an accuracy of 75.0%, they should not be used to accept or refuse couples into treatment, but to be used in couples’ counseling and helping in the allocation of the resources of a center. In addition, this study can also be useful to compare results between infertility centers. That is, patients with similar characteristics should register similar outcomes. Otherwise, the models developed would serve to assess the quality of the laboratory in each center.

5. Conclusions

In conclusion, the aim of the current work was to model the success rate of IVF/ICSI treatment, supporting physicians in patient counselling in a daily basis and helping couples to understand their chances on having a live birth.
This paper showed that artificial neural network can be an effective tool for estimating the probability of success, while decision trees can clarify the previous model due to their easy understanding. As previously mentioned, the obtained results from the ANN learning process come from the arithmetic mean of 100 iterations for two reasons. The first because there are different initial values of synaptic weights and continuous components, and the second because the data is divided into three different subsets (i.e., each iteration the algorithm is trained, the choice of examples for training, validation and test are subsequently different).
Although the ANN model performed in a similar way to the decision tree method, both models are characterized by high performance values (75.0%), suggesting that the ANN and decision tree methods are capable of developing predictive queries in this knowledge area. Moreover, the variables that had an impact in both models were woman’s age, total dose of gonadotropin and number of embryos, though the ANN model considered two other variables (i.e., number of eggs and AFC), most likely because it is a more complex method.
The current investigation can be considered as a valid instrument in medical consultation, but nevertheless, it is emphasized that either the ANN or decision tree models should never replace a standardized diagnostic examination. Despite that, an external validation with data from other infertility centers will be necessary since this study was performed with data from a single source, resulting in constraints such as the date of sample collection and the technology applied in the IVF/ICSI treatments.

Author Contributions

Conceptualization, B.B.d.G., J.L.M., F.L.F. and J.M.F.; Data curation, J.L.M. and P.F.; Formal analysis, B.B.d.G.; Investigation, B.B.d.G.; Methodology, B.B.d.G. and L.M.; Project administration, J.M.F.; Supervision, J.L.M., F.L.F. and J.M.F.; Validation, B.B.d.G.; Writing—original draft, B.B.d.G.; Writing—review & editing, B.B.d.G., L.M., J.L.M., F.L.F. and J.M.F. All authors have read and agreed to the published version of the manuscript.

Funding

This work is funded in part by the Portuguese “Fundação para a Ciência e a Tecnologia” (FCT) in the context of the Centre of Technology and Systems CTS/UNINOVA/FCT/NOVA, reference UIDB/00066/2020.

Acknowledgments

The authors thank to Centro de Infertilidade e Reprodução Medicamente Assistida at Hospital Garcia de Orta, E.P.E for providing data for this research work.

Conflicts of Interest

The authors declare no conflict of interest. The funders had no role in the design of the study; in the collection, analyses, or interpretation of data; in the writing of the manuscript, or in the decision to publish the results.

Data Availability

The data that support the findings of this study are available on request to the co-author José Metello. The data cannot be made publicly available in accordance to paragraph d), number 2, article 9 of the regulation no. 2016/679 of the European Parliament and the Council of 27 April 2016 and due to the sensitive data containing information that could compromise the privacy of research patients.

References

  1. Gurunath, S.; Pandian, Z.; Anderson, R.A.; Bhattacharya, S. Defining infertility—A systematic review of prevalence studies. Hum. Reprod. Update 2011, 17, 575–588. [Google Scholar] [CrossRef] [PubMed] [Green Version]
  2. Donarelli, Z.; Lo Coco, G.; Gullo, S.; Marino, A.; Volpes, A.; Salerno, A.; Allegra, A. Infertility-related stress, anxiety and ovarian stimulation: Can couples be reassured about the effects of psychological factors on biological responses to assisted reproductive technology? Reprod. Biomed. Soc. Online 2016, 3, 16–23. [Google Scholar] [CrossRef] [PubMed] [Green Version]
  3. Boivin, J.; Bunting, L.; Collins, J.A.; Nygren, K.G. International estimates of infertility prevalence and treatment-seeking: Potential need and demand for infertility medical care. Hum. Reprod. 2007, 22, 1506–1512. [Google Scholar] [CrossRef] [PubMed] [Green Version]
  4. Katz, D.J.; Teloken, P.; Shoshany, O. Male infertility—The other side of the equation. Aust. Fam. Physician 2017, 46, 641–646. [Google Scholar] [PubMed]
  5. Cao, X.-W.; Lin, K.; Li, C.-Y.; Yuan, C.-W. A review of WHO Laboratory Manual for the Examination and Processing of Human Semen (5th edition). Zhonghua Nan Ke Xue 2011, 17, 1059–1063. [Google Scholar]
  6. Templeton, A.; Morris, J.K.; Parslow, W. Factors that affect outcome of in-vitro fertilisation treatment. Lancet 1996, 348, 1402–1406. [Google Scholar] [CrossRef]
  7. Andrade, L.G. Inteligência Artificial e Medicina: Haverá Lugar para o Factor Humano? Rev. Port. Farmacoter. 2018, 10, 53–55. [Google Scholar] [CrossRef] [Green Version]
  8. Bhardwaj, A.; Tiwari, A. Breast cancer diagnosis using Genetically Optimized Neural Network model. Expert Syst. Appl. 2015, 42, 4611–4620. [Google Scholar] [CrossRef]
  9. Spelt, L.; Nilsson, J.; Andersson, R.; Andersson, B. Artificial neural networks—A method for prediction of survival following liver resection for colorectal cancer metastases. Eur. J. Surg. Oncol. 2013, 39, 648–654. [Google Scholar] [CrossRef]
  10. Ansari, D.; Nilsson, J.; Andersson, R.; Regnér, S.; Tingstedt, B.; Andersson, B. Artificial neural networks predict survival from pancreatic cancer after radical surgery. Am. J. Surg. 2013, 205, 1–7. [Google Scholar] [CrossRef]
  11. Patel, V.L.; Shortliffe, E.H.; Stefanelli, M.; Szolovits, P.; Berthold, M.R.; Bellazzi, R.; Abu-Hanna, A. The coming of age of artificial intelligence in medicine. Artif. Intell. Med. 2009, 46, 5–17. [Google Scholar] [CrossRef] [PubMed] [Green Version]
  12. Ghavami, P.; Kapur, K. Artificial neural network-enabled prognostics for patient health management. In Proceedings of the IEEE Conference on Prognostics and Health Management, Denver, CO, USA, 12–21 June 2012; pp. 1–8. [Google Scholar] [CrossRef]
  13. Massaro, A.; Maritati, V.; Giannone, D.; Convertini, D.; Galiano, A. LSTM DSS Automatism and Dataset Optimization for Diabetes Prediction. Appl. Sci. 2019, 9, 3532. [Google Scholar] [CrossRef] [Green Version]
  14. Kaji, D.A.; Zech, J.R.; Kim, J.S.; Cho, S.K.; Dangayach, N.S.; Costa, A.B.; Oermann, E.K. An attention based deep learning model of clinical events in the intensive care unit. PLoS ONE 2019, 14, e0211057. [Google Scholar] [CrossRef] [PubMed] [Green Version]
  15. Pham, T.; Tran, T.; Phung, D.; Venkatesh, S. Predicting healthcare trajectories from medical records: A deep learning approach. J. Biomed. Inform. 2017, 69, 218–229. [Google Scholar] [CrossRef]
  16. Lobo, L.C. Inteligência Artificial e Medicina. Rev. Bras. Educ. Med. 2017, 41, 185–193. [Google Scholar] [CrossRef] [Green Version]
  17. Siristatidis, C.; Vogiatzi, P.; Pouliakis, A.; Trivella, M.; Papantoniou, N.; Bettocchi, S. Predicting IVF Outcome: A Proposed Web-based System Using Artificial Intelligence. In Vivo 2016, 30, 507–512. [Google Scholar]
  18. Kaufmann, S.J.; Eastaugh, J.L.; Snowden, S.; Smye, S.W.; Sharma, V. The application of neural networks in predicting the outcome of in- vitro fertilization. Hum. Reprod. 1997, 12, 1454–1457. [Google Scholar] [CrossRef] [Green Version]
  19. Morales, D.A.; Bengoetxea, E.; Larrañaga, P.; García, M.; Franco, Y.; Fresnada, M.; Merino, M. Bayesian classification for the selection of in vitro human embryos using morphological and clinical data. Comput. Methods Programs Biomed. 2008, 90, 104–116. [Google Scholar] [CrossRef]
  20. Nelson, S.M.; Lawlor, D.A. Predicting live birth, preterm delivery, and low birth weight in infants born from in vitro fertilisation: A prospective study of 144,018 treatment cycles. PLoS Med. 2011, 8, e1000386. [Google Scholar] [CrossRef]
  21. Steuerwald, N.M.; Bermúdez, M.G.; Wells, D.; Munné, S.; Cohen, J. Maternal age-related differential global expression profiles observed in human oocytes. Reprod. Biomed. Online 2007, 14, 700–708. [Google Scholar] [CrossRef]
  22. La Marca, A.; Nelson, S.M.; Sighinolfi, G.; Manno, M.; Baraldi, E.; Roli, L.; Xella, S.; Marsella, T.; Tagliasacchi, D.; D’Amico, R.; et al. Anti-Müllerian hormone-based prediction model for a live birth in assisted reproduction. Reprod. Biomed. Online 2011, 22, 341–349. [Google Scholar] [CrossRef] [PubMed] [Green Version]
  23. Hajshafiha, M.; Ghareaghaji, R.; Salemi, S.; Sadegh-Asadi, N.; Sadeghi-Bazargani, H. Association of body mass index with some fertility markers among male partners of infertile couples. Int. J. Gen. Med. 2013, 6, 447–451. [Google Scholar] [CrossRef] [PubMed] [Green Version]
  24. Qiu, J.; Li, P.; Dong, M.; Xin, X.; Tan, J. Personalized prediction of live birth prior to the first in vitro fertilization treatment: A machine learning method. J. Transl. Med. 2019, 17, 317. [Google Scholar] [CrossRef] [PubMed]
  25. Dhillon, R.K.; Smith, P.P.; Malhas, R.; Harb, H.M.; Gallos, I.D.; Dowell, K.; Fishel, S.; Deeks, J.J.; Coomarasamy, A. Investigating the effect of ethnicity on IVF outcome. Reprod. Biomed. Online 2015, 31, 356–363. [Google Scholar] [CrossRef] [PubMed] [Green Version]
  26. Dhillon, R.K.; McLernon, D.J.; Smith, P.P.; Fishel, S.; Dowell, K.; Deeks, J.J.; Bhattacharya, S.; Coomarasamy, A. Predicting the chance of live birth for women undergoing IVF: A novel pretreatment counselling tool. Hum. Reprod. 2016, 31, 84–92. [Google Scholar] [CrossRef] [PubMed] [Green Version]
  27. Goryński, K.; Safian, I.; Gradzki, W.; Marszall, M.P.; Krysiński, J.; Goryński, S.; Bitner, A.; Romaszko, J.; Buciński, A. Artificial neural networks approach to early lung cancer detection. Open Med. 2014, 9, 632–641. [Google Scholar] [CrossRef]
  28. Batista, G.E.A.P.A.; Prati, R.C.; Monard, M.C. A study of the behavior of several methods for balancing machine learning training data. ACM SIGKDD Explor. Newsl. 2004, 6, 20–29. [Google Scholar] [CrossRef]
  29. Badura, A.; Marzec-Wróblewska, U.; Kamiński, P.; Łakota, P.; Ludwikowski, G.; Szymański, M.; Wasilow, K.; Lorenc, A.; Buciński, A. Prediction of semen quality using artificial neural network. J. Appl. Biomed. 2019, 17, 167–174. [Google Scholar] [CrossRef] [Green Version]
  30. Tabachnick, B.G.; Fidell, L.S. Using Multivariate Statistics, 6th ed.; Pearson Education, Inc.: Upper Saddle River, NJ, USA, 2013; pp. 1–983. [Google Scholar]
  31. Yang, P.; Liu, W.; Zhou, B.B.; Chawla, S.; Zomaya, A.Y. Ensemble-Based Wrapper Methods for Feature Selection and Class Imbalance Learning. Lect. Notes Comput. Sci. 2013, 7818, 544–555. [Google Scholar] [CrossRef]
  32. Kotsiantis, S.B. Decision trees: A recent overview. Artif. Intell. Rev. 2013, 39, 261–283. [Google Scholar] [CrossRef]
  33. Gordon, A.D.; Breiman, L.; Friedman, J.H.; Olshen, R.A.; Stone, C.J. Classification and Regression Trees. Biometrics 1984, 40, 874. [Google Scholar] [CrossRef] [Green Version]
  34. Han, J.; Kamber, M.; Pei, J. Data Mining Concepts and Techniques, 3rd ed.; Elsevier Inc.: Waltham, MA, USA, 2012; pp. 1–632. [Google Scholar]
  35. Timofeev, R. Classification and Regression Trees (CART) Theory and Applications. Master’s Thesis, Humboldt University, Berlin, Germany, 20 December 2004. [Google Scholar]
  36. Kingsford, C.; Salzberg, S.L. What are decision trees? Nat. Biotechnol. 2008, 26, 1011–1013. [Google Scholar] [CrossRef] [PubMed]
  37. Garcia, S.C. O Uso da Árvore de Decisão na Descoberta de Conhecimento na Área da Saúde. Master’s Thesis, Universidade Federal do Rio Grande do Sul, Porto Alegre, Brazil, 2003. [Google Scholar]
  38. Yan-ya, S.O.N.G.; Ying, L.U. Decision tree methods: Applications for classification and prediction. Shanghai Arch. Psychiatry 2015, 27, 130–135. [Google Scholar] [CrossRef]
  39. Milewski, R.; Jamiołkowski, J.; Anna, J.M.; Domitrz, J.; Szamatowicz, J.; Wołczyński, S. Prognosis of the IVF ICSI/ET Procedure Efficiency With the Use of Artificial Neural Networks among Patients of the Department of Reproduction and Gynecological Endocrinology. Ginekol. Pol. 2009, 80, 900–906. [Google Scholar]
  40. Durairaj, M.; Thamilselvan, P. Applications of Artificial Neural Network for IVF Data Analysis and Prediction. J. Eng. Comput. Appl. Sci. 2013, 2, 11–15. [Google Scholar]
  41. Hafiz, P.; Nematollahi, M.; Boostani, R.; Jahromi, B.N. Predicting Implantation Outcome of In Vitro Fertilization and Intracytoplasmic Sperm Injection Using Data Mining Techniques. Int. J. Fertil. Steril. 2017, 11, 184–190. [Google Scholar] [CrossRef]
  42. Leijdekkers, J.A.; Eijkemans, M.J.C.; van Tilborg, T.C.; Oudshoorn, S.C.; McLernon, D.J.; Bhattacharya, S.; Mol, B.W.J.; Broekmans, F.J.M.; Torrance, H.L.; OPTIMIST Group. Predicting the cumulative chance of live birth over multiple complete cycles of in vitro fertilization: An external validation study. Hum. Reprod. 2018, 33, 1684–1695. [Google Scholar] [CrossRef] [Green Version]
  43. Negassa, A.; Monrad, E.S.; Bang, J.Y.; Srinivas, V.S. Tree-structured risk stratification of in-hospital mortality after percutaneous coronary intervention for acute myocardial infarction: A report from the New York State percutaneous coronary intervention database. Am. Heart J. 2007, 154, 322–329. [Google Scholar] [CrossRef] [PubMed] [Green Version]
  44. Judmaier, G.; Meyersbach, P.; Weiss, G.; Wachter, H.; Reibnegger, G. The role of neopterin in assessing disease activity in Crohn’s disease: Classification and regression trees. Am. J. Gastroenterol. 1993, 88, 706–711. [Google Scholar]
  45. Mello, F.C.Q.; Bastos, L.G.V.; Soares, S.L.M.; Rezende, V.M.C.; Conde, M.B.; Chaisson, R.E.; Kritski, A.L.; Ruffino-Neto, A.; Werneck, G.L. Predicting smear negative pulmonary tuberculosis with classification trees and logistic regression: A cross-sectional study. BMC Public Health 2006, 6, 43. [Google Scholar] [CrossRef] [PubMed] [Green Version]
  46. Pouliakis, A.; Karakitsou, E.; Chrelias, C.; Pappas, A.; Panayiotides, I.; Valasoulis, G.; Kyrgiou, M.; Paraskevaidis, E.; Karakitsos, P. The Application of Classification and Regression Trees for the Triage of Women for Referral to Colposcopy and the Estimation of Risk for Cervical Intraepithelial Neoplasia: A Study Based on 1625 Cases with Incomplete Data from Molecular Tests. Biomed Res. Int. 2015, 2015, 1–10. [Google Scholar] [CrossRef] [PubMed]
  47. Takahashi, O.; Cook, E.F.; Nakamura, T.; Saito, J.; Ikawa, F.; Fukui, T. Risk stratification for in-hospital mortality in spontaneous intracerebral haemorrhage: A Classification and Regression Tree Analysis. QJM 2006, 99, 743–750. [Google Scholar] [CrossRef] [PubMed] [Green Version]
  48. McKenzie, D.P.; McGorry, P.D.; Wallace, C.S.; Low, L.H.; Copolov, D.L.; Singh, B.S. Constructing a minimal diagnostic decision tree. Methods Inf. Med. 1993, 32, 161–166. [Google Scholar] [PubMed]
  49. Milewska, A.J.; Jankowska, D.; Cwalina, U.; Citko, D.; Wiesak, T.; Acacio, B.; Milewski, R. Prediction of Infertility Treatment Outcomes Using Classification Tree. Stud. Log. Gramm. Rhetor. 2016, 47, 7–19. [Google Scholar] [CrossRef]
  50. Ghaeini, M.K.; Amin-Naseri, M.R.; Aghahoseini, M. Prediction of Clinical Pregnancy Occurrence after ICSI using Decision Tree and Support Vector Machine Methods. J. Obstet. Gynecol. Cancer Res. 2018, 3, 12–18. [Google Scholar] [CrossRef] [Green Version]
  51. McLernon, D.J.; Steyerberg, E.W.; te Velde, E.R.; Lee, A.J.; Bhattacharya, S. Predicting the chances of a live birth after one or more complete cycles of in vitro fertilisation: Population based study of linked cycle data from 113 873 women. BMJ 2016, 355, i5735. [Google Scholar] [CrossRef] [PubMed] [Green Version]
  52. Veiga, B.E.; Ferreira, F.; Metello, J.L.; Fonseca, J.M. Predicting the Chances of Live Birth for Couples Undergoing In Vitro Treatments Using Decision Trees. In Proceedings of the HEALTHINFO 2019: The Fourth International Conference on Informatics and Assistive Technologies for Health-Care, Medical Support and Well Being, Valencia, Spain, 24–28 November 2019; pp. 14–19. [Google Scholar]
  53. Hinkle, D.E.; Wiersma, W.; Jurs, S.G. Applied Statistics for the Behavioral Sciences, 5th ed.; Houghton Mifflin: Boston, MA, USA, 2003; pp. 1–756. [Google Scholar]
Figure 1. Research methodology.
Reprodmed 01 00014 g001
Figure 2. Architecture of the artificial neural network model.
Reprodmed 01 00014 g002
Figure 3. Receiver Operating Characteristic (ROC) curve of the Artificial Neural Network (ANN) model.
Reprodmed 01 00014 g003
Figure 4. Decision tree obtained to predict live birth for a couple undergoing an IVF/ICSI treatment. The green and orange leaves correspond to “with live birth” and “without live birth” outcomes, respectively. The probabilities of success and failure are recorded in each leaf.
Reprodmed 01 00014 g004
Figure 5. ROC curve of the decision tree model.
Reprodmed 01 00014 g005
Table 1. Baseline continuous characteristics of couples.
Continuous AttributeAll Couples (n = 1193)Couples with Live Birth (n = 387)Couples without Live Birth (n = 806)t-Test p-Value
x ¯ ± σ x ¯ ± σ x ¯ ± σ
Duration of Infertility (months)58.72 ± 29.6056.40 ± 29.2459.83 ± 29.710.060
Woman’s age (years)34.34 ± 3.6633.36 ± 3.7234.81 ± 3.54<0.000
Woman’s weight (kg)64.68 ± 12.5464.26 ± 12.1564.88 ± 12.720.416
Woman’s height (cm)162.97 ± 6.12163.51 ± 6.05162.71 ± 6.130.034
Woman’s BMI (kg/m2)24.35 ± 4.5124.01 ± 4.1624.51 ± 4.660.060
Man’s age (years)36.58 ± 5.2135.93 ± 4.9036.89 ± 5.33<0.000
Man’s weight (kg)81.71 ± 13.6181.32 ± 13.9981.89 ± 13.420.503
Man’s height (cm)176.15 ± 6.78176.57 ± 6.92175.95 ± 6.700.144
Man’s BMI (kg/m2)26.29 ± 3.8526.03 ± 3.8426.42 ± 3.850.099
AMH level (ng/mL)3.22 ± 3.433.98 ± 3.592.86 ± 3.29<0.000
AFC14.60 ± 9.4417.19 ± 9.3713.35 ± 9.22<0.000
Number of attempts in the center1.25 ± 0.671.28 ± 0.531.24 ± 0.730.203
Total dose of gonadotropin (IU)2478 ± 9562218 ± 8462603 ± 981<0.000
Days of stimulation10.38 ± 2.2510.36 ± 2.039.35 ± 2.350.789
Average daily dose of gonadotropin (IU/day)236.4 ± 73.1213.1 ± 66.8247.6 ± 73.4<0.000
Number of eggs9.61 ± 7.1713.07 ± 7.737.95 ± 6.23<0.000
Number of mature eggs7.79 ± 6.1510.96 ± 6.686.27 ± 5.24<0.000
Number of embryos5.42 ± 4.758.12 ± 5.244.12 ± 3.88<0.000
x ¯ : mean; σ : standard deviation. The attributes with a p-value < 0.05 are in bold.
Table 2. Baseline categorical characteristics of couples.
Categorical AttributeAll Couples
(n = 1193)
Couples with Live Birth
(n = 387)
Couples without Live Birth
(n = 806)
χ2 Statistic p-Value
n (%)n (%)n (%)
Woman’s Smoking StatusPrevious196 (16.4)66 (17.1)130 (16.1)0.421
Never676 (56.7)209 (54.0)467 (57.9)
Present321 (26.9)112 (28.9)209 (25.9)
Man’s smoking statusPrevious211 (17.7)66 (17.1)145 (18.0)0.681
Never571 (47.9)181 (46.8)390 (48.4)
Present411 (34.5)140 (36.2)271 (33.6)
Woman’s ethnicityAsian9 (0.8)2 (0.5)7 (0.9)0.560
Caucasian1071 (89.8)346 (89.4)725 (90.0)
Gipsy15 (1.3)7 (1.8)8 (1.0)
Indian8 (0.7)3 (0.8)5 (0.6)
Mixture43 (3.6)17 (4.4)26 (3.2)
African47 (3.9)12 (3.1)35 (4.3)
Man’s ethnicityAsian6 (0.5)1 (0.3)5 (0.6)0.088
Caucasian1101 (92.3)347 (89.7)754 (93.5)
Gipsy16 (1.3)8 (2.1)8 (1.0)
Indian10 (0.8)4 (1.0)6 (0.7)
Mixture26 (2.2)14 (3.6)12 (1.5)
African34 (2.8)13 (3.4)21 (2.6)
Cause of infertilityEndometriosis120 (10.1)32 (8.3)88 (10.9)0.315
Male factor368 (30.8)134 (34.6)234 (29.0)
Both male and female factor112 (9.4)29 (7.5)83 (10.3)
Unexplained infertility275 (23.1)89 (23.0)186 (23.1)
Multiple female factors39 (3.3)9 (2.3)30 (3.7)
Other8 (0.7)2 (0.5)6 (0.7)
Cause of infertilityOvulatory factor93 (7.8)32 (8.3)61 (7.6)0.315
Tubal factor175 (14.7)60 (15.5)115 (14.3)
Uterine factor3 (0.3)0 (0.0)3 (0.4)
Woman’s with previous childrenYes122 (10.2)36 (9.3)86 (10.7)0.032
No1071 (89.8)351 (90.7)720 (89.3)
Man’s with previous childrenYes137 (11.5)47 (12.1)90 (11.2)0.620
No1056 (88.5)340 (87.9)716 (88.8)
Nature of treatmentIVF629 (52.7)208 (53.7)421 (52.2)<0.000
ICSI542 (45.4)164 (42.4)378 (46.9)
Mixed IVF/ICSI22 (1.8)15 (3.9)7 (0.9)
The data are presented as the number (n) and percentage (%) of patients. The attributes with a p-value < 0.05 are in bold.
Table 3. Relationships between continuous attributes and the output variable through Pearson correlation.
Continuous AttributeCoefficient rp-ValueContinuous AttributeCoefficient rp-Value
Duration of infertility−0.0470.120Total dose of gonadotropin−0.183<0.000
Woman’s age−0.184<0.000Days of stimulation−0.0060.848
Woman’s weight−0.0170.570Average daily dose of gonadotropin−0.217<0.000
Woman’s height0.0670.026Number of attempts in the center0.0370.211
Woman’s BMI−0.0470.114Number of eggs0.347<0.000
Man’s age−0.0900.003Number of mature eggs0.370<0.000
Man’s weight−0.0230.441Number of embryos0.401<0.000
Man’s height0.0370.217AMH level0.156<0.000
Man’s BMI−0.0480.109AFC0.198<0.000
The attributes with a p-value < 0.05 are in bold.
Table 4. Relative importance of the input variables.
VariableRelative Importance (%)
Number of embryos100.00
Woman’s age13.26
Total dose of gonadotropin1.07
Table 5. Accuracy comparison researches.
Artificial Neural Network
Kaufmann et al. [18]59.0%
Durairaj and Thamilselvan [40]73.0%
Actual study75.0%
Decision Tree
Ghaeini et al. [50]70.3%
Veiga et al. [52]59.3%
Actual study75.0%
Publisher’s Note: MDPI stays neutral with regard to jurisdictional claims in published maps and institutional affiliations.

